

Abstract
The origin of new genes has long been a central interest of evolutionary biologists. However, their novelty means that they evade reconstruction by the classical tools of evolutionary modelling. This evasion of deep ancestral investigation necessitates intensive study of model species within well‐sampled, recently diversified, clades. One such clade is the model genus Neurospora, members of which lack recent gene duplications. Several Neurospora species are comprehensively characterized organisms apt for studying the evolution of lineage‐specific genes (LSGs). Using gene synteny, we documented that 78% of Neurospora LSG clusters are located adjacent to the telomeres featuring extensive tracts of non‐coding DNA and duplicated genes. Here, we report several instances of LSGs that are likely from regional rearrangements and potentially from gene rebirth. To broadly investigate the functions of LSGs, we assembled transcriptomics data from 68 experimental data points and identified co‐regulatory modules using Weighted Gene Correlation Network Analysis, revealing that LSGs are widely but peripherally involved in known regulatory machinery for diverse functions. The ancestral status of the LSG mas‐1, a gene with roles in cell‐wall integrity and cellular sensitivity to antifungal toxins, was investigated in detail alongside its genomic neighbours, indicating that it arose from an ancient lysophospholipase precursor that is ubiquitous in lineages of the Sordariomycetes. Our discoveries illuminate a “rummage region” in the N. crassa genome that enables the formation of new genes and functions to arise via gene duplication and relocation, followed by fast mutation and recombination facilitated by sequence repeats and unconstrained non‐coding sequences.
Keywords: chromosomal rearrangement, de novo origination, fungi, genomics, molecular evolution, orphan gene
1. INTRODUCTION
Since the emergence of life, novel features have evolved in a diversity of organisms. Evolutionary biologists have striven to explain the evolution of novelty, often via molecular approaches focused on the contributions of new genes and novel gene functions. The consensus opinion regarding the typical mechanism of appearance of new genes includes chromosomal and genomic rearrangements, with existing genes and/or noncoding genome sequences as the source material (Tautz & Domazet‐Lošo, 2011; Toll‐Riera et al., 2009; Wissler et al., 2013). Standing in acknowledged and unaccounted‐for opposition to this consensus is the fact that genomes frequently feature numerous novel genes that have no homologues in any distantly related or closely related lineages (Begun et al., 2006, 2007; Ruiz‐Orera et al., 2015; Weisman et al., 2020). Because their origins cannot be tracked to ancestral lineages, these genes have been referred to as orphan genes, or more generically, lineage‐specific genes (LSGs).
Reconstructing the evolutionary history of LSGs is crucial to achieving an understanding not only of their formation but also of how these novel genes are integrated into pre‐existing functions (McLysaght & Hurst, 2016). LSGs occur in such diversity and frequency that they represent nearly one‐third of the genes in all genomes, including phages, archaea, bacteria, and eukaryotic organisms (Tautz & Domazet‐Lošo, 2011). Some LSGs likely resulted from rapid divergence after gene duplication and rearrangement: 55%–73% of the LSGs in yeasts can be explained by divergence (Weisman et al., 2020). Some de novo protein‐coding genes might have directly evolved from non‐coding regions in the genomes, for which there is evidence in humans (Ruiz‐Orera et al., 2015), fruit flies (Begun et al., 2006, 2007) and rice (Zhang, Ren, et al., 2019). However, even in closely related lineages it can be difficult to distinguish LSGs from non‐LSGs when tracking of homologues is challenging (Chen et al., 2020). Without substantial sequence similarity, access to evolutionary history can be lost.
A recent study suggested that if the neighbours of a gene are in a conserved order in other species, then the gene is likely to correspond to whatever is at the orthologous position in the other species as well—even if the sequences do not match (Vakirlis et al., 2020). Such correspondences imply that the evolutionary history of LSGs could be revealed by meticulous analyses of synteny among local gene clusters. Indeed, the subtelomeres and telomeres in fungal genomes have been reported to be enriched for LSGs (Brown et al., 2010; Dewing et al., 2022; Lofgren et al., 2022; McDonagh et al., 2008; Rahnama et al., 2021). These regions have been associated with high sequence diversity and transposons in a few fungal models, including genomic islands identified in Aspergillus species and pathogenicity chromosomes found in Fusarium species (Fedorova et al., 2008; Rep & Kistler, 2010; Zhang et al., 2020). These fast‐evolving regions of filamentous fungal pathogens have been referred to as components of a “two‐speed” genome, or, more recently and perhaps more adroitly, a two‐ or multi‐compartment genome (Dong et al., 2015; Frantzeskakis et al., 2019). This conception characterizes core genes for general physiology as evolving comparatively slower than chromosomal regions harbouring effector genes mediating interactions with hosts. This slower evolution is not necessarily attributed to the increased frequency of mutational events but has been attributed at least partly to greater purifying selection. However, studies compartmentalizing the genome have mainly focused on specific accessory chromosomes of pathogenic fungi. How sequence and structural variations at different scales of chromosome structure have generally shaped the evolution of new genes and new gene functions has yet to be deciphered.
The filamentous fungal species in the genus Neurospora have served as classic genetic models, are capable of fast asexual growth and reproduction on simple nutrients, and constitute a powerful system for the study of gene evolution associated with speciation (Galagan et al., 2003; Wang et al., 2018). However, due to the repeat‐induced point mutation (RIP) genome‐defence system, Neurospora is known to lack recent gene duplications—a major source of evolutionary novelty (Galagan & Selker, 2004; Gladyshev, 2017). RIP is a pre‐meiotic process during sexual development that can induce G→C to A→T mutations and cytosine methylation in newly duplicated sequences that share homology of 155–802 base pairs (Gladyshev, 2017; Gladyshev & Kleckner, 2014; Gunter, 2003). By parent‐offspring whole‐genome sequencing, RIP was reported as the reason for the highest known mutation rate in N. crassa (Wang et al., 2020), and consistent with previous studies, a recent study applying a 500‐bp sliding window search for RIP‐associated patterns throughout the genome of N. crassa reported low amounts of RIP near the subtelomeric and telomeric regions (van Wyk et al., 2019). Nonetheless, a total of 670 Neurospora LSGs were identified in the genome of N. crassa based on a previous phylostratigraphic analysis using representative prokaryotic and eukaryotic genomes and inclusive BLAST searches against available fungal genomes at NCBI and FungiDB (Kasuga et al., 2009; Wang et al., 2022). Many of these LSGs were aggregated adjacent to the telomeres, chromosomal regions which are understudied (Casas‐Vila et al., 2015; Wang et al., 2022), raising significant interest about how these genes evolved and why they were distributed in such a manner. Some of these 670 LSGs are shared with the genomes of N. discreta (181 shared) and N. tetrasperma (405 shared).
Complementing the orthogonal findings of Wang et al. (2022), we manually examined these LSGs for their sequence and synteny conservation to assess associations among chromosomal rearrangements—structural changes in the arrangement or organization of a chromosome's genetic material, including deletion, duplication, inversion, translocation, fusion, or fission (Rieseberg, 2001), and the origins of LSGs with de novo gene functions. We identified deletion, duplication, and inversions of chromosomal regions, including non‐coding and repetitive regions, to establish how they are associated with the evolution of LSGs. Moreover, to assess possible ecological and biological roles of many LSGs for which functions have not yet been annotated (van Wyk et al., 2019), we examined how these properties of the chromosomes relate to LSG expression. To identify LSGs that are suitable for detailed evolutionary analysis, we manually analysed conservation of sequence and synteny. To determine possible origins for selected LSGs, we reconstructed putative gene phylogenies using manually annotated non‐coding sequences and annotated functional genes to identify possible origins of non‐coding sequences from pseudogenes. By analysing LSG expression and LSG knockout phenotypes, we assessed their possible functions. Lastly, to investigate how the novel functions of LSGs are integrated into existing organismal systems, we reconstructed genome‐wide regulatory networks. Together, our analyses revealed mechanisms and processes underlying the evolution of these LSGs that involve chromosomal rearrangement, gene duplication and loss, and origination from non‐coding sequences.
2. MATERIALS AND METHODS
2.1. Inference of evolutionary history and possible origins for the LSGs
Wang et al. (2022) identified 670 LSGs. A phylostratigraphic analysis that was performed on representative taxa for major fungal lineages and several non‐fungal reference genomes was supplemented by further reciprocal‐BLAST searches against available Sordariomycetes genomes, including genomes at the National Center for Biotechnology (NCBI) for the species in Podospora, Pyricularia, and Ophiostoma, all of which are fairly closely related to Neurospora. To track the evolutionary histories of LSGs that are often fast‐evolving, short protein sequences, some of which have been subject to diverse and even multiple processes of duplication and relocation by chromosomal rearrangement, we manually examined gene chromosomal location and direction, locations of repeats, sequences within long non‐coding regions (over 5 kbp), evidence for gene duplication and loss, local synteny in LSGs and their neighbour genes, as well as knockout phenotypes, along with their expression profiles. Namely, we examined possible short and long repeats in all 670 LSGs originally identified in Wang et al. (2022) and looked for long non‐coding regions and examined synteny for identified LSG clusters. Analyses of rearrangements within the LSG clusters among species were conducted with the aid of synteny visualization at the FungiDB (FungiDB.org). To fully capture any gene duplication events in this study, we examined genomes of both mating types, which exhibit substantial differences in their gene content and gene sequence, including LSGs (Baker et al., 2015; Wang et al., 2022). Gene names or numbers follow the genome annotation for N. crassa FGSC2489, mating type A (version 12, release 48); N. crassa FGSC4200, mating type a (version 2, release 2); N. discreta FGSC8579, mating type A (version 1, release 2.3); and pseudohomothallic N. tetrasperma FGSC2508, mat A genome (version 2, release 29). Pairwise comparisons of sequence similarity among certain long imperfect repeats were applied using the EMBL‐EBI online service (Madeira et al., 2022).
To provide insight into possible functions for LSGs, we analysed an extensive collection of published transcriptomics data. Unless otherwise noted, these data were all collected from cultures of one commonly studied mating‐type A N. crassa strain (FGSC2489). Network modules were identified using Weighted Gene Correlation Network Analysis (WGCNA 1.7; Langfelder & Horvath, 2008). The following public databases were also searched for sequence, annotation, synteny, phenotype and relevant information for this study: the National Center for Biotechnology Information (NCBI, www.ncbi.nlm.nih.gov), OrthoDB (www.orthodb.org), and DOE Joint Genome Institute MycoCosm (JGI, mycocosm.jgi.doe.gov).
2.2. Detection of chromosomal rearrangement and repeated sequences
We examined possible short and long repeats in all 670 LSGs originally identified in Wang et al. (2022). We then looked for long non‐coding regions and examined synteny for 56 groups of identified LSG clusters, some groups with multiple LSG clusters, and nearby non‐LSGs in the latest annotation of the three Neurospora genomes at the FungiDB to identify chromosomal rearrangement events. As in Wang et al. (2022), LSGs clusters were identified using Cluster Locator (Pazos Obregón et al., 2018), specifying the number of genes that can be “skipped” (Max‐Gap) to be five, and stipulating a p < .01 cutoff for statistical significance. Analyses of rearrangements within the LSG clusters among species were conducted with the aid of synteny visualization at the FungiDB via the JBrowse genome browser. For the rearrangement analysis, synteny comparisons were restricted to a 100‐gene window centred on the cluster of LSGs.
2.3. Sequence analysis and visualization
Sequences analysed in this study were all based on the latest annotation of the relevant genomes at FungiDB database. To look for neighbour genes of LSGs that are shared among the other Sordariomycetes genomes, a three‐way reciprocal blastp and a tblastx with a PAM30 score matrix were used to search for homologous genes in the representative genomes in the class; an E value of 1 × 10⁻¹⁰ was used as a cutoff, and synteny among the orthologs shared within the genomes was further visually checked at the FungiDB. Pairwise comparisons of sequence similarity among long imperfect repeats were performed based on a BLOSUM62 amino‐acid transition matrix using the Needle online service. Multiple sequence alignments were visualized using the EMBL‐EBI online service MView with default settings (Madeira et al., 2022). Depictions of sequences and alignments were constructed using the Colour Align Conservation tool at the Sequence Manipulation Suite (Stothard, 2000).
2.4. Phylogenetic analysis
Molecular phylogenetic analyses were performed to infer both species and gene evolutionary histories using Maximum Likelihood (ML) and Bayesian approaches on amino‐acid sequence alignments. For both species trees and gene trees, the molecular phylogenetic inference procedures were the same: Amino‐acid sequences were aligned using version 7 of MAFFT (Katoh et al., 2019) with a variable scoring matrix and a recommended α max = .8, then misaligned sequences were removed with the G‐block online service (Talavera & Castresana, 2007), followed by manual examination and exclusion of highly variable regions. Phylogenies were inferred with ML searches using PhyML 3.0 (Guindon et al., 2010) under a WAG model (Whelan & Goldman, 2001). The robustness of branching topologies was assessed with 1000 bootstrap analyses on the resampled alignments. Branches receiving bootstrap supports higher than 80% were considered strongly supported. In cases of weakly supported topologies inferred via ML approaches, phylogenies were further verified by a separate analysis using MCMC methods implemented in MrBayes 3.2 (Ronquist et al., 2012). Analyses were executed for 10,000,000 generations, sampling every 1000 generations with four chains. Trees prior to stationarity of the log‐likelihood trace were discarded as burn‐in. A branch consistent with the PhyML maximum likelihood tree receiving a Bayesian posterior probability higher than .95 was considered to be strongly supported.
To accurately infer species phylogenies that could be reconciled with gene phylogenies to identify evolutionary events such as gene duplication, horizontal gene transfer, and chromosomal rearrangement, we used the protein sequences of DNA‐directed RNA polymerase II core subunits RPB1 and RPB2 to infer Sordariomycetes species trees. RPB1 and RPB2 protein sequences exhibit high informativeness at this depth of phylogenetic inference (Schoch et al., 2009). Sequences of Xylaria species were used to root the tree, consistent with the latest classification (Hyde et al., 2020).
For gene phylogenies, we additionally included relevant sequences with some similarity identified at the FungalDB database (Basenko et al., 2018) or by default BLASTp search at the NCBI database (https://www.ncbi.nlm.nih.gov/). To confidentially resolve the recent divergences within the Neurospora genus, the phylogenetic informativeness of RPB proteins is too low. Therefore, a cladogram of the phylogeny among N. crassa, N. tetrasperma and N. discreta was extracted from the latest population genomics study of Neurospora (Gladieux et al., 2020). LSGs that likely arose via multiple gene duplications and were shared only among the three Neurospora genomes had no identifiable outgroup lineages: consequently, midpoint rooting was applied to their phylogenetic inferences.
2.5. Reconstruction of the ancestral synteny
To infer evolution of local gene synteny, which in turn enabled inference of likely orders of chromosomal rearrangement, reconstruction of ancestral physical links between neighbour genes was performed on inferred bifurcating trees using the default parameterization of the ace functions in the R package ape 5.7 (Paradis & Schliep, 2019). We applied an equal‐rates model (ER), based on the observations of the frequent occurrence of relocation and rearrangement along with frequent gains and losses of LSG synteny among Neurospora genomes in the chromosomal regions rich with LSGs.
2.6. Analysis of expression and function of LSGs
To infer expression patterns for LSGs in different environmental settings, six previously published RNAseq datasets were re‐examined. These studies investigated the transcriptomics for the congenic strains of N. crassa (FGSC2489 mat‐A strain or FGSC4200 mat‐a strain) or mutant strains generated from the same genetic background as the two strains. Namely, genome‐wide gene expression in N. crassa was assayed for N. crassa at multiple stages of its life cycle, including conidial germination on different media (dataset GSE101412; Wang, Miguel‐Rojas, et al., 2019) and sexual reproduction of meiotic spores (ascospores) on synthetic crossing medium (dataset GSE41484; Wang et al., 2014). Previous time‐course data for stages of the lifecycle that were not covered by our primary data were also downloaded and analysed separately, including a 24‐h developmental time course of conidiation (supplemental data in Sun et al., 2019) and a 240‐min time course of asexual growth in response to darkness and light stimulation (dataset GSE53534; Wu et al., 2014).
To assess the possible roles of LSGs in metabolic regulation, transcriptomic data from mycelia exposed to five different carbon resources from crop residues (supplemental data in Wang et al., 2015) and from mycelia in response to non‐preferred carbon sources such as furfural and HMF (supplemental data in Feldman et al., 2019) were also examined. Mapped counts from each experiment were normalized and analysed with LOX (Zhang et al., 2010), which reported expression relative to the lowest expressed value across data points with 95% confidence intervals as well as statistical evaluation (p value) of pairwise differences in expression fold‐change between data points.
To further assess functional roles of LSGs, knockout mutant phenotyping was performed as reported previously (Wang et al., 2022). This phenotyping was facilitated by using strains obtained from the Neurospora knockout collection in which a Hygromycin‐resistance cassette had been systematically inserted, by homologous recombination, into most of the N. crassa ORFs that had been identified by annotation of the full genome sequence (Colot et al., 2006; McCluskey et al., 2010). To determine the relative sensitivity of the Δmas‐1 strain to a chitin‐synthase inhibitor, 10 μL of an asexual spore (conidia) suspension (1 × 10⁷ conidia/mL) were inoculated on Petri dishes containing sucrose medium. The medium was amended with 40 μM Polyoxin D (Kaken Chemical Company, Tokyo, Japan) and cultured as in Beth Din and Yarden (1994). This concentration of Polyoxin D inhibited the growth of the wild type by approximately 30% in preliminary experiments.
2.7. Inference of genome‐wide co‐regulatory networks involving LSGs
Expression data were assembled into a gene expression atlas comprising eight stages of sexual development (Wang et al., 2014); four stages of asexual spore germination and asexual growth, including fresh spores, first polar growth of the germ tube, doubling of the germ‐tube length, and appearance of the first branch, on Bird medium that only supports asexual development (Wang, Miguel‐Rojas, et al., 2019); the same four stages of asexual spore germination and asexual growth on a natural maple sap medium that supports both asexual and sexual growth (Wang, Miguel‐Rojas, et al., 2019); an asexual spore production (conidation) time course with four sample points within the 4 days to the formation of protoperithecia (Sun et al., 2019); asexual growth in response to darkness and light exposure lasting 15, 60, 120 and 240 min (Wu et al., 2014). This atlas of gene expression was analysed via Weighted Gene Correlation Network Analysis (Langfelder & Horvath, 2008) to estimate a genome‐wide co‐regulatory network. To ensure that gene‐expression dynamics collected using distinct platforms and experimental designs were comparable, expression data for each gene from each experiment were normalized with LOX, which reported expression relative to the lowest value across data points. To perform the WGCNA analysis, we rescaled LOX output values so that the gene expression at the initiation of the experiment was one. For each gene in each of the datasets, expression at the first time point (or reference point, such as untreated condition or wildtype) was set to a value of one. Subsequent fold changes between adjacent sample points were then calculated as , where is the relative gene expression level from LOX at time point t. Default WGCNA parameters and the typical soft‐thresholding power of 16 was selected as it resulted in a scale‐free topology fit index R 2 that was at or above .8 (Zhang & Horvath, 2005). Network modules were visualized using Cytoscape 3.0 (Figure S4, Shannon et al., 2003).
3. RESULTS
3.1. Chromosomal distribution of LSGs
The 670 Neurospora LSGs reported in Wang et al. (2022) encoded proteins of an average length of ~192 amino acids, ranging from 26 (NCU05561) to 1310 amino acids (NCU04852). LSGs were distributed within all seven chromosomes of the N. crassa genome, with multiple paralogs from duplicates clustered together. Seventy‐eight percent of these clusters either harboured or were adjacent to large (5–40 kbp) non‐coding spans (Table S1). The two longest clusters of single‐copy LSGs that were identified were a six‐gene cluster on chromosome VII, NCU06896–06902, and a 10‐LSGs cluster at the 3′‐end of chromosome V, NCU07144–07152 (except for NCU07149, Figure 1). Most genes in these two clusters were specific to N. crassa, and genes within these two clusters showed no elevation of sequence similarity beyond expectation (local BLASTp search E > 0.1), with pairwise similarity scores of the amino‐acid sequence alignments lower than 25% (3%–22% for the cluster NCU06896–06902, and 7%–25% for the cluster NCU07144–07152). Protein sequences encoded by Neurospora LSGs ranged in length from 26 to 1310 amino acids; very few LSGs occupied less than 400 bp of the genome. Surprisingly, three LSG clusters of more than three genes contained duplicated LSGs. Two of these three LSG clusters feature three genes originated by duplication: one featured NCU06953, 06954, and 06955, and the other featured NCU09589, 09590, and 09591. These two clusters of duplicated genes were found in neighbouring genomic locations separated by a 10 kb non‐coding sequence. An example of the 3′‐end of chromosome V featured (1) clustered LSGs, (2) an abundance of multi‐copy non‐LSGs that are locally syntenic among the three Neurospora species, (3) large non‐coding regions located near the chromosome rearrangements among three Neurospora genomes, and (4) species‐specific genes that are often found adjacent to large non‐coding regions (Figure 1, Tables S1 and S2).
FIGURE 1.
Syntenic map near the 3′ end of chromosome V, which is enriched with LSGs clusters and Het‐domain genes in three Neurospora species. To provide a single basis that would clearly illustrate frequent gene duplications, long non‐coding intergenic sequences, chromosomal rearrangement, as well as lineage‐specific genes within the three genomes, links between orthologs (lines between genes; magenta: LSGs in N. crassa and in some cases other Neurospora species, black: non‐LSGs) were drawn from N. discreta whenever possible; otherwise, orthologs were linked between each pair to show the retention of their clustering among the three species. Each colour‐coded block (LSGs in N. crassa and in some cases other Neurospora species, magenta; LSGs only in N. tetrasperma, peach; and LSGs only in N. discreta, green) represents a gene. Blank spaces between genes represent non‐coding intergenic sequences or sequences without annotation. Width of the genes and non‐coding regions is proportional to their length in nucleotide base pairs. Three possible rearrangements that were associated with a long non‐coding region were marked for N. crassa by comparison to the gene orders in N. discreta, with three syntenic chromosomal blocks marked as S1, S2 and S3 (Table S2).
3.2. Origins of Neurospora LSGs from recent gene duplication
Some Neurospora LSGs exhibited multiple paralogs and homologues identified in N. crassa, N. tetrasperma, and N. discreta genomes, including 26 genes with 1–5 paralogs in the N. crassa genome. Twenty LSGs exhibited multiple homologues in either N. tetrasperma (13) or/and N. discreta (17) genomes. Homologues of the hypothetical protein‐coding gene NCU06953 were found only in Neurospora genomes (Figure 2). Homologues of this gene in N. crassa include six genes in two clusters about 10 kb apart from each other: one cluster includes NCU06953, 06954, and 06955; the other cluster includes NCU09591, 09590, and 09589 (Figure 2a). In mating‐type A genomes of N. tetrasperma and N. discreta, respectively, five and four homologues in the single clusters were identified (Figure 2a,b). An ortholog of NCU09591 was found only in N. crassa, while no ortholog of NCU09589 was found in N. discreta. A switch in gene order between orthologs of NCU06953 and 06954 was observed in N. discreta. Expression of these genes exhibited dynamic regulation in asexual spore germination and growth compared to sexual development in N. crassa (Figure 2c). An exception to this greater dynamic nature was NCU06953, which exhibited up‐regulation of expression during late perithecial development, but no expression in asexual growth. However, no distinct phenotypic consequences were observed following deletion of these genes during asexual and sexual growth and development.
FIGURE 2.
Divergent synteny, gene tree, and gene expression during sexual development or asexual spore germination of homologues of hypothetical protein‐coding gene NCU09590. (a) Cladogram of N. discreta, N. crassa and N. tetrasperma and local synteny map of the region surrounding NCU09590 among three Neurospora species featuring six orthologs of NCU09590 (colour coded; boundary genes in N. discreta and N. tetrasperma are in black); (b) Bayesian midpoint‐rooted phylogeny of NCU09590 and its homologues (in parentheses, gene numbers follow the latest genome annotation at FungiDB for N. crassa FGSC2489, mating type A; N. crassa FGSC4200, mating type a; N. discreta FGSC8579, mating type A; and pseudohomothallic N. tetrasperma FGSC2508, mat A genome). Each of the six coloured clades represents a consequence of duplication and divergence (scale bar: 0.2 amino‐acid substitutions per site; *: clade support with Bayesian posterior probability <.95; clades are coloured as their orthologs are coloured in panel a). (c) Divergent relative expression levels of N. crassa homologues (coloured as in panels a and b) during key development stages (whiskers: 95% confidence intervals).
3.3. Long sequence repeats, chromosome rearrangement, and relocation were found to be associated in Neurospora LSGs
Comparative genomics of the Neurospora species revealed that several LSGs with repeats were characterized by a combination of long repeat sequences and relocation—or even gene fusion. In N. crassa, NCU04998 was located in the telomere of chromosome VI and exhibited a unique recombination with two repeats of (AAG AAG GAT GAT GAT TCC)15 and (ACC AGA ACG AGG ATG ATT CCC)18. Appearances of the repeats are associated with the evolution of homologues of this LSG in three Neurospora species (Figure 3). Three N. discreta genes, Nd_19904, 19905 and 114210, are syntenic with NCU01135 and Nt_57904, with a divergent order and an insertion of a long repeat sequence. NCU01135 is solitary, located in the middle of chromosome V. Expression of these five genes was low, but trended upwards over the time course of sexual development. Annotated as a halotolerance protein, N. discreta Nd_128717 is syntenic with NCU04998 and is also located in the telomere region. These genes showed an abrupt 10‐ to 20‐fold rise in expression in the early stages of sexual development. Expression regulation of NCU01135 and 04988 exhibited a similarly abrupt down‐regulation during asexual spore germination and early vegetative growth. No obvious phenotypes were observed for knockout mutants of NCU01135 and 04988. In addition, a few LSGs, such as NCU07532, 07625, and 16695, exhibited long sequences of mononucleotide, trinucleotide, or hexanucleotide repeats. No orthologs of NCU07625 and 16695 were identified in N. discreta.
FIGURE 3.
Syntenic associations among NCU01135 homologues with two kinds of sequence repeats in three Neurospora species, and their expression profiles during sexual reproduction and asexual spore germination. (a) Cladogram of N. discreta, N. crassa and N. tetrasperma and schematics of homologous gene structures. Three homologues of NCU01135 are clustered in N. discreta (purple, peach, navy). However, the order of the three genes is reversed compared to their orthologous sequences in a single gene in N. crassa and N. tetrasperma, indicating an ancestral gene rearrangement. Short perfect sequence repeats were represented by tildas (~). (b) NCU01135 paralog NCU04998 in N. crassa and Ndisc8579_128717 in N. discreta share sequence similarity with NCU01135 and exhibit two kinds of sequence repeats (black and yellow tildas, ~). Repeats shared between SC013 and NCU01135 indicate a possible (question mark) rearrangement and recombination involving non‐syntenic regions from N. discreta to the most recent common ancestor of N. crassa and N. tetrasperma. (c) Comparative expression levels of homologues of NCU01135 in the three Neurospora species, (d) homologues of NCU04998 during sexual reproduction in N. crassa and N. discreta, and (e) NCU01135 and NCU04998 during asexual spore germination in N. crassa.
Repeats within N. crassa NCU08261 and its ortholog N. tetrasperma 138116 exhibited lower sequence similarity than non‐repetitive sequences in the genes, and the six repeats gradually lose sequence resemblance among the homologues within and between the species. The middle repeats in NCU08261 were more similar to each other, while repeats in 138116 exhibited a higher dissimilarity than those in NCU08261 in general (Figure S1, Table S3). Low sequence quality in the repeat regions was observed for many population strains of N. crassa at the DNA polymorphism information page at the FungiDB database (https://fungidb.org/fungidb). These SNP data were derived from a previous study that reported 135,000 SNPs based on transcriptome sequence from 48 individuals (Ellison et al., 2011). Regardless of the sequence divergence of the imperfect repeats between the two genes, NCU08261 and Nt_138116 exhibited similar regulation of expression during sexual development of perithecia and ascospores, but Nt_138116 exhibited a much greater up‐regulation than NCU08261 during the late stages of ascus and ascospore development, particularly at 48 h from crossing, and especially during ascospore maturation.
3.4. Chromosome rearrangement, gene duplication and losses are likely associated with the origin of mas‐1
One gene specific to the three Neurospora genomes, mas‐1, is adjacent to cell‐wall synthesis coding genes and located in a region that features high synteny among many sordariomycetes genomes (Figure 4a, Figures S2 and S3). The knockout strain of mas‐1 exhibited interesting phenotypes in chitin biosynthesis inhibitor tolerance (Koch et al., 2014). Chitin biosynthesis is critical and conserved in all fungi. Consequently, the orphan status of mas‐1 raised a question how such a new function evolved. Homologues of mas‐1 neighbour genes NCU03139–03142—and the noncoding regions between them—are syntenic in the genomes of three Neurospora species and the closely related Sordaria macrospora, Podospora anserina, and Chaetomium globosum, but are not syntenic in their earlier ancestors and derivatives, including Magnaporthe and Trichoderma. Instead, clusters of NCU03139–03140 and NCU03141–03142 are separated during the early divergence of the Sordariomycetes, as they are in the basal lineage Xylaria. Interestingly, non‐coding sequence between orthologs of NCU03139 and 03141 in the genomes of N. discreta (location at NdisFGSC8579_SC007: 1492354–1495453) and S. macrospora (NW_003546211: 435916–438595), if transcribed, would encode amino‐acid sequences that are similar to partial sequences of mas‐1 without the GT‐AG intron‐like sequence at the 40th amino‐acid position (Figure 4b).
FIGURE 4.
Reconstruction of the evolutionary history of synteny for the Neurospora crassa LSG mas‐1 (NCU03140) and neighbour genes within the Sordariomycetes, based on an RPB1‐ and RPB2‐based species phylogeny with genome annotations from JGI fungal genomes and FungiDB. (a) Current and ancestral synteny in the Sordariomycetes of homologues of N. crassa mas‐1 and its four neighbouring genes. Ancestral inferences of the likely positions of the homologues of the five genes (colour coded to match the orthologs of the five N. crassa genes as shown in the top with dark green NCU03138, blue NCU03139, orange NCU03140, light green NCU03141, and purple NCU03142) were inferred as in Figures S2 and S3; all nodes were fully resolved with posterior probability equal to one. Gene positions are diagrammatic. Grey bars represent other genes in the region. The lengths of arrows representing coding and non‐coding regions are not drawn proportionate to actual lengths in base pairs. Genes that share the same chromosome or supercontig were linked with the same solid or dashed black lines. Extremely long intervals between genes of interest were broken with (−//−) without tallying genes in the intervening regions. (b) Alignment of amino‐acid sequences translated from non‐coding regions orthologous to mas‐1, exhibiting 16%–52% similarity between Sordaria macrospora (Sm), N. discreta (two pieces of a tandem repeat: Nd1 and Nd2) and the orthologs of mas‐1 in N. crassa (Nc) and N. tetrasperma (Nt). Sequence visualization and analysis used MView (EMBL‐EBI online service) with N. crassa mas‐1 as the reference for coverage (cov) and percentage of identity (pid). (c) Hypothesis consistent with a rummage model of evolution for LSG mas‐1 including chromosomal rearrangement, gene duplication, gene function loss that resulted in a non‐coding region, then origin of de novo function and gene.
The non‐coding intergenic nucleotide sequence in S. macrospora and N. discreta also was identical in sequence to non‐intergenic sequences in P. anserina and C. globosum (Figure S3A). One of the NCU03141 homologues in F. graminearum, FGRAMPH1_01G13931—encoding a lysophospholipase precursor—included a nucleotide sequence fragment that is at least 250 bp in length that was slightly similar (33%) to mas‐1 (Figure S3B). In fact, reconciliation between phylogenies of mas‐1 homologues and the species sampled in the class suggests that Fusarium copies of lysophospholipase precursor are more similar to the ancestral copies (Figures S3C and S4). However, lysophospholipase is involved in cell‐wall synthesis and shows dramatic length and copy‐number polymorphism in fungal genomes, without known function in toxin response. Therefore, mas‐1 could be a case of acquisition of a new function as a gene “reborn” along with chromosome rearrangement and sequence relocation (Figure 4c).
Expression of mas‐1 was detected during asexual spore germination at 25°C (Figure 5a,b). No expression was detected during asexual growth (including conidiation) at 37°C, nor during any phases of sexual development (including production of ascospores, Wang et al., 2014; Wang, Miguel‐Rojas, et al., 2019). The gene mas‐1 was expressed during asexual spore germination, exhibiting no significant coordination of expression with its neighbouring genes. However, the three out of four neighbouring genes exhibited the same expression patterns when the fungus was cultured on either Bird medium (BM), with a high carbohydrate concentration, or on maple sap medium (MSM), with low carbohydrate and nitrogen levels (Wang, Miguel‐Rojas, et al., 2019). In contrast, mas‐1 expression increased three‐fold on MSM with a low carbon nutrient level during early asexual spore germination upon appearance of the spore germ tube. In fact, mas‐1 was first discovered as a novel N. crassa gene encoding a cell‐wall biosynthesis and integrity protein that mediates sensitivity of N. crassa to an antifungal compound produced by marine‐derived Aspergillus tubingensis (Koch et al., 2014). When grown in the presence of the inhibitor of chitin biosynthesis Polyoxin D (Endo et al., 1970), the Δmas‐1 strain exhibited a significantly higher level of tolerance to the inhibitor and grew approximately twice as fast as the wild type (Figure 5c,d).
FIGURE 5.
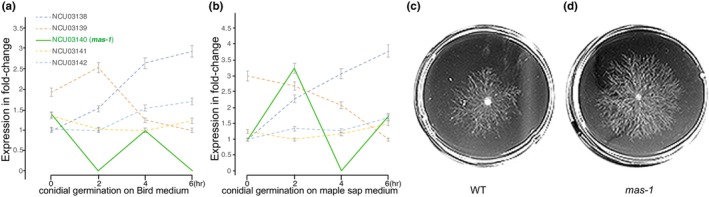
Expression profiles of the LSG mas‐1 and its neighbour genes during asexual spore germination, from first polar growth of the germ tube, doubling of the germ‐tube length, to the appearance of the first hyphal branch, and evidence of a functional role in response to toxins. Relative expression levels of mas‐1 and four neighbour genes (colour‐coded) with 95% CIs for during asexual spore germination on (a) BM at 25°C and (b) MSM at 25°C. (c) A wild‐type strain on polyoxin D medium for 24 h; (d) a mutant of mas‐1 on polyoxin D medium for 24 h, exhibiting higher tolerance to this fungal cell‐wall biosynthesis inhibitor.
3.5. Roles of Neurospora LSGs in genome‐wide regulatory networks
To determine the functional roles of Neurospora LSGs, we selected 68 experiments, of which metadata are all available at the NCBI gene ontology database (http://www.geneontology.org/), from 14 recent high‐quality transcriptomics studies on N. crassa. These studies covered almost all morphological stages in the N. crassa life cycle cultured under distinct conditions including carbon or nitrogen resources, as well as including studies of expression of knockout mutants of key regulatory genes (Coradetti et al., 2012, 2013; Craig et al., 2015; Feldman et al., 2019; Lehr et al., 2014; Sun et al., 2019; Wang et al., 2014, 2015; Wang, Miguel‐Rojas, et al., 2019; Wu et al., 2014; Xiong et al., 2017; Znameroski et al., 2012). Expression of 8402 genes (5% with 420 Neurospora LSGs) was detected at least one sample point in 14 transcriptomic projects (Table S4 for references and dataset accession numbers). Expression fold‐change was analysed with weighted correction network analysis (WGCNA). Our results provided evidence for 31 network modules ranging in size from 41 to 2971 genes (Table S5). Six of these modules featured statistically significantly greater than random composition of LSGs (p < .05). The top three of these modules exhibited 18% LSG out of 52 genes, 25% out of 105 genes, and 25% out of 90 genes (Figure S4). Annotated genes in these modules were significantly enriched (adjusted p < .05) for processes of tetrahydrofolate biosynthesis, glycerol production, GPI‐anchor biosynthesis, as well as malate dehydrogenase activity. LSGs were uniformly dispersed in these networks and did not form apparent regulatory hubs. The largest of the 31 modules consisted of nearly a third of the genome and comprised 2971 genes, which included 7.6% (227) LSGs (p < .01). Annotated genes in this module were enriched for transcription regulation, protein phosphorylation, metal ion binding, and cell division.
4. DISCUSSION
Here, we have demonstrated how chromosomal rearrangement and relocation shaped the evolution of LSGs and genome elements within model fungi in Neurospora, despite the repeat‐induced point mutation (RIP) defence system encoded in the genome. Recent gene duplications as a source for evolutionary novelty have been considered rare in the N. crassa genome. However, we were able to examine details of N. crassa LSGs, which formed clusters near the end of each chromosome. We reconstructed histories of gene duplication and chromosomal rearrangement affecting LSGs and LSG clusters based on phylogenies, gene trees, and gene syntenies. This study provided evidence of evolution of mas‐1 via a rummage mode that includes chromosomal rearrangement, gene duplication and loss, and de novo origin of gene and new functions. This dynamic evolutionary history renders mas‐1 an interesting gene for further investigation of the evolutionary and ecological roles of LSGs. Dynamic evolution of another two LSGs was attributed to the rapid evolution of associated long sequence repeats. Furthermore, using extensive transcriptomics data, we inferred interactive regulatory networks placing LSGs are functionally integrated into genome‐wide responses to diverse developmental and environmental factors. Network modules that were composed of large numbers of LSGs were enriched with genes annotated with specific but “non‐essential” functions in N. crassa biology, including a number of biosynthetic processes. These results suggest that gene duplication, chromosome rearrangement and relocation, and clustered distribution at dynamic telomere regions facilitates the origin of LSGs and their functional integration—a process that recycles genomic material from dynamically divergent rummage regions that are excluded from the rampant Neurospora gene‐content proof‐reading mechanism RIP.
4.1. Neurospora LSGs account for a small portion of the genome, but some experienced recent duplications
In contrast to 10%–30% of all genes in a genome being lineage specific in many model species that have been assessed (Toll‐Riera et al., 2009; Wissler et al., 2013), only a small portion (~ 6%, 670 genes) of the Neurospora genomes are unique to the three closely related Neurospora model species N. crassa, N. tetrasperma, and N. discreta. Combined phylostratigraphy, reciprocal blast, and follow‐up analyses of synteny identified no obvious homologues for these genes in other available genomes. Nevertheless, for most of these LSGs there is not a clear trace for their origins. Therefore, we identified several causes for these LSGs in the genome, including gene duplication, chromosome rearrangement and relocation, and possible origin from non‐coding sequences, consistent with what has been observed in other models (Van Oss & Carvunis, 2019).
Only 10 sets of gene duplications—involving 26 genes—were observed in Neurospora LSGs, suggesting that gene duplication is not a major source for new genes in Neurospora species. One likely reason for such a low number of LSGs arising from duplication is that Neurospora species are equipped with a repeat‐induced point mutation silencing defence (RIP) that erases copies of duplicated genes, with few exceptions (Toll‐Riera et al., 2009; Wang et al., 2020). Lack of sequence similarities within multigene families is an indication that evolution of new genes within the N. crassa genome occurs by the formation of new genes from non‐coding sequences and potentially gene rebirth rather than by duplication and divergence of extant genes (Galagan et al., 2003). Thus, reconstruction of gene synteny history at chromosomal level to gene cluster level across lineages could be especially illuminating, as in the case of mas‐1, where careful analysis of synteny is critical to tracing the origins of a LSG.
4.2. Chromosome rearrangement, gene relocation, and non‐coding sequence contributed to the origin of the LSG mas‐1
The LSG mas‐1 provides a rare case exhibiting genetic fossils in non‐coding sequences along the depth of species evolution history that likely links a new functional protein to an extinction of gene copy from gene duplication. A possible scenario would be that in the common ancestor of N. crassa (Sordariales) and F. graminearum (Hypocreales), a gene relocation following a duplication of ancestral ortholog of FGRAMPH1_01G13931 led to a loss of function in one of the paralogs, which became a the non‐coding region in the Sordariales. However, a small piece of that non‐coding region was then recycled into a new gene (mas‐1) in the common ancestor of N. crassa and N. tetrasperma. In fact, it was reported that deletion of mas‐1 did not confer any measurable difference on radial growth of the fungus under standard growth conditions (Koch et al., 2014). However, when grown in the presence of Polyoxin D, an inhibitor of chitin biosynthesis (Endo et al., 1970), the Δmas‐1 strain exhibited a significantly higher level of tolerance to the inhibitor and grew much faster than the wild type. These results, along with the observed increase in the expression of several members of the chitin synthase gene family in the Δmas‐1 strain (Koch et al., 2014), strongly support the potential role of MAS‐1 in cell wall integrity. This potential role is consistent with a possibility that the ancestral source of mas‐1 is a lysophospholipase precursor, which belongs to a family of proteins known to affect fungal cell wall integrity (Siafakas et al., 2007). Therefore, study on the evolution of lysophospholipase precursor homologues may shed light on those quickly evolved genes, their novel functions, and the origin of non‐coding sequence and LSGs within the “rummage regions”.
4.3. Fast gene evolution occurred in LSGs, facilitated by repeat sequences that are common in non‐coding sequences
Sequences from non‐coding regions of genomes have long been considered to be one of the major sources of de novo genes (Bornberg‐Bauer, 2017; McLysaght & Guerzoni, 2015; Zhang, Gao, et al., 2019). Indeed, origins and evolution of multiple Neurospora LSGs exhibited significant evidence of ancestry in repeated DNA, in some cases derived from non‐coding regions. In fact, the distribution of simple sequence repeats (SSR) in the N. crassa genome is not completely random, as the short repeats (tri‐nt and hexa‐nt) are common in coding genes, while other repeats are usually only found in non‐coding regions (Kim et al., 2008).
Several Neurospora LSGs exhibit internal long repeats, implying a possible origin as proto‐genes in non‐coding regions that became functional. An extraordinary case would be NCU00143, a hypothetical protein coding LSG that is actually located within the 3′‐UTR of the long gene NCU00144 that codes for another hypothetical protein. Proto‐genes from non‐coding sequences can lead to the birth of de novo genes. However, their function and roles usually are not essential and apparent (Carvunis et al., 2012). Tracing the evolutionary history of fast‐evolving genes with repeats backward along the phylogeny can be challenging, unless chimeric patterns of conserved sequences can be spotted among closely related lineages, indicating possible relaxed selective pressure happening specifically on the long repeat sequences.
One such sequence may be NCU08261 and its ortholog in N. tetrasperma. Their fast‐evolving repeats could be evidence of evolving proto‐genes arising from non‐coding sequences with long repeats. Interestingly, these two genes exhibit the same regulation during sexual development with up‐regulation toward the end of ascospore maturation. However, no phenotypes of knockouts of these genes were evident by microscopy of asexual growth, asexual conidiation, and sexual developmental stages in N. crassa or N. tetrasperma. Accordingly, further investigation could be focused on the polymorphism of these genes in different populations and possible quantitative phenotypes in a more natural setting.
4.4. Chromosomal rearrangement and telomeric relocation are major elements of clustered LSG evolution
Neurospora LSGs exhibit several organizational features on chromosomes. These features include clustering of genes, large non‐coding spaces along with condensed coding regions on the flanks, multiple gene duplications, and telomeric location. Neurospora LSGs are sparsely distributed with some dense spots in all chromosomes of the N. crassa genome, with paralogs from duplicates often being clustered together. Most genes in both these clusters exhibited up‐regulation towards the development of asci and ascospore maturation. No phenotypes were identified for any gene in these clusters. However, expression data implies that some of these genes are coordinately regulated and are associated with sexual development in N. crassa. Clustered genes likely derived from relocation and rearrangement, especially for functionally associated genes (Bharadwaj et al., 2021; Fischbach & Voigt, 2010; Lejeune et al., 2019; Slot, 2017; Slot & Rokas, 2011; Trowsdale, 2002; Wang, López‐Giráldez, et al., 2019; Yi et al., 2007). Accordingly, it could be easy for these genes to functionally integrate back altogether into the existing system. Of course, RNA levels may not necessarily reflect the expression at the protein level, and to verify functions of LSGs, proteomics data would be crucial (Ruiz‐Orera et al., 2018; Vakirlis et al., 2018).
4.5. Telomeric relocation may be necessary for functional integration of LSGs into the existing regulatory networks
One previous study suggested that highly AT‐rich sequences in the telomeres are likely products of RIP and that subtelomeric elements common in other fungi are absent in N. crassa (van Wyk et al., 2019). In addition, domains of H3K27me2/3 are enriched near the ends of chromosomes in N. crassa. Telomere repeats are required for H3K27 methylation, which would repress the transcription activities and functionally silent genes in these regions (Jamieson et al., 2018). A recent study suggested that mutation rate was dramatically higher in regions of low GC, in centromeric regions, and in domains of H3K9 and H3K27 methylation than euchromatin regions (de la Peña et al., 2022). More importantly, the telomeric regions have potential significance in niche adaptation and probably harbour hotspots for novel sequences due to abrupt sequence divergence involving repeats (Wu et al., 2009). The dynamic nature of the telomeric neighbourhood of N. crassa may allow rapid recycling and transference of clustered functional groups, likely from duplications that may thereafter be modified by RIP, and thus make the region a hotspot for the origin of de novo genes or proto‐genes. However, functional annotation for genes in the telomeric regions is generally poor, partially due to lack of homology in those regions with annotated genes in well studied models. Further investigation of physical changes at the chromosome level and epigenetic modification of gene expression could shed light on the roles of telomeric neighbourhoods in the evolution of LSGs in N. crassa.
4.6. Chromosomal rearrangements directly contributed to the origins of some LSGs in Neurospora
Chromosomal rearrangements are also known to create gene fusions, which can cause rapid evolution by generating novel chimeric proteins (Rogers & Hartl, 2012; Strohl, 2017). Comparing Neurospora LSG NCU01135 and its homologues among three Neurospora species identified such a chimeric protein involving chromosomal rearrangement, insertion of long repeat sequences and relocation. This observation calls for investigation about roles of repeats in chromosomal relocation and the origin of such chimeric proteins. Chimeric proteins usually gain functions different from their “parent” genes and produce new phenotypes. This study examined molecular evolutionary chromosomal and sequence rearrangements at the species and genus levels, and revealed that they are associated with LSGs. A population‐genetic comparative genomic (or pangenomic) study of Neurospora and potentially other fungal models would likely provide additional insights into even more recent evolutionary dynamics of LSGs, illuminating fine‐scale mechanisms of genomic rummage.
4.7. LSGs play a variety of generally non‐essential roles in Neurospora biology
LSGs are generally not functionally annotated, mainly due to the lack of homologous references in well studied genomes, and knockouts of many LSGs exhibited no obvious phenotypes. From transcriptomic data collected during sexual development in three Neurospora species, the homologous genes showed comparatively lower expression in fold‐change at the early stages than the later stages in the sexual development. However, only wild type phenotypes were identified during asexual and sexual developmental stages in the knockouts of this gene in N. crassa. Therefore, there are either non‐essential roles in well documented mechanisms or little functional divergence or both among these LSGs. Knocking out the LSG mas‐1 did increase N. crassa's resistance to toxins; further investigation is required to investigate the mechanism of this resistance. Among 31 co‐regulatory modules identified with 68 transcriptomics datasets, 27 included LSGs. The LSGs were widely involved in various aspects of N. crassa biology, but as non‐essential partners. However, five Neurospora LSGs had no measurable expression in all 68 experiments. Therefore, these five LSGs possibly become proto‐genes and are transiently expressed under specific conditions that were not investigated by our assays.
5. CONCLUSIONS
Our analysis showed in two detailed cases as well as many supplementary examples that frequent gene duplication, large non‐coding regions, and gene order rearrangement are characteristic around LSG clusters. In experimental research, chromosome segment duplication and rearrangement can enable small gene duplications that escape RIP (Singh et al., 2009; Singh & Kasbekar, 2008). This ability for some small duplications to evade RIP may be crucial to the origin and persistence of LSG clusters. We showed that the homologues of the duplicated genes around LSGs vary in chromosomal location even within species but remain syntenic among closely related species. This variation in location with conserved synteny implies an elevated frequency of gene cluster relocation and rearrangement of entire clusters. Higher mutation rates and clustered gene relocation—consequences of RIP—may or may not contribute to the regeneration of coding genes within non‐coding regions. However, the observation of multiple copies of LSGs with domains homologous to parts of non‐coding sequences in Neurospora genomes indicates that some LSGs are recycled within these “rummage regions” and integrated back into the coding genome and its regulatory architecture. Therefore, this study calls for further systematic investigation of how these duplicated LSGs may have arisen, avoided RIP, relocated via chromosomal rearrangement facilitated by repeated sequences, and gained new functions.
LSGs in many eukaryotic genomes have been identified as orphan genes or de novo genes. These genes contain many fast‐evolving genes and are universally present in eukaryotic genomes (Lespinet et al., 2002; Long et al., 2003; Tautz & Domazet‐Lošo, 2011), and LSGs have long been considered as part of the coadapted alleles in isolated populations and contribution to the reproductive barriers by ecology (Koide et al., 2018; Luna & Chain, 2021; Maltseva et al., 2022). Ecological roles and evolution of LSGs have been investigated in a few fungal models. For example, about 8.5% of the A. fumigatus genome are LSGs with accessory functions in metabolism, detoxification and secondary metabolite biosynthesis and considered as particular genetic determinants that can facilitate an in vivo infection (Fedorova et al., 2008; Puértolas‐Balint et al., 2019). Studies based on fungal pathogens—including the opportunistic human pathogen F. oxysporum—on plants and animals also suggested that rapidly evolving LSGs, often in clusters, contributed to extensive chromosomal structure polymorphisms that may drive aggressive host colonization and the evolution of virulence (de Jonge et al., 2013; Hartmann et al., 2017; Plissonneau et al., 2016; Wacker et al., 2023; Zhang et al., 2020). This study of LSGs in model species of Neurospora has demonstrated that associations between chromosomal rearrangement, gene duplication and losses, long non‐coding regions, and clustering organization in fungi are likely general phenomena of the evolution of de novo functions, providing insights of the evolution of new genes and gene functions in the lineages of Sordariomycetes and many non‐model taxa at different scales (Wang et al., 2023).
AUTHOR CONTRIBUTIONS
ZW and JPT designed the research. ZW performed experiments. ZW, Y‐WW, TK, HH and FL‐G analysed the data. ZW, OY and JPT drafted the manuscript. All authors contributed to the interpretation of the results and the writing of the final version of the manuscript.
CONFLICT OF INTEREST STATEMENT
The authors declare no competing interests.
BENEFIT‐SHARING STATEMENT
Benefits from this research accrue from the sharing of our data and results via the supplemental data files and on public databases as described above.
Supporting information
Figure S1
Figure S2
Figure S3
Figure S4
Table S1
Table S2
Table S3
Table S4
Table S5
ACKNOWLEDGEMENTS
We appreciate the constructive and insightful comments from Dr. Ursula Oggenfuss and another anonymous reviewer. We also thank the Broad Institute, FungiDB, and JGI for making Neurospora related fungal genomic data available. All authors have declared that no competing interests exist. This study was supported by funding to JPT from the National Institutes of Health R01 grant AI146584, National Science Foundation grant NSF‐1916137 to JPT, and NSF‐BSF‐2018712 to OY. The funders had no role in the study design, data collection and interpretation, or the decision to submit the work for publication.
Wang, Z. , Wang, Y.‐W. , Kasuga, T. , Hassler, H. , Lopez‐Giraldez, F. , Dong, C. , Yarden, O. , & Townsend, J. P. (2024). Origins of lineage‐specific elements via gene duplication, relocation, and regional rearrangement in Neurospora crassa . Molecular Ecology, 33, e17168. 10.1111/mec.17168
Handling Editor: Hannah Augustijnen
DATA AVAILABILITY STATEMENT
Transcriptomic data of Neurospora crassa revisited in this study are available at the Gene Expression Omnibus database (ncbi.nlm.nih.gov/geo; GEO database), including data generated for examining the sexual development (GSE41484), asexual growth (GSE101412), responses to light (GSE53534), growth under different nutrients (92848, 95350, 44100, 35227), and additional gene manipulation effects on cell‐to‐cell communication and plant cell wall deconstruction (GSR68514, SRP133627). Additional data were available via the cited references, including N. crassa growth in respond to furfural (Feldman et al., 2019), roles of transcription factor ADA‐6 (Sun et al., 2019), and lignocellulose degradation (Znameroski et al., 2012). All processed data are available from the supplementary data files (Table S4).
REFERENCES
- Baker, S. E. , Schackwitz, W. , Lipzen, A. , Martin, J. , Haridas, S. , LaButti, K. , Grigoriev, I. V. , Simmons, B. A. , & McCluskey, K. (2015). Draft genome sequence of Neurospora crassa strain FGSC 73. Genome Announcement, 3(2), e00074‐15. 10.1128/genomeA.00074-15 [DOI] [PMC free article] [PubMed] [Google Scholar]
- Basenko, E. Y. , Pulman, J. A. , Shanmugasundram, A. , Harb, O. S. , Crouch, K. , Starns, D. , Warrenfeltz, S. , Aurrecoechea, C. , Stoeckert, C. J., Jr. , Kissinger, J. C. , Roos, D. S. , & Hertz‐Fowler, C. (2018). FungiDB: An integrated bioinformatic resource for fungi and oomycetes. Journal of Fungi (Basel, Switzerland), 4(1), 39. 10.3390/jof4010039 [DOI] [PMC free article] [PubMed] [Google Scholar]
- Begun, D. J. , Lindfors, H. A. , Kern, A. D. , & Jones, C. D. (2007). Evidence for de novo evolution of testis‐expressed genes in the Drosophila yakuba/Drosophila erecta clade. Genetics, 176(2), 1131–1137. 10.1534/genetics.106.069245 [DOI] [PMC free article] [PubMed] [Google Scholar]
- Begun, D. J. , Lindfors, H. A. , Thompson, M. E. , & Holloway, A. K. (2006). Recently evolved genes identified from Drosophila yakuba and D. erecta accessory gland expressed sequence tags. Genetics, 172(3), 1675–1681. 10.1534/genetics.105.050336 [DOI] [PMC free article] [PubMed] [Google Scholar]
- Bharadwaj, R. , Kumar, S. R. , Sharma, A. , & Sathishkumar, R. (2021). Plant metabolic gene clusters: Evolution, organization, and their applications in synthetic biology. Frontiers in Plant Science, 12, 697318. [DOI] [PMC free article] [PubMed] [Google Scholar]
- Bornberg‐Bauer, E. (2017). Faculty opinions recommendation of new genes from non‐coding sequence: The role of de novo protein‐coding genes in eukaryotic evolutionary innovation. Faculty Opinions – Post‐Publication Peer Review of the Biomedical Literature. 10.3410/f.725762623.793527098 [DOI]
- Brown, C. A. , Murray, A. W. , & Verstrepen, K. J. (2010). Rapid expansion and functional divergence of subtelomeric gene families in yeasts. Current Biology: CB, 20(10), 895–903. [DOI] [PMC free article] [PubMed] [Google Scholar]
- Carvunis, A.‐R. , Rolland, T. , Wapinski, I. , Calderwood, M. A. , Yildirim, M. A. , Simonis, N. , Charloteaux, B. , Hidalgo, C. A. , Barbette, J. , Santhanam, B. , Brar, G. A. , Weissman, J. S. , Regev, A. , Thierry‐Mieg, N. , Cusick, M. E. , & Vidal, M. (2012). Proto‐genes and de novo gene birth. Nature, 487(7407), 370–374. [DOI] [PMC free article] [PubMed] [Google Scholar]
- Casas‐Vila, N. , Scheibe, M. , Freiwald, A. , Kappei, D. , & Butter, F. (2015). Identification of TTAGGG‐binding proteins in Neurospora crassa, a fungus with vertebrate‐like telomere repeats. BMC Genomics, 16, 965. [DOI] [PMC free article] [PubMed] [Google Scholar]
- Chen, K. , Tian, Z. , Chen, P. , He, H. , Jiang, F. , & Long, C.‐A. (2020). Genome‐wide identification, characterization and expression analysis of lineage‐specific genes within Hanseniaspora yeasts. FEMS Microbiology Letters, 367(11), fnaa077. 10.1093/femsle/fnaa077 [DOI] [PubMed] [Google Scholar]
- Coradetti, S. T. , Craig, J. P. , Xiong, Y. , Shock, T. , Tian, C. , & Glass, N. L. (2012). Conserved and essential transcription factors for cellulase gene expression in ascomycete fungi. Proceedings of the National Academy of Sciences of the United States of America, 109(19), 7397–7402. [DOI] [PMC free article] [PubMed] [Google Scholar]
- Coradetti, S. T. , Xiong, Y. , & Glass, N. L. (2013). Analysis of a conserved cellulase transcriptional regulator reveals inducer‐independent production of cellulolytic enzymes in Neurospora crassa . Microbiology Open, 2(4), 595–609. [DOI] [PMC free article] [PubMed] [Google Scholar]
- Craig, J. P. , Coradetti, S. T. , Starr, T. L. , & Glass, N. L. (2015). Direct target network of the Neurospora crassa plant cell wall deconstruction regulators CLR‐1, CLR‐2, and XLR‐1. mBio, 6(5), e01452‐15. [DOI] [PMC free article] [PubMed] [Google Scholar]
- de Jonge, R. , Bolton, M. D. , Kombrink, A. , van den Berg, G. C. M. , Yadeta, K. A. , & Thomma, B. P. H. J. (2013). Extensive chromosomal reshuffling drives evolution of virulence in an asexual pathogen. Genome Research, 23(8), 1271–1282. [DOI] [PMC free article] [PubMed] [Google Scholar]
- de la Peña, M. V. , Summanen, P. A. M. , Liukkonen, M. , & Kronholm, I. (2022). Chromatin structure influences rate and spectrum of spontaneous mutations in Neurospora crassa . bioRxiv. 10.1101/2022.03.13.484164 [DOI] [PMC free article] [PubMed]
- Dewing, C. , Van der Nest, M. A. , Santana, Q. C. , Proctor, R. H. , Wingfield, B. D. , Steenkamp, E. T. , & De Vos, L. (2022). Characterization of host‐specific genes from pine‐ and grass‐associated species of the species complex. Pathogens, 11(8), 858. 10.3390/pathogens11080858 [DOI] [PMC free article] [PubMed] [Google Scholar]
- Din, A. B. , & Yarden, O. (1994). The Neurospora crassa chs‐2 gene encodes a non‐essential chitin synthase. Microbiology, 140(Pt 9), 2189–2197. [DOI] [PubMed] [Google Scholar]
- Dong, S. , Raffaele, S. , & Kamoun, S. (2015). The two‐speed genomes of filamentous pathogens: Waltz with plants. Current Opinion in Genetics & Development, 35, 57–65. [DOI] [PubMed] [Google Scholar]
- Ellison, C. E. , Hall, C. , Kowbel, D. , Welch, J. , Brem, R. B. , Glass, N. L. , & Taylor, J. W. (2011). Population genomics and local adaptation in wild isolates of a model microbial eukaryote. Proceedings of the National Academy of Sciences of the United States of America, 108(7), 2831–2836. [DOI] [PMC free article] [PubMed] [Google Scholar]
- Endo, K. , Kakiki, K. , & Misato, T. (1970). Mechanism of action of the antifungal agent polyoxin D. Journal of Bacteriology, 104(1), 189–196. [DOI] [PMC free article] [PubMed] [Google Scholar]
- Fedorova, N. D. , Khaldi, N. , Joardar, V. S. , Maiti, R. , Amedeo, P. , Anderson, M. J. , Crabtree, J. , Silva, J. C. , Badger, J. H. , Albarraq, A. , Angiuoli, S. , Bussey, H. , Bowyer, P. , Cotty, P. J. , Dyer, P. S. , Egan, A. , Galens, K. , Fraser‐Liggett, C. M. , Haas, B. J. , … Nierman, W. C. (2008). Genomic islands in the pathogenic filamentous fungus Aspergillus fumigatus . PLoS Genetics, 4(4), e1000046. [DOI] [PMC free article] [PubMed] [Google Scholar]
- Feldman, D. , Kowbel, D. J. , Cohen, A. , Louise Glass, N. , Hadar, Y. , & Yarden, O. (2019). Identification and manipulation of Neurospora crassa genes involved in sensitivity to furfural. Biotechnology for Biofuels, 12(1), 210. 10.1186/s13068-019-1550-4 [DOI] [PMC free article] [PubMed] [Google Scholar]
- Fischbach, M. , & Voigt, C. A. (2010). Prokaryotic gene clusters: A rich toolbox for synthetic biology. Biotechnology Journal, 5(12), 1277–1296. [DOI] [PMC free article] [PubMed] [Google Scholar]
- Frantzeskakis, L. , Kusch, S. , & Panstruga, R. (2019). The need for speed: Compartmentalized genome evolution in filamentous phytopathogens. Molecular Plant Pathology, 20(1), 3–7. [DOI] [PMC free article] [PubMed] [Google Scholar]
- Galagan, J. E. , Calvo, S. E. , Borkovich, K. A. , Selker, E. U. , Read, N. D. , Jaffe, D. , FitzHugh, W. , Ma, L.‐J. , Smirnov, S. , Purcell, S. , Rehman, B. , Elkins, T. , Engels, R. , Wang, S. , Nielsen, C. B. , Butler, J. , Endrizzi, M. , Qui, D. , Ianakiev, P. , … Birren, B. (2003). The genome sequence of the filamentous fungus Neurospora crassa . Nature, 422(6934), 859–868. [DOI] [PubMed] [Google Scholar]
- Galagan, J. E. , & Selker, E. U. (2004). RIP: The evolutionary cost of genome defense. Trends in Genetics: TIG, 20(9), 417–423. [DOI] [PubMed] [Google Scholar]
- Gladieux, P. , De Bellis, F. , Hann‐Soden, C. , Svedberg, J. , Johannesson, H. , & Taylor, J. W. (2020). Neurospora from natural populations: Population genomics insights into the life history of a model microbial eukaryote. In Dutheil J. Y. (Ed.), Statistical population genomics (pp. 313–336). Springer US. [DOI] [PubMed] [Google Scholar]
- Gladyshev, E. (2017). Repeat‐induced point mutation and other genome defense mechanisms in fungi. Microbiology Spectrum, 5(4), 10. 10.1128/microbiolspec.FUNK-0042-2017 [DOI] [PMC free article] [PubMed] [Google Scholar]
- Gladyshev, E. , & Kleckner, N. (2014). Direct recognition of homology between double helices of DNA in Neurospora crassa . Nature Communication., 5, 3509. [DOI] [PMC free article] [PubMed] [Google Scholar]
- Guindon, S. , Dufayard, J.‐F. , Lefort, V. , Anisimova, M. , Hordijk, W. , & Gascuel, O. (2010). New algorithms and methods to estimate maximum‐likelihood phylogenies: Assessing the performance of PhyML 3.0. Systematic Biology, 59(3), 307–321. [DOI] [PubMed] [Google Scholar]
- Gunter, C. (2003). Neurospora: Ripped from the headlines. Nature Reviews Genetics, 4(5), 327. 10.1038/nrg1090 [DOI] [Google Scholar]
- Hartmann, F. E. , Sánchez‐Vallet, A. , McDonald, B. A. , & Croll, D. (2017). A fungal wheat pathogen evolved host specialization by extensive chromosomal rearrangements. The ISME Journal, 11(5), 1189–1204. [DOI] [PMC free article] [PubMed] [Google Scholar]
- Hyde, K. D. , Norphanphoun, C. , Maharachchikumbura, S. S. N. , Bhat, D. J. , Jones, E. B. G. , Bundhun, D. , Chen, Y. J. , Bao, D. F. , Boonmee, S. , Calabon, M. S. , Chaiwan, N. , Chethana, K. W. T. , Dai, D. Q. , Dayarathne, M. C. , Devadatha, B. , Dissanayake, A. J. , Dissanayake, L. S. , Doilom, M. , Dong, W. , … Xiang, M. M. (2020). Refined families of Sordariomycetes. Mycosphere, Journal of Fungal Biology, 11(1), 305–1059. [Google Scholar]
- Jamieson, K. , McNaught, K. J. , Ormsby, T. , Leggett, N. A. , Honda, S. , & Selker, E. U. (2018). Telomere repeats induce domains of H3K27 methylation in Neurospora . eLife, 7, e31216. 10.7554/eLife.31216 [DOI] [PMC free article] [PubMed] [Google Scholar]
- Katoh, K. , Rozewicki, J. , & Yamada, K. D. (2019). MAFFT online service: Multiple sequence alignment, interactive sequence choice and visualization. Briefings in Bioinformatics, 20(4), 1160–1166. [DOI] [PMC free article] [PubMed] [Google Scholar]
- Kim, T.‐S. , Booth, J. G. , Gauch, H. G., Jr. , Sun, Q. , Park, J. , Lee, Y.‐H. , & Lee, K. (2008). Simple sequence repeats in Neurospora crassa: Distribution, polymorphism and evolutionary inference. BMC Genomics, 9, 31. [DOI] [PMC free article] [PubMed] [Google Scholar]
- Koch, L. , Lodin, A. , Herold, I. , Ilan, M. , Carmeli, S. , & Yarden, O. (2014). Sensitivity of Neurospora crassa to a marine‐derived Aspergillus tubingensis anhydride exhibiting antifungal activity that is mediated by the MAS1 protein. Marine Drugs, 12(9), 4713–4731. [DOI] [PMC free article] [PubMed] [Google Scholar]
- Koide, Y. , Ogino, A. , Yoshikawa, T. , Kitashima, Y. , Saito, N. , Kanaoka, Y. , Onishi, K. , Yoshitake, Y. , Tsukiyama, T. , Saito, H. , Teraishi, M. , Yamagata, Y. , Uemura, A. , Takagi, H. , Hayashi, Y. , Abe, T. , Fukuta, Y. , Okumoto, Y. , & Kanazawa, A. (2018). Lineage‐specific gene acquisition or loss is involved in interspecific hybrid sterility in rice. Proceedings of the National Academy of Sciences of the United States of America, 115(9), E1955–E1962. [DOI] [PMC free article] [PubMed] [Google Scholar]
- Langfelder, P. , & Horvath, S. (2008). WGCNA: An R package for weighted correlation network analysis. BMC Bioinformatics, 9(1), 559. 10.1186/1471-2105-9-559 [DOI] [PMC free article] [PubMed] [Google Scholar]
- Lehr, N. A. , Wang, Z. , Li, N. , Hewitt, D. A. , López‐Giráldez, F. , Trail, F. , & Townsend, J. P. (2014). Gene expression differences among three Neurospora species reveal genes required for sexual reproduction in Neurospora crassa . PLoS One, 9(10), e110398. [DOI] [PMC free article] [PubMed] [Google Scholar]
- Lejeune, J. , Brachet, G. , & Watier, H. (2019). Evolutionary story of the low/medium‐affinity IgG fc receptor gene cluster. Frontiers in Immunology, 10, 1297. 10.3389/fimmu.2019.01297 [DOI] [PMC free article] [PubMed] [Google Scholar]
- Lespinet, O. , Wolf, Y. I. , Koonin, E. V. , & Aravind, L. (2002). The role of lineage‐specific gene family expansion in the evolution of eukaryotes. Genome Research, 12(7), 1048–1059. [DOI] [PMC free article] [PubMed] [Google Scholar]
- Lofgren, L. A. , Ross, B. S. , Cramer, R. A. , & Stajich, J. E. (2022). The pan‐genome of Aspergillus fumigatus provides a high‐resolution view of its population structure revealing high levels of lineage‐specific diversity driven by recombination. PLoS Biology, 20(11), e3001890. [DOI] [PMC free article] [PubMed] [Google Scholar]
- Long, M. , Betrán, E. , Thornton, K. , & Wang, W. (2003). The origin of new genes: Glimpses from the young and old. Nature Reviews. Genetics, 4(11), 865–875. [DOI] [PubMed] [Google Scholar]
- Luna, S. K. , & Chain, F. J. J. (2021). Lineage‐specific genes and family expansions in dictyostelid genomes display expression bias and evolutionary diversification during development. Genes, 12(10), 1628. 10.3390/genes12101628 [DOI] [PMC free article] [PubMed] [Google Scholar]
- Madeira, F. , Pearce, M. , Tivey, A. R. N. , Basutkar, P. , Lee, J. , Edbali, O. , Madhusoodanan, N. , Kolesnikov, A. , & Lopez, R. (2022). Search and sequence analysis tools services from EMBL‐EBI in 2022. Nucleic Acids Research, 50(W1), W276–W279. [DOI] [PMC free article] [PubMed] [Google Scholar]
- Maltseva, A. L. , Lobov, A. A. , Pavlova, P. A. , Panova, M. , Gafarova, E. R. , Marques, J. P. , Danilov, L. G. , & Granovitch, A. I. (2022). Orphan gene in Littorina: An unexpected role of symbionts in the host evolution. Gene, 824(146), 389. [DOI] [PubMed] [Google Scholar]
- McDonagh, A. , Fedorova, N. D. , Crabtree, J. , Yu, Y. , Kim, S. , Chen, D. , Loss, O. , Cairns, T. , Goldman, G. , Armstrong‐James, D. , Haynes, K. , Haas, H. , Schrettl, M. , May, G. , Nierman, W. C. , & Bignell, E. (2008). Sub‐telomere directed gene expression during initiation of invasive aspergillosis. PLoS Pathogens, 4(9), e1000154. [DOI] [PMC free article] [PubMed] [Google Scholar]
- McLysaght, A. , & Guerzoni, D. (2015). New genes from non‐coding sequence: The role of de novo protein‐coding genes in eukaryotic evolutionary innovation. Philosophical Transactions of the Royal Society of London. Series B, Biological Sciences, 370(1678), 20140332. [DOI] [PMC free article] [PubMed] [Google Scholar]
- McLysaght, A. , & Hurst, L. D. (2016). Open questions in the study of de novo genes: What, how and why. Nature Reviews Genetics, 17(9), 567–578. 10.1038/nrg.2016.78 [DOI] [PubMed] [Google Scholar]
- Paradis, E. , & Schliep, K. (2019). Ape 5.0: An environment for modern phylogenetics and evolutionary analyses in R. Bioinformatics, 35(3), 526–528. 10.1093/bioinformatics/bty633 [DOI] [PubMed] [Google Scholar]
- Pazos Obregón, F. , Soto, P. , Lavín, J. L. , Cortázar, A. R. , Barrio, R. , Aransay, A. M. , & Cantera, R. (2018). Cluster locator, online analysis and visualization of gene clustering. Bioinformatics, 34(19), 3377–3379. [DOI] [PubMed] [Google Scholar]
- Plissonneau, C. , Stürchler, A. , & Croll, D. (2016). The evolution of orphan regions in genomes of a fungal pathogen of wheat. mBio, 7(5), e01231‐16. 10.1128/mBio.01231-16 [DOI] [PMC free article] [PubMed] [Google Scholar]
- Puértolas‐Balint, F. , Rossen, J. W. A. , Oliveira Dos Santos, C. , Chlebowicz, M. M. A. , Raangs, E. C. , van Putten, M. L. , Sola‐Campoy, P. J. , Han, L. , Schmidt, M. , & García‐Cobos, S. (2019). Revealing the virulence potential of clinical and environmental isolates using whole‐genome sequencing. Frontiers in Microbiology, 10, 1970. [DOI] [PMC free article] [PubMed] [Google Scholar]
- Rahnama, M. , Wang, B. , Dostart, J. , Novikova, O. , Yackzan, D. , Yackzan, A. , Bruss, H. , Baker, M. , Jacob, H. , Zhang, X. , Lamb, A. , Stewart, A. , Heist, M. , Hoover, J. , Calie, P. , Chen, L. , Liu, J. , & Farman, M. L. (2021). Telomere roles in fungal genome evolution and adaptation. Frontiers in Genetics, 12(676), 751. [DOI] [PMC free article] [PubMed] [Google Scholar]
- Rep, M. , & Kistler, H. C. (2010). The genomic organization of plant pathogenicity in Fusarium species. Current Opinion in Plant Biology, 13(4), 420–426. [DOI] [PubMed] [Google Scholar]
- Rieseberg, L. H. (2001). Chromosomal rearrangements and speciation. Trends in Ecology and Evolution, 16(7), 351–358. [DOI] [PubMed] [Google Scholar]
- Rogers, R. L. , & Hartl, D. L. (2012). Rapid evolution via chimeric genes. In Singh R. S., Xu J., & R. J. Kulathinal (Eds.), Rapidly evolving genes and genetic systems (pp. 94–100). Oxford Academic. 10.1093/acprof:oso/9780199642274.003.0010 [DOI] [Google Scholar]
- Ronquist, F. , Teslenko, M. , van der Mark, P. , Ayres, D. L. , Darling, A. , Höhna, S. , Larget, B. , Liu, L. , Suchard, M. A. , & Huelsenbeck, J. P. (2012). MrBayes 3.2: Efficient Bayesian phylogenetic inference and model choice across a large model space. Systematic Biology, 61(3), 539–542. [DOI] [PMC free article] [PubMed] [Google Scholar]
- Ruiz‐Orera, J. , Hernandez‐Rodriguez, J. , Chiva, C. , Sabidó, E. , Kondova, I. , Bontrop, R. , Marqués‐Bonet, T. , & Albà, M. M. (2015). Origins of de novo genes in human and chimpanzee. PLoS Genetics, 11(12), e1005721. [DOI] [PMC free article] [PubMed] [Google Scholar]
- Ruiz‐Orera, J. , Verdaguer‐Grau, P. , Villanueva‐Cañas, J. L. , Messeguer, X. , & Albà, M. M. (2018). Translation of neutrally evolving peptides provides a basis for de novo gene evolution. Nature Ecology & Evolution, 2(5), 890–896. [DOI] [PubMed] [Google Scholar]
- Schoch, C. L. , Sung, G.‐H. , López‐Giráldez, F. , Townsend, J. P. , Miadlikowska, J. , Hofstetter, V. , Robbertse, B. , Matheny, P. B. , Kauff, F. , Wang, Z. , Gueidan, C. , Andrie, R. M. , Trippe, K. , Ciufetti, L. M. , Wynns, A. , Fraker, E. , Hodkinson, B. P. , Bonito, G. , Groenewald, J. Z. , … Spatafora, J. W. (2009). The Ascomycota tree of life: A phylum‐wide phylogeny clarifies the origin and evolution of fundamental reproductive and ecological traits. Systematic Biology, 58(2), 224–239. [DOI] [PubMed] [Google Scholar]
- Shannon, P. , Markiel, A. , Ozier, O. , Baliga, N. S. , Wang, J. T. , Ramage, D. , Amin, N. , Schwikowski, B. , & Ideker, T. (2003). Cytoscape: A software environment for integrated models of biomolecular interaction networks. Genome Research, 13(11), 2498–2504. [DOI] [PMC free article] [PubMed] [Google Scholar]
- Siafakas, A. R. , Sorrell, T. C. , Wright, L. C. , Wilson, C. , Larsen, M. , Boadle, R. , Williamson, P. R. , & Djordjevic, J. T. (2007). Cell wall‐linked cryptococcal phospholipase B1 is a source of secreted enzyme and a determinant of cell wall integrity. The Journal of Biological Chemistry, 282(52), 37508–37514. [DOI] [PubMed] [Google Scholar]
- Singh, P. K. , Iyer, S. V. , Ramakrishnan, M. , & Kasbekar, D. P. (2009). Chromosome segment duplications in Neurospora crassa: Barren crosses beget fertile science. BioEssays: News and Reviews in Molecular, Cellular and Developmental Biology, 31(2), 209–219. [DOI] [PubMed] [Google Scholar]
- Singh, P. K. , & Kasbekar, D. P. (2008). Titration of repeat‐induced point mutation (RIP) by chromosome segment duplications in Neurospora crassa . Genetica, 134(3), 267–275. 10.1007/s10709-007-9234-6 [DOI] [PubMed] [Google Scholar]
- Slot, J. C. (2017). Fungal gene cluster diversity and evolution. Advances in Genetics, 100, 141–178. 10.1016/bs.adgen.2017.09.005 [DOI] [PubMed] [Google Scholar]
- Slot, J. C. , & Rokas, A. (2011). Horizontal transfer of a large and highly toxic secondary metabolic gene cluster between fungi. Current Biology: CB, 21(2), 134–139. [DOI] [PubMed] [Google Scholar]
- Stothard, P. (2000). The sequence manipulation suite: JavaScript programs for analyzing and formatting protein and DNA sequences. BioTechniques, 28(6), 1102–1104. [DOI] [PubMed] [Google Scholar]
- Strohl, W. (2017). Chimeric genes, proteins. In Reference module in life sciences. Elsevier. 10.1016/b978-0-12-809633-8.06199-9 [DOI] [Google Scholar]
- Sun, X. , Wang, F. , Lan, N. , Liu, B. , Hu, C. , Xue, W. , Zhang, Z. , & Li, S. (2019). The Zn(II)2Cys6‐type transcription factor ADA‐6 regulates conidiation, sexual development, and oxidative stress response in Neurospora crassa . Frontiers in Microbiology, 10, 750. 10.3389/fmicb.2019.00750 [DOI] [PMC free article] [PubMed] [Google Scholar]
- Talavera, G. , & Castresana, J. (2007). Improvement of phylogenies after removing divergent and ambiguously aligned blocks from protein sequence alignments. Systematic Biology, 56(4), 564–577. [DOI] [PubMed] [Google Scholar]
- Tautz, D. , & Domazet‐Lošo, T. (2011). The evolutionary origin of orphan genes. Nature Reviews. Genetics, 12(10), 692–702. [DOI] [PubMed] [Google Scholar]
- Toll‐Riera, M. , Bosch, N. , Bellora, N. , Castelo, R. , Armengol, L. , Estivill, X. , & Albà, M. M. (2009). Origin of primate orphan genes: A comparative genomics approach. Molecular Biology and Evolution, 26(3), 603–612. [DOI] [PubMed] [Google Scholar]
- Trowsdale, J. (2002). The gentle art of gene arrangement: The meaning of gene clusters. Genome Biology, 3(3), comment2002.1. [DOI] [PMC free article] [PubMed] [Google Scholar]
- Vakirlis, N. , Carvunis, A.‐R. , & McLysaght, A. (2020). Synteny‐based analyses indicate that sequence divergence is not the main source of orphan genes. eLife, 9, e53500. [DOI] [PMC free article] [PubMed] [Google Scholar]
- Vakirlis, N. , Hebert, A. S. , Opulente, D. A. , Achaz, G. , Hittinger, C. T. , Fischer, G. , Coon, J. J. , & Lafontaine, I. (2018). A molecular portrait of de novo genes in yeasts. Molecular Biology and Evolution, 35(3), 631–645. [DOI] [PMC free article] [PubMed] [Google Scholar]
- Van Oss, S. B. , & Carvunis, A.‐R. (2019). De novo gene birth. PLoS Genetics, 15(5), e1008160. [DOI] [PMC free article] [PubMed] [Google Scholar]
- van Wyk, S. , Harrison, C. H. , Wingfield, B. D. , De Vos, L. , van der Merwe, N. A. , & Steenkamp, E. T. (2019). The RIPper, a web‐based tool for genome‐wide quantification of repeat‐induced point (RIP) mutations. PeerJ, 7, e7447. [DOI] [PMC free article] [PubMed] [Google Scholar]
- Wacker, T. , Helmstetter, N. , Wilson, D. , Fisher, M. C. , Studholme, D. J. , & Farrer, R. A. (2023). Two‐speed genome evolution drives pathogenicity in fungal pathogens of animals. Proceedings of the National Academy of Sciences of the United States of America, 120(2), e2212633120. [DOI] [PMC free article] [PubMed] [Google Scholar]
- Wang, B. , Cai, P. , Sun, W. , Li, J. , Tian, C. , & Ma, Y. (2015). A transcriptomic analysis of Neurospora crassa using five major crop residues and the novel role of the sporulation regulator rca‐1 in lignocellulase production. Biotechnology for Biofuels, 8, 21. [DOI] [PMC free article] [PubMed] [Google Scholar]
- Wang, L. , Sun, Y. , Sun, X. , Yu, L. , Xue, L. , He, Z. , Huang, J. , Tian, D. , Hurst, L. D. , & Yang, S. (2020). Repeat‐induced point mutation in Neurospora crassa causes the highest known mutation rate and mutational burden of any cellular life. Genome Biology, 21(1), 142. [DOI] [PMC free article] [PubMed] [Google Scholar]
- Wang, Z. , Gudibanda, A. , Ugwuowo, U. , Trail, F. , & Townsend, J. P. (2018). Using evolutionary genomics, transcriptomics, and systems biology to reveal gene networks underlying fungal development. Fungal Biology Reviews, 32(4), 249–264. 10.1016/j.fbr.2018.02.001 [DOI] [Google Scholar]
- Wang, Z. , Kim, W. , Wang, Y.‐W. , Yakubovich, E. , Dong, C. , Trail, F. , Townsend, J. P. , & Yarden, O. (2023). The Sordariomycetes: An expanding resource with big data for mining in evolutionary genomics and transcriptomics. Frontiers in Fungal Biology, 4, 1214537. [DOI] [PMC free article] [PubMed] [Google Scholar]
- Wang, Z. , Lopez‐Giraldez, F. , Lehr, N. , Farré, M. , Common, R. , Trail, F. , & Townsend, J. P. (2014). Global gene expression and focused knockout analysis reveals genes associated with fungal fruiting body development in Neurospora crassa . Eukaryotic Cell, 13(1), 154–169. [DOI] [PMC free article] [PubMed] [Google Scholar]
- Wang, Z. , López‐Giráldez, F. , Wang, J. , Trail, F. , & Townsend, J. P. (2019). Integrative activity of mating loci, environmentally responsive genes, and secondary metabolism pathways during sexual development of Chaetomium globosum . mBio, 10(6), e02119‐19. 10.1128/mBio.02119-19 [DOI] [PMC free article] [PubMed] [Google Scholar]
- Wang, Z. , Miguel‐Rojas, C. , Lopez‐Giraldez, F. , Yarden, O. , Trail, F. , & Townsend, J. P. (2019). Metabolism and development during conidial germination in response to a carbon‐nitrogen‐rich synthetic or a natural source of nutrition in Neurospora crassa . mBio, 10(2), e00192‐19. 10.1128/mBio.00192-19 [DOI] [PMC free article] [PubMed] [Google Scholar]
- Wang, Z. , Wang, Y. , Kasuga, T. , Wang, Y.‐W. , Lopez‐Giraldez, F. , Zhang, Y. , Zhang, Z. , Dong, C. , Sil, A. , Trail, F. , Yarden, O. , & Townsend, J. P. (2022). Lineage‐specific genes are clustered with allorecognition loci and respond to G × E factors regulating the switch from asexual to sexual reproduction in Neurospora . bioRxiv. 10.1101/2022.06.10.495464 [DOI]
- Weisman, C. M. , Murray, A. W. , & Eddy, S. R. (2020). Many but not all lineage‐specific genes can be explained by homology detection failure. PLoS Biology, 18(11), e3000862. [DOI] [PMC free article] [PubMed] [Google Scholar]
- Whelan, S. , & Goldman, N. (2001). A general empirical model of protein evolution derived from multiple protein families using a maximum‐likelihood approach. Molecular Biology and Evolution, 18(5), 691–699. [DOI] [PubMed] [Google Scholar]
- Wissler, L. , Gadau, J. , Simola, D. F. , Helmkampf, M. , & Bornberg‐Bauer, E. (2013). Mechanisms and dynamics of orphan gene emergence in insect genomes. Genome Biology and Evolution, 5(2), 439–455. [DOI] [PMC free article] [PubMed] [Google Scholar]
- Wu, C. , Kim, Y.‐S. , Smith, K. M. , Li, W. , Hood, H. M. , Staben, C. , Selker, E. U. , Sachs, M. S. , & Farman, M. L. (2009). Characterization of chromosome ends in the filamentous fungus Neurospora crassa . Genetics, 181(3), 1129–1145. [DOI] [PMC free article] [PubMed] [Google Scholar]
- Wu, C. , Yang, F. , Smith, K. M. , Peterson, M. , Dekhang, R. , Zhang, Y. , Zucker, J. , Bredeweg, E. L. , Mallappa, C. , Zhou, X. , Lyubetskaya, A. , Townsend, J. P. , Galagan, J. E. , Freitag, M. , Dunlap, J. C. , Bell‐Pedersen, D. , & Sachs, M. S. (2014). Genome‐wide characterization of light‐regulated genes in Neurospora crassa . G3, 4(9), 1731–1745. [DOI] [PMC free article] [PubMed] [Google Scholar]
- Xiong, Y. , Wu, V. W. , Lubbe, A. , Qin, L. , Deng, S. , Kennedy, M. , Bauer, D. , Singan, V. R. , Barry, K. , Northen, T. R. , Grigoriev, I. V. , & Glass, N. L. (2017). A fungal transcription factor essential for starch degradation affects integration of carbon and nitrogen metabolism. PLoS Genetics, 13(5), e1006737. [DOI] [PMC free article] [PubMed] [Google Scholar]
- Yi, G. , Sze, S.‐H. , & Thon, M. R. (2007). Identifying clusters of functionally related genes in genomes. Bioinformatics, 23(9), 1053–1060. 10.1093/bioinformatics/btl673 [DOI] [PubMed] [Google Scholar]
- Zhang, B. , & Horvath, S. (2005). A general framework for weighted gene co‐expression network analysis. Statistical Applications in Genetics and Molecular Biology, 4, Article 17. [DOI] [PubMed] [Google Scholar]
- Zhang, L. , Ren, Y. , Yang, T. , Li, G. , Chen, J. , Gschwend, A. R. , Yu, Y. , Hou, G. , Zi, J. , Zhou, R. , Wen, B. , Zhang, J. , Chougule, K. , Wang, M. , Copetti, D. , Peng, Z. , Zhang, C. , Zhang, Y. , Ouyang, Y. , … Long, M. (2019). Rapid evolution of protein diversity by de novo origination in Oryza . Nature Ecology & Evolution, 3(4), 679–690. 10.1038/s41559-019-0822-5 [DOI] [PubMed] [Google Scholar]
- Zhang, W. , Gao, Y. , Long, M. , & Shen, B. (2019). Origination and evolution of orphan genes and de novo genes in the genome of Caenorhabditis elegans . Science China. Life Sciences, 62(4), 579–593. [DOI] [PubMed] [Google Scholar]
- Zhang, Y. , Yang, H. , Turra, D. , Zhou, S. , Ayhan, D. H. , DeIulio, G. A. , Guo, L. , Broz, K. , Wiederhold, N. , Coleman, J. J. , Donnell, K. O. , Youngster, I. , McAdam, A. J. , Savinov, S. , Shea, T. , Young, S. , Zeng, Q. , Rep, M. , Pearlman, E. , … Ma, L.‐J. (2020). The genome of opportunistic fungal pathogen Fusarium oxysporum carries a unique set of lineage‐specific chromosomes. Communications Biology, 3(1), 50. [DOI] [PMC free article] [PubMed] [Google Scholar]
- Zhang, Z. , López‐Giráldez, F. , & Townsend, J. P. (2010). LOX: Inferring level of eXpression from diverse methods of census sequencing. Bioinformatics, 26(15), 1918–1919. [DOI] [PMC free article] [PubMed] [Google Scholar]
- Znameroski, E. A. , Coradetti, S. T. , Roche, C. M. , Tsai, J. C. , Iavarone, A. T. , Cate, J. H. D. , & Glass, N. L. (2012). Induction of lignocellulose‐degrading enzymes in Neurospora crassa by cellodextrins. Proceedings of the National Academy of Sciences of the United States of America, 109(16), 6012–6017. [DOI] [PMC free article] [PubMed] [Google Scholar]
Associated Data
This section collects any data citations, data availability statements, or supplementary materials included in this article.
Supplementary Materials
Figure S1
Figure S2
Figure S3
Figure S4
Table S1
Table S2
Table S3
Table S4
Table S5
Data Availability Statement
Transcriptomic data of Neurospora crassa revisited in this study are available at the Gene Expression Omnibus database (ncbi.nlm.nih.gov/geo; GEO database), including data generated for examining the sexual development (GSE41484), asexual growth (GSE101412), responses to light (GSE53534), growth under different nutrients (92848, 95350, 44100, 35227), and additional gene manipulation effects on cell‐to‐cell communication and plant cell wall deconstruction (GSR68514, SRP133627). Additional data were available via the cited references, including N. crassa growth in respond to furfural (Feldman et al., 2019), roles of transcription factor ADA‐6 (Sun et al., 2019), and lignocellulose degradation (Znameroski et al., 2012). All processed data are available from the supplementary data files (Table S4).