

Abstract
A stimuli‐responsive protein self‐assembly offers promising utility as a protein nanocage for biotechnological and medical applications. Herein, the development of a virus‐like particle (VLP) that undergoes a transition between assembly and disassembly under a neutral and acidic pH, respectively, for a targeted delivery is reported. The structure of the bacteriophage P22 coat protein is used for the computational design of coat subunits that self‐assemble into a pH‐responsive VLP. Subunit designs are generated through iterative computational cycles of histidine substitutions and evaluation of the interaction energies among the subunits under an acidic and neutral pH. The top subunit designs are tested and one that is assembled into a VLP showing the highest pH‐dependent structural transition is selected. The cryo‐EM structure of the VLP is determined, and the structural basis of a pH‐triggered disassembly is delineated. The utility of the designed VLP is exemplified through the targeted delivery of a cytotoxic protein cargo into tumor cells in a pH‐dependent manner. These results provide strategies for the development of self‐assembling protein architectures with new functionality for diverse applications.
Keywords: computational design, pH‐responsive assembly, targeted delivery, virus‐like particle
A virus‐like particle (VLP) showing pH‐responsive assembly and disassembly is developed for targeted drug delivery through the computational design of bacteriophage P22 coat proteins. The underlying mechanism for the pH responsiveness of the designed VLP is demonstrated by determining its cryo‐EM structure. The utility of the VLP is exemplified by the pH‐dependent delivery of a tumor‐targeting cytotoxic protein.

1. Introduction
Protein self‐assemblies showing well‐organized and cage‐like architectures have significant utility as containers for cascade catalysis, vehicles for gene/drug delivery, scaffolds for vaccines, and bioimaging.[ 1 , 2 , 3 , 4 , 5 ] Typical features of such protein self‐assemblies, such as the caged‐structure and engineering flexibility, offer distinct advantages over other types of protein assemblies as well as organic/inorganic assemblies. A variety of naturally occurring protein assemblies, including ferritin, viral capsids, chaperones, and lumazine synthase, have been explored for diverse purposes.[ 6 , 7 ] In particular, virus‐like particles (VLPs) with diameters ranging from 50 to 100 nm, which self‐assemble from viral capsid proteins, including bacteriophage P22, MS2, cowpea mosaic virus, brome mosaic virus, and tobacco mosaic virus, have been of significant interest in vaccine development and gene delivery, providing inspiration in the design of diverse protein self‐assemblies.[ 8 , 9 , 10 , 11 , 12 , 13 , 14 , 15 ] Nonetheless, the design and engineering of VLPs with specific functionalities and properties remain a challenge, mainly owing to their structural complexity and large size.
Stimuli‐responsive protein self‐assemblies that undergo a structural transition in response to specific stimuli have attracted considerable attention for a wide range of applications, as specific functions of such assemblies can be controlled in a spatial and temporal manner.[ 16 , 17 , 18 ] Among diverse stimuli, the pH has been most widely explored because of significant heterogeneity in local pH values occuring in physiological environments such as the endosome/lysosome and a tumor microenvironment with a lower acidic pH (6.5–6.8).[ 19 , 20 , 21 , 22 ] Notably, pH‐responsive assemblies allow for a general strategy targeting highly heterogeneous tumor types. The pH‐sensitive protein assemblies, such as ferritin and encapsulin, have been developed by introducing a pH‐responsive GALA peptide or His6 motifs at the interfaces of the subunits using a random or rational process.[ 16 , 18 , 23 , 24 ] Homotrimers and heterodimers were de novo designed to undergo the conformational change at an acidic pH as the network of histidine residues became protonated.[ 25 ] Despite many advances, however, the development of stimuli‐responsive protein self‐assemblies comprising hundreds of subunits has been restricted owing to the difficulty in accurately predicting and modulating sophisticated interactions between subunits in a desired stimuli‐sensitive manner due to the complexity and size of protein assemblies.
Herein, we present the development of a pH‐responsive VLP showing a structural transition between assembly and disassembly under a neutral and acidic pH, respectively, for a targeted delivery through a computational approach (Figure 1a). The structure of a bacteriophage P22 protein coat with an icosahedral architecture was employed for the design of coat subunits that self‐assemble into a pH‐responsive VLP. Subunit designs with varying histidine mutation sites were generated through iterative computational cycles of histidine substitutions and evaluation of the interaction energies among subunits under both an acidic and neutral pH. We tested the top subunit designs and selected the best candidate that self‐assembled into a VLP showing the highest pH‐responsiveness. The cryo‐electron microscopy (cryo‐EM) structure of the pH‐responsive VLP was determined to demonstrate the structural basis for a pH‐triggered disassembly. The utility of the VLP was shown by the targeted delivery of a protein cargo into tumor cells in a pH‐dependent manner. Details are reported herein.
Figure 1.

Development of a pH‐responsive VLP through a computational approach. a) Schematic illustration of the pH‐dependent assembly and disassembly of a VLP. b) Cryo‐EM structure of bacteriophage P22 protein coat (PDB: 5UU5). Dashed line indicates an asymmetric unit (ASU) comprising seven identical subunits. c) Iterative computational cycles for the design of a subunit that assembles into a pH‐responsive VLP: Step 1) Calculate the interaction energies for the ASU at pH 7.4 and 5.0 (ΔG IE 7.4 and ΔG IE 5.0) as well as their differences (ΔΔ GIE 5.0–7.4) using FoldX as single histidine mutations are introduced. Predict the subunit sites that satisfy the criteria. Step 2) Introduce a single histidine mutation into the predicted sites and select the ASU models with higher differences in the interaction energies. Step 3) Repeat step 2 until the differences in the interaction energies no longer increase as single histidine mutations are introduced into the selected ASU models. Step 4) Identify key sites at a subunit for histidine substitutions, introduce multiple histidine mutations, and select the top‐10 subunit designs based on the interaction energies. The locations of the nine finally selected key sites are shown in the subunit in bottom‐right panel.
2. Results and Discussion
2.1. Design of a Coat Protein Subunit for a pH‐Responsive VLP
To design coat protein subunits that self‐assemble into a pH‐responsive VLP based on a computational approach, we used the structure of the bacteriophage P22 protein coat (Figure 1b).[ 26 , 27 , 28 , 29 , 30 , 31 ] We hypothesized that the design of a coat protein subunit that shows an association and dissociation in response to pH changes will eventually result in a pH‐responsive VLP. Thus, as a simpler approach with significantly reduced computational time, the coat protein subunits were computationally designed based on an asymmetric subunit (ASU) comprising seven identical subunits instead of a whole coat protein. Our design approach was to identify key sites at the ASU for histidine substitutions and induce a disruption of histidine‐containing hydrogen‐bond networks at the subunit interfaces under an acidic pH through histidine protonation and a consequent dissociation of the ASU. An imidazole group of a histidine group has a pKa of ≈6.0, and protonation of an imidazole group under an acidic pH would lead to repulsion between positively charged residues and a consequent disruption of hydrogen‐bond networks. The subunit design steps based on the ASU are shown in Figure 1c.
We first conducted a single histidine subsitution for each site of 430 residues at a subunit of the P22 protein coat, and built the ASU models comprising seven subunits using FoldX, followed by calculation of the interaction energies in kcal mol−1 at pH 5.0 and 7.4 ( and ) along with their differences () using FoldX.[ 32 ] Based on the calculated energies, we selected the ASU models satisfying the certain criteria ( < , < 10, and 1.3 < ), and predicted 37 sites at the subunit that appear to disrupt the interactions among the subunits at pH 5.0. The top ASU models with a single histidine mutation showing the largest were selected for the next round of histidine substitution, since such ASU models are expected to have a higher tendency to dissociate at pH 5.0. An additional histidine mutation was introduced into the remaining 36 predicted sites of the ASU since one of the 37 predicted sites is already mutated, resulting in ASU models with double histidine mutations. Following the interaction energy calculations, the top‐20 ASU models with the largest were selected. By repeating this process, we observed that no longer increased when six histidine mutations were introduced. Hence, we used the top 20 models with five histidine mutations from the previous step, and introduced the sixth histidine mutation to the rest of the remaining 32 predicted sites (five of the 37 predicted sites are already mutated). After removing the models with the same redundant mutations, we obtained 238 ASU models with six unique histidine mutation combinations at the subunit. To identify the most crucial sites affecting the dissociation of an ASU at pH 5.0, we checked the frequencies of the respective mutation sites in the 238 ASU variants based on (Figure S1, Supporting Information). As a result, 9 residues at the subunit (N287, L182, Q53, S43, E153, A149, N84, E54, and A67) were selected as the most frequently occurring mutations and predictably the most significant mutation sites to elicit pH sensitivity (Table S1, Supporting Information). Not surprisingly, all selected residues are located at the interface of the subunits (Figure 1c).
Through the combinatorial substitution of the most frequently occurring nine selected sites, new set of ASU models was created. From an ASU model containing a combination of one to seven of the nine selected sites, a total of 501 ASU models were built, and their interaction energies at pH 7.4 and 5.0 were calculated. At this stage, free energy changes at pH 7.4 (), which are related to the stability of an ASU, were considered for soluble expression and the association of an ASU in addition to . Based on these energies, the top‐10 ASU designs satisfying the criteria (< 15 and > 20) were finally selected, having histidine mutation sites ranging from 5 to 7 at the subunit (Figure S2 and Table S2, Supporting Information). Interestingly, three of the nine mutation sites (E54, E153, and N287) are conserved in the top‐10 ASU models, which suggests that such conserved sites play a critical role in the pH‐dependent dissociation and association of the ASU (Figure 2a). Thus, the 10 respective subunit designs from the top‐10 ASU models were tested in terms of their self‐assembly into a pH‐responsive VLP.
Figure 2.

Assembly and disassembly of respective VLPs from ten subunit designs in response to pH changes. a) Conservation of key sites in the ten subunit designs. b) Schematic illustration of a VLP containing a cargo‐fused scaffolding protein. eGFP was used as a protein cargo and genetically fused to the N‐terminus of a truncated scaffolding protein. c) Each of the ten subunit designs and the wild‐type (48 kDa) were co‐expressed with an eGFP‐fused scaffolding protein (eGFP‐SP, 37 kDa) in E. coli, and the pellet was analyzed on SDS/PAGE after ultracentrifugation. Sol, supernatants after sonication; Sup, supernatants after ultracentrifugation; and Pel, pellet after ultracentrifugation. CP indicates a coat protein. d) Representative SDS/PAGE analyses of five pH‐responsive VLPs after ultracentrifugation. The wild‐type VLP was used as control. Bf, supernatants before ultracentrifugation; Af, supernatants after ultracentrifugation. e) The remaining amounts of coat proteins in the supernatants of VLPs at pH 7.4 and pH 5.0 after ultracentrifugation. The error bars show the standard deviations in triplicate experiments.
2.2. Selection of Subunit Designs Self‐Assembling into a pH‐Responsive VLP
To select the best subunit design among the ten candidates, we co‐expressed each subunit design with a truncated scaffolding protein (SP) in Escherichia coli (E. coli). A scaffolding protein is known to direct subunit assembly and encapsulate a fused protein inside a protein coat through charge interactions.[ 33 , 34 ] To simply monitor the assembly and disassembly of VLPs in response to pH changes, enhanced green fluorescent protein (eGFP) was genetically fused to the N‐terminus of a truncated scaffolding protein, resulting in the fusion construct eGFP‐SP (Figure 2b). SDS/PAGE analyses showed that, despite multiple histidine mutations, all subunit designs were expressed in a soluble form (Figure 2c; Figure S3, Supporting Information). As self‐assembled VLPs are separated in the pellet through ultracentrifugation, we checked the assembly of the VLPs by analyzing the pellet on SDS/PAGE after ultracentrifugation. Among the ten subunit designs, 5 (5H_2, 5H_3, 5H_4, 5H_5, and 6H_3) were observed to self‐assemble into a VLP at pH 7.4 when co‐expressed with an eGFP‐fused scaffolding protein (eGFP‐SP) similar to a wild‐type subunit (Figure 2c). By contrast, the rest of the subunit designs (5H_1, 5H_6, 6H_1, 6H_2, and 7H_1) did not assemble into a VLP probably owing to a lack of proper interactions between subunits even at a neutral pH.
We next tested whether self‐assembled VLPs from the five respective subunit designs (i.e., 5H_2, 5H_3, 5H_4, 5H_5, and 6H_3) would disassemble at pH 5.0. Although self‐assembled VLPs are separated in the pellet through ultracentrifugation, disassembled subunits and eGFP‐SP will exist in the supernatants. Respective VLPs from each subunit design were dialyzed at pH 5.0, followed by ultracentrifugation with a 20% sucrose cushion, and the supernatants were analyzed on SDS/PAGE (Figure 2d; Figure S4, Supporting Information). The VLPs from the five designs showed significant amounts of coat proteins in the supernatants at pH 5.0 after ultracentrifugation, whereas negligible coat proteins were observed in the wild‐type VLP even at pH 5.0. The amounts of a cargo protein encapsulated in the VLPs were relatively small compared to the coat proteins, and the band intensity corresponding to a cargo protein seemed to be extremely low. These results indicate that the five subunit designs (5H_2, 5H_3, 5H_4, 5H_5, and 6H_3) self‐assembled into a VLP at pH 7.4, and the resulting VLPs disassembled at pH 5.0. To obtain insight into the disassembly extents of the VLPs from the five subunit designs, we quantified the relative amounts of coat proteins in the supernatants by measuring the band intensities on SDS/PAGE using a densitometry (Figure 2e). The 5H_3 VLP, which had self‐assembled from the 5H_3 subunit design, exhibited the thickest band in the supernatants, indicating the highest extent of disassembly at pH 5.0. The relative portion of proteins from the 5H_3 VLP in the supernatants at pH 5.0 was estimated to be 67% of the total amount of proteins, whereas the other VLPs ranged from 14% to 21%. The numbers of eGFP‐SP molecules encapsulated inside the 5H_3 VLP and the wild‐type were calculated as 65 and 88 on average, respectively, based on an SDS/PAGE analysis. The 5H_3 VLP showing the most significant pH‐dependent structural transition was finally chosen for further experiments.
2.3. The pH‐Dependent Behavior of the 5h_3 VLP
We examined the disassembly of the 5H_3 VLP and the wild‐type at pH 7.4 and pH 5.0 using negative stain transmission electron microscopy (TEM) (Figure 3a). The wild‐type VLP was observed to have a monodispersed spherical shape with a size of 60 nm at both pH 7.4 and 5.0. In contrast, the 5H_3 VLP showed a partially ruptured shape with a reduced size at pH 5.0, but retained the same spherical form as wild‐type VLP at pH 7.4. Small‐size dots in the background TEM image at pH 5.0 are likely to be dissociated subunits with low oligomeric states. Partially disassembled 5H_3 VLPs seem to result from insufficient electrostatic repulsions for complete disassociation of the interacting subunits despite histidine protonation under an acidic pH.
Figure 3.
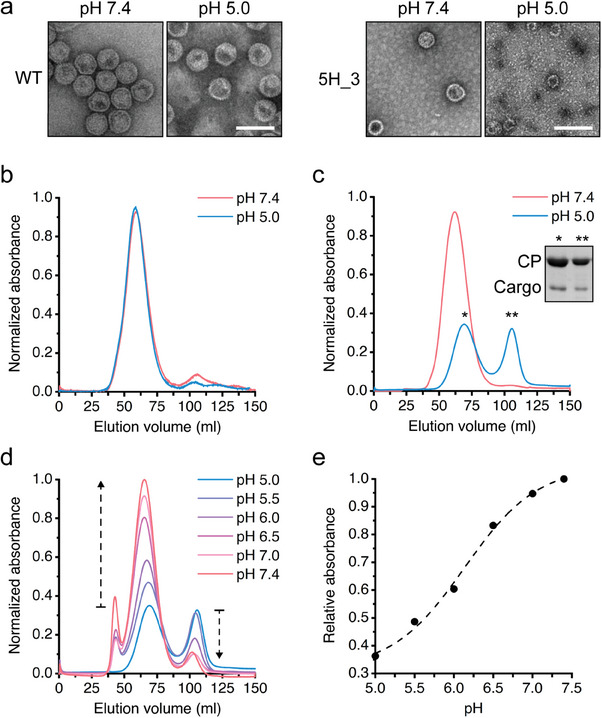
The pH‐dependent structural transition of 5H_3 VLP. a) TEM images of the wild‐type (left) and 5H_3 (right) VLPs encapsulating eGFP‐SP at pH 7.4 and 5.0. The scale bar represents 100 nm. b) Elution profiles of wild‐type VLP at pH 7.4 and 5.0. c) Elution profiles of the 5H_3 VLP at pH 7.4 and 5.0. d) Elution profiles of partially disassembled 5H_3 VLPs based on size exclusion chromatography with a gradual shift in pH from 5.0 to 7.4. The buffers used are as follows: 0.1 m citrate‐phosphate (pH 5.0), 0.1 m citrate (pH 5.5), 0.1 m phosphate (pH 6.0), 0.1 m phosphate (pH 6.5), 0.1 m phosphate (pH 7.0), and 0.1 m phosphate (pH 7.4). e) Relative portions of the reassembled 5H_3 VLP were estimated at each pH based on the elution profiles in (d) and plotted against the pH.
We further analyzed a pH‐responsive assembly and disassembly of the 5H_3 VLP through size exclusion chromatography using a column (S‐500 70 HR sephacryl). As expected, wild‐type VLP showed a single elution peak regardless of the pH (Figure 3b). In the case of the 5H_3 VLP, however, two distinct elution peaks appeared at pH 5.0, whereas a single elution peak was observed at pH 7.4 similar to the wild‐type (Figure 3c). The early eluted fraction is likely to correspond to a mixture of partially disassembled VLPs with varying sizes as observed through the TEM images in Figure 3a, which is supported by the delayed elution time of the main peak compared to that at pH 7.4. The other fraction was observed to contain coat subunits and cargo‐fused scaffolding proteins based on an SDS/PAGE analysis (Figure 3c inset).
We checked if the dissociated subunits and the partially disassembled VLPs could reassemble into a VLP as the pH was shifted to a neutral value. The 5H_3 VLP was incubated at pH 5.0 (0.1 m citrate‐phosphate buffer), followed by a gradual step‐wise change of pH to 7.4 through dialysis, and the resulting solution at each pH was analyzed through size exclusion chromatography (Figure 3d). As the pH shifted from 5.0 to 7.4, the peak heights of the early eluted fractions gradually increased and eluted earlier, showing the same elution time as the intact VLP at pH 7.4, whereas the heights of the second elution peaks decreased. The increase in the peak at around 40 ml likely corresponds to a small portion of aggregates that have formed during the reassembly of the VLP.
To further confirm the reassembly of the 5H_3 at pH 7.4, we collected the fractions corresponding to the reassembled VLP in size exclusion chromatography, obtained the negative TEM images, and verified the reassembly of the 5H_3 as pH was shifted to 7.4 (Figure S5, Supporting Information). When a relative portion of the reassembled 5H_3 VLPs was plotted against the pH, a sigmoidal feature was observed (Figure 3e). Based on the results, it is likely that the 5H_3 VLPs underwent disassembly with varying degrees, ranging from complete to partial dissociation at pH 5.0, and then reassembled into a complete VLP in a concerted manner with a gradual shift in pH to 7.4. It was reported that the assembly of a bacteriophage P22 protein coat is a reversible and equilibrium process.[ 35 ]
2.4. Structural Analysis of a pH‐Responsive VLP
To elucidate a molecular architecture of 5H_3 and validate whether it successfully assembled into a VLP at the neutral pH, we determined a cryo‐EM structure of the 5H_3 VLP at pH 7.4 (Figure S6, Supporting Information). A representative cryo‐EM images of the 5H_3 VLPs at the neutral pH are shown in Figure 4a. A total of 3320 particles were used for a three‐dimensional EM map reconstruction. We applied icosahedral symmetry (I) during the reconstruction and generated the cryo‐EM map at a resolution of 4.02 Å (Figure 4b,c; Figure S6, Supporting Information). Most of the side chain residues were visible, and an atomic model of an ASU of the 5H_3 VLP was built on the map (91.9%, 395 amino acids from 430 amino acids in a single coat protein subunit) (Figure S7, Supporting Information). Despite the histidine mutations, cryo‐EM structure of the 5H_3 monomer has an identical topology to the P22 wild type coat protein with a rmsd value of 1.706 Å (Figure S8, Supporting Information). Furthermore, an arrangement of the 5H_3 ASU in hexon and penton cluster is similar to the wild type P22 procapsid with T = 4 (Figure 4b,c). In line with the fact that T = 4 procapsids are formed in the absence of the scaffolding protein,[ 36 ] our 5H_3 VLP likely favors T = 4 conformation with the truncated scaffolding protein (Figure 2b). It thus seems that the histidine mutations at 5H_3 have negligible effects on the structures of the monomer and the ASU, and 5H_3 assembles into T = 4 procapsid morphology comparable to the P22 wild type.
Figure 4.

Cryo‐EM structure of 5H_3 VLP. a) A representative cryo‐EM micrograph of the 5H_3 VLP. b) Cryo‐EM map of the 5H_3 VLP at a resolution of 4.02 Å. c) An entire model of the 5H_3 VLP (PDB 8GN5). d) Location of substituted histidine residues at the subunits of the 5H_3 VLP (middle). Subunit interfaces near His43 (right) and His54, His153, and His287 (left) are illustrated, respectively. The interface around e) His43 is outlined in green, and the interfaces around f) His54, g) His153, and h) His287 are in pink. The histidine residues are colored in sky blue. The distances between the histidine and the amino acid residues that are presumably involved in a pH‐dependent disassembly of the 5H_3 are indicated by the dotted lines.
To dissect the molecular mechanism of the 5H_3 VLP disassembly under an acidic pH, we further examined the molecular environment surrounding histidine mutations. Among the five introduced histidines of 5H_3, four histidine mutations (S43H, E54H, E153H, and N287H) are visible in the cryo‐EM map, all of which are located at the subunit interface (Figure 4d; Figure S9, Supporting Information). First, S43H is located at the interface between the penton and hexon clusters (Figure 4e). At the neutral pH, H43 forms a hydrogen bond with a hydroxyl group of Y33. Compared to the wild type S43, protonation of the imidazole ring of S43H at an acidic pH may hinder this hydrogen bond, destabilizing the interface. Three histidine mutations (E54H, E153H, and N287H) are located at the interface within the hexon cluster (Figure 4d). E54H is surrounded by E52, M284, and K110 in which M284 and aliphatic chain of K110 form a hydrophobic interaction with the imidazole ring of E54H. In the wild type P22 procapsid, E54 may make an ionic bond with K110. In contrast, E54H forms a hydrogen bond network with E52 in close proximity. At the acidic pH, the protonated E54H may cause an electrostatic repulsion with K110 (Figure 4f). E153H is located between K176 and R213, which are likely to form an ionic bond with wild type E153. In the 5H_3 VLP, E153H makes an electrostatic interaction with R213 and the imidazole ring of E153H forms a hydrophobic interaction with the aliphatic chain of K176. Those interactions would be disrupted upon the protonation of E153H under an acidic pH (Figure 4g). N287H is located near L117 and P218, and forms an electrostatic interaction with R349 in the proximity. The wild type N287 seems to interact with R349. However, N287H is protonated and disturbs the interaction with R349 at the acidic pH (Figure 4h).
Analysis of the charge distribution shows that the charge repulsion at the interface at the acidic pH makes a major contribution to the disassembly of the 5H_3 VLP, supporting our design strategy (Figure S10, Supporting Information). Thus, the selected histidine mutations form stable interactions with the surrounding residues nearby at the neutral pH and provide pH‐responsiveness for disassembly of the 5H_3 VLP upon protonation at the acidic pH.
2.5. The pH‐Responsive VLPs as a Protein Cage for Delivery of a Protein Cargo
We tested the utility of the 5H_3 VLP as a protein cage for the delivery of a cargo into cells in a pH‐dependent manner. The 5H_3 VLP with an internal cavity having a 32‐nm diameter based on the cryo‐EM structure can be effectively used as a protein cage in the delivery of diverse cargos. In addition, the VLP can act as a shell to protect a cargo from degradation in harsh in vivo environments. To achieve pH‐responsive and target‐specific delivery of a cargo, the epithelial growth factor receptor (EGFR)‐specific protein binder (rEGFR) was used as a targeting moiety.[ 37 , 38 ] In addition, rEGFR was genetically fused to the N‐terminus of eGFP‐SP, and the resulting construct (rEGFR‐eGFP‐SP) was encapsulated inside the 5H_3 VLP and the wild‐type (Figure 5a). The pH‐dependent delivery of a cargo protein by the 5H_3 VLP through receptor‐mediated endocytosis is schematically depicted in Figure 5b. Briefly, the pH‐sensitive VLPs disassemble at an acidic pH, such as the acidic TME, and the cargo proteins are released. The cargo proteins specifically bind to the cancer cells through the targeting moieties, followed by internalization through receptor mediated endocytosis. Acidic pH in a tumor microenvironment allows for a more general approach to targeting highly heterogeneous cancer types.[ 39 ] Furthermore, on‐demand drug delivery in a spatially controlled manner can lead to higher therapeutic efficacy, while minimizing any side effects.
Figure 5.

The pH‐dependent delivery of a protein cargo through receptor‐mediated endocytosis into tumor cell using the 5H_3 VLP. a) Schematic illustration of the 5H_3 VLP encapsulating a targeting moiety‐fused cargo. b) Schematics for the tumor microenvironment‐targeted delivery of a cargo through receptor‐mediated endocytosis using the 5H_3 VLP encapsulating a targeting moiety‐fused cargo. c) SDS/PAGE analyses of the wild‐type and 5H_3 VLPs encapsulating rEGFR‐eGFP‐SP. Here, rEGFR indicates an EGFR‐specific protein binder. CP indicates a coat protein. d) TEM images of the wild‐type and 5H_3 VLPs at pH 7.4 and 5.0. The scale bar represents 100 nm. Fluorescent microscopic images of e) high EGFR‐expressing MDA‐MB‐468 cells and f) low EGFR‐expressing MCF7 cells when treated with the wild‐type and 5H_3 VLPs encapsulating rEGFR‐eGFP‐SP at pH 7.4 and 6.5. Free rEGFR‐eGFP‐SP was used as a control. Equal concentration of cargos was treated. Blue, DAPI; green, rEGFR‐eGFP‐SP. The scale bar represents 20 nm.
When rEGFR‐eGFP‐SP was co‐expressed with the 5H_3 subunit or wild‐type subunit, the amounts of encapsulated protein cargo inside the 5H_3 VLP and the wild‐type were estimated to be 51 and 91 molecules, respectively, based on the band intensities on SDS/PAGE (Figure 5c). The concentration of the cargo in the VLP particle mixture was estimated by determining the ratio of the cargo to the total amount of loaded protein. TEM images of the 5H_3 VLP encapsulating rEGFR‐eGFP‐SP revealed that some of the 5H_3 VLPs partially ruptured, whereas others were completely dissociated into the subunits at pH 5.0, as observed above, and wild‐type VLP remained intact regardless of the pH (Figure 5d). We examined the delivery of the cargo into high EGFR‐expressing MDA‐MB‐468 cells by the 5H_3 VLP in a pH‐dependent manner using a confocal microscope. Low EGFR‐expressing MCF7 cells were employed as a negative control. As the pH in a tumor microenvironment is known to range from 7.0 to 6.5, the cargo delivery was tested at pH 6.5. Treatment of MDA‐MB‐468 cells with a free rEGFR‐eGFP‐SP resulted in strong eGFP signals at both pH 7.4 and 6.5, whereas negligible signals were detected in MCF7 cells, indicating an EGFR‐specific delivery of the protein cargo (Figure S11, Supporting Information). When the 5H_3 VLP was treated with MDA‐MB‐468 cells, the cargo was efficiently delivered into the cells at only pH 6.5, whereas a negligible cargo delivery was achieved by wild‐type VLP (Figure 5e). Some non‐specific delivery was observed at pH 7.4 for both VLPs, and this seems to be caused by the fact that a small portion of the VLPs are slightly leaky probably due to incomplete assembly of the VLP. No cargo delivery was observed in the MCF7 cells by the 5H_3 VLP and the wild‐type at both pH 5.0 and 7.4 (Figure 5f).
2.6. The pH‐Dependent Cell Cytotoxicity by 5h_3 VLP
We tested the pH‐dependent cell cytotoxicity of the 5H_3 VLP using an exotoxin A from Pseudomonas aeruginosa (PE24), which inhibits protein synthesis, as a cytotoxic cargo. PE24 was genetically fused to the C‐terminus of rEGFR,[ 40 ] and the resulting construct (rEGFR‐PE24‐SP) was encapsulated inside the 5H_3 VLP and the wild‐type (Figure 6a). The 5H_3 VLP and wild‐type VLP were estimated to contain 22 and 36 molecules of rEGFR‐PE24‐SP, respectively, based on the band intensities on SDS/PAGE (Figure 6b). Tumor cells were incubated with the 5H_3 VLP, wild‐type VLP, or a free cargo for 1 h at pH 6.5 and 7.4, and the cell viabilities was assayed. A431 and MCF7 cells were used as high and low EGFR‐expressing cells, respectively. The 5H_3 VLP gave rise to significant cell cytotoxicity for A431 cells at only pH 6.5, displaying a comparable pattern as a free cargo, whereas a non‐targeted cargo without rEGFR had no cytotoxic effect regardless of the pH (Figure 6c; Figure S12, Supporting Information). For low EGFR‐expressing MCF7 cells, negligible cytotoxic effects were shown regardless of the pH by the 5H_3 VLP, wild‐type VLP, free protein cargo, and non‐targeted cargo (Figure 6; Figure S12, Supporting Information). Similar pH‐dependent cell cytotoxicity was observed for high EGFR‐expressing MDA‐MB‐468 cells by the 5H_3 VLP (Figure S13, Supporting Information). These results demonstrate that the 5H_3 VLP enabled a pH‐dependent delivery of the cytotoxic cargo into tumor cells through receptor‐mediated endocytosis, effectively suppressing cell viability.
Figure 6.

Cell cytotoxicity of 5H_3 VLP encapsulating a cytotoxic cargo in a pH‐dependent manner. a) Schematics for the 5H_3 VLP encapsulating an exotoxin A from Pseudomonas aeruginosa (PE24). b) SDS/PAGE analyses of the wild‐type and 5H_3 VLPs encapsulating rEGFR‐PE24‐SP. CP indicates a coat protein. Dose‐dependent cytotoxic effects on c) high EGFR‐expressing MDA‐MB‐468 cells and d) low EGFR‐expressing MCF7 cells using the wild‐type and 5H_3 VLPs encapsulating rEGFR‐PE24‐SP at pH 7.4 and pH 6.5. Non‐targeted indicates the use of an off‐target protein binder (rOff) instead of rEGFR. Free rEGFR‐PE24‐SP was tested under the same conditions. The error bars represent standard deviations in triplicate experiments.
The extracellular pH in human tumors typically ranges from 7.0 to 6.5, and the acidic pH in a tumor microenvironment can be used as a more general target for highly heterogeneous cancer types. In this context, a pH‐responsive VLP can allow for on‐demand drug delivery in a spatial, temporal, and dosage‐controlled manner for higher therapeutic efficacy, while minimizing the side effects. It is noteworthy that the cell cytotoxicity of the VLP encapsulating Pseudomonas exotoxin A at an acidic pH was similar to a free cargo. Such a VLP can also provide a protective barrier, preventing protein cargos from degradation or modification within the blood.
3. Conclusion
We successfully developed a pH‐responsive VLP that undergoes a transition between assembly and disassembly in response to pH changes through the computational design of a coat protein subunit. Our design strategy was validated by a structural analysis of the designed pH‐responsive VLP. The utility of the pH‐responsive VLP as a protein cage was also demonstrated by the efficient delivery of a cytotoxic cargo into tumor cells in a pH‐dependent manner, implying the potential for targeting the tumor microenvironment. The present approach can be used in the creation of self‐assembling protein architectures with a new functionality for diverse applications.
4. Experimental Section
Purification of Self‐Assembled VLPs
A pBAD vector harboring the wild‐type subunit or its variant genes was cloned into E. coli, and the resulting cells were grown and induced as described above. Cells were harvested through centrifugation at 8000 rpm for 10 min, and suspended in a phosphate buffered saline (PBS) buffer (pH 7.4). The cell slurry was sonicated, followed by centrifugation at 13 000 rpm for 1 h, and the supernatants were loaded onto a 20% sucrose cushion followed by ultracentrifugation at 25 000 rpm for 3 h. The pellet was re‐suspended in a PBS buffer (pH 7.4), and the VLPs were further purified through size exclusion chromatography using an S‐500 70 HR sephacryl column (GE Healthcare Life Sciences) at a flow rate of 1 mL min−1.
Analysis of Disassembly and Reassembly of a VLP
Subunit designs and wild‐type subunit were co‐expressed with a cargo‐fused scaffolding protein in E. coli, and the resulting VLPs were purified in a PBS buffer (pH 7.4) as described above. The purified VLPs were loaded onto an S‐500 70 HR sephacryl size exclusion column (GE Healthcare Life Sciences) at a flow rate of 1 mL min−1, and the eluents were monitored using an UV/vis detector. For a quantitative analysis of the disassembled VLPs, the purified VLPs encapsulating eGFP‐SP were subjected to dialysis against a 0.1 m citrate‐phosphate buffer (pH 5.0), followed by loading onto a 20% sucrose cushion and ultracentrifugation at 32 000 rpm for 1 h. The supernatants were analyzed on 10% SDS/PAGE to determine the amount of coat protein (CP).
For the reassembly test, partially disassembled VLPs in 0.10 m citrate‐phosphate buffer (pH 5.0) were progressively dialyzed against a buffer solution with an increasing pH starting from 0.1 m citrate (pH 5.5), 0.1 m phosphate (pH 6.0), 0.1 m phosphate (pH 6.5), and 0.1 m phosphate (pH 7.0), and the resulting solution was loaded onto a S‐500 70 HR sephacryl size exclusion column (GE Healthcare Life Sciences) at a flow rate of 1 mL min−1. The eluents were monitored using an UV–vis detector. For a quantitative analysis of the reassembled VLPs, the purified VLPs encapsulating eGFP‐SP in a PBS buffer (pH 7.4) were loaded onto a 20% sucrose cushion and ultra‐centrifuged at 32 000 rpm for 1 h. The supernatants were analyzed on 10% SDS/PAGE, and relative amount of coat protein (CP) was determined by measuring the band densities using a densitometer.
Dialysis for Buffer Change
Purified VLPs were loaded into a Float‐A‐Lyzer G2 dialysis device (MWCO 20 kDa, Spectrum). The device was placed in 300 mL of various dialysis buffers, including 0.10 m citrate‐phosphate (pH 5.0), 0.1 m citrate (pH 5.5), 0.1 m phosphate (pH 6.0), 0.1 m phosphate (pH 6.5), 0.1 m phosphate (pH 7.0), and 0.1 m phosphate (pH 7.4), followed by incubation with mild agitation using a magnetic stirrer for 4 h at 4 °C. The dialyzed buffer was changed into 300 mL of a new buffer and dialyzed for 8 h at 4 °C, followed by removal of the buffer and dialysis against 400 mL of a new buffer for 12 h at 4 °C. After dialysis, the VLPs were collected for further experiments.
Transmission Electron Microscopy (TEM)
The designed and wild‐type VLPs encapsulating eGFP‐SP in a 0.1 m phosphate buffer (pH 7.4) or 0.1 m citrate‐phosphate buffer (pH 5.0) were loaded onto Formvar carbon coated grids and negatively stained with 2% uranyl acetate. TEM images were obtained using a Tecnai F20 20‐kV field‐emission transmission electron microscope (FEI) with a CCD camera (Gatan).
Analysis of a Released Cargo
The designed and wild‐type VLPs encapsulating eGFP‐SP in a 0.1 m phosphate buffer (pH 7.4) or 0.1 m citrate‐phosphate buffer (pH 5.0) were loaded onto a 20% sucrose cushion followed by ultracentrifugation at 32 000 rpm for 1 h. The pellet was suspended in 3.5 mL of a 0.1 m phosphate buffer (pH 7.4) or 0.1 m citrate‐phosphate buffer (pH 5.0), and proteins in the supernatants before and after ultracentrifugation were analyzed on 10% SDS/PAGE. The relative protein amounts were calculated as follows:
| (1) |
where the protein intensity was calculated using GelDoc after Coomassie Blue staining.
Cell Culture
High EGFR‐expressing MDA‐MB‐468 and A431 cells were incubated in a DMEM medium supplemented with 10% FBS and 1% antibiotic at 37 °C in a humidified atmosphere containing 5% CO2. Low EGFR‐expressing MCF7 cells were cultured in an RPMI‐1640 medium supplemented with 10% FBS and 1% antibiotic at 37 °C in a humidified atmosphere containing 5% CO2.
Confocal Microscope Imaging
Approximately 1 × 10⁴ cells of MCF7, A431, or MDA‐MB‐468 were seeded and incubated in an 8‐well chamber slide for 2 days. The cells were treated with 500 nm of free rEGFR‐eGFP‐SP or VLPs encapsulating rEGFR‐eGFP‐SP in a medium with a pH 7.4 or 6.5 for 1 h in 5% CO2 at 37 °C. The cells were washed with DPBS and fixed using 4% paraformaldehyde for 10 min at room temperature, followed by three washes with iced DPBS. The cells were blocked by PBS containing 1% BSA for 1 h at 4 °C. Subsequently, PBS containing 0.1% Triton X‐100 was treated to wash the cells, and the nuclei were stained using a DAPI (4, 6‐diamidino‐2‐phenylindole) staining solution. The fluorescent images were acquired using a Zeiss LSM 780 confocal microscope system (Carl Zeiss).
In Vitro Cytotoxic Assay
Approximately 5 × 10³ cells of MCF7, A431, or MDA‐MB‐468 were seeded and incubated in 96‐well plates for 2 days. The cells were treated with serially diluted samples of 0.032 to 100 nm free rEGFR‐PE24‐SP or VLPs encapsulating rEGFR‐PE24‐SP at pH 7.4 and 6.5 for 1 h in 5% CO2 at 37 °C. The cells were washed with DPBS and grown in fresh media for three additional days. The cells were treated with 5 µL of a CCK‐8 solution containing WST‐8 (Dojindo) and incubated for 1 h in 5% CO2 at 37 °C. Absorbance at 450 nm was measured using an infinite M200 plate reader (Tecan).
Further descriptions of the materials and instruments used, experimental procedures, and methods are provided in the Supporting Information.
Statistical Analyses
All experiments were conducted in triplicate (n = 3) unless otherwise specified. All experimental results were presented as mean ± standard deviation (SD).
Conflict of Interest
The authors declare no conflict of interest.
Author Contributions
K.‐J.K., G.K., and J.‐H.B. contributed equally to this work. Conceptualization: K.‐J. K.; Investigation: K.J.K., G.K., and J.‐H.B. Formal analysis: K.‐J.K., G.K., and J.‐H. B. Supervision: J.‐J.S., H,‐S.K. Writing (original draft): K‐J K, G. K, and J‐H B. Writing (review and editing): J‐J S. and H.‐S.K.
Supporting information
Supporting Information
Acknowledgements
This research was supported by the National Research Foundation of Korea (NRF) grant funded by the Ministry of Science and ICT (NRF‐2021R1A2C201421811 to H.‐S.K., NRF‐2021R1A2C3010506, 2019K1A3A1A4700071, NRF‐2017M3A9F6029755, NRF‐2019M3E5D6063903 to H.‐S.K.). Financial support by National Research Foundation of Korea (NRF‐2020R1A2B5B03001517) and KAIST Grand Challenge 30 project (KC30) to J.‐J.K is appreciated. G.K. is a recipient of the Global Ph.D. Fellowship program of the National Research Foundation of Korea (NRF‐2018H1A2A1061362). The authors also thank the KAIST Analysis Center for Research Advancement (KARA) for maintaining and supporting the electron microscopy facility applied in this study. They also thank the staff scientists for their assistance at the beamline 5C of the Pohang Light Source.
Kim K.‐J., Kim G., Bae J.‐H., Song J.‐J., Kim H.‐S., A pH‐Responsive Virus‐Like Particle as a Protein Cage for a Targeted Delivery. Adv. Healthcare Mater. 2024, 13, 2302656. 10.1002/adhm.202302656
Data Availability Statement
The data that support the findings of this study are available from the corresponding author upon reasonable request.
References
- 1. Lee E. J., Lee N. K., Kim I.‐S., Adv. Drug Delivery Rev. 2016, 106, 157. [DOI] [PubMed] [Google Scholar]
- 2. Hu H., Steinmetz N. F., Biotechnol. J. 2020, 15, 2000077. [DOI] [PMC free article] [PubMed] [Google Scholar]
- 3. Estrada L. H., Chu S., Champion J. A., J. Pharm. Sci. 2014, 103, 1863. [DOI] [PubMed] [Google Scholar]
- 4. Herrera Estrada L. P., Champion J. A., Biomater. Sci. 2015, 3, 787. [DOI] [PubMed] [Google Scholar]
- 5. Edwardson T. G. W., Mori T., Hilvert D., J. Am. Chem. Soc. 2018, 140, 10439. [DOI] [PubMed] [Google Scholar]
- 6. Ladenstein R., Morgunova E., Biotechnol. Rep. 2020, 27, e00494. [DOI] [PMC free article] [PubMed] [Google Scholar]
- 7. Uchida M., Klem M. T., Allen M., Suci P., Flenniken M., Gillitzer E., Varpness Z., Liepold L. O., Young M., Douglas T., Adv. Mater. 2007, 19, 1025. [Google Scholar]
- 8. Kim H., Choi H., Bae Y., Kang S., Biotechnol. Bioeng. 2019, 116, 2843. [DOI] [PubMed] [Google Scholar]
- 9. Servid A., Jordan P., O'neil A., Prevelige P., Douglas T., Biomacromolecules 2013, 14, 2989. [DOI] [PMC free article] [PubMed] [Google Scholar]
- 10. Patterson D. P., Schwarz B., Waters R. S., Gedeon T., Douglas T., ACS Chem. Biol. 2014, 9, 359. [DOI] [PubMed] [Google Scholar]
- 11. Qazi S., Miettinen H. M., Wilkinson R. A., Mccoy K., Douglas T., Wiedenheft B., Mol. Pharmaceutics 2016, 13, 1191. [DOI] [PMC free article] [PubMed] [Google Scholar]
- 12. Jordan P. C., Patterson D. P., Saboda K. N., Edwards E. J., Miettinen H. M., Basu G., Thielges M. C., Douglas T., Nat. Chem. 2016, 8, 179. [DOI] [PubMed] [Google Scholar]
- 13. Lucon J., Qazi S., Uchida M., Bedwell G. J., Lafrance B., Prevelige P. E., Douglas T., Nat. Chem. 2012, 4, 781. [DOI] [PMC free article] [PubMed] [Google Scholar]
- 14. Hill B. D., Zak A., Khera E., Wen F., Curr. Protein Pept. Sci. 2018, 19, 112. [DOI] [PubMed] [Google Scholar]
- 15. Shahrivarkevishahi A., Hagge L. M., Brohlin O. R., Kumari S., Ehrman R., Benjamin C., Gassensmith J. J., Mater Today Chem 2022, 24, 100808. [Google Scholar]
- 16. Dalmau M., Lim S., Wang S.‐W., Nano Lett. 2009, 9, 160. [DOI] [PubMed] [Google Scholar]
- 17. Peng T., Lee H., Lim S., Biomater. Sci. 2015, 3, 627. [DOI] [PubMed] [Google Scholar]
- 18. Peng T., Lim S., Biomacromolecules 2011, 12, 3131. [DOI] [PubMed] [Google Scholar]
- 19. Liu M., Shen S., Wen D., Li M., Li T., Chen X., Gu Z., Mo R., Nano Lett. 2018, 18, 2294. [DOI] [PubMed] [Google Scholar]
- 20. Yao Y., Saw P. E., Nie Y., Wong P.‐P., Jiang L., Ye X., Chen J., Ding T., Xu L., Yao H., Hu H., Xu X., J. Mater. Chem. B 2019, 7, 576. [DOI] [PubMed] [Google Scholar]
- 21. Palanikumar L., Al‐Hosani S., Kalmouni M., Nguyen V. P., Ali L., Pasricha R., Barrera F. N., Magzoub M., Commun. Biol. 2020, 3, 95. [DOI] [PMC free article] [PubMed] [Google Scholar]
- 22. Liu J., Huang Y., Kumar A., Tan A., Jin S., Mozhi A., Liang X.‐J., Biotechnol. Adv. 2014, 32, 693. [DOI] [PubMed] [Google Scholar]
- 23. Jones J. A., Cristie‐David A. S., Andreas M. P., Giessen T. W., Angew. Chem., Int. Ed. Engl. 2021, 60, 25034. [DOI] [PMC free article] [PubMed] [Google Scholar]
- 24. Gu C., Zhang T., Lv C., Liu Y., Wang Y., Zhao G., ACS Nano 2020, 14, 17080. [DOI] [PubMed] [Google Scholar]
- 25. Boyken S. E., Benhaim M. A., Busch F., Jia M., Bick M. J., Choi H., Klima J. C., Chen Z., Walkey C., Mileant A., Sahasrabuddhe A., Wei K. Y., Hodge E. A., Byron S., Quijano‐Rubio A., Sankaran B., King N. P., Lippincott‐Schwartz J., Wysocki V. H., Lee K. K., Baker D., Science 2019, 364, 658. [DOI] [PMC free article] [PubMed] [Google Scholar]
- 26. Cortines J. R., Weigele P. R., Gilcrease E. B., Casjens S. R., Teschke C. M., Virology 2011, 421, 1. [DOI] [PMC free article] [PubMed] [Google Scholar]
- 27. Cortines J. R., Motwani T., Vyas A. A., Teschke C. M., J. Virol. 2014, 88, 5287. [DOI] [PMC free article] [PubMed] [Google Scholar]
- 28. Teschke C. M., Parent K. N., Virology 2010, 401, 119. [DOI] [PMC free article] [PubMed] [Google Scholar]
- 29. Parent K. N., Khayat R., Tu L. H., Suhanovsky M. M., Cortines J. R., Teschke C. M., Johnson J. E., Baker T. S., Structure 2010, 18, 390. [DOI] [PMC free article] [PubMed] [Google Scholar]
- 30. Chen D.‐H., Baker M. L., Hryc C. F., Dimaio F., Jakana J., Wu W., Dougherty M., Haase‐Pettingell C., Schmid M. F., Jiang W., Baker D., King J. A., Chiu W., Proc. Natl. Acad. Sci. USA 2011, 108, 1355. [DOI] [PMC free article] [PubMed] [Google Scholar]
- 31. Hryc C. F., Chen D.‐H., Afonine P. V., Jakana J., Wang Z., Haase‐Pettingell C., Jiang W., Adams P. D., King J. A., Schmid M. F., Chiu W., Proc. Natl. Acad. Sci. USA 2017, 114, 3103. [DOI] [PMC free article] [PubMed] [Google Scholar]
- 32. Schymkowitz J., Borg J., Stricher F., Nys R., Rousseau F., Serrano L., Nucleic Acids Res. 2005, 33, W382. [DOI] [PMC free article] [PubMed] [Google Scholar]
- 33. Sharma J., Uchida M., Miettinen H. M., Douglas T., Nanoscale 2017, 9, 10420. [DOI] [PMC free article] [PubMed] [Google Scholar]
- 34. Mccoy K., Selivanovitch E., Luque D., Lee B., Edwards E., Castón J. R., Douglas T., Biomacromolecules 2018, 19, 3738. [DOI] [PubMed] [Google Scholar]
- 35. Parent K. N., Suhanovsky M. M., Teschke C. M., J. Mol. Biol. 2007, 365, 513. [DOI] [PMC free article] [PubMed] [Google Scholar]
- 36. Thuman‐Commike P. A., Greene B., Malinski J. A., King J., Chiu W., Biophys. J. 1998, 74, 559. [DOI] [PMC free article] [PubMed] [Google Scholar]
- 37. Lee S.‐C., Park K., Han J., Lee J.‐J., Kim H. J., Hong S., Heu W., Kim Y. J., Ha J.‐S., Lee S.‐G., Cheong H.‐K., Jeon Y. H., Kim D., Kim H.‐S., Proc. Natl. Acad. Sci. USA 2012, 109, 3299. [DOI] [PMC free article] [PubMed] [Google Scholar]
- 38. Lee J.‐J., Choi H.‐J., Yun M., Kang Y., Jung J.‐E., Ryu Y., Kim T. Y., Cha Y.‐J., Cho H.‐S., Min J.‐J., Chung C.‐W., Kim H.‐S., Angew. Chem., Int. Ed. 2015, 54, 12020. [DOI] [PubMed] [Google Scholar]
- 39. Uthaman S., Huh K. M., Park I.‐K., Biomater. Res. 2018, 22, 22. [DOI] [PMC free article] [PubMed] [Google Scholar]
- 40. Weldon J. E., Pastan I., FEBS J. 2011, 278, 4683. [DOI] [PMC free article] [PubMed] [Google Scholar]
Associated Data
This section collects any data citations, data availability statements, or supplementary materials included in this article.
Supplementary Materials
Supporting Information
Data Availability Statement
The data that support the findings of this study are available from the corresponding author upon reasonable request.