

Abstract
Sex differences exist in numerous parameters of the brain. Yet, sex-related factors are part of a large set of variables that interact to affect many aspects of brain structure and function. This raises questions regarding how to interpret findings of sex differences at the level of single brain measures and the brain as a whole. In the present study, we reanalyzed two datasets consisting of measures of oxytocin, vasopressin V1a, and mu opioid receptor binding densities in multiple brain regions in rats. At the level of single brain measures, we found that sex differences were rarely dimorphic and were largely persistent across estrous stage and parental status but not across age or context. At the level of aggregates of brain measures showing sex differences, we tested whether individual brains are ‘mosaics’ of female-typical and male-typical measures or are internally consistent, having either only female-typical or only male-typical measures. We found mosaicism for measures showing overlap between females and males. Mosaicism was higher a) with a larger number of measures, b) with smaller effect sizes of the sex difference in these measures, and c) in rats with more diverse life experiences. Together, these results highlight the limitations of the binary framework for interpreting sex effects on the brain and suggest two complementary pathways to studying the contribution of sex to brain function: (1) focusing on measures showing dimorphic and persistent sex differences and (2) exploring the relations between specific brain mosaics and specific endpoints.
Keywords: Sex differences, Sex similarities, Mosaics, Oxytocin, Vasopressin, Opioids, Juvenile, Age, Estrous cycle, Primiparous
1. Introduction
There is currently a wide agreement that sex-related genes and hormones affect many aspects of brain structure and function, leading to sex differences in multiple end points, from the morphology of single brain cells and the density and distribution of specific neurotransmitter projections and receptors to the size of specific brain regions (e.g., Arnold and Chen, 2009; Bobotis et al., 2023; de Vries and Forger, 2015; Joel et al., 2020; McCarthy, 2016; Santos-Toscano et al., 2023). Within a binary framework, which builds on the sexual differentiation of the genitalia, sex differences in the brain are often treated as dimorphic (i.e., having a ‘female-typical’ and a ‘male-typical’ form) and stable (i.e., persisting largely unchanged across internal and external conditions). There is evidence, however, that sex-related factors are part of a large set of variables that interact to affect many aspects of brain structure and function, and relatedly, that sex differences in specific brain measures (e.g., dendritic morphology, receptor binding, number and density of neurons) may be different under different conditions (e.g., de Vries and Forger, 2015; Joel, 2011; McCarthy and Arnold, 2011). This raises questions regarding how to interpret findings of sex differences at the level of single brain measures and the brain as a whole (Joel, 2011; Joel et al., 2020; Joel and McCarthy, 2017).
At the level of single brain measures, Joel and McCarthy (2017) noted that the existence of a sex difference in a specific brain measure does not necessarily entail that the effect will be seen under other internal conditions (such as, genetic background [e.g., strain], age) and external conditions (e.g., housing conditions) or that sex-related genes or hormones affect this brain measure (instead, the effect may be related to one or more of the many variables that correlate with sex category, such as weight or fat to muscle ratio). Moreover, brain measures showing a sex difference are often not dimorphic, i.e., do not exhibit a female-typical and a male-typical form, but rather there is an average group-level difference of scores that reside on a continuum (Joel and McCarthy, 2017; Joel, 2012; McCarthy and Konkle, 2005). To better characterize the relationships between sex and the brain in health and pathology, Joel and McCarthy (2017) suggested classifying sex differences in single brain measures on four dimensions: 1) persistent versus transient across the lifespan; 2) context independent versus dependent, with ‘context’ referring to variation in environment and/or experience; 3) dimorphic versus continuous; and 4) a direct versus an indirect consequence of sex. Classification according to the last dimension requires studies in which sex-related genes and/or hormones are directly manipulated. Classification over the first three dimensions requires the assessment of the same brain measure in females and males under more than one set of conditions (e.g., in different age groups, under different environmental conditions, following different experiences).
At the level of aggregates of brain measures (or the whole brain), Joel proposed that the repeated observation that sex differences in single brain measures may be different under different conditions suggests that sex differences do not add up consistently within individual brains. Instead, brains are expected to be composed of unique combinations (‘mosaics’) of female-typical and male-typical measures (Joel, 2011; for a recent review see Joel, 2021). In support of this hypothesis, in humans, mosaicism has been observed in both MRI-derived and post mortem-derived measures (Joel et al., 2015, 2020). But humans have an extraordinarily level of variability that may favor mosaic brains over internally consistent brains. The current study aimed to determine whether sex mosaicism is present under much more controlled conditions, namely in laboratory Wistar rats.
Assessment of internal consistency and mosaicism requires the assessment of several brain measures that show sex differences in the same sample of animals. Therefore, in the present study, we took advantage of the existence of a large set of measures of neuropeptide receptor binding density [oxytocin receptor (OXTR), vasopressin V1a receptor (V1aR), and mu opioid receptor (MOR)] in multiple brain regions in both juvenile and adult male and female rats (Smith’s cohort: Smith et al., 2017, 2018) and the availability of data on some of these measures in another group of adult male and nulliparous and primiparous female rats (Dumais’ cohort: Dumais et al., 2013, Dumais and Veenema, 2016). Neuropeptide receptor expression levels in the brain can be modified by internal and external factors and this is particularly true for the OXTR where binding density or expression levels were found to differ not only depending on sex, but also depending on species, age, estrous stage, and parental status (Arsenijevic et al., 1995; Bale et al., 1995; Baxter et al., 2020; Dumais et al., 2013; Insel and Shapiro, 1992; Ménard et al., 2022; Olazábal and Young, 2006; Smith et al., 2017; Tribollet et al., 1991). Thus, the Smith’s and Dumais’ datasets provide a unique opportunity to characterize the relationship between sex and the rat brain at the level of single brain measures (assessing persistency in sex differences along dimensions 1–3 as detailed above) and the brain as a whole (assessing occurrence of mosaicism).
The Smith’s and Dumais’ cohorts included rats of the same strain and were housed in the same laboratory. Thus, some conditions were similar across the two cohorts, but others were not (for details, see Methods below). These two datasets allow us to test whether under a single set of conditions (e.g., juvenile rats), sex differences add up consistently in individual brains or form mosaics of female-typical and male-typical measures, as well as whether across conditions, sex differences are persistent across age, parental status, estrus stage, and environmental context.
2. Methods
2.1. Animals and brain measures
Two datasets were analyzed, including binding density measures for OXTR, V1aR, and MOR across different brain regions (the full list appears in Fig. 1 and the data file appears in Supplementary materials). The first dataset (Smith’s cohort; Smith et al., 2017, 2018) included juvenile and adult male and female Wistar rats. The second dataset (Dumais’ cohort; Dumais et al., 2013, Dumais and Veenema, 2016), included adult male and female Wistar rats, with the females divided into nonestrus (diestrus, metestrus) and estrus (proestrus, estrus), as well as into nulliparous and primiparous. The females in Smith’s cohort and the males in the two cohorts were sexually naive. For both the Smith’s and Dumais cohorts, rats were obtained from Charles River Laboratories (Raleigh, NC, USA) at 22 (juvenile group) or 56 (adult groups) days of age and housed under standard laboratory conditions (12 h light/dark cycle, lights on at 7:00 am, food and water available ad libitum, 22 °C, 60 % humidity). Upon arrival at the animal facility at Boston College, rats of both Smith’s and Dumais’ cohorts were housed in standard rat cages (26.7 × 48.3 × 20.3 cm). The juvenile group of the Smith’s cohort consisted of 22-day-old juvenile rats that were housed in same-sex groups of 3–4 until brain collection for receptor autoradiography at 35 days of age. The age of 35 days was chosen to be consistent with previous work on OXTR and V1aR binding in the brains of 35-day-old male rats (Lukas et al., 2010). Furthermore, 35 days of age marks a distinctive developmental stage in rats with peak levels of social play (Panksepp, 1981; Pellis and Pellis, 1990), a behavior modulated by activation of OXTR and V1aR in the brain (Bredewold et al., 2014; Veenema et al., 2012, 2013). The adult group of the Smith’s cohort consisted of 56-day-old rats housed in same-sex pairs until brain collection for receptor autoradiography at 84 days of age. The adult group of Dumais’ cohort consisted of 56-day-old rats housed in same-sex pairs except for being single-housed in novel cages for 24 h for a total of four times, one week apart starting at 63 days of age. After each 24-h isolation period, rats were exposed in their home cage to a sex-matched 4-week-old stimulus rat for 4 min, upon which the rats returned to their original home cage. At 86 days of age and two days after the last exposure to a stimulus rat, brains were collected for receptor autoradiography. All experiments were conducted in accordance with the NIH Guide to the Care and Use of Laboratory Animals and approved by the Boston College Institutional Animal Care and Use Committee (IACUC).
Fig. 1.
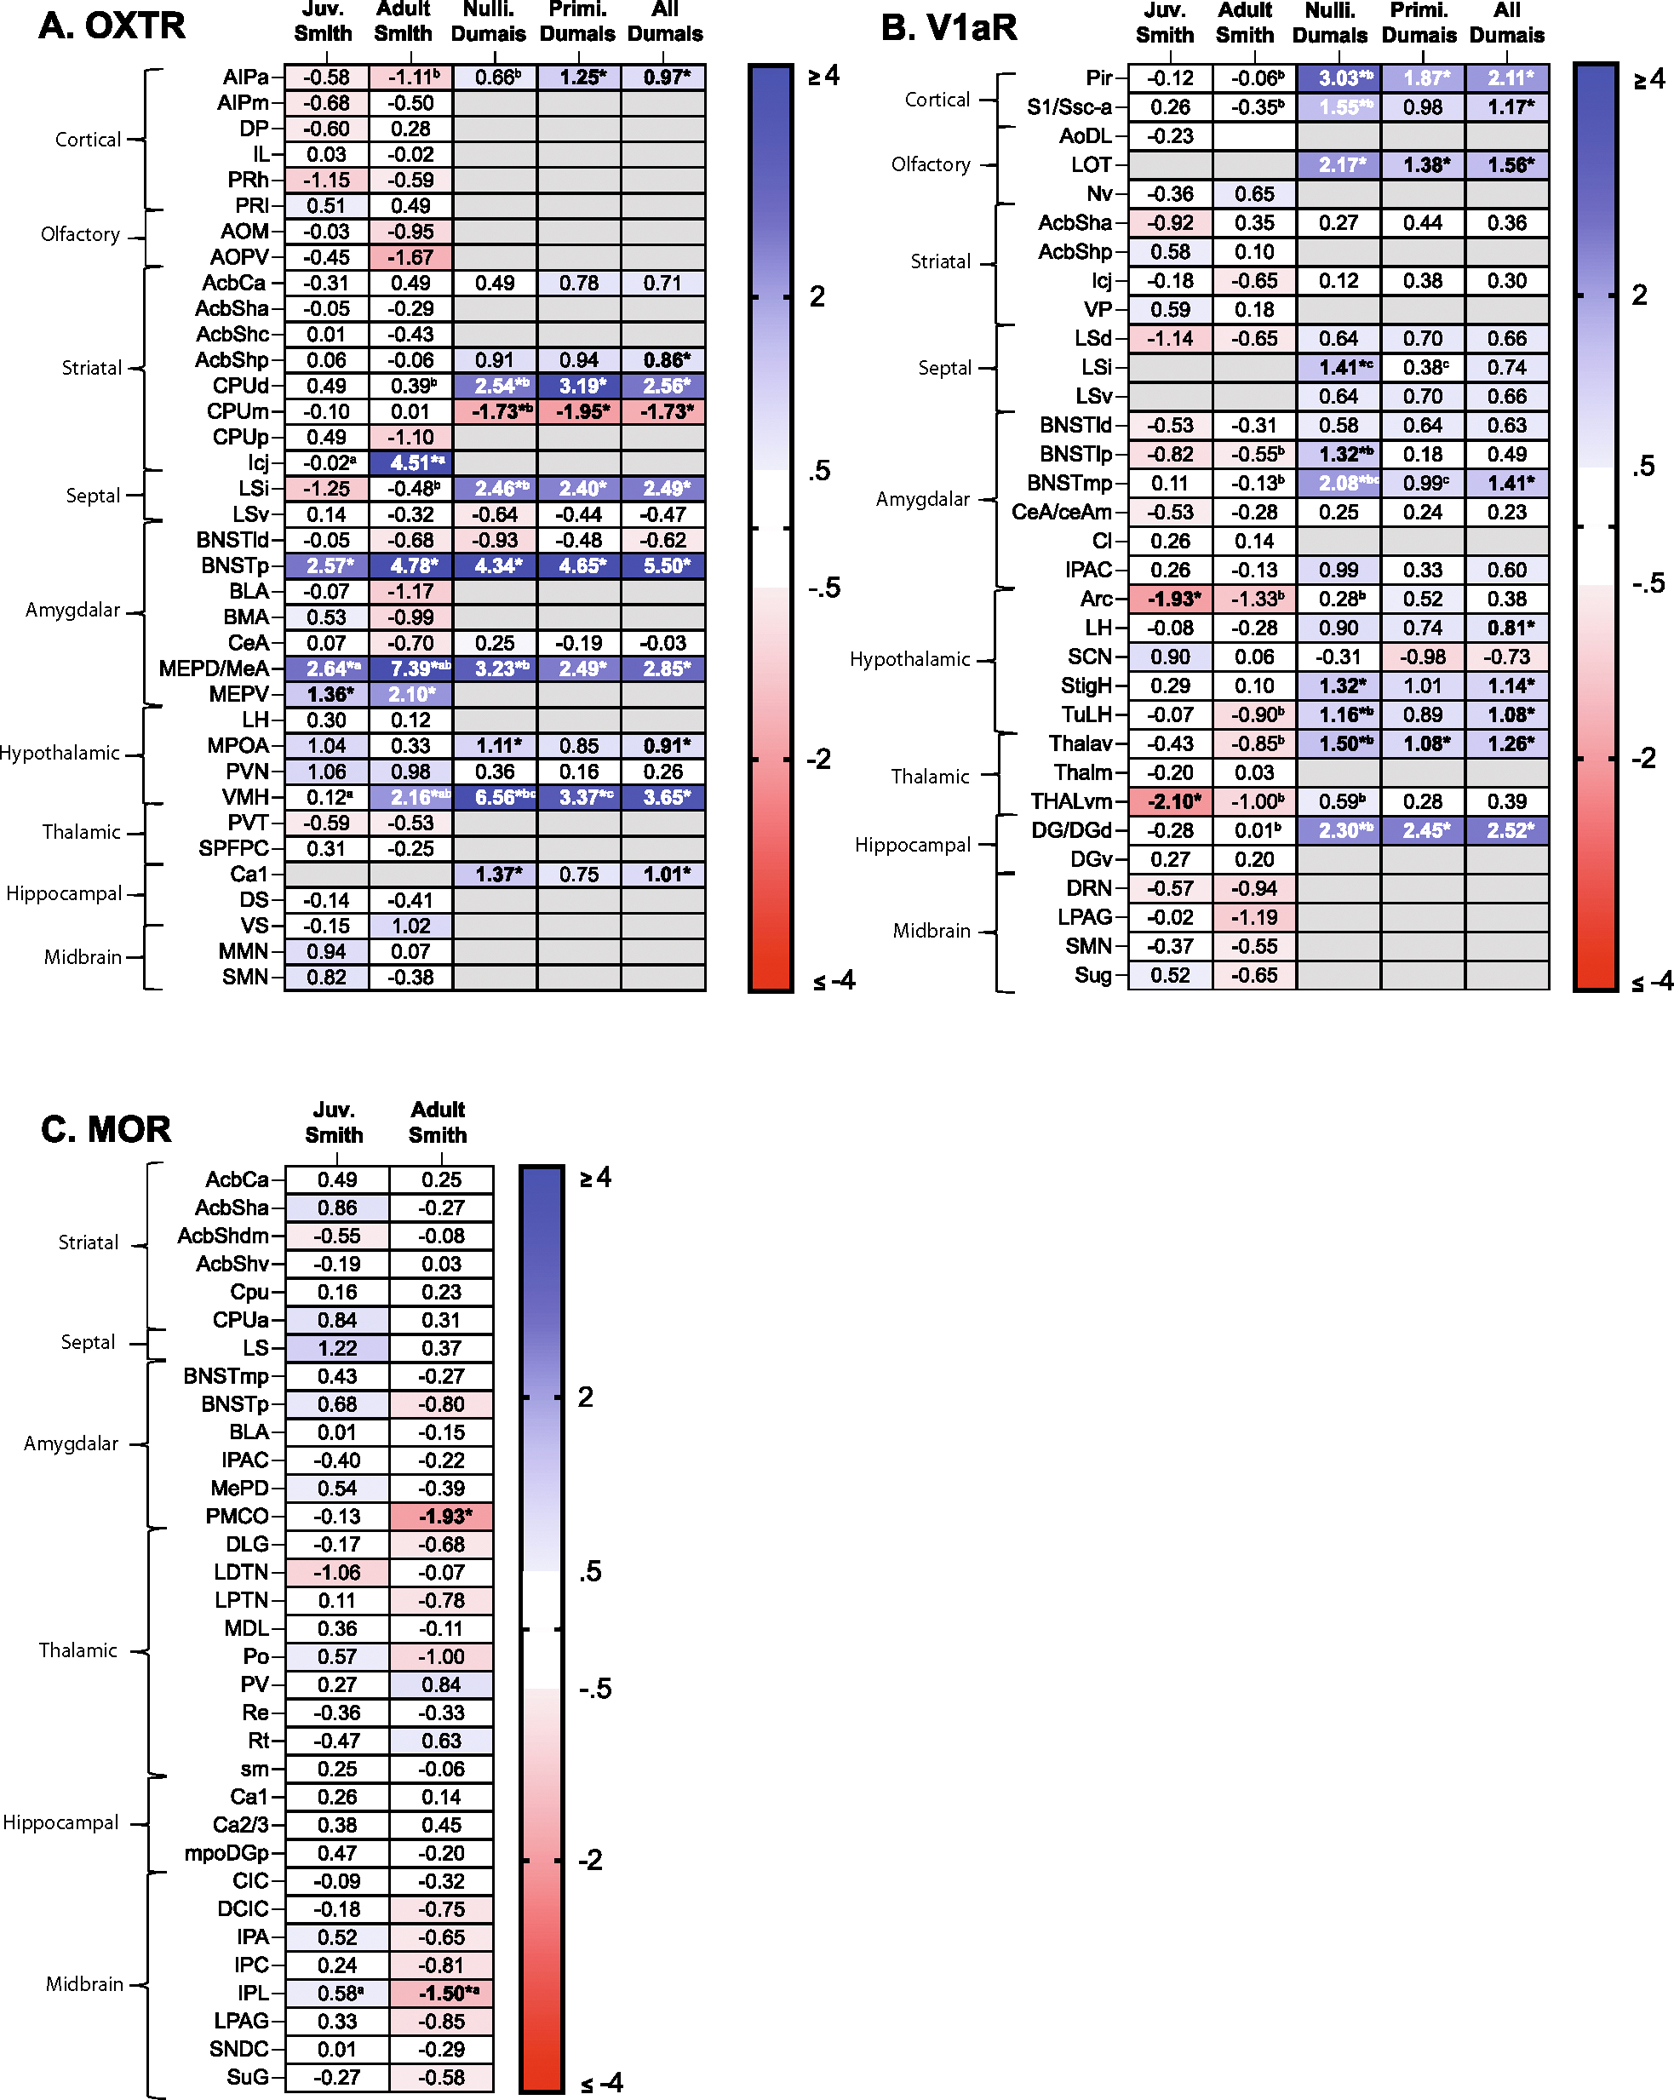
Heatmaps depicting sex difference size and persistency across conditions. Heatmaps depict Cohen’s d values for all sex differences in Smith Juvenile (Juv. Smith), Smith Adult, Dumais Adult with only nulliparous females (Nulli. Dumais), Dumais Adult with only primiparous females (Primi Dumais), and Dumais Adult with all females (All Dumais) in all brain regions for (A) OXTR, (B) V1aR, and (C) MOR. Measures for which the average score is higher in males compared to females and Cohen’s d > 0.5 are colored in blue shades (hue represents the effect size, darker = larger, up to Cohen’s d = 4); measures for which the average score is lower in males compared to females and Cohen’s d < −0.5 are colored in red shades. Significant sex differences are bolded and marked with an asterisk. a: significantly different effect size across age (Juv. Smith vs Adult Smith), b: significantly different effect size across studies (Adult Smith vs. Nulli. Dumais), c: significantly different effect size with parity (Nulli. Dumais vs Primi. Dumais). Definitions for all abbreviations can be found in the main text.
2.2. Statistical analysis
2.2.1. Sex differences at the level of single brain measures
The first aim of the current study was to assess whether sex differences were persistent or transient across four conditions, namely environment/experience (Smith versus Dumais cohorts), age (juveniles versus adults), estrous stage (estrus versus non-estrus), and parental status (nulliparous versus primiparous; Figs. 1 and 2). Because the same data were often used in more than one such comparison (e.g., Smith’s adult group was compared to both Smith’s juvenile group and Dumais’ nulliparous-versus-male group), we calculated the effect size (Cohen’s d) and significance (using Student’s t-test) of the sex difference in each measure under each condition separately.
where
Fig. 2.
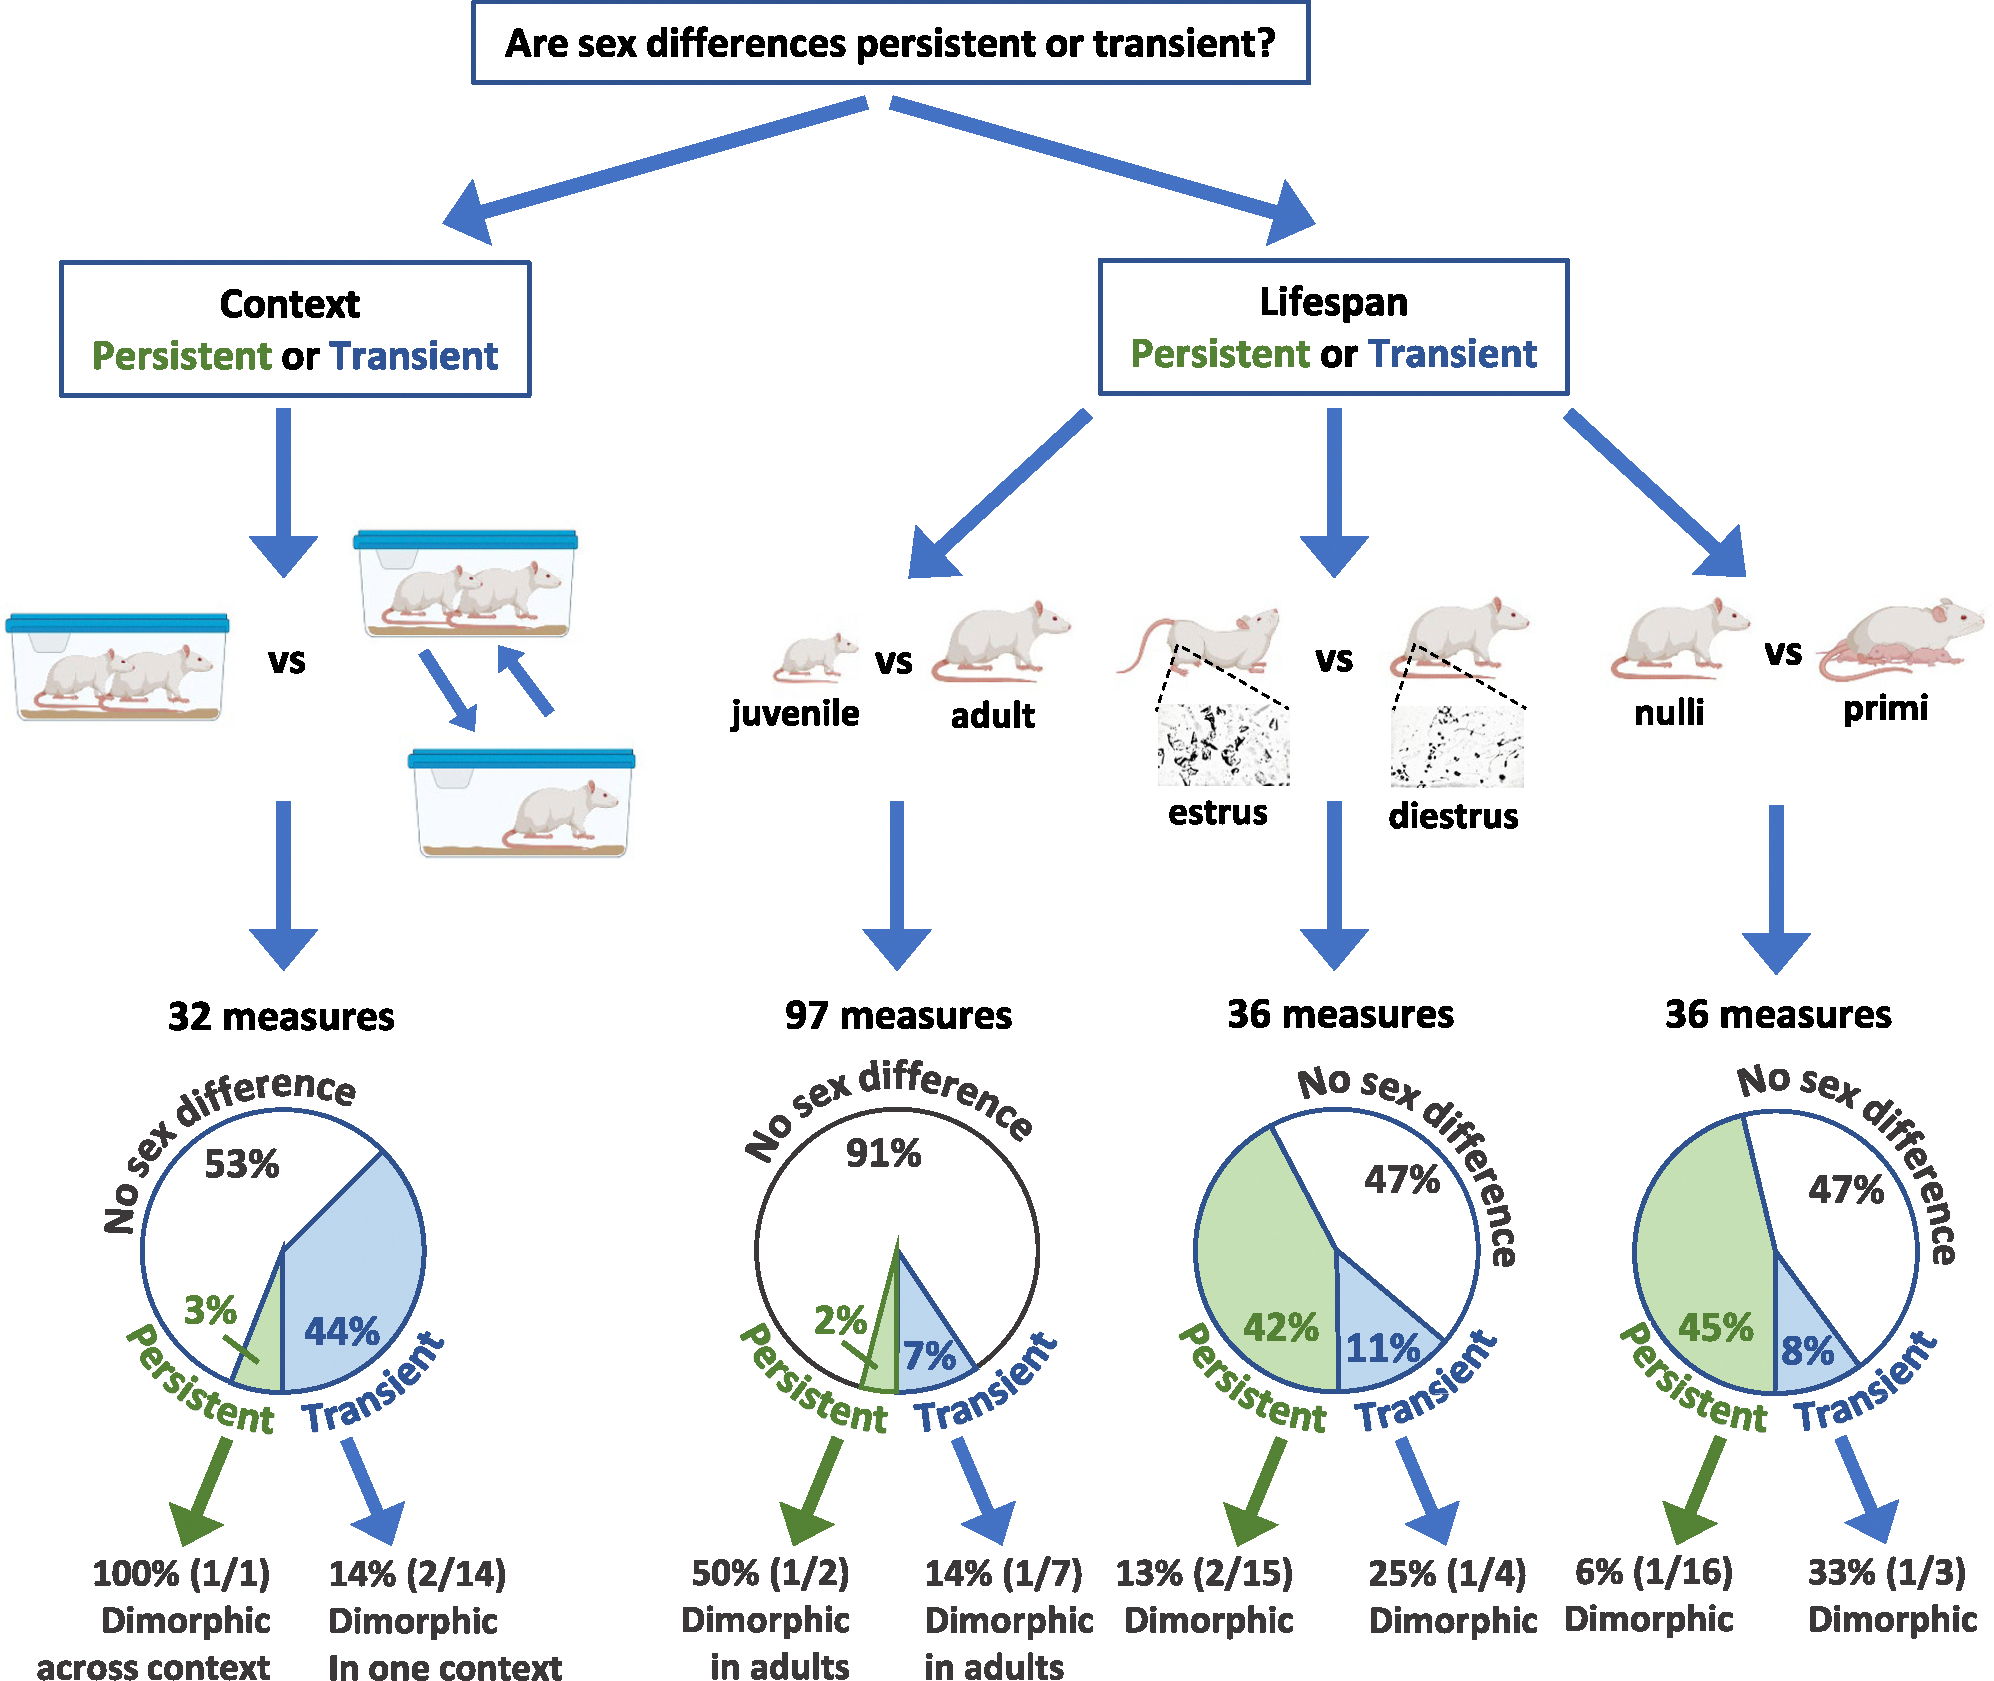
Persistency of sex differences in rat brain measures is variable across context and lifespan conditions. Context: 32 measures were assessed in sexually naïve rats from the Smith’s (left) and Dumais’ (right) cohorts. Rats in Dumais’ cohort were exposed to 4 × 24 h social isolation with a subsequent 4-min exposure to a juvenile rat. Significant sex differences in at least one of the cohorts were found in 15/32 measures; in one of these (1/15), the sex difference was persistent, that is, significant in both cohorts and of the same magnitude. This sex difference (1/1) was also sexually dimorphic in the two cohorts. Among the 14 non-persistent sex differences, two (2/14) were sexually dimorphic in one of the cohorts. Lifespan: Age: 97 measures were assessed in juvenile (5-week-old) and sexually naïve adult (12-week-old) rats from the Smith’s cohort. Significant sex differences in at least one age group were found in 9/97 measures. In two of these (2/9), the sex difference was persistent, that is, significant in both age groups and of the same magnitude, and in one of these (1/2), the sex difference was sexually dimorphic in adults. Among the 7 non-persistent sex differences, one (1/7) was sexually dimorphic in adults. Estrous stage: 36 measures were assessed in adult male and female rats (Dumais’ cohort) in which the females were either in estrus (estrus/proestrus) or in diestrus (diestrus/metestrus). Significant sex differences in at least one of the groups were found in 19/36 measures. Of these, 15 (15/19) were persistent across estrous stage, and two of these (2/15) were sexually dimorphic in at least one estrous stage. Among the 4 non-persistent sex differences, one (1/4) was sexually dimorphic in one estrous stage. Parental status: 36 measures were assessed in adult male and female rats (Dumais’ cohort) in which the females were either nulliparous or primiparous. Significant sex differences in at least one of the groups were found in 19/36 measures. Of these, 16 (16/19) were persistent across parental status, and one of these (1/16) was sexually dimorphic under one parental status. Among the 3 non-persistent sex differences, one (1/3) was sexually dimorphic under one parental status. The rat images were created with BioRender.com.
To test whether the effect size of a sex difference was significantly different at different ages (juveniles versus adults) or contexts (Smith’s adult cohort versus Dumais’ nulliparous-versus-male cohort) we used the following test of significance:
where and is the biased-corrected estimate of Cohen’s d, .
follows approximately a standard normal distribution under the assumption that the true values of the two groups are equal (Borenstein et al., 2009; Hedges and Olkin, 1985).
A different statistical approach was applied to test whether the effect size of a sex difference was significantly different across estrus stage and parental status because sex differences in these two conditions were computed using the same group of males (i.e., they were not independent). Two-way ANOVAs (with estrous stage and parental status as main factors) conducted on the female data revealed no significant interaction between estrus stage and parental status. Therefore, we tested separately for the consistency of sex differences across estrous stage and across parental status using one-way ANOVAs (e.g., males, nulliparous females, primiparous females). A significant effect was followed by a post-hoc comparison of the two female groups – a significant difference between the two female groups was taken as evidence for a significant difference between the effect size of the sex difference in the two estrous or two parental conditions.
In all analyses, the p-value was adjusted using the Benjamini-Hochberg correction (Benjamini and Hochberg, 1995). Adjusted p-values smaller than 0.05 were considered statistically significant.
2.2.2. Mosaic analysis
The second aim of this study was to test whether brains exhibit only male-typical or only female-typical measures or are mosaics of both female-typical and male-typical measures. Given the low consistency of effect sizes in sex differences across context and age, we conducted separate mosaic analyses for each of three groups: Smith Juvenile, Smith Adult, and Dumais Adult. In each analysis we included only brain measures showing a significant and large sex difference (|Cohen’s d| > 1), but for which there was still some overlap between the scores of females and males. With this criterion, there were five adequate measures for the Smith juvenile cohort (1.36 < |Cohen’s d| < 2.65), four for the Smith adult cohort (1.50 < |Cohen’s d| < 2.16), and 14 for the Dumais cohort (1 < |Cohen’s d| < 2.84). Of these 14 measures, we included the 12 for which the sex difference was consistent across estrus stage and parental status.
For each of the brain measures we defined a female-typical (F) and a male-typical (M) ranges of scores using one of three criteria: median split, 67 % cutoff, and 50 % cutoff (Fig. 3). For brain measures for which females on average scored higher than males, the median split condition labeled all scores above the median2 (of the entire sample), as female-typical (F), and all the scores below the median, as male-typical (M). With this cutoff, each score is either M or F and brains can be either mosaic – containing both F and M measures – or internally consistent (i.e., containing either only F or only M measures). In this condition we counted the number of mosaic brains and calculated the number of expected mosaics under the assumption of internal consistency. Under the latter, the overlap between the scores of females and males is expected to manifest in some males showing only F measures and some females showing only M measures. For example, if for four brain measures the overlap is such that the scores of 20 % of the males overlap those of 20 % of the females, then if brains are internally consistent, and with the median split cutoff, 20 % of the males and 80 % of the females are expected to have the four features in the F form, and 20 % of the females and 80 % of the males are expected to have the four features in the M form, and no rat should have a mosaic brain.
Fig. 3.
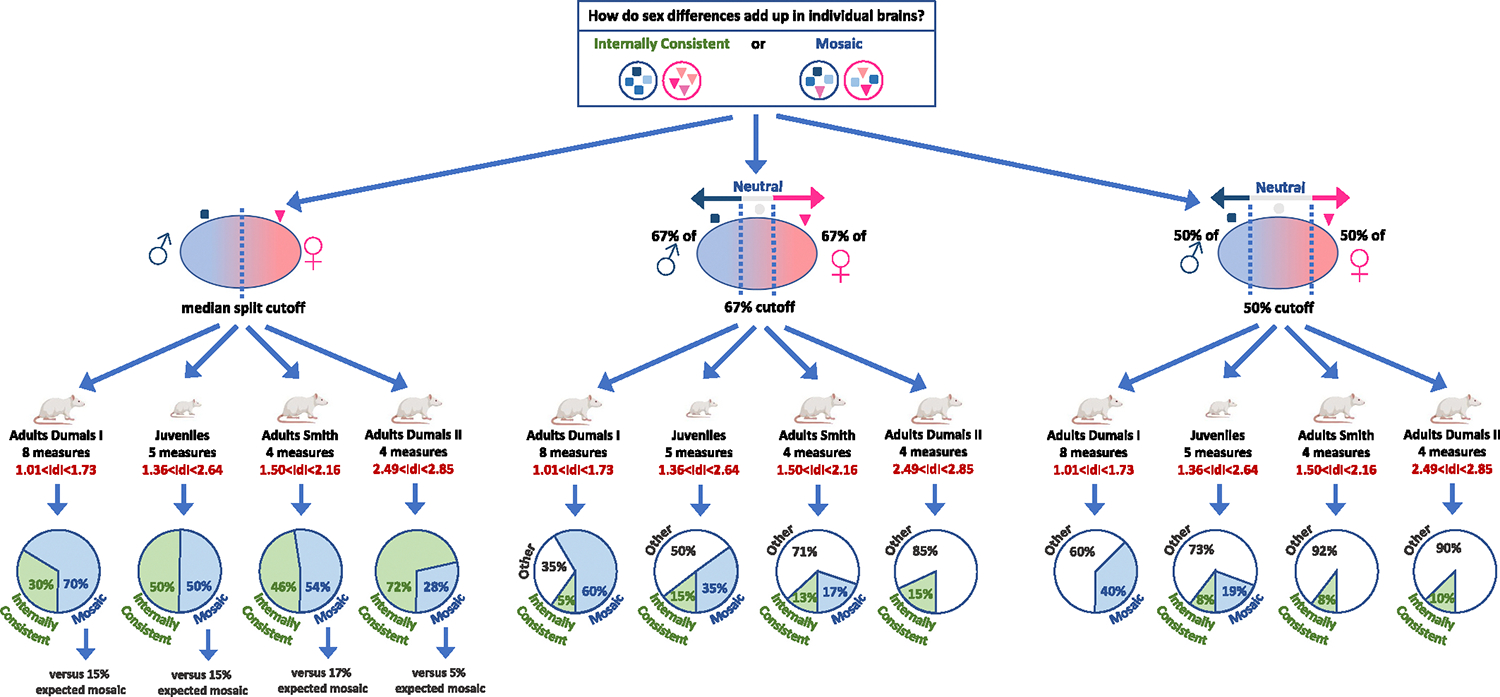
Analyses of internal consistency versus mosaic across rat brain measures in individual brains. The results of the mosaic analysis of four sets of brain measures: Adults Dumais I (8 measures), Juveniles (Smith’s cohort; 5 measures), Adults Smith (4 measures), Adults Dumais II (4 measures), with three definitions of female-typical (F), male-typical (M) (and neutral (N), were relevant) ranges of scores: median split, 67 % cutoff, and 50 % cutoff. The pie charts present the percent of internally consistent brains (containing either only F or only M measures), mosaic brains (containing both F and M measures), or, for the 67 % and 50 % cutoff analyses, ‘other’ (brains containing either only N measures, or a combination of N and M measures or of N and F measures). For the median split analysis, the number of expected mosaics under the assumption of internal consistency is reported. The rat images were created with BioRender.com.
Because the extent of overlap differed between measures, some mosaic brains were expected in our datasets even if brains were internally consistent. For example, if in the example above, there was 20 % overlap for three brain measures but 30 % overlap for the fourth brain measure (meaning that in this measure, 30 % of females had the M form and 30 % of males had the F form), then even if brains are internally consistent, 10 % of males and 10 % of females are expected to have a mosaic (MMMF and FFFM, respectively). The remaining rats will have the four features either in the F form (20 % of the males and 70 % of the females), or in the M form (20 % of the females and 70 % of the males). For this reason, we divided the 12 brain measures from the Dumais cohort into two sets (one including eight measures with 1 < |Cohen’s d| < 2, and the other including four measures with |Cohen’s d| > 2 [effectively, the effect sizes for this set ranged between 2.41 and 2.84]), and conducted a mosaic analysis for each set separately.
Continuing with the example of measures for which females on average scored higher than males, the 67 % cutoff condition labeled all scores above the score of the female in the 33th percentile3 (of the female sample), as F, all the scores below the score of the male in the 67th percentile (of the male sample), as M, and all the remaining, intermediate, scores as neutral (N); the 50 % cutoff condition was the same as the 67 % cutoff condition, but with the cutoff scores being those of the 50th percentile female and 50th percentile male (see Fig. 3). With the 67 % and 50 % cutoffs, each score is either M, F, or N, so in addition to mosaic (both F and M measures) and internally consistent brains (only F or only M measures), there are also brains containing either only N measures, or a combination of N and M measures or of N and F measures (these brains are labeled as ‘other’ in Fig. 3). In the analyses with the 67 % and 50 % cutoffs, we counted the number of mosaic brains and of internally consistent brains. Mosaicism is reflected in a greater number of mosaic brains than internally consistent brains (Joel et al., 2015, 2016). Note that we included in the count of internally consistent brains only rats that had no more than one missing value, to avoid over-estimation of the number of internally consistent brains. The problem of over-estimation does not exist for mosaic brains, because a mosaic brain (i.e., a brain containing at least one F and one M measure) will remain mosaic regardless of how additional brain measures will be included in the analysis. The opposite is true for internally consistent brains (which contain only F or only M measures) – each addition of a brain measure may turn the internally consistent brain into a mosaic or ‘other’ brain.
Code for running a mosaic analysis can be found here: https://github.com/GenderMosaic/Gender_Mosaic_Continuous_Variables.
3. Results
3.1. Sex similarities and differences in single measures
Fig. 1 presents for each of the receptor binding measures the Cohen’s d value of the sex difference in the different groups: Smith Juvenile, Smith Adult, Dumais Adult with only nulliparous females, Dumais Adult with only primiparous females, and Dumais Adult with all females. The value of each Cohen’s d is also marked using a blue (higher in males) – white (−0.5 < d < 0.5) – red (higher in females) color scale (grey indicates that the relevant measure was not assessed in that group). Significant sex differences are marked with an asterisk, and a significant difference from a sex difference in the counter group is indicated by a superscript letter (see figure legend for details). These heatmaps provide an overall view of sex similarities and differences within each condition as well as an overall view of variability in sex differences across conditions, as is further detailed below.
3.2. How persistent are sex differences across environmental/experiential conditions?
Of the 32 receptor binding density measures that were assessed in adult rats (sexually naïve males and females) in the two cohorts (Smith’s and Dumais’ cohorts), 15 measures showed a significant sex difference in at least one cohort (Figs. 1 and 2). Of these 15 measures, only three measures showed a significance difference in both cohorts (of which one measure showed a significant sex difference in the same direction and magnitude in the two cohorts and two measures showed a significant sex difference in the same direction but with a significantly different magnitude), while 12 measures showed a significant sex difference in one cohort but not in the other (of these, in ten measures the effect sizes in the two cohorts were significantly different; Figs. 1 and 2). Of the 17 measures that did not show a significant sex difference in the two cohorts, in three measures the effect sizes in the two cohorts were significantly different.
3.3. How persistent are sex differences across the lifespan?
3.3.1. Age (juvenile versus adult)
Of the 97 receptor binding density measures that were assessed in both juvenile and adult rats (Smith cohort), nine measures showed a significant sex difference in at least one age group (Figs. 1 and 2). Of these nine measures, only three showed a significant difference in both age groups (of which two measures showed a significant sex difference in the same direction and magnitude in the two age groups, and a third measure showed a significant sex difference in the same direction but with a significantly higher magnitude in adults) while seven measures showed a significant sex difference in one age group but not in the other (of these, in two measures the effect sizes in the two age groups were significantly different; Figs. 1 and 2). In all 88 measures that did not show a significant sex difference in neither age group, there was no significant difference in the effect size in the two age groups.
3.3.2. Estrous stage and parental status
Of the 36 receptor binding density measures that were assessed in the Dumais cohort, 19 showed a significant sex difference (Figs. 1 and 2). In three, the sex difference varied significantly according to parental status. Of these, in two measures the sex difference was significant in the nulliparous group only, and in the third measure, a significant sex difference was observed in the two groups but was significantly larger in the nulliparous group (Figs. 1 and 2).
In four out of the 19 measures, the sex difference varied significantly according to estrous stage (Fig. 2). Of these, in two measures, the sex difference was significant in only one of the groups (in V1aR in SCN in the estrus group and in OXTR in MPOA in the non-estrus group), and in the other two measures (OXTR in VMH and V1aR in Pir) a significant sex difference was observed in the two groups but was significantly larger in the non-estrus group. Only one measure (OXTR in VMH) was affected by both estrous stage (a larger sex difference in the non-estrus group) and parental status (a larger sex difference in the nulliparous group).
Dimorphic versus continuous:
Of the total of 101 measures assessed in the Smith’s (juveniles and adults) and/or Dumais’ (male versus all females) studies, dimorphic sex differences (i.e., with no overlap in scores between females and males) were found in only four measures - all of which were of OXTR binding density in adult rats (in BNSTp, Icj, MePD/MeA, and VMH). Three of these measures were assessed in both Smith’s and Dumais’ cohorts - one of which (OXTR in the BNSTp) showed no overlap between females and males in the two cohorts, while the other two measures (MePD/MeA and VMH) showed no overlap in one cohort but some overlap in the other cohort (Fig. 1). Of the remaining 97 measures, continuous sex differences (i.e., a significant sex difference but with overlap in scores between males and females) were found in 25. Of these 25 measures, 12 measures were assessed in both Smith’s and Dumais’ cohorts, but none of these showed a significant sex difference in both cohorts.
3.4. Mosaicism
Table 1 presents the results of the mosaic analysis for the Smith Juvenile, Smith Adult, and Dumais Adult cohorts (the latter divided into two sets of measures) under the three definitions of female-typical (F) and male-typical (M) scores (median split, 67 % cutoff, and 50 % cutoff – note that the two latter cutoffs create in addition a ‘neutral’ range of scores). With the median split cutoff, in all analyses there were more mosaic brains than would have been expected if brains were internally consistent and mosaicism were only an artifact of the differences in the degree of overlap between females and males in the different measures.
Table 1.
Summary of mosaic analyses.
| Brain region and receptor type | |Cohen’s d| | Median split | 67 % cutoff | 50 % cutoff | ||||||||||
|---|---|---|---|---|---|---|---|---|---|---|---|---|---|---|
|
|
|
|
||||||||||||
| Males with ‘F’ (missing) | Females with ‘M’ (missing) | Mosaic brains Males + females | Expected mosaic brains Males + females | Males with ‘F’ (missing) | Females with ‘M’ (missing) | Mosaics Males + females | Internally consistent brains Males + females | Males with ‘F’ (missing) | Females with ‘M’ (missing) | Mosaics Males + females | Internally consistent brains Males + females | |||
|
| ||||||||||||||
| Smith Adult | VMH OXTR | 2.16 | 2 | 2 | 4 + 9 | 2 + 2 | 0 | 1 | 2 + 2 | Rats with no missing values: 3 + 0 | 0 | 0 | Excluding rats with missing values: 2 + 0 | |
| MEPV OXTR | 2.10 | 1 | 1 | 1 | 0 | 0 (1) | 0 (1) | |||||||
| (12 Males, 12 Females) | IPL MOR | 1.50 | 3 (1) | 3 (1) | 1 (1) | 1 (1) | 0 | 0 | ||||||
| PMCO MOR | 1.93 | 3 | 3 | 1 | 0 | 1 | 0 | 0 + 0 | ||||||
| Rats with no more than one missing value: 3 + 0 | ||||||||||||||
| Excluding rats with more than one missing value: 2 + 0 | ||||||||||||||
| Smith Juveniles | BNSTp OXTR | 2.57 | 1 (1) | 1 (2) | 7 + 6 | 2 + 2 | 0 (1) | 1 (2) | 4 + 5 | 1 + 3 | 0 (1) | 1 (2) | 2 + 3 | 1 + 1 |
| (13 Males, 13 Females) | MePD/MeA OXTR | 2.64 | 1 | 1 | 0 | 1 | 0 | 0 | ||||||
| Arc V1AR | 1.93 | 1 | 1 | 1 | 1 | 1 | 0 | |||||||
| THALvm V1AR | 2.10 | 2 | 2 | 0 | 1 | 0 | 1 | |||||||
| MEPV OXTR | 1.36 | 3 | 3 | 3 | 2 | 2 | 1 | |||||||
| Dumais, I | Ca1 OXTR | 1.01 | 4 | 4 (1) | 11 + 17 | 3 + 3 | 4 | 4 | 5 + 19 | Rats with no missing values: 1 + 1 | 3 | 3 (1) | 4 + 12 | Rats with no missing values: 0 + 0 |
| 1 < |d| < 1.73 | CPUm OXTR | 1.73 | 2(1) | 2 | 1 | 2 | 0 (1) | 2 | E: 6; nonE: 6 | |||||
| Thalv V1AR | 1.26 | 5 | 5 (2) | E: 7; nonE: 10 | 2 | 5 | E: 9; nonE: 10 | 2 | 4 (2) | |||||
| (12 Males, 28 Females) | BNSTmp V1AR | 1.41 | 4 (2) | 4 (11) | 1 | 5 | E: 1; nonE: 0 | 0 (2) | 2 (11) | E: 0; nonE: 0 | ||||
| Nulli: 3; Primi: 9 | ||||||||||||||
| LOT V1AR | 1.56 | 2 (3) | 2 (8) | Nulli: 4; Primi: 13 | 1 | 1 | Nulli: 6; Primi: 13 | Nulli: 1; Primi: 0 | 0 (3) | 1 (8) | Nulli: 0; Primi: 0 | |||
| Estrus (E) = 13 | S1/Ssc-a V1AR | 1.17 | 5 | 5 (4) | 3 | 6 | 0 | 3 (4) | ||||||
| non-estrus (nonE)= 15 | Rats with no more than one missing value: 0 + 0 | |||||||||||||
| StigH V1AR | 1.14 | 5 (1) | 5 (5) | 1 | 5 | Rats with no more than one missing value: 1 + 1 | 1 (1) | 5 (5) | ||||||
| TuLH V1AR | 1.08 | 5 | 5 (3) | 3 | 5 | 3 | 1 (3) | |||||||
| Nulliparous (Nulli) = 12 | ||||||||||||||
| E: 0; nonE: 0 | ||||||||||||||
| Primiparous (Primi) = 16 | E: 1; nonE: 0 | |||||||||||||
| Nulli: 0; Primi: 0 | ||||||||||||||
| Nulli: 1; Primi: 0 | ||||||||||||||
| Dumais, II | CPUd OXTR | 2.56 | 2 | 2 | 5 + 6 | 1 + 1 | 0 | 1 | 0 + 0 | Rats with no missing values: 2 + 4 | 0 | 0 | 0 + 0 | Rats with no missing values: 1 + 3 |
| 2.41 < |d| < 2.84 | LSi OXTR | 2.49 | 2 (1) | 2 (1) | 0 (1) | 0 (1) | 0 (1) | 0 (1) | ||||||
| MePD/MeA OXTR | 2.85 | 1 | 1 (1) | E: 3; nonE: 3 | 0 (1) | 0 (1) | E: 0; nonE: 0 | 0 (1) | 0 (1) | E: 0; nonE: 0 | ||||
| E: 2; nonE: 2 | E: 2; nonE: 1 | |||||||||||||
| (12 Males, 28 Females) | DG/DGd V1AR | 2.52 | 2 | 2 (6) | 0 | 0 (6) | 0 (6) | 0 (6) | ||||||
| Nulli: 2; Primi: 4 | Nulli: 0; Primi: 0 | Nulli: 2; Primi: 2 | Nulli: 0; Primi: 0 | Nulli: 1; Primi: 2 | ||||||||||
| Estrus (E) = 13 | Rats with no more than one missing value: 1 + 4 | |||||||||||||
| non-estrus (nonE) = 15 | Rats with no more than one missing value: 2 + 7 | |||||||||||||
| Nulliparous (Nulli) = 12 | E: 2; nonE: 2 | |||||||||||||
| E: 3; nonE: 4 | ||||||||||||||
| Primiparous (Primi) = 16 | Nulli: 2; Primi: 2 | |||||||||||||
| Nulli: 3; Primi: 4 | ||||||||||||||
Expected mosaic brains: the number of mosaic brains expected with these numbers of males with F and females with M, if brains were internally consistent (see text for an explanation); Internally consistent brains: brains with only F or only M brain measures; Missing: Rats with missing data for this brain measure; Mosaic brains: brains with both F and M brain measures. Bold highlights the main findings - the number of mosaic brains and of expected mosaic/internally consistent brains.
With the 67 % and 50 % cutoffs there were two patterns of results (Table 1, Fig. 3). The two analyses including four brain measures (Smith Adult cohort, 1.50 < |Cohen’s d| < 2.16, and Dumais II, |Cohen’s d| > 2.41) yielded more (or a similar number of) internally consistent brains than mosaic brains. In contrast, the other two analyses (Smith Juvenile cohort, five measures, 1.36 < |Cohen’s d| < 2.65, and Dumais I, eight measures, 1 < |Cohen’s d| < 2) revealed more mosaic brains than internally consistent brains. Fig. 4A represents the results of the mosaic analysis of the Dumais I dataset with the 67 % cutoff – showing for each rat and for each brain measure whether the rat’s score was ‘male-typical’ (blue), ‘neutral’ (white), or ‘female-typical’ (pink; grey indicates missing data) and reflecting the unique pattern of blue, white, and pink scores for each of the rats. Fig. 4B represents the individual scores grouped by sex on each of the eight brain measures included in the mosaic analysis presented in Fig. 4A.
Fig. 4.
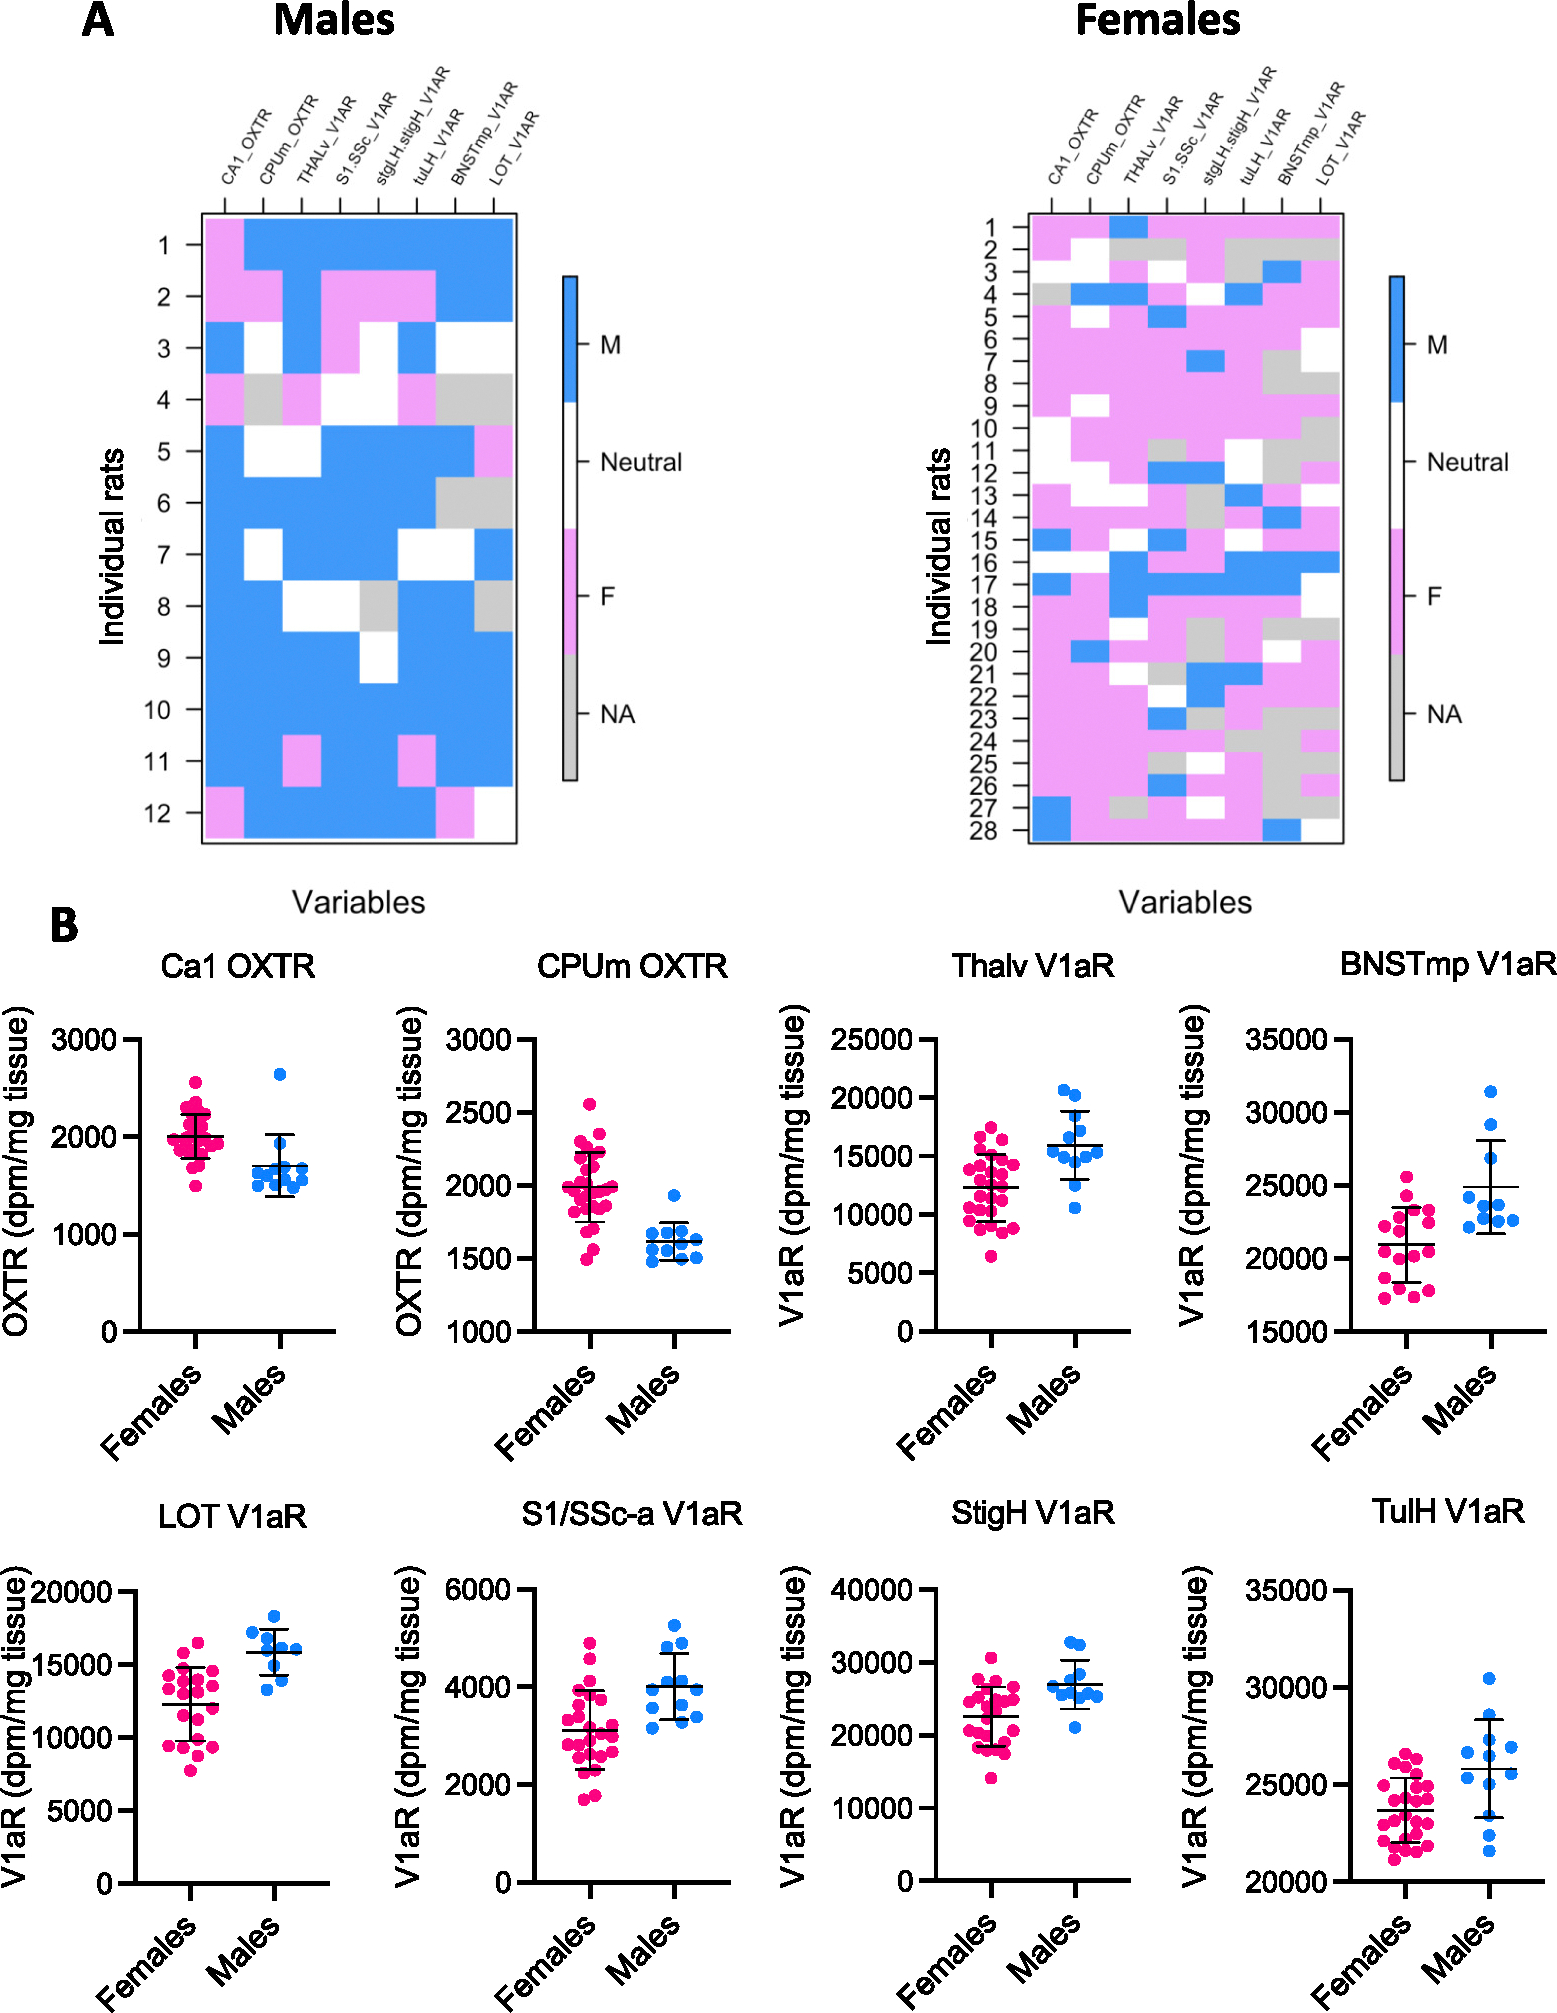
Mosaic analysis and individual scores on the eight brain measures of the Dumais I dataset using the 67 % cutoff. A. Visual representation of the mosaic analysis of the Dumais I dataset using the 67 % cutoff. Each vertical column represents one brain measure, and each horizontal row represents one rat depicting whether a rat’s score is ‘male-typical’ (blue), ‘neutral’ (white), or ‘female-typical’ (pink; grey indicates missing data = NA). B. The individual scores grouped by sex on each of the eight brain measures included in the mosaic analysis presented in A. The mean and standard deviation of the mean score of females and males are also presented.
As can be seen in Table 1, the proportion of females showing mosaic was similar in nonestrus and estrus rats but was higher in primiparous versus nulliparous females.
4. Discussion
The present study reanalyzed data on measures of receptor binding density of three neuropeptides (oxytocin, vasopressin, and opioids) in multiple brain regions of Wistar rats. A comprehensive review and discussion of the three neurotransmitter systems, how they are affected by sex, age, estrus cycle, and parental experience, and their relevance to behavior is available elsewhere (Albers, 2015; Bredewold and Veenema, 2018; Dumais et al., 2013; Dumais and Veenema, 2016; Jurek and Neumann, 2018; Rae et al., 2022; Smith et al., 2017, 2018, 2019). The sole focus of the present study was using these datasets to test whether sex differences in these measures are persistent across the lifespan and across context, and whether they ‘add up’ consistently in individual brains or form ‘mosaics’ of female-typical and male-typical measures. Our main findings are that most sex differences were persistent across estrous stage and parental status (nulliparous versus primiparous), but not across age and context; measures showing a dimorphic sex difference were very rare; mosaicism was evident when measures showing at least some overlap between females and males were considered, and the degree of mosaicism depended on the number of measures included and the size of the sex difference in these measures (more mosaicism with more measures and with smaller effect sizes).
4.1. Sex differences in single brain measures: dimorphic versus continuous; persistent versus transient; context independent versus dependent
While the number of rats per group in the different cohorts (in most groups, n = 12–14) is typical of this kind of research, the large number of female-male comparisons (especially in the Smith’s cohorts) resulted in even large effect sizes being statistically non-significant (e.g., OXTR binding density in the AOPV: Cohen’s d = 1.67, t-test adjusted p value = 0.10). Likewise, the large number of comparisons of effect size across conditions, resulted in many such comparisons being non-significant, even when the observed effect sizes seemed very different (e.g., Cohen’s d = 2.57 versus 4.78). Thus, our analyses most likely provide an overestimate of persistency of sex differences across conditions. For this reason, the discussion below provides a qualitative, rather than a quantitative, summary of the results.
Measures showing a dimorphic sex difference (i.e., no overlap in scores between males and females) were very rare in our analyzed datasets (4/101). Moreover, in two of these four measures, the sex difference was dimorphic in one cohort but not in the other. For example, there was no overlap between females and males in the density of OXTR in the MEPD/MeA in Smith’s cohort, Cohn’s d = 7.39, but the scores of females and males did overlap in Dumais’ cohort, Cohen’s d = 3.23. These findings demonstrate that dimorphic sex differences in binding density of OXTR, V1aR, and MOR are not only rare but may also be context dependent.
To the best of our knowledge, the effect sizes of the dimorphic sex differences observed in the present analyses (Cohen’s d between 3.65 and 7.39) are among the largest known in the rat brain. For example, estimates of the effect sizes of the sexually dimorphic vasopressin fiber density in subregions of the lateral septum in rats (Cohen’s d ranged between 2.81 and 3.08; calculated by Dr. Alexa Veenema based on data from DiBenedictis et al., 2017) are lower than the effect sizes of dimorphic sex differences in our analysis. The effect sizes reported in the present analysis are comparable to those reported for the most robust dimorphic sex difference in the mammalian brain – the volume of the sexually dimorphic nucleus of the preoptic area (SDN-POA, Gorski et al., 1978, 1980). Estimates of the effect size of this region, made using calbindin (which is an acceptable method for the reliable delineation of this nucleus, Sickel and McCarthy, 2000), range from 1.6 to 5.2 (calculations provided by Dr. Susan Zup based on Madden et al., 2016). We therefore recommend that statements regarding a sex difference being dimorphic will be restricted to brain measures in which such a difference was observed in a very large sample or in several small samples.
We found that most sex differences are persistent across estrous stage (15 out of 19 measures) and parental status (16 out of 19 measures). Very few studies tracked sex differences across parental experience. One study found variations in sex differences in breeding versus non-breeding wild meadow voles for several brain and hormone measures (Galea and McEwen, 1999). Another study comparing virgin versus parent mice found variations in sex differences in one brain measure (activation of MPOA-GABA neurons) but not in another (galanin mRNA expression in MPOA, Wu et al., 2014). Variations in sex differences across the estrous cycle have been reported for several brain measures (e.g., dendritic spine density in the hippocampus, Shors et al., 2001; Woolley et al., 1990; dentate gyrus cell proliferation and cell death, Tanapat et al., 1999). It should be noted that in the present study, most of the brain measures that did not vary by parental and/or estrous status did vary across context. The fact that some measures vary by parental and/or estrous status and some do not may be related to variability in the timing and mechanisms underlying the formation and maintenance of sex differences in different brain measures (e.g., Joel and McCarthy, 2017; Joel et al., 2020; McCarthy and Arnold, 2011). For example, sex differences which maintenance depends on the level of sex-related hormones in females (as may be the case for dendritic spine density in the hippocampus, Dalla & Shors, 2009) are expected to vary by parental and/or estrous status, whereas sex differences maintained by other sex-related variables in females or by sex-related variables in males (such as vasopressin fiber density in the lateral septum, De Vries et al., 1983) are not expected to vary in this way.
There was more variation in sex differences across age, with only three out of nine measures showing a significant sex difference in both juveniles and adults (OXTR binding density in the BNSTp, MEPD/MeA, and MEPV). Including older or aging rats in future studies would be required to determine whether these sex differences are persistent or transient with aging. Variation in sex differences in brain measures such as OXTR, V1aR, and MOR density across the lifespan is in line with other reports. For example, variability in sex differences across lifespan trajectories (age range: 16–70 years) were found in multiple cortex morphology measures of neurotypical human subjects (Díaz-Caneja et al., 2021). In rats, variability in sex differences across the lifespan (adolescent, young adults, middle-aged) were observed in several inflammation markers in the hippocampus and amygdala (Hodges et al., 2022). Such observations suggest that understanding how sex differences in the brain change across the lifespan may benefit preventative and therapeutic treatment of various neurological and psychiatric disorders (Blaya et al., 2022; Jett et al., 2022; Rossi et al., 2022; Vigod and Stewart, 2009; Zsido et al., 2017).
We observed a large variability in sex differences across environmental/experiential conditions. The main difference between the Smith’s and Dumais’ sexually naïve adult cohorts was the social environment. During the four-week period between arrival at the animal facility and brain collection, the social environment was stable in the Smith’s cohort (rats were housed in sex-matched pairs) but was variable in the Dumais’ cohort (rats were housed in sex-matched pairs but also experienced four times of social isolation for 24 h followed by a 4-min exposure to a juvenile rat). This variable social environment was associated with more sex differences than the stable social environment (15 vs 4 out of 32 measures4). Given that short-term social isolation affects the expression of social behavior in male and female rats (Panksepp and Beatty, 1980; Niesink and van Ree, 1982; Van den Berg et al., 1999; Leser and Wagner, 2015), the present observation raises the intriguing possibility that exposure to more diverse social experiences results in more sex differences in measures of OXTR and V1aR receptor binding density. Future studies may reveal whether and how this translates into sex-specific behavioral changes.
It should be noted, however, that there might have been hidden variables (Butler-Struben et al., 2022) in addition to the difference in social environment that could have contributed to the variability in sex differences between the Smith’s and Dumais’ sexually-naïve adult cohorts. Despite the many similarities between the two cohorts (including strain, breeder, age at arriving to the laboratory and at brain collection, and standard housing conditions), these were two separate studies that varied on variables like time of year, experimenter, and different cohorts of rats. The present analysis does not reveal the factor(s) responsible for this inconsistency nor whether the same factor is responsible for the inconsistency in all brain measures.
What the present analysis does reveal is that of the OXTR and V1aR whose binding density was affected by sex-related factors, most were affected by an interaction of these factors with environmental and/or experiential factors. Such interactions have been previously described for other brain measures, including dendritic morphology, spine density, and cell number and density (reviewed in Joel, 2011, 2012). The present study adds OXTR and V1aR to this list. Moreover, our study reveals that variation of sex differences across environmental conditions may occur also for very large sex differences (Cohen’s d > 2.4). Together, these observations suggest that even generalizations regarding the existence of a sex difference within a specific strain and age group should not rely on a single study; all the more so when it comes to generalizations across strains and species (Joel and Yankelevitch-Yahav, 2014).
4.2. Sex differences across multiple brain measures: mosaicism or internal consistency
The main question of the mosaic analysis was whether single brains are internally consistent in having only female-typical or only male-typical brain measures, or instead, are comprised of unique mosaics of female-typical and male-typical measures. To make sure our conclusions do not depend on the specific definition of female-typical (F) and male-typical (M) scores, we used three such definitions (median split, 67 % cutoff, 50 % cutoff). The main conclusions from all analyses are three-fold: First, when brain measures for which there is overlap between females and males (i.e., some females with the M form, and some males with the F form) are considered, some brains show mosaicism. Second, the degree of mosaicism depends on the number of measures included (more mosaicism with more measures) and the size of the sex difference in these measures (more mosaicism with smaller effect sizes). Third, mosaicism is higher in rats with more diverse life experiences.
Specifically, with the median split cutoff, in all analyses there were more mosaic brains than would have been expected if brains were internally consistent. With the 67 % and 50 % cutoffs, the number of mosaic brains was higher than the number of internally consistent brains (a strong indication of mosaicism in the data, Joel et al., 2016) in the Smith Juvenile cohort and in the Dumais I set of measures, but not in the Smith Adult cohort and in the Dumais II set of measures.
An interesting observation is that within the Dumais cohort, there was higher mosaicism in primiparous compared to nulliparous females. This finding is consistent with the proposal that mosaicism is created by the complex interactions of sex-related factors with many other internal and external variables, and that therefore higher mosaicism is expected in individuals with more diverse life experiences (Joel, 2021). In the present context, higher mosaicism may be attributed to parenting, with the many internal and external changes it brings, which likely interact with many other variables to affect brain structure, leading to greater mosaicism.
A similar logic leads to the hypothesis that mosaicism will increase with age. Although the present study included both juvenile and adult rats, unfortunately it was not possible to test this hypothesis because the two mosaic analyses in the two age groups were conducted on different brain measures.
Mosaicism reflects the fact, described above, that many brain measures are affected by the interaction of sex-related factors with other factors, and that these interactions may be different for different endpoints. The latter is a consequence of the multiplicity of mechanisms by which sex-related factors affect specific brain features (e.g., McCarthy and Arnold, 2011). This multiplicity may be evident even within a single brain structure. For example, the BNSTp is larger on average in males compared to females (del Abril et al., 1987; Hines et al., 1992) and also shows a large sex difference in OXTR binding density. However, at least in rats, the two sex differences appear to be driven by different mechanisms, as neonatal administration of the histone deacetylase inhibitor valproic acid reduced the sex difference in BNSTp size (Worley et al., 2019) but did not affect the sex difference in OXTR binding density (Worley et al., 2019).
The present findings of mosaicism in the rat brain add to previous findings of mosaicism in the human brain, in both MRI- and post mortem-derived measures (Joel et al., 2015, 2020), and extend these findings also to brain measures showing very large sex differences, of the type rarely (if ever) observed in the human brain. Together, these findings suggest that the relations between sex category and the brain are better conceptualized as mosaic (of female-typical and male-typical features) than as binary – ‘female’ and ‘male’ brains. Within the mosaic framework, it is better to look for the relations between specific mosaics and specific endpoints (such as a psychological or a neurological condition) rather than between some male-female dimension and such endpoints (e.g., internalizing symptoms, Zhang et al., 2021) (Joel and Fausto-Sterling, 2016; Joel, 2021).
5. Conclusions
The present analyses reveal that sex differences in measures of receptor binding of oxytocin, vasopressin, and opioids do not fit into a binary framework – they are rarely dimorphic and persistent. Instead, most measures that show a sex difference, show varying degrees of overlap between males and females and the sex differences are often context-dependent. The latter suggests that the levels of receptor binding are determined by an interaction of sex-related variables with other variables – interactions that are also manifested in single brains often being composed of mosaics of measures, some with female-typical and others with male-typical receptor binding levels. Together, these observations suggest two, not mutually excluding, pathways to understand the contribution of sex to the function of the brain under healthy and diseased conditions: one is to focus on those brain measures for which sex is the most important determining factor, as reflected in dimorphic sex differences across multiple conditions. Of the 101 brain measures considered here, one may fit this description – OXTR binding density in the BNSTp. The second pathway is applicable to most brain measures, for which sex-related variables are part of a large array of variables that interact in complex ways to affect their structure and function, as is evident in the overlap between females and males within samples, and in variability in observed sex differences across samples. For these measures it is recommended to attempt to discover the interactions between their main determining factors (sex-related or not) as well as the relations between specific combinations of such brain measures and specific endpoints (such as a psychological or a neurological condition).
Supplementary Material
Acknowledgements
We would like to thank Charles Bokobza and Noam Teitelman for their help with the statistical analysis.
This work was partly supported by the National Institutes of Health [R01MH125806 to AHV and R00ES033278 to CJS].
Abbreviations
- AcbCa
anterior nucleus accumbens core
- AcbSha
anterior nucleus accumbens shell
- AcbShc
central nucleus accumbens shell
- AcbShdm
dorsomedial nucleus accumbens shell
- AcbShp
posterior nucleus accumbens shell
- AIPa
anterior agranular insular cortex
- AIPm
medial agranular insular cortex
- AoDL
anterior olfactory nucleus, dorsolateral part
- AOM
anterior olfactory nucleus, medial part
- AOPV
anterior olfactory nucleus, posterior ventral part
- Arc
arcuate nucleus
- BLA
basolateral amygdala
- BMA
basomedial amygdala
- BNSTld
bed nucleus of the stria terminalis, lateral division, dorsal part
- BNSTlp
bed nucleus of the stria terminalis, lateral division, posterior part
- BNSTmp
bed nucleus of the stria terminalis, posteromedial part
- BNSTp
bed nucleus of the stria terminalis, posterior part
- Ca1
CA1 layer of the hippocampus
- Ca2/3
CA2/3 layer of the hippocampus
- CeA
central amygdala
- CIC
central nucleus of the inferior colliculus
- Cl
claustrum
- CPU
caudate putamen
- CPUa
anterior caudate putamen
- CPUd
dorsal caudate putamen
- CPUm
medial caudate putamen
- CPUp
posterior caudate putamen
- DCIC
dorsal cortex of the inferior colliculus
- DG/DGd
dentate gyrus/ dorsal dentate gyrus
- DGv
ventral dentate gyrus
- DLG
dorsal lateral geniculate nucleus
- DP
dorsal peduncular cortex
- DRN
dorsal raphe nucleus
- DS
dorsal subiculum
- Icj
islands of Calleja
- IL
infralimbic cortex
- IPA
apical subnucleus of the interpeduncular nucleus
- IPAC
interstitial nucleus of the posterior limb of the anterior commissure
- IPC
caudal subnucleus of the interpeduncular nucleus
- IPL
lateral subnucleus of the interpeduncular nucleus
- LDTN
laterodorsal thalamic nucleus
- LH
lateral hypothalamus
- LOT
lateral olfactory tubercle
- LPAG
lateral periaquaductal grey
- LPTN
lateroposterior thalamic nucleus
- LS
lateral septum
- LSd
lateral septum, dorsal part
- LSi
lateral septum nucleus, intermediate part
- LSv
lateral septum nucleus, ventral part
- MDL
mediodorsal thalamus, lateral part
- MePD/MeA
medial amygdala, posterodorsal part/ medial amygdala
- MEPV
medial amygdala, posteroventral part
- MMN
medial mammillary nucleus
- mpoDGp
molecular layer of the dentate gyrus, posterior part
- MOR
mu opioid receptor
- MPOA
medial preoptic area
- Nv
navicular nucleus of the basal forebrain
- OXTR
oxytocin receptor
- Pir
piriform cortex
- PMCO
posteromedial cortical amygdaloid nucleus
- Po
posterior thalamic nuclear group
- PRh
perirhinal cortex
- PRl
prelimbic cortex
- PV
paraventricular thalamic nucleus
- PVN
paraventricular hypothalamic nucleus
- PVT
paraventricular thalamic nucleus
- Re
reuniens nucleus of the thalamus
- Rt
reticular nucleus of the thalamus
- S1/Ssc-a
primary somatosensory cortex
- SCN
suprachiasmatic nucleus
- SNDC
substantia nigra, dorsal tier, compact part
- sm
stria medularis of the thalamus
- SMN
supramammillary nucleus
- SPFPC
subparafascicular nucleus
- StigH
stigmoid hypothalamic nucleus
- Sug
superficial grey layer of the superior colliculus
- Thalav
anteroventral thalamic nucleus
- Thalm
medial thalamic nucleus
- THALvm
ventromedial thalamic nucleus
- TuLH
tuberal region of the lateral hypothalamus
- V1aR
vasopressin V1a receptor
- VMH
ventromedial hypothalamic nucleus
- VP
ventral pallidum
- VS
ventral subiculum
Footnotes
This paper is part of the Virtual Special Issue, Sex/gender diversity.
In samples in which the number of males (n1) and females (n2) was different, and continuing with the example of measures for which females on average scored higher than males, the split was between the scores n1 and n1 + 1.
In other words, the ‘female-typical’ range of scores was defined as the range of scores of the 67 % of females with the highest scores.
To make sure this difference is not a result of the different number of comparisons in the two cohorts, for each dataset we re-adjusted the p-value according to 32 comparisons; the n per group in the two cohorts was the same.
Declaration of competing interest
None.
Appendix A. Supplementary data
Supplementary data to this article can be found online at https://doi.org/10.1016/j.yhbeh.2023.105471.
References
- Albers HE, 2015. Jan. Species, sex and individual differences in the vasotocin/vasopressin system: relationship to neurochemical signaling in the social behavior neural network. Front. Neuroendocrinol. 36, 49–71. [DOI] [PMC free article] [PubMed] [Google Scholar]
- Arnold AP, Chen X, 2009. What does the “four core genotypes” mouse model tell us about sex differences in the brain and other tissues? Front. Neuroendocrinol. 30 (1), 1–9. [DOI] [PMC free article] [PubMed] [Google Scholar]
- Arsenijevic Y, Dreifuss JJ, Vallet P, Marguerat A, Tribollet E, 1995. Nov 6. Reduced binding of oxytocin in the rat brain during aging. Brain Res. 698 (1–2), 275–279. [DOI] [PubMed] [Google Scholar]
- Bale TL, Dorsa DM, Johnston CA, 1995. Jul. Oxytocin receptor mRNA expression in the ventromedial hypothalamus during the estrous cycle. J. Neurosci. 15 (7 Pt 1), 5058–5064. [DOI] [PMC free article] [PubMed] [Google Scholar]
- Baxter A, Anderson M, Seelke AM, Kinnally EL, Freeman SM, Bales KL, 2020. Oct 14. Oxytocin receptor binding in the titi monkey hippocampal formation is associated with parental status and partner affiliation. Sci. Rep. 10 (1), 17301. [DOI] [PMC free article] [PubMed] [Google Scholar]
- Benjamini Y, Hochberg Y, 1995. Controlling the false discovery rate: a practical and powerful approach to multiple testing. J. Royal Stat. Soc. Ser. B 57 (1), 289–300. [Google Scholar]
- Blaya MO, Raval AP, Bramlett HM, 2022. Mar. Traumatic brain injury in women across lifespan. Neurobiol. Dis. 164, 105613. [DOI] [PubMed] [Google Scholar]
- Bobotis BC, Braniff O, Gargus M, Akinluyi ET, Awogbindin IO, Tremblay MÈ, 2023. Oct 1. Sex differences of microglia in the healthy brain from embryonic development to adulthood and across lifestyle influences. Brain Res. Bull. 202, 110752. [DOI] [PubMed] [Google Scholar]
- Borenstein M, Hedges LV, Higgins JPT, Rothstein HR, 2009. Introduction to Meta-analysis. John Wiley & Sons, p. 156. [Google Scholar]
- Bredewold R, Veenema AH, 2018. Apr. Sex differences in the regulation of social and anxiety-related behaviors: insights from vasopressin and oxytocin brain systems. Curr. Opin. Neurobiol. 49, 132–140. [DOI] [PMC free article] [PubMed] [Google Scholar]
- Bredewold R, Smith CJ, Dumais KM, Veenema AH, 2014. Jun 16. Sex-specific modulation of juvenile social play behavior by vasopressin and oxytocin depends on social context. Front. Behav. Neurosci. 8, 216. [DOI] [PMC free article] [PubMed] [Google Scholar]
- Butler-Struben HM, Kentner AC, Trainor BC, 2022. Jun. What’s wrong with my experiment?: the impact of hidden variables on neuropsychopharmacology research. Neuropsychopharmacology 47 (7), 1285–1291. [DOI] [PMC free article] [PubMed] [Google Scholar]
- Dalla C, Shors TJ, 2009. Sex differences in learning processes of classical and operant conditioning. Physiol Behav. 97 (2), 229–238. [DOI] [PMC free article] [PubMed] [Google Scholar]
- de Vries GJ, Forger NG, 2015. Aug 15. Sex differences in the brain: a whole body perspective. Biol. Sex Differ. 6, 15. [DOI] [PMC free article] [PubMed] [Google Scholar]
- De Vries GJ, Best W, Sluiter AA, 1983. Jun. The influence of androgens on the development of a sex difference in the vasopressinergic innervation of the rat lateral septum. Brain Res. 284 (2–3), 377–380. [DOI] [PubMed] [Google Scholar]
- del Abril A, Segovia S, Guillamón A, 1987. The bed nucleus of the stria terminalis in the rat: regional sex differences controlled by gonadal steroids early after birth. Dev. Brain Res. 32, 295–300. [DOI] [PubMed] [Google Scholar]
- Díaz-Caneja CM, Alloza C, Gordaliza PM, Fernández-Pena A, de Hoyos L, Santonja J, Buimer EEL, van Haren NEM, Cahn W, Arango C, Kahn RS, Hulshoff Pol HE, Schnack HG, Janssen J, 2021. Oct 1. Sex differences in lifespan trajectories and variability of human Sulcal and Gyral morphology. Cereb. Cortex 31 (11), 5107–5120. [DOI] [PubMed] [Google Scholar]
- DiBenedictis BT, Nussbaum ER, Cheung HK, Veenema AH, 2017. Aug 1. Quantitative mapping reveals age and sex differences in vasopressin, but not oxytocin, immunoreactivity in the rat social behavior neural network. J. Comp. Neurol. 525 (11), 2549–2570. [DOI] [PMC free article] [PubMed] [Google Scholar]
- Dumais KM, Veenema AH, 2016. Jan. Vasopressin and oxytocin receptor systems in the brain: sex differences and sex-specific regulation of social behavior. Front. Neuroendocrinol. 40, 1–23. [DOI] [PMC free article] [PubMed] [Google Scholar]
- Dumais KM, Bredewold R, Mayer TE, Veenema AH, 2013. Sep. Sex differences in oxytocin receptor binding in forebrain regions: correlations with social interest in brain region- and sex- specific ways. Horm. Behav. 64 (4), 693–701. [DOI] [PubMed] [Google Scholar]
- Galea LA, McEwen BS, 1999. Mar. Sex and seasonal differences in the rate of cell proliferation in the dentate gyrus of adult wild meadow voles. Neuroscience 89 (3), 955–964. [DOI] [PubMed] [Google Scholar]
- Gorski RA, Gordon JH, Shryne JE, Southam AM, 1978. Jun 16. Evidence for a morphological sex difference within the medial preoptic area of the rat brain. Brain Res. 148 (2), 333–346. [DOI] [PubMed] [Google Scholar]
- Gorski RA, Harlan RE, Jacobson CD, Shryne JE, Southam AM, 1980. Sep 15. Evidence for the existence of a sexually dimorphic nucleus in the preoptic area of the rat. J. Comp. Neurol. 193 (2), 529–539. [DOI] [PubMed] [Google Scholar]
- Hedges LV, Olkin I, 1985. Statistical Methods for Meta-analysis. Academic Press, Inc., Orlando, p. 85. [Google Scholar]
- Hines M, Allen LS, Gorski RA, 1992. Sex differences in subregions of the medial nucleus of the amygdala and the bed nucleus of the stria terminalis of the rat. Brain Res. 579, 321–326. [DOI] [PubMed] [Google Scholar]
- Hodges TE, Lieblich SE, Rechlin RK, Galea LAM, 2022. Oct 6. Sex differences in inflammation in the hippocampus and amygdala across the lifespan in rats: associations with cognitive bias. Immun. Ageing 19 (1), 43. [DOI] [PMC free article] [PubMed] [Google Scholar]
- Insel TR, Shapiro LE, 1992. Jul 1. Oxytocin receptor distribution reflects social organization in monogamous and polygamous voles. Proc. Natl. Acad. Sci. U. S. A. 89 (13), 5981–5985. [DOI] [PMC free article] [PubMed] [Google Scholar]
- Jett S, Malviya N, Schelbaum E, Jang G, Jahan E, Clancy K, Hristov H, Pahlajani S, Niotis K, Loeb-Zeitlin S, Havryliuk Y, Isaacson R, Brinton RD, Mosconi L, 2022. Mar 9. Endogenous and exogenous estrogen exposures: how women’s reproductive health can drive brain aging and inform Alzheimer’s prevention. Front. Aging Neurosci. 14, 831807. [DOI] [PMC free article] [PubMed] [Google Scholar]
- Joel D, 2011. Sep 20. Male or female? Brains are intersex. Front. Integr. Neurosci. 5, 57. [DOI] [PMC free article] [PubMed] [Google Scholar]
- Joel D, 2012. Dec 17. Genetic-gonadal-genitals sex (3G-sex) and the misconception of brain and gender, or, why 3G-males and 3G-females have intersex brain and intersex gender. Biol. Sex Differ. 3 (1), 27. [DOI] [PMC free article] [PubMed] [Google Scholar]
- Joel D, 2021. Mar. Beyond the binary: rethinking sex and the brain. Neurosci. Biobehav. Rev. 122, 165–175. [DOI] [PubMed] [Google Scholar]
- Joel D, Fausto-Sterling A, 2016. Feb 19. Beyond sex differences: new approaches for thinking about variation in brain structure and function. Philos. Trans. R. Soc. Lond. B Biol. Sci. 371 (1688), 20150451. [DOI] [PMC free article] [PubMed] [Google Scholar]
- Joel D, McCarthy MM, 2017. Jan. Incorporating sex as a biological variable in neuropsychiatric research: where are we now and where should we be? Neuropsychopharmacology 42 (2), 379–385. [DOI] [PMC free article] [PubMed] [Google Scholar]
- Joel D, Yankelevitch-Yahav R, 2014. Oct. Reconceptualizing sex, brain and psychopathology: interaction, interaction, interaction. Br. J. Pharmacol. 171 (20), 4620–4635. [DOI] [PMC free article] [PubMed] [Google Scholar]
- Joel D, Berman Z, Tavor I, Wexler N, Gaber O, Stein Y, Shefi N, Pool J, Urchs S, Margulies DS, Liem F, Hänggi J, Jäncke L, Assaf Y, 2015. Dec 15. Sex beyond the genitalia: the human brain mosaic. Proc. Natl. Acad. Sci. U. S. A. 112 (50), 15468–15473. [DOI] [PMC free article] [PubMed] [Google Scholar]
- Joel D, Persico A, Hanggi J, Pool J, Berman Z, 2016. Reply to Del Giudice Et Al., Chekroud Et Al., and Rosenblatt: do brains of females and males belong to two distinct populations? Proc. Natl. Acad. Sci. U. S. A. 113 (14), E1969–E1970. [DOI] [PMC free article] [PubMed] [Google Scholar]
- Joel D, Garcia-Falgueras A, Swaab D, 2020. Apr. The complex relationships between sex and the brain. Neuroscientist 26 (2), 156–169. [DOI] [PubMed] [Google Scholar]
- Jurek B, Neumann ID, 2018. Jul 1. The oxytocin receptor: from intracellular signaling to behavior. Physiol. Rev. 98 (3), 1805–1908. [DOI] [PubMed] [Google Scholar]
- Leser N, Wagner S, 2015. The effects of acute social isolation on long-term social recognition memory. Neurobiol. Learn. Mem. 124, 97–103. [DOI] [PubMed] [Google Scholar]
- Lukas M, Bredewold R, Neumann ID, Veenema AH, 2010. Jan. Maternal separation interferes with developmental changes in brain vasopressin and oxytocin receptor binding in male rats. Neuropharmacology 58 (1), 78–87. [DOI] [PubMed] [Google Scholar]
- Madden AM, Paul AT, Pritchard RA, Michel R, Zup SL, 2016. Nov. Serotonin promotes feminization of the sexually dimorphic nucleus of the preoptic area, but not the calbindin cell group. Dev. Neurobiol. 76 (11), 1241–1253. [DOI] [PubMed] [Google Scholar]
- McCarthy MM, 2016. Multifaceted origins of sex differences in the brain. Philos. Trans. R. Soc. Lond. B Biol. Sci. 371 (1688). [DOI] [PMC free article] [PubMed] [Google Scholar]
- McCarthy MM, Arnold AP, 2011. Jun. Reframing sexual differentiation of the brain. Nat. Neurosci. 14 (6), 677–683. [DOI] [PMC free article] [PubMed] [Google Scholar]
- McCarthy MM, Konkle AT, 2005. Sep. When is a sex difference not a sex difference? Front. Neuroendocrinol. 26 (2), 85–102. [DOI] [PubMed] [Google Scholar]
- Ménard S, Gelez H, Coria-Avila GA, Pfaus JG, 2022. Aug 24. Sexual experience increases oxytocin, but not vasopressin, receptor densities in the medial preoptic area, ventromedial hypothalamus, and central amygdala of male rats. Psychoneuroendocrinology 146, 105900. [DOI] [PubMed] [Google Scholar]
- Niesink RJ, van Ree JM, 1982. Nov. Short-term isolation increases social interactions of male rats: a parametric analysis. Physiol. Behav. 29 (5), 819–825. [DOI] [PubMed] [Google Scholar]
- Olazábal DE, Young LJ, 2006. May. Species and individual differences in juvenile female alloparental care are associated with oxytocin receptor density in the striatum and the lateral septum. Horm. Behav. 49 (5), 681–687. [DOI] [PubMed] [Google Scholar]
- Panksepp J, 1981. Jul. The ontogeny of play in rats. Dev. Psychobiol. 14 (4), 327–332. [DOI] [PubMed] [Google Scholar]
- Panksepp J, Beatty WW, 1980. Oct. Social deprivation and play in rats. Behav. Neural Biol. 30 (2), 197–206. [DOI] [PubMed] [Google Scholar]
- Pellis SM, Pellis VC, 1990. Apr. Differential rates of attack, defense, and counterattack during the developmental decrease in play fighting by male and female rats. Dev. Psychobiol. 23 (3), 215–231. [DOI] [PubMed] [Google Scholar]
- Rae M, Lemos Duarte M, Gomes I, Camarini R, Devi LA, 2022. Apr. Oxytocin and vasopressin: Signalling, behavioural modulation and potential therapeutic effects. Br. J. Pharmacol. 179 (8), 1544–1564. [DOI] [PMC free article] [PubMed] [Google Scholar]
- Rossi A, Mikail N, Bengs S, Haider A, Treyer V, Buechel RR, Wegener S, Rauen K, Tawakol A, Bairey Merz CN, Regitz-Zagrosek V, Gebhard C, 2022. Oct 14. Heart-brain interactions in cardiac and brain diseases: why sex matters. Eur. Heart J. 43 (39), 3971–3980. [DOI] [PMC free article] [PubMed] [Google Scholar]
- Santos-Toscano R, Arevalo MA, Garcia-Segura LM, Grassi D, Lagunas N, 2023. Aug 4. Interaction of gonadal hormones, dopaminergic system, and epigenetic regulation in the generation of sex differences in substance use disorders: a systematic review. Front. Neuroendocrinol. 71, 101085. [DOI] [PubMed] [Google Scholar]
- Shors TJ, Chua C, Falduto J, 2001. Aug 15. Sex differences and opposite effects of stress on dendritic spine density in the male versus female hippocampus. J. Neurosci. 21 (16), 6292–6297. [DOI] [PMC free article] [PubMed] [Google Scholar]
- Sickel MJ, McCarthy MM, 2000. May. Calbindin-D28k immunoreactivity is a marker for a subdivision of the sexually dimorphic nucleus of the preoptic area of the rat: developmental profile and gonadal steroid modulation. J. Neuroendocrinol. 12 (5), 397–402. [DOI] [PubMed] [Google Scholar]
- Smith CJW, Poehlmann ML, Li S, Ratnaseelan AM, Bredewold R, Veenema AH, 2017. Mar. Age and sex differences in oxytocin and vasopressin V1a receptor binding densities in the rat brain: focus on the social decision-making network. Brain Struct. Funct. 222 (2), 981–1006. [DOI] [PMC free article] [PubMed] [Google Scholar]
- Smith CJW, Ratnaseelan AM, Veenema AH, 2018. Jan. Robust age, but limited sex, differences in mu-opioid receptors in the rat brain: relevance for reward and drug-seeking behaviors in juveniles. Brain Struct. Funct. 223 (1), 475–488. [DOI] [PMC free article] [PubMed] [Google Scholar]
- Smith CJW, DiBenedictis BT, Veenema AH, 2019. Apr. Comparing vasopressin and oxytocin fiber and receptor density patterns in the social behavior neural network: implications for cross-system signaling. Front. Neuroendocrinol. 53, 100737. [DOI] [PMC free article] [PubMed] [Google Scholar]
- Tanapat P, Hastings NB, Reeves AJ, Gould E, 1999. Jul 15. Estrogen stimulates a transient increase in the number of new neurons in the dentate gyrus of the adult female rat. J. Neurosci. 19 (14), 5792–5801. [DOI] [PMC free article] [PubMed] [Google Scholar]
- Tribollet E, Goumaz M, Raggenbass M, Dreifuss JJ, 1991. Appearance and transient expression of vasopressin and oxytocin receptors in the rat brain. J. Recept. Res. 11 (1–4), 333–346. [DOI] [PubMed] [Google Scholar]
- Van den Berg CL, Pijlman FT, Koning HA, Diergaarde L, Van Ree JM, Spruijt BM, 1999. Dec. Isolation changes the incentive value of sucrose and social behaviour in juvenile and adult rats. Behav. Brain Res. 106 (1–2), 133–142. [DOI] [PubMed] [Google Scholar]
- Veenema AH, Bredewold R, De Vries GJ, 2012. Jan. Vasopressin regulates social recognition in juvenile and adult rats of both sexes, but in sex- and age-specific ways. Horm. Behav. 61 (1), 50–56. [DOI] [PMC free article] [PubMed] [Google Scholar]
- Veenema AH, Bredewold R, De Vries GJ, 2013. Nov. Sex-specific modulation of juvenile social play by vasopressin. Psychoneuroendocrinology 38 (11), 2554–2561. [DOI] [PMC free article] [PubMed] [Google Scholar]
- Vigod SN, Stewart DE, 2009. Jul. Emergent research in the cause of mental illness in women across the lifespan. Curr. Opin. Psychiatry 22 (4), 396–400. [DOI] [PubMed] [Google Scholar]
- Woolley CS, Gould E, Frankfurt M, McEwen BS, 1990. Dec. Naturally occurring fluctuation in dendritic spine density on adult hippocampal pyramidal neurons. J. Neurosci. 10 (12), 4035–4039. [DOI] [PMC free article] [PubMed] [Google Scholar]
- Worley NB, Dumais KM, Yuan JC, Newman LE, Alonso AG, Gillespie TC, Hobbs NJ, Breedlove SM, Jordan CL, Bredewold R, Veenema AH, 2019. Aug. Oestrogen and androgen receptor activation contribute to the masculinisation of oxytocin receptors in the bed nucleus of the stria terminalis of rats. J. Neuroendocrinol. 31 (8), e12760. [DOI] [PubMed] [Google Scholar]
- Wu Z, Autry AE, Bergan JF, Watabe-Uchida M, Dulac CG, 2014. Galanin neurons in the medial preoptic area govern parental behaviour. Nature 509 (7500), 325–330. [DOI] [PMC free article] [PubMed] [Google Scholar]
- Zhang Y, Luo Q, Huang CC, Lo CZ, Langley C, Desrivières S, Quinlan EB, Banaschewski T, Millenet S, ALW, Bokde, Flor H, Garavan H, Gowland P, Heinz A, Ittermann B, Martinot JL, Artiges E, Paillère-Martinot ML, Nees F, Orfanos DP, Poustka L, Fröhner JH, Smolka MN, Walter H, Whelan R, Tsai SJ, Lin CP, Bullmore E, Schumann G, Sahakian BJ, Feng J, 2021. May 10. IMAGEN consortium. The human brain is best described as being on a female/male continuum: evidence from a neuroimaging connectivity study. Cereb. Cortex 31 (6), 3021–3033. [DOI] [PMC free article] [PubMed] [Google Scholar]
- Zsido RG, Villringer A, Sacher J, 2017. Dec. Using positron emission tomography to investigate hormone-mediated neurochemical changes across the female lifespan: implications for depression. Int. Rev. Psychiatry 29 (6), 580–596. [DOI] [PubMed] [Google Scholar]
Associated Data
This section collects any data citations, data availability statements, or supplementary materials included in this article.