

Summary
A major hypothesis for the etiology of type 1 diabetes (T1D) postulates initiation by viral infection, leading to double-stranded RNA (dsRNA)-mediated interferon response and inflammation; however, a causal virus has not been identified. Here we use a mouse model, corroborated with human islet data, to demonstrate that endogenous dsRNA in beta cells can lead to a diabetogenic immune response, thus identifying a virus-independent mechanism for T1D initiation. We found that disruption of the RNA editing enzyme ADAR in beta cells triggers a massive interferon response, islet inflammation and beta cell failure and destruction, with features bearing striking similarity to early-stage human T1D. Glycolysis via calcium enhances the interferon response, suggesting an actionable vicious cycle of inflammation and increased beta cell workload.
Keywords: beta cells, type 1 diabetes, RNA editing, islet inflammation, metabolic stress, interferon response
eTOC
Knebel et al show that defective RNA editing in pancreatic beta cells results in the accumulation of endogenous double-stranded RNA, leading to an interferon response, inflammation and islet destruction, mimicking early stages of type 1 diabetes.
Graphical Abstract

Introduction
Adenosine to Inosine (A-to-I) RNA editing is a post-transcriptional modification catalyzed by Adenosine Deaminases Acting on RNA (ADAR), which deaminate adenosine bases into inosines, read by the translation machinery as guanosine 1. Recent studies indicate that a key role of ADAR1 is to edit double-stranded RNA (dsRNA) structures, primarily generated by retroelements (typically Alu and B1/B2 repeats in human and mouse cells, respectively) inserted in an inverted orientation in non-coding regions of expressed genes 2. Such dsRNA structures are powerful and potentially dangerous activators of dsRNA sensors, such as MDA5/IFIH1 that triggers an antiviral type I interferon (IFN-I) response 2. Thus ADAR1-mediated A-to-I RNA editing destabilizes A-U base pairing in RNA, preventing pathogenic activation of an interferon response triggered by endogenous dsRNA. Indeed, ADAR1 mutations in humans and mice cause severe auto-inflammatory disease 2–4.
While RNA editing has been studied in several organs in mouse models and in cancer 5–8, little is known about its role in insulin-producing, beta cells. This is particularly relevant since early stages of type I diabetes (T1D), an autoimmune disease causing the destruction of beta cells, are associated with an IFN-I transcriptional signature in pancreatic islets 9–12. In addition, GWAS studies have shown that IFIH1 variants strongly modulate T1D risk, suggesting the importance of sensing dsRNA – from either a viral or endogenous source – for the development of T1D 13,14. A viral infection in islets could lead to an interferon response but such a virus has not been identified 15,16. In support of endogenous dsRNA being a T1D trigger, whole-body loss of Ifih1 was shown to prevent spontaneous autoimmune diabetes in NOD mice, independently of viral infection 17. Furthermore, a recent study reported that human genetic variants reducing RNA editing of endogenous dsRNAs confer increased risk of autoinflammatory and autoimmune diseases, including T1D 18. We hypothesized that disruption of Adar in beta cells in vivo may model early events in the pathogenesis of T1D and allow dissection of mechanisms by which non-viral, endogenous dsRNA can trigger islet inflammation and contribute to beta cell dysfunction or loss, prior to autoimmunity.
To test these ideas, we disrupted Adar in beta cells of mice and knocked down ADAR in human islets. We show that ADAR inactivation in beta cells elicits a robust MDA5-dependent interferon response, leading in vivo to islet infiltration and impairment of beta cell function and survival. We further delineate cell-autonomous and paracrine determinants of beta cell failure following Adar inactivation, and describe phenotypes that strikingly resemble early stage T1D. Finally, we reveal a modulation of the beta cell interferon response by glucose metabolism and calcium signaling, suggesting an actionable positive feedback loop whereby increased beta cell workload and islet inflammation drive beta cell failure.
Results
Loss of RNA editing in beta cells leads to beta cell death and diabetes
Most RNA editing events in mammals are catalyzed by ADAR1 (Adar), and map to pairs of inverted repetitive elements in introns or UTRs of transcripts that can form dsRNA structures 19,20. The extent of editing correlates with the number of repetitive elements within families with low sequence divergence 21–23. Consistently, the Alu editing index in human cells is higher than the editing index in the more divergent mouse B1/B2 repeats 24.
We applied our Alu Editing Index (AEI), which provides information about the general level of editing in repeats, to published RNA-Seq datasets from human and mouse alpha- and beta cells to quantify highly edited regions, and particularly extensively edited regions in 3’-UTR inverted repeats 25. As expected, A-to-G RNA editing index was enriched compared to the index of other mismatches indicating highly specific detection of ADAR-mediated editing. Human alpha- and beta cells had a higher A-to-G RNA editing index levels compared with mouse cells, while in both species there were no significant differences between editing in alpha- and beta cells (Figure 1A–B).
Figure 1: Loss of RNA editing in mouse beta cells disrupts glucose homeostasis.

(A) Global A-to-I RNA editing index 25 across short interspersed nuclear elements (SINE) in human (Alu) and mouse (B1 and B2) RNA-seq data 55–61 (E-MTAB-1294, GSE76268, GSE149488, GSE54973, GSE76992, GSE86949, GSE87530) (human alpha cell datasets (n=5), human beta-cell datasets (n= 2), mouse alpha and beta-cell datasets (n=12)) demonstrates a higher A-to-I editing signal in human samples. Noise levels (non-A-to-G mismatches) are similar between human and mouse. (B) A-to-I RNA editing in inverted elements within 3’UTR is twice as high as the global editing index. Noise levels remain similar or lower than seen in the global editing index. Minimal element length was set to reflect average element length in human and mouse (200bp and 120bp, respectively). (C) Experimental approach to study the effects of Adar inactivation in mouse beta cells. (D) Reduced expression of Adar floxed exons and reduced editing at oppositely oriented B1/B2 repetitive elements in RNA from βAdarKO (n=4) versus βAdarHET (n=8) and βAdarWT (n=4) beta cells. Data are means ± SE. Student’s unpaired two-tailed t-test; *** P<0.001, **** P<0.0001 (E) Blood glucose was measured for 30 days after Tamoxifen injection in βAdarHET (n=36). and βAdarKO (n=52) mice (n=27 males, 25 females). (F) Representative micrographs of pancreatic sections from βAdarHET and diabetic βAdarKO mice 1 month after tamoxifen injection, immunostained for Insulin. Insulin and GFP positive area per pancreas were measured 1 month after tamoxifen injection in βAdarHET and diabetic βAdarKO mice (n=3 for each genotype, 5 sections per mice 150μM apart analyzed). * p<0.05 and ** p<0.005; Student’s two-tailed t-test; error bars indicate mean ± SEM (standard error of the mean). (G) Measurement of GFP/Insulin ratio reveals a higher rate of cell death among Adar mutant β-cells compared to wild-type β-cells in diabetic βAdarKO mice. GFP/Insulin ratio in islets from β−AdarHET (n=4), non-diabetic βAdarKO (n=4) and diabetic βAdarKO (n=3) mice 30–50 days after tamoxifen injection. Pancreatic sections (5 sections per mice 150mM apart) were immunostained for Insulin and GFP. The surface area staining positive for each marker was measured using Image J software.
To study the effect of impaired RNA editing on beta cell biology, we used mouse insulin promoter (Mip)-CreER; Adarlox/lox mice to disrupt the Adar gene specifically in beta cells of postnatal mice. To trace the fate of recombined cells we used a R26RYFP reporter. We injected tamoxifen to 1-month-old MipCreER;R26RYFP, MipCreER R26RYFP;Adarlox/+ and MipCreER;R26RYFP;Adarlox/lox mice to produce animals with beta cell-specific Adar deficiency (βAdarKO), Adar heterozygosity (βAdarHET), or intact Adar (Figure 1C). One week after tamoxifen injection we isolated islets, sorted YFP+ cells and performed RT-qPCR to assess Adar expression. Beta cells from βAdarKO mice showed near-complete loss of the Adar floxed exon expression, whereas beta cells from βAdarHET mice showed intermediate expression levels compared to wild type (Figure 1D). We next performed RNA-sequencing and observed a significant reduction in RNA editing in βAdarKO beta cells compared with βAdarHET. Interestingly, Adar heterozygosity resulted in reduced RNA editing compared with wild type, indicating that a full complement of Adar is needed to properly edit endogenous dsRNA structures (Figure 1D).
Within two weeks of tamoxifen injection, 44% of βAdarKO mice (23/52) developed diabetes, whereas heterozygotes remained normoglycemic (Figure 1E, S1A). Similarly, intraperitoneal glucose tolerance test (IPGTT) revealed impaired glucose clearance in βAdarKO mice but not in βAdarHET mice (Figure S1B). There was a gender bias in the diabetic phenotype with 70% of males as opposed to just 16% females showing glycemic deterioration – a phenomenon familiar from other settings of beta cell damage, likely related to the protective effects of estrogen on female mouse islets 26 (Figure S1C and S1D). The insulin-stained area in the pancreas of diabetic mice was greatly reduced (on average, by 87%), as was pancreatic insulin content (Figure S1E), suggesting that in mutant mice, beta cells were eliminated (Figure 1F). Interestingly, the YFP-positive area was reduced to a lower extent (by 58% on average) (Figure 1F), raising the possibility that some βAdarKO beta cells have lost insulin (see below). We then assessed whether wild-type and AdarKO beta cells are equally susceptible to cell death. To this aim, we took advantage of the mosaic pattern of Adar inactivation and compared the ratio of YFP/insulin-stained area in islets obtained from βAdarHET, non-diabetic βAdarKO, and diabetic βAdarKO mice. The frequency distribution of these ratios was similar in βAdarHET and non-diabetic βAdarKO mice. However, in diabetic βAdarKO mice, the ratio of YFP to insulin-stained area was reduced, indicating a preferential loss of YFP-positive mutant beta cells in diabetic mice (Figure 1G and S1F). This finding suggests that the destruction of beta cells upon Adar inactivation is not solely dependent on external cues (see below) but also involves cell-autonomous mechanisms. In addition, the emergence of islets with elevated YFP/insulin ratio in mutant mice provides further support for the presence of Adar-deficient, YFP-positive beta cells that are devoid of insulin, as described above (Figures 1F and 1G).
Loss of Adar in beta cells causes Ifih1-dependent interferon response and insulitis
RNA editing has been shown in other systems to be crucial for suppression of innate immune system activation by dsRNA-binding cytosolic proteins 4,7. To investigate whether beta cell failure in βAdarKO mice was associated with islet inflammation, we stained pancreatic sections for the pan-leukocyte marker CD45 and scored islet infiltrates. Seven days after tamoxifen injection, 12.5% of islets in βAdarKO mice showed moderate to severe infiltration, and this score increased to 60% by 12–14 days. No insulitis was observed in βAdarHET mice (Figure 2A, 2B and Figure S2A). There was no gender-specific differences in the extent of islet infiltration (Figure S2B). Thus, the reduced incidence of diabetes in females compared to males cannot be accounted for by less severe islet inflammation. Next, we crossed βAdarKO mice to Ifih1 (MDA5)-deficient background and found that Ifih1 disruption abolished the inflammatory phenotype in βAdarKO mice (Figure 2A). This indicates that islet inflammation in βAdarKO mice is driven by MDA5-mediated dsRNA sensing. Islet infiltrates contained numerous Iba+ macrophages, with peri- and intra-islet presence of T cells (CD3+ cells, as well as some CD8+ cells), and fewer B cells (CD19+) (Figure 2B). The islet infiltrate score correlated with glycemic deterioration in βAdarKO male mice (Figure 2C), suggesting that islet inflammation was responsible for beta cell dysfunction and diabetes.
Figure 2: Insulitis and interferon response in βAdarKO mice.

(A) Classification of islets from βAdarKO mice according to the extent of inflammatory infiltrates as assessed by immunostaining for insulin (β-cells), GFP (mutant β-cells) and CD45 (immune cells). Islets from βAdarHET, βAdarKO and βAdarKO; Ifih1−/− mice were scored 7 days (n=4, for each genotype) and 12 days after tamoxifen injection (βAdarHET (n=7), βAdarKO (n=13), βAdarKO; Ifih1−/− (n=4)). At least 100 islets from 5 different slides (80μm apart) were scored for each mouse. Each dot represents score for a single mouse. Student’s unpaired two-tailed t-test; error bars indicate mean ± SEM. ** p<0.01; **** p<0.0001. Scale bar, 20 micrometers. (B) Pancreas sections from βAdarHET (top) and βAdarKO (bottom) were stained for CD45 (pan-leukocyte marker), Iba1 (macrophages), CD3 (T cells), CD8 (T cells) and CD19 (B cells). Scale bar, 20 micrometers. (C) Correlation of impaired glucose tolerance to extent of insulitis. IP-GTT was performed on βAdarKO male mice (n=9) 9 days after Tamoxifen injection and 3 days later pancreatic islet insulitis score was determined as described in A. The values of the area under the GTT curve (IP-GTT AUC) were plotted versus insulitis score. (D) RNA-Seq heatmap representing ISG expression levels (after logarithmic transformation and row-centering) and hierarchical clustering (using Euclidean distance) in sorted β-cells from βAdarHET (HET) and βAdarKO (KO) mice (each RNA sample (n=4, for each genotype) was purified from beta cells FACS-sorted from islets that were pooled from one male and one female). Brown and green reflect low and high expression levels, respectively, as indicated in the log2-transformed scale. (E) Bubble plot based on GSEA analysis showing top upregulated MSigDB hallmark gene sets in AdarKO compared to AdarHET β-cells. The bubble color, size and transparency represent −log10 (FDR), normalized enrichment score (NES) and gene set size, respectively. (F) ISG expression in pancreatic islets was measured by qRT-PCR. Pancreatic islets were isolated from βAdarWT; Ifih1WT (n=2), βAdarKO (n=4), βAdarWT; Ifih1KO (n=2) and βAdarKO; Ifih1KO (n=2) mice, 3 days after tamoxifen injection and cultured ex-vivo for 3 days in RPMI medium before RNA extraction. (G, H) ADAR1 knockdown in human islets induces ISG expression. RNA isolated from human pseudoislets (n=11 donors) transduced with either ADAR1 shRNA or scramble shRNA pseudoislets was assessed for expression of ADAR1 (G) and interferon-stimulated genes (H) by RT-PCR, with normalization to scramble shRNA samples. * p<0.05; ** p<0.01; *** p<0.001.
To understand the molecular basis for islet inflammation, we performed RNA-sequencing on FACS-sorted YFP+ cells from βAdarKO, βAdarHET and βAdarWT mice, 7 days after tamoxifen injection. Adar deficiency induced a classic interferon response, with 69% of the 238 genes upregulated (FDR<0.05) known to be regulated by IFN (Interferome database 27), including type I IFN genes (Ifna4, Ifnb1), ISGs such as Isg15 and Irf7, dsRNA sensors (Ifih1, Ddx58, Oas2 and Eif2ak2 [Pkr]) and the pro-inflammatory genes Ccl5 and Cxcl10 (Figure 2D). Accordingly, the most significantly enriched gene sets among genes induced in βAdarKO beta cells were alpha and gamma interferon pathways (Figure 2E and Figure S2C). In addition to the interferon-related pathways, gene sets including Myc targets, oxidative phosphorylation, TNFα pathway, and the unfolded protein response were significantly activated in beta cells following Adar inactivation (Figure 2E). Consistent with the absence of insulitis in βAdarKO; Ifih1−/− mice, we found that Ifih1 inactivation suppressed ISG induction in βAdarKO islets (Figure 2F). Thus, Adar-deficient mouse beta cells display MDA5-dependent IFN response, including transcriptional activation of pro-inflammatory cytokines and chemokines that drive islet inflammation.
To examine the role of ADAR1 in human islets, we used a pseudoislet approach, where human islets are dispersed into singe cells, transduced with a shRNA ADAR1, and allowed to reaggregate over six days before analysis 28 (Figure S3A–F and S6). Knockdown of ADAR1 in human islets triggered an IFN response as demonstrated by the induction of several ISGs (Figure 2G–H). This response closely resembled IFN-I and ISG induction observed in human islets transfected with Poly(I:C) dsRNA, suggesting that as in mouse, Adar deficiency in human islets elicits an interferon response through dsRNA sensing (Figure S3G).
Taken together, Adar deficiency in mouse or human beta cells triggers a massive interferon response, which in vivo is associated with islet infiltration by immune cells, beta cell dysfunction and loss, and diabetes.
Adar deficiency disrupts expression of key beta cell markers via interferon signaling
To better characterize the phenotype of beta cells following Adar disruption, we performed immunofluorescence staining on pancreas sections from βAdarHET and normoglycemic βAdarKO mice 12–14 days after tamoxifen injection. Non-diabetic mice were chosen to avoid potentially confounding effects of hyperglycemia on beta cell gene expression. We co-stained sections for CD45, the GFP tracer and key beta cell specific markers. We also took advantage of the incomplete activation of the CreER transgene in beta cells to analyze the effects of Adar disruption in mosaic islets at a single cell resolution. This strategy can help distinguish paracrine effects (e.g., mediated by signals from inflammatory or cells) from cell-autonomous responses (caused intrinsically by Adar deletion).
As shown in Figure 3A–C, insulin staining intensity per beta cell was markedly reduced in βAdarKO mice, though strikingly this was exclusive to inflamed islets (i.e., non-inflamed islets appeared normal, even if they contained a majority of Adar-deficient beta cells as evident from GFP staining). Similarly, the level (per cell) of the insulin-processing enzyme PC1/3 was lower in inflamed mutant islets, compared with non-inflamed islets in βAdarKO or βAdarHET mice (Figure 3D). Importantly, this phenotype was seen in both Adar-deficient beta cells (marked as GFP+) and Adar-proficient beta cells (GFP−). In contrast, protein levels of key beta cell transcription factors Pdx1, Nkx6.1 and Pax6 in infiltrated islets were normal (Figure S4A–H).
Figure 3: Adar inactivation combined with islet inflammation alters beta cell expression program.

Pancreatic sections from non-diabetic βAdarKO and control βAdarHET mice, 12–14 days after Tamoxifen injection were immunostained for GFP, CD45 and beta cell markers (n>=4 mice from each genotype). (A-D) Pancreatic sections from βAdarHET (upper panel) and βAdarKO mice (mid and lower panel) were immunostained for GFP, CD45 and Insulin (A) and serial sections stained for GFP, Insulin and PC1/3 (B-D). Representative micrographs of islets demonstrate reduced insulin and PC1/3 staining in inflamed islets of βAdarKO mice (C-D, lower panels). (E, F) Pancreatic sections from βAdarHET (upper panel) and βAdarKO mice (mid and lower panel) were immunostained for GFP, CD45 and Insulin (E) and serial sections stained for GFP, proinsulin and MafA (F). Insets show dramatic reduction in MafA coinciding with reduced proinsulin levels in Adar-deficient (GFP-positive) beta cells of inflamed islets, but not in their neighboring Adar-positive GFP-negative counterparts (marked by red arrows) (F, lower panel). (G, H) Pancreatic sections from βAdarKO mice were immunostained for GFP, Insulin and CD45 (G) and serial sections were stained for GFP, proinsulin and insulin (H). Representative micrographs from non-inflamed (upper panel) and inflamed (lower panel) islets from the same section show that in inflamed islets, Adar-knockout GFP-positive beta cells (marked by green arrows) exhibit lower levels of insulin and proinsulin, while Adar-positive GFP-negative beta cells (red arrows) retain high levels of proinsulin together with reduced insulin levels. Scale bars, 20 micrometers. (I) Scheme depicting how Adar inactivation and inflammation affect beta cell marker expression.
Thorough examination of infiltrated islets showed that whereas levels of the MafA transcription factor were dramatically reduced in mutant (GFP+) beta cells, they were preserved in adjacent wild-type beta cells (Figure 3E–F). This bimodal pattern of expression coincided with proinsulin expression: within inflamed islets of βAdarKO mice, YFP+ (mutant) beta cells were typically devoid of proinsulin, while YFP− (wild-type) beta cells retained high levels of proinsulin (Figure 3E–F).
Thus, Adar deficiency in beta cells exerts two distinct phenotypes related to insulin expression, which are both associated with islet inflammation (Figure 3I). In Adar-deficient beta cells, the levels of MafA and proinsulin are reduced. Since MafA is a key transcription factor of insulin, its downregulation is a likely reason for the reduction in proinsulin. In both Adar-deficient and wild-type beta cells in inflamed islets, the levels of PC1/3 and mature insulin are reduced. Since PC1/3 is essential for the processing of proinsulin to mature insulin, its downregulation is a potential cause for the reduction in insulin. We note that the loss of insulin in inflamed islets was seen as early as 7 days after tamoxifen injection; given the long half-life of insulin (around 3 weeks 29), this suggests that degradation of pre-existing mature insulin was accelerated in inflamed islets of these normoglycemic mice, regardless of autonomous Adar deficiency.
In summary, our results indicate that reduced levels of MafA and proinsulin in mutant beta cells are caused by a combination of cell autonomous determinants (driven by Adar deficiency) and autocrine/paracrine signals (triggered by IFN produced by Adar-deficient beta cells or additional cytokines originating from inflammatory cells). In contrast, reduced levels of PC1/3 and mature insulin are caused purely by paracrine signals, irrespective of Adar status.
The interplay between paracrine/autocrine signals and cell autonomous cues results in the cohabitation within the same inflamed islets of proinsulin-deficient, insulin-deficient Adar-negative beta cells, together with Adar-positive beta cells that exhibit high proinsulin and dramatically reduced insulin levels (Figure 3G–H). As elaborated in the Discussion, these phenotypes bear striking resemblance to the situation in islets from patients with recent onset T1D, where proinsulin+ insulin- beta cells (“empty beta cells”) are often observed 30,31. Strikingly and in contrast to the impact of inflammation on beta cell phenotype, alpha- and delta-cells within inflamed islets of mutant mice were largely spared (Figure S4I–L) consistent with the observed phenotype in human T1D.
Our in-vivo observations cannot determine if inflammation is causative or is merely a biomarker of islets producing particularly high levels of type I interferon, which is both fueling inflammation and causing MafA and proinsulin loss in mutant beta cells (and possibly PC1/3 and insulin loss in all beta cells). To better dissect the signaling pathways underlying misexpression of beta cell markers in our model, we performed ex-vivo experiments on islets from βAdarKO and βAdarHET mice, isolated 7 days after tamoxifen injection. Culturing βAdarKO islets ex-vivo for 3 additional days caused reduced MafA and proinsulin levels in AdarKO GFP+ β-cells, thus recapitulating the phenotype observed in inflamed islets in-vivo (Figure 4A–B). In contrast, the levels of insulin protein were not significantly altered in GFP+ β-cells (Figure 4B). Strikingly, treatment with an inhibitor of the Janus kinase/signal transducer and activator of transduction (JAK/STAT) signaling pathway (ruxolitinib) maintained normal levels of MafA and proinsulin in AdarKO β-cells, demonstrating that this phenotype is dependent on IFN signaling (Figure 4A–B). These results indicate that inflammatory cells are not required for the cell-autonomous phenotype observed in Adar-deficient beta cells. Rather, we propose that MafA and proinsulin are reduced due to a combination of autonomous Adar deficiency and autocrine or paracrine IFN signaling. Finally, Adar knockdown in human islets led to reduced RNA levels of Insulin, MafA, MafB, Pdx1 and Nkkx6.1 (Figure 4C), and reduced MafA protein levels (Figure S4M), indicating that inflammatory infiltrates are not essential for altering beta cell identity genes in human islets. Adar disruption in both mouse and human islets cultured ex-vivo did not impair glucose-stimulated insulin secretion, despite a slight reduction in insulin content observed in human islets with ADAR1 knockdown (Figure 4D–E). This observation is consistent with the evidence indicating that reduced insulin levels are predominantly dictated by inflammation rather than Adar disruption alone (Figure 3I).
Figure 4: Adar inactivation causes decreased expression of beta cell markers in mouse and human islets ex-vivo.

(A-B) βAdarHET and βAdarKO islets (at least 100 islets/mice from n>=5 mice) were isolated 7 days after Tamoxifen injection and cultured ex-vivo for three additional days with or without ruxolitinib (4μM), a JAK/STAT inhibitor before immunostaining for insulin, proinsulin and GFP and FACS analysis. (A) Representative FACS dot plot of GFP-positive beta cells reveals decrease in proinsulin and MafA levels in AdarKO beta cells compared to AdarHET beta cells. Ruxolitinib prevented the reduction in proinsulin and MafA levels in GFP-positive AdarKO β-cells. (B) Quantification of average MafA, proinsulin and insulin staining levels in GFP-positive beta cells from 5–6 independent experiments shows significant reduction in MafA and proinsulin levels but not in insulin levels in AdarKO compared to AdarHET β-cells and in untreated versus ruxolitinib treated AdarKO GFP-positive beta cells. *p<0.05, ***p<0.001, ****p<0.0001, ns: non-significant; Student’s two-tailed t-test; error bars indicate mean ± SEM. (C) Expression of islet cell-enriched transcription factors is reduced in ADAR1 knock down human islets (n=11 donors). * p<0.05, *** p<0.01. (D) Insulin secretion and insulin content in islets isolated from βAdarHET and βAdarKO mice (n=4 each) seven days after tamoxifen injection. The islets were cultured in RPMI for 24h prior to stimulation with 2.8mM or 16.7mM glucose. (E) Insulin secretion (static culture for 30 minutes at 1.7 mm and 16.7 mm glucose) and insulin content were assessed in human pseudoislets transduced with. Scrambled shRNA or ADAR1 shRNA. * p<0.05, ** p<0.01.
Glucose metabolism enhances the beta cell interferon response
The onset of insulin treatment in T1D is often associated with a temporary remission (the honeymoon period) 32. Similarly, insulin therapy (reducing glycemic load and the drive for secretion) or treatment with diazoxide (a KATP channel opener that prevents glucose-induced membrane depolarization and insulin secretion) in rodent models of T1D have been reported to reduce the incidence of diabetes 33,34. These findings gave rise to the concept of “beta cell rest” – a beneficial effect of reduced beta cell workload. This phenomenon is typically interpreted in the context of reduced lipo- and glucotoxicity, which improves beta cell survival and function 35,36.
We hypothesized that reduced beta cell workload, and consequently reduced glucose-dependent signaling (Figure 5A), may also affect the interferon response of beta cells, and hence directly impact their interaction with the immune system. To test this idea, we isolated islets from βAdarKO mice three days after tamoxifen injection (prior to the onset of islet inflammation), cultured the islets in different glucose concentrations for three additional days, and measured the expression of selected ISGs using qRT-PCR. Culturing βAdarKO islets in 11mM glucose led to a dramatic elevation of ISGs compared with a culture in 5mM (Figure 5B). Inhibition of JAK/STAT signaling pathway by ruxolitinib in the presence of high glucose levels completely suppressed ISG induction (Figure 5B). βAdarHET islets did not show ISG expression in either concentration of glucose (Figure S5). We also treated βAdarKO islets with a small molecule glucokinase activator (GKA), a drug that increases the affinity of glucose to glucokinase thereby increasing the rate of glycolysis 37. GKA led to elevated expression of ISGs even in the presence of 5mM glucose (Figure 5B), indicating that the rate of glycolysis rather than glucose itself is driving ISG expression in βAdarKO islets.
Figure 5: Glucose metabolism and calcium influx enhance the interferon response in islets from βAdarKO mice.

(A) Graphical model depicting glucose metabolism and glucose-induced pathways to insulin secretion. Pharmacological interventions that modulate insulin secretion (marked in red) were tested to delineate necessary pathways for glucose-induced ISG expression in βAdarKO islets. (B-D) Islets from βAdarKO mice were isolated 3 days after tamoxifen injection and cultured for three additional days in RPMI medium supplemented with 5mM or 11mM glucose and pharmacological modulators of insulin secretion, as indicated: 10uM GKA (glucokinase activator), 4μM ruxolitinib (B), 325uM diazoxide (C), and 10uM nifedipine (D). Each dot represents RNA expression levels from 30 islets isolated from βAdarKO mice (n>=3). ISG mRNA expression was assayed by RT-qPCR and normalized to Actb gene expression. (E) Glucose activates transcription of type I IFN genes in islets from βAdarKO mice. Islets from βAdarKO mice were isolated 3 days after tamoxifen injection and cultured for three days in RPMI medium supplemented with 5mM or 11mM glucose. Each dot represents RNA expression levels from 30 islets isolated from βAdarKO mice (n=6). Expression of Ifna4 and Ifnb1 genes was assessed by RT-ddPCR (Droplet Digital PCR). *p<0.05; Student’s paired t-test; error bars indicate mean ± SEM. (F) Glucose modulates the interferon response in wild-type islets. Islets from βAdarWT mice were cultured for three days in 5mM or 11mM glucose and treated for 24 hours with 800u/ml IFNα with or without 4μM ruxolitinib. Each dot represents RNA expression levels from 30 islets isolated from βAdarKO mice (n>=5). ISG expression was assayed by RT-qPCR and normalized to Actb expression. n>=6. (G) Glucose metabolism modulates the interferon response in wild-type islets. Dissociated islets from wild-type mice were cultured in RPMI supplemented with 5mM glucose or 5mM glucose together with 10μM GKA. 48h later, islets were treated for 24h with 800u/ml IFNα Each dot represents RNA expression levels from 30 islets isolated from βAdarKO mice (n=4). ISG expression was assessed by RT-qPCR and normalized to Actb expression. *p<0.05, **p<0.01, ***p<0.001; Student’s unpaired two-tailed t-test; error bars indicate mean ± SEM.
To delineate the signaling pathway that regulates the interferon response in βAdarKO islets downstream of glycolysis, we treated βAdarKO islets with pharmacological activators or inhibitors of steps in the classical glucose-stimulated insulin secretion pathway (Figure 5A). Diazoxide prevented the induction of ISGs by high glucose (Figure 5C). Downstream of membrane depolarization, the calcium channel blocker nifedipine blocked ISG induction by high glucose (Figure 5D).
Together our results indicate that glucose-induced calcium influx is necessary for ISG expression triggered by deficient RNA editing.
We performed additional experiments to better characterize the molecular mechanism underlying the synergistic effect of Adar inactivation and high glucose on the beta cell interferon response. The interferon response to dsRNA has cell-autonomous and autocrine/paracrine phases. Initially, dsRNA accumulates and activates dsRNA sensors including IFIH1 which initiate a signaling pathway culminating in IRF3-mediated transcription of type I interferon (IFN-α/β) genes. Interferon is then secreted and sets off a second phase of autocrine/paracrine signaling events, which stimulate the expression of ISGs via the interferon receptor and JAK/STAT pathway 2,38.
To investigate whether the first, cell-autonomous phase is impacted by glucose, we measured Ifna4 and Ifnb1 transcripts (encoding IFN-α/β) in βAdarKO islets cultured in 5mM or 11mM glucose. Increasing glucose concentration augmented Ifna4 and Ifnb1 mRNA levels by 26 and 38-fold, respectively (Figure 5E). To test the effect of glucose on the paracrine phase, we treated wild-type islets with interferon-α and cultured the islets in different glucose concentrations. High glucose (11 mM) boosted ISG expression in response to IFN treatment about 2-fold (Figure 5F), and a similarly enhanced response was seen upon treatment with GKA on top of IFN (Figure 5G). The effect of glucose was abrogated by the JAK/STAT inhibitor ruxolitinib (Figure 5F). We conclude that glucose flux mainly regulates the cell-autonomous signaling cascade from Adar deficiency to induction of type 1 IFN in beta cells, and has a smaller but significant effect on the response of beta cells to exogenous interferon, via the canonical JAK/STAT pathway. The findings also reveal that the cells that mediate the amplifying effect of glucose on the response to IFN-I are cells that express glucokinase, namely alpha or beta-cells. In summary, glucose metabolism through calcium signaling is a strong amplifier of the interferon response in beta cells, suggesting a novel link between metabolism and islet inflammation.
Discussion
Our findings reveal that Adar activity in beta cells is an essential safeguard against the development of aberrant interferon response and islet inflammation. We found that reduced ADAR in mouse and human islets leads to interferon-stimulated gene expression. In mice lacking ADAR in beta cells, islets are targeted by inflammatory cells, resembling insulitis in human type 1 diabetes. These islet-related phenotypes are consistent with the inferred functions of ADAR in other tissues, and result from IFIH1 sensing of unedited endogenous dsRNA species. The evolutionary logic is that Adar-mediated dismantling of endogenous dsRNA (which have accumulated historically in the genome via retroelement insertions in expressed genes) allows cells to discriminate between self and exogenous viral dsRNA and selectively activates innate immunity in response to viral infection 4,7. Beyond these universal roles of Adar, our results show that the combination of ADAR deficiency and inflammation dramatically impairs the survival and molecular identity of beta cells. This effect is observed in both βAdarKO and adjacent wild-type beta cells, with Adar-deficient beta cells exhibiting higher susceptibility to cell death compared to their wild-type counterparts. Adar-deficient beta cells lose expression of MafA, and, likely as a consequence, have reduced levels of proinsulin. We observed these phenotypes in vivo only in inflamed islets. Adar deficiency in vitro led to reduced MafA and proinsulin expression through JAK/STAT signaling, revealing necessity of IFN rather than inflammation (potentially reflecting islets with high levels of dsRNA).
Adar deficiency also had dramatic effects on wild-type beta cells within inflamed islets. While these cells retained beta cell identity, they lost expression of PC1/3 and mature insulin – the latter likely resulting from deficient proinsulin processing and possibly accelerated insulin degradation. Similar phenotypes resulting from the action of pro-inflammatory cytokines have been noted in T1D 30,39,40.
Overall, the combination of autonomous and non-autonomous phenotypes following ADAR disruption in beta cells bears a striking similarity to phenotypes observed in the pancreas of humans with T1D (see below).
Our discovery that the beta cell interferon response is influenced by glucose metabolism potentially explains the association between beta cell workload and the progression of early stage T1D. The lowering of glycemic load clearly has a direct impact on glucotoxicity via reduced ER or oxidative stress 41–43. However, it has been difficult to examine if immune responses are also affected. Focusing on the transcriptional interferon response of beta cells, without involvement of either innate or adaptive immune cells, allowed us to observe that glucose metabolism and downstream steps in the classical insulin secretion pathway are key modulators of the beta cell response to deficient RNA editing, in at least two distinct steps. First, glucose enhances the interferon response to loss of Adar. This can occur via the massive transcriptional response of beta cells to glucose, which could lead to elevated expression of genes with particularly “dangerous” immunogenic dsRNA configurations when unedited. Alternatively, glucose may enhance the signaling pathway from dsRNA sensing to the primary interferon response. Secondly, glucose metabolism enhances moderately but significantly the transcriptional response of beta cells to exogenous interferon, even in wild-type beta cells that do not have excessive dsRNA. This step is dependent on the canonical JAK/STAT signaling pathway. These findings suggest an interesting positive feedback loop acting in a particularly sensitive stage during the development of T1D. Interferon and other cytokines can reduce beta cell functionality (e.g., via reduced levels of PC1/3 and mature insulin, as shown here); this in turn would render systemic glucose clearance less efficient, and increase the workload on beta cells which will drive a stronger interferon response (model, Figure 6). Note that the process can take place while the individual is still euglycemic, potentially progressing silently until erupting when functional beta cell mass can no longer sustain euglycemia. This description is consistent with the natural phenomenon of the honeymoon period in recent-onset T1D, with pre-clinical and clinical reports on the benefits of enforced beta cell rest, and with a recent report that the calcium channel blocker verapamil improves beta cell function in patients with recent-onset T1D 44,45. The vicious cycle of inflammation and increased workload also suggests targets for early intervention. For example, low dose insulin has been examined as a preventive therapy for T1D, mainly aimed at inducing immunotolerance 46,47. The mechanism proposed here supports the concept seen in the Diabetes Control and Complication Trial that higher doses of insulin preserve glucose-stimulated insulin secretion 48, suggesting that insulin treatment would reduce beta cell metabolism and the islet interferon response in people at risk to develop T1D.
Figure 6: Schematic model for the involvement of defective RNA editing in the pathogenesis of T1D.
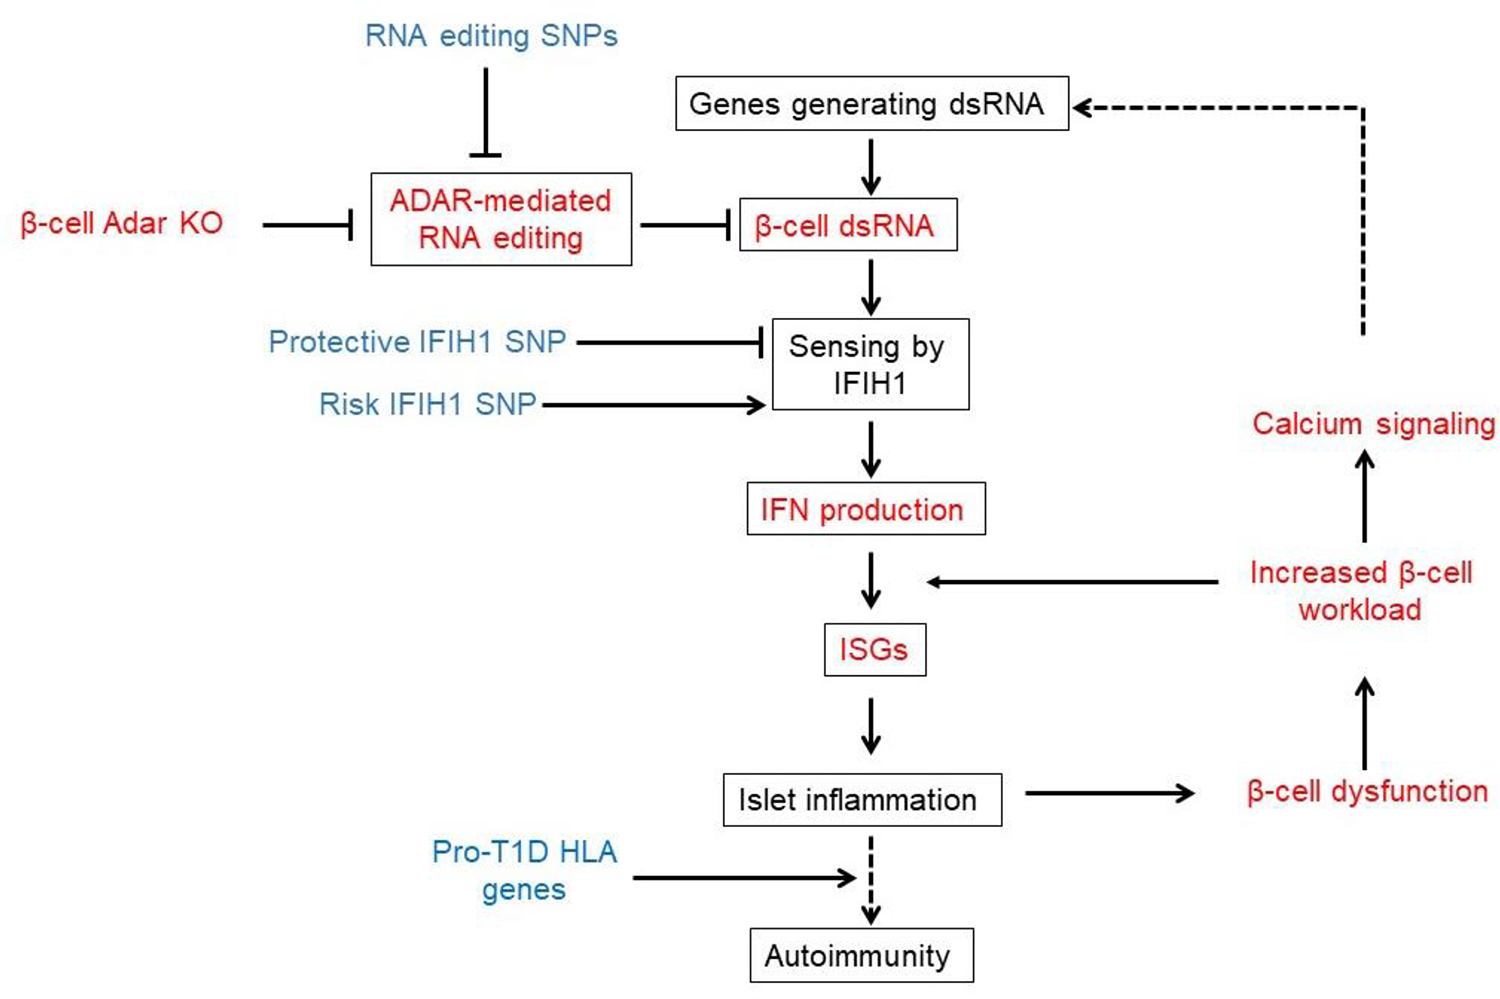
This model is supported by our results (in red) and published human genetic evidence (in blue). Dashed lines represent possible but as yet unproven links.
A recent study has mapped human genetic variants that are associated with reduced editing of endogenous dsRNAs (RNA editing Quantitative Trait Loci, or edQTLs), and linked these variants to the risk of developing autoinflammatory and autoimmune disease, including T1D 18. This suggests that endogenous, rather than virus-derived dsRNA molecules, may be important upstream activators of the interferon response leading to T1D 49,50. Importantly, the cell type(s) mediating the effect and the molecular mechanisms leading to beta cell damage were not examined in that work. Our study used Adar disruption as a model system to reliably induce dsRNA-mediated interferon response in beta cells in vivo and to examine its downstream effects. Unexpectedly, the consequences of Adar deficiency in beta cells in vivo resemble features of early stage T1D, which are typically explained as consequences of antigen-specific autoimmunity. First, although Adar deficiency brought about massive whole-islet inflammation, only beta cells were destroyed. This phenotype does not result simply from the autonomous requirement for Adar in beta cells, since adjacent wild-type beta cells were also affected. Selective destruction of beta cells is a hallmark of T1D 30,50. While antigen-specific autoreactive T cells are clearly key players in T1D, our findings suggest that beta cell selectivity can emerge also in the absence of autoreactive lymphocytes, presumably via vulnerability brought about by distinct metabolic wiring of beta cells. Second, islets with mosaic deletion of Adar in beta cells had abundant empty, or “ghost” beta cells, which contained proinsulin but lacked mature insulin. Such cells are observed in the pancreas of patients with recent-onset T1D 30,40. Moreover, in both βAdarKO mice and human T1D, lack of mature insulin is associated with reduced levels of the PC1/3 convertase 51. Our study suggests that PC1/3 is reduced due to exposure to paracrine signals emanating from either mutant beta cells or infiltrating immune cells. Third, we observed a highly heterogenous inflammatory response, with some islets being heavily infiltrated and some completely spared, despite efficient Adar deletion. Mosaic islet infiltration is an intriguing, unexplained phenomenon in T1D 31,52. We propose that it results from diverging outcomes of an early interferon response in a subset of beta cells, which need to cross a certain threshold of intensity to attract inflammatory cells. This in turn may exacerbate local islet inflammation. The possibility that islets differ in their metabolic activity may further drive heterogenous islet inflammation 53,54. Finally, in our model system beta cell injury is the cause rather than the consequence of islet inflammation. This is consistent with the recent provocative demonstration that in human T1D, beta cell damage precedes autoimmunity 31,52.
In summary, we describe the dependency of mouse and human beta cells on intact Adar function. Disrupted editing of endogenous mRNA leads to the accumulation of dsRNA, activation of an interferon response, islet inflammation and diabetes. The consequences of Adar1 deficiency in beta cells resemble key aspects of early T1D, and are consistent with recent genetic evidence that implicates RNA editing in human inflammatory diseases including autoimmune diabetes. Together these findings suggest a model for T1D in which defective RNA editing of beta cell transcripts leads to an anti-viral response and destructive islet inflammation (Figure 6). Finally, the metabolic dependency of the interferon response suggests the presence of a positive feedback loop that may drive progression of T1D, with potential implications for pharmacologic intervention.
Limitations of the study
Our study did not address whether RNA editing is defective in human T1D. Given recent observations, meeting this challenge will likely require the identification of a small subset of culprit mRNA molecules in human beta cells. Furthermore, the “dangerous” dsRNA may be expressed and trigger inflammation only in a narrow time window during pathogenesis.
We focused our study on the phenotype of complete Adar knockout, since we observed no diabetes and inflammation in mice with heterozygous Adar deficiency. Future studies will search for potentially milder IFN response in heterozygotes, that might be enhanced by environmental stimuli. Our findings that heterozygous mice have reduced RNA editing support the idea that partial RNA editing deficiency may cause a phenotype. The elevated IFN response in human islets upon partial ADAR knockdown further supports this view. In addition, the finding that RNA editing levels are much higher in human compared with mouse beta cells (i.e., there are more “dangerous” endogenous dsRNA in human cells) suggests that human islets will be more sensitive to partial RNA editing deficiency.
STAR★Methods
Resource availability
Lead contact
Further information and requests for resources and reagents should be directed to and will be fulfilled by the Lead Contact, Yuval Dor (yuvald@ekmd.huji.ac.il).
Material availability
This study did not generate new unique reagents.
Mouse crosses generated in this study are available upon reasonable request.
Data and code availability
The RNA-seq data generated in this study were deposited to GEO under accession number GSE245574. This paper does not report original code. The values for all graphs shown in the paper are provided in Data S1.
Any additional information required to reanalyze the data reported in this paper is available from the lead contact upon request.
Experimental model and subject details
Mouse Models
All experiments presented in this study were conducted according to regulatory standards approved by the joint ethics committee (IACUC) of the Hebrew University and Hadassah Medical Center. The Hebrew University is an AAALAC International-accredited institute.
The mouse strains used in this study were ROSA26-LSL-EYFP (R26R-EYFP Jackson Laboratory), MipCreER 62, Adarlox (with loxP-flanked Adar) 8 and Ifih1 knock out mice. These transgenic mice were initially on a C57BL/6 background, but were subsequently outbred to CD1 (ICR) mice. As a result, the compound transgenic mice have a mixed genetic background derived from the ICR strain. Tamoxifen (20 mg/ml in corn oil; Sigma-Aldrich) was injected subcutaneously into 1- month-old adult mice. Two doses of 8mg (2 days apart) were used to achieve maximal recombination in beta cells. For Intraperitoneal Glucose Tolerance Test (IP-GTT), mice were fasted overnight and glucose (2g/kg) was injected intraperitoneally. YFP+ cells were strictly insulin+ in βAdarHET mice, verifying beta cell specificity of the MIP-CreER driver (Supplementary Figure S6). The average rate of recombination in beta cells was 67% (data not shown).
Human islets and pseudoislets
Human islets from IIDP (https://iidp.coh.org) were handled and sized as previously described 28. Pseudoislets were generated and assessed for gene or protein expression and hormone secretion by perifusion, as previously detailed 28. Donor information is provided in Supplemental Table 1. Briefly, hand-picked human islets (>95% purity) were cultured in CMRL 1066 medium and dispersed with HyClone trypsin (Thermo Scientific). The dispersed islet cells were incubated either with CMV-mCherry scramble control vector adenovirus or CMV-mCherry-U6-ADAR1vector virus at a multiplicity of infection of 500 for 2 hours in Vanderbilt Pseudoislet Media and then washed and plated in Cell-Carrier Spheroid Ultra-low attachment microplates (PerkinElmer) with 2000 cells per well. After 6 days of culture, pseudoislets were harvested for subsequent analysis. We confirmed that viral transduction of human islet cells did not induce an interferon response (Supplementary Figure S6).
Method details
Immunostaining
Paraffin sections (5-μm-thick) were prepared from formalin-fixed, paraffin-embedded pancreata. Sections after rehydration and antigen retrieval were immunostained overnight at 4°C with primary antibodies (see key resources table) in CAS-block blocking solution (Thermo fisher). For fluorescent immunostaining, slides were stained with Cy™2, Cy™3 and Cy™5-conjugated AffinityPure Donkey IgG (H+L) secondary antibodies (Jackson ImmunoResearch). DNA was counterstained using DAPI (Sigma-Aldrich). Immunofluorescence images were captured using a Nikon C2 or Olympus FV1000 confocal microscope. To determine beta cell area, consecutive paraffin sections 75 μm apart spanning the entire pancreas (approximately 9 sections/pancreas) were stained for insulin or YFP (using an anti-GFP antibody) and hematoxylin (SIGMA); slides were incubated with Biotin-SP-conjugated AffinityPure Donkey IgG (H+L) (Jackson ImmunoResearch), followed by Avidin HRP (Sigma-Aldrich) and 3,3′-Diaminobenzidine (DAB) substrate (Thermo Scientific). Digital images of sections at a magnification of ×40 were obtained and stitched using Nikon-TL and NIS-Elements software.The fraction of tissue covered by insulin or YFP staining was determined using ImageJ software.
KEY RESOURCES TABLE.
| REAGENT or RESOURCE | SOURCE | IDENTIFIER |
| Antibodies | ||
| Guinea pig anti Insulin | DAKO | Cat# IR002 |
| Goat anti GFP | Abcam | Cat# Ab6673 |
| Rabbit anti Iba1 | Abcam | Cat# Ab178846 |
| Rat anti CD3 | Abcam | Cat# Ab11089 |
| Rat anti CD8 | Invitrogen | Cat# 14–0808-80 |
| Rat anti CD19 | Invitrogen | Cat# 14–0194-82 |
| Rabbit anti CD45 | Abcam | Cat# Ab10558 |
| Rabbit anti MafA | Bethyl | Cat# A700–067 |
| Mouse anti Proinsulin | Hybridoma bank | Cat# GS-9A8 |
| Rabbit anti PC1/PC3 | Abcam | Cat# Ab220363 |
| Mouse anti glucagon | Abcam | Cat #AB10988 |
| Rabbit anti mCherry | Abcam | Cat# AB167453 |
| Rabbit anti ADAR1 | Invitrogen | Cat # PA5–21369 |
| Rabbit anti somatostatin | Abcam | Cat# 108456 |
| Alexa Fluor® 488 AffiniPure Donkey Anti-Goat IgG (H+L) (min X Ck, GP, Sy Hms, Hrs, Hu, Ms, Rb, Rat Sr Prot) | Jackson ImmunoResearch Labs | Cat# 705–545-147, RRID:AB_2336933 |
| Cy3-AffiniPure Donkey Anti-Rabbit IgG (H+L) (min X Bov,Ck,Gt,GP,Sy Hms,Hrs,Hu,Ms,Rat,Shp Sr Prot) | Jackson ImmunoResearch Labs | Cat# 711–165-152, RRID:AB_2307443 |
| Alexa Fluor 647-AffiniPure Donkey Anti-Mouse IgM, µ Chain Specific (min X Hu,Bov,Hrs,Rat Sr Prot) antibody | Jackson ImmunoResearch Labs | Cat# 715–605-140, RRID:AB_2340861 |
| Bacterial and virus strains | ||
| Biological samples | ||
| Mouse Pancreas | This paper | N/A |
| Mouse Islets | This paper | N/A |
| Human Islets | Supplemental Table S1 | N/A |
| Chemicals, peptides, and recombinant proteins | ||
| Tamoxifen | Sigma-Aldrich | Cat# T5648–5G |
| PerfeCTa SYBR Green FastMix | Quanta Biosciences | Cat# 95073–012-2 |
| SYBR PCR Master mix | Bio-Rad | Cat# 1725124 |
| TRIzol Reagent | Thermo Fisher | Cat# 15596026 |
| Ruxolitinib | Abcam | Cat# AB-ab141356–25-B |
| GKA | Pfizer | Cat# HY-108328 |
| Diazoxide | Sigma-Aldrich | Cat# D9035–250MG |
| Nifedipine | Sigma-Aldrich | Cat# N7634–1G |
| IFNa | BioLegend | Cat# BLG-752804 |
| ExtrAvidin-Peroxidase | Sigma-Aldrich | Cat# E2886 |
| DAB Quanto | Thermo Scientific | Cat# TA-125-HDX |
| Hematoxylin | Sigma-Aldrich | |
| Zombie Violet™ Dye | Biolegend | Cat# 77477 |
| Perm/Wash™ Perm/Wash Buffer | BD Biosciences | Cat# 54723 |
| Cytofix/Cytoperm™ Fixation and Permeabilization Solution | BD Biosciences | Cat# 554722 |
| Droplet Generation Oil for Probes | Bio-Rad | Cat# D9161172A |
| ddPCR Supermix for Probes | Bio-Rad | Cat# 1863024 |
| Critical commercial assays | ||
| Direct-Zol™ RNA-MicroPrep w/ Zymo-Spin™ IC Columns | Zymo | Cat# R2062 |
| qScript cDNA synthesis kit | Quanta Biosciences | Cat# 95047–500 |
| SMARTer Stranded Total RNA-Seq Kit v3 – Pico Input Mammalian | Takara Bio | Cat# 634485 |
| The Rat Insulin ELISA (Ultra Sensitive) | Crystal Chem | Cat#90060 |
| Deposited data | ||
| Source data for all graphs | Data S1 | |
| Experimental models: Cell lines | ||
| Experimental models: Organisms/strains | ||
| Mouse: Adarf/f | 8 | NA |
| Mouse: MIP-CreER™ | 62 | NA |
| Mouse: ROSA26-LSL-EYFP | Jackson Laboratory | B6.129X1-Gt(ROSA)26Sortm1(EYFP)Cos/J |
| Mouse: Ifih1 knock-out | Jackson Laboratory | B6.Cg-Ifih1tm1.1Cln/J |
| Recombinant DNA | ||
| Software and algorithms | ||
| Prism (version 8.0.2) | GraphPad | https://www.graphpad.com/scientific-software/prism/ |
| ImageJ (version 1.8.0) | NIH | http://imagej.nih.gov/ij |
| GSEA | https://www.gsea-msigdb.org/gsea/index.jsp | |
| FastQC (version 0.11.8) | Babraham Institute | http://www.bioinformatics.babraham.ac.uk/projects/fastqc/ |
| UMI-tools (versions 1.1.1 & 1.1.2) | https://umi-tools.readthedocs.io/en/latest/ | |
| seqtk trimfq | https://ggnbUtcomt/ihia/seqeqtk | |
| STAR (version 2.7.3a) | https://github.com/alexdobin/STAR | |
| htseq-count script (version 2.0.1) | https://htseq.readthedocs.io/en/master/htseqcount.html | |
| DeSeq2 (version 1.28.1) | https://github.com/mikelove/DESeq2 | |
| Other | ||
| Collagenase P | Sigma-Aldrich | Cat# 11213873001 |
| RPMI 1640 | Gibco | Cat# 31870025 |
| RPMI 1640 no glucose | Sartorius | Cat# 01–101-1A |
| Histopaque-1119 (Ficoll 1.119g/mL) | Sigma-Aldrich | Cat# 111910–100ML |
| Histopaque- 1077(Ficoll 1.079 g/mL) | Sigma-Aldrich | Cat# 10771–100ML |
Insulitis
Tissue sections (5 μm) were immunostained for YFP (using an anti-GFP antibody), insulin and CD45. Images of islets from five noncontiguous sections of each pancreas were captured on a Nikon C2 and islets scored for infiltrating leukocytes as shown in Fig. 2A: no infiltration, minor (less than 10 peri-islet leukocytes present at any point around islet), mild (>30% peri-islet infiltrate), moderate (intra-islet infiltrate) or severe (>50% intra-islet infiltrate). At least 100 islets/mouse with n = 4–13 mice/genotype were scored and averaged to calculate insulitis score.
Pancreas Insulin Content
Pancreata from βAdarWT, βAdarHET or diabetic βAdarKO were harvested 16 days after tamoxifen injection and homogenized in ice-cold acidic alcohol (0.18N Hydrochloric Acid (HCl), 70% Ethanol). After 24 hours incubation at 4°C tissue homogenates were centrifuged, supernatant insulin concentrations were measured by an enzyme-linked immunosorbent assay (ELISA) (Crystal Chem Inc.) and normalized to tissue weight.
Mouse Islets
Mouse islet isolation was performed as previously described 63. Briefly, islets were isolated using collagenase P (Roche) injected into the pancreatic duct, followed by Histopaque gradient (1119 and 1077; Sigma-Aldrich). For ex-vivo assays, 30–40 handpicked islets per replicate were incubated in RPMI-1640 medium (Biological Industries) supplemented with 5mM or 11mM glucose, 10% FBS (Sigma-Aldrich), L-glutamine and penicillin-streptomycin in a 37 °C, 5% CO2 incubator and treated for the indicated times with 10μmol/L Glucokinase activator (GKA, Pfizer), 325 μmol/L diazoxide (Sigma-Aldrich), 10 μmol/L nifedipine (Sigma-Aldrich) or 800 units/ml Interferon alpha (IFNa, BioLegends).
Metabolic analysis
Mouse blood glucose was measured using a handheld glucometer (Accu-Chek performa). For glucose tolerance test, mice were fasted for 16h and blood glucose was measured at the indicated timepoints following an intraperitoneal (i.p.) injection of glucose (2 g/kg). Static glucose-stimulated insulin secretion (GSIS) assays were performed on newly isolated islets after overnight incubation in RPMI medium (Sartorius) supplemented with 10% FBS, L-glutamine and penicillin-streptomycin in a 37 °C, 5% CO2 incubator. 30 islets for each assay replicate were handpicked and placed in basal KRB buffer (118 mM NaCl, 4.7 mM KC1, 1.2 mM KH2PO4, 1.2 mM MgSO4, 4.2 mM NaHCO3 2 mM CaCl2 and 10 mM HEPES, pH 7.4) containing 2.8 mM glucose (Sigma) and then transferred into Krebs buffer containing 16.7 mM glucose. Medium was collected after 1h incubation at each glucose concentration. Islet were then collected and lysed in RIPA buffer (25mM Tris pH 7.6, 150mM NaCl, 1% NP-40, 0.5 % sodium deoxycholate, 0.1% SDS) for total protein extraction. Insulin concentrations in the supernatants and islets were measured by ELISA (Crystal Chem Inc.).
Flow Cytometry and Cell Sorting (FACS)
For live cell sorting, islets from βAdarWT, βAdarHET or βAdarKO mice were dissociated to single cells using Accumax (Sigma-Aldrich), stained with DAPI (0.2ug/ml) for dead cell discrimination, and DAPI-negative, YFP-positive cells sorted on a FACS Aria III (Becton Dickinson). For flow cytometry analysis, dissociated islet cells were stained with Zombie Violet for live/dead cells discrimination, and fixed and permeabilized using Cytofix/Cytoperm and Perm/Wash (BD Biosciences). Cells were stained in Perm/Wash buffer with primary antibodies, followed by secondary antibodies (Cy2, Cy3 or Cy5 conjugated; Jackson ImmunoResearch). Cells were analyzed using an LSR-Fortessa-Analyzer with at least 10,000 events recorded. Analysis of the results was performed using FCS-express 7 (De Novo Software).
RNA Extraction
RNA was isolated using Zymo Direct-Zol™ RNA-MicroPrep kit and reverse transcription was performed with a qScript kit (Quanta Biosciences) according to the manufacturer’s instructions. Quantitative real-time PCR (qRT-PCR) was performed on a CFX96 Real-Time System (Bio-Rad) with PerfeCTa SYBR Green SuperMix (Quanta Biosciences) and gene-specific primers (see key resources table). RT-Droplet Digital PCR was performed on a ddPCR system (Bio-Rad) with Supermix, Droplet generation oil for probes (Bio-Rad) and gene-specific primers and probe (see key resources table).
Human pseudoislet RNA was extracted using Invitrogen RNAquous-Micro Total RNA Isolation kit (Thermo Fisher #AM1931) and quantified by Qubit Fluoremeter 2.0 as described. RNA integrity was confirmed (RIN 8.2–10, average 9.7±0.13) by 2100 Bioanalyzer (Agilent). cDNA was synthesized using high-capacity cDNA Reverse Transcription Kit (Applied Biosystems, 4368814) according to the manufacturer’s instructions. Quantitative PCR (qPCR) was performed using TaqMan assays and reagents from Applied Biosystems as described 64,65.
Relative changes in mRNA expression were calculated by the comparative deltaCt method using Applied Biosystem StepOnePlus system.
RNA-Seq Library Preparation and Sequencing
Libraries were prepared using the SMARTer Stranded Total RNA-Seq Kit v3 - Pico Input Mammalian (Takara). Samples were sequenced (paired-end (2 × 75 bp)) on a NextSeq 500 (Illumina).
Raw FASTQ quality was assessed using FastQC (version 0.11.8), and barcodes were preprocessed using UMI-tools versions 1.1.1 and 1.1.2 66. Mate 2 reads were further trimmed to 60 bases using seqtk trimfq with -b 7. Fastq files were then uniquely aligned to reference genome using STAR (version 2.7.3a) 67 with parameters --alignSJoverhangMin 8 --alignIntronMax 1000000 --alignMatesGapMax 600000 --outFilterMismatchNoverReadLmax 1 --outFilterMultimapNmax 1 and deduped using UMI-tools. Reads were counted with the htseq-count script version 2.0.1 68 and normalized using DeSeq2 version 1.28.1 69.
Detection and quantification of A-to-I RNA Editing
RNA Editing Index version 1.0 was used to assess the overall editing in Alu and B1, B2 elements in human and mouse, respectively 25. This measure calculates the average editing level across all adenosines in repetitive elements weighted by their expression, thereby quantifying the ratio of A-to-G mismatches over the total number of nucleotides aligned to repeats and comprising a global, robust measure of A-to-I RNA editing.
Quantification and statistical analysis
Experimental values are presented as mean ± SEM. Unless stated otherwise, statistical significance was determined by two tailed unpaired Student’s t test. P < 0.05 was considered statistically significant (*p<0.05, **p<0.01, ***p<0.001, **** p<0.0001).
| Oligonucleotides | ||
|---|---|---|
| MOUSE | Sequence | Source |
| Genotyping primers - Adar_forward | CTGTTGGGCCAGTGGTTCAGTAGTCC | Integrated DNA Technology (IDT) |
| Genotyping primers - Adar_reverse | GCCACTTCTCCCTGACTCCTG | Integrated DNA Technology (IDT) |
| Genotyping primers - Cre_forward | TGCCACGACCAAGTGACAGC | Integrated DNA Technology (IDT) |
| Genotyping primers - Cre_reverse | CCAGGTTACGGATATAGTTCATG | Integrated DNA Technology (IDT) |
| Genotyping primers - YFP_forward1 | GAAAGACCGCGAAGAGTTTG | Integrated DNA Technology (IDT) |
| Genotyping primers - YFP_forward2 | TAAGCCTGCCCAGAAGACTC | Integrated DNA Technology (IDT) |
| Genotyping primers - YFP_reverse | AAAGTCGCTCTGAGTTGTTAT | Integrated DNA Technology (IDT) |
| Quantitative RT- PCR primers - Mouse ActinB forward | CACAGCTTCTTTGCAGCTCCT | Integrated DNA Technology (IDT) |
| Quantitative RT- PCR primers - ActinB_reverse | GTCATCCATGGCGAACTGG | Integrated DNA Technology (IDT) |
| Quantitative RT- PCR primers - IFIH1_forward | AGCTTCACCTGGTGTTGGAG | Integrated DNA Technology (IDT) |
| Quantitative RT- PCR primers - IFIH1_reverse | AAAGGCATCAAGATTGGCAC | Integrated DNA Technology (IDT) |
| Quantitative RT- PCR primers - B2M_forward | TCACACTGAATTCACCCCCAC | Integrated DNA Technology (IDT) |
| Quantitative RT- PCR primers - B2M reverse | TGATCACATGTCTCGATCCCA | Integrated DNA Technology (IDT) |
| Quantitative RT- PCR primers - IRF9_forward | GAGCTCTTCAAGACCACCTACTTCT | Integrated DNA Technology (IDT) |
| Quantitative RT- PCR primers - IRF9_reverse | GGCTAGAGCCAGGACTCTCC | Integrated DNA Technology (IDT) |
| Quantitative RT- PCR primers - ISG15_forward | TCTGACTGTGAGAGCAAGCAG | Integrated DNA Technology (IDT) |
| Quantitative RT- PCR primers - ISG15_reverse | ACCTTTAGGTCCCAGGCCATT | Integrated DNA Technology (IDT) |
| Quantitative RT- PCR primers - IRF7_forward | AAACCATAGAGGCACCCAAG | Integrated DNA Technology (IDT) |
| Quantitative RT- PCR primers - IRF7_reverse | CCCAATAGCCAGTCTCCAAA | Integrated DNA Technology (IDT) |
| Quantitative RT- PCR primers - IFIT2_forward | CGCTTTGACACAGCAGACAG | Integrated DNA Technology (IDT) |
| Quantitative RT- PCR primers - IFIT2_reverse | GTCGCAGATTGCTCTCCAGT | Integrated DNA Technology (IDT) |
| Quantitative RT- PCR primers - Adar6_7_forward | TGACCAGTCTGGACCTCCTC | Integrated DNA Technology (IDT) |
| Quantitative RT- PCR primers - Adar6_7_reverse | CTTGCCCTGTTTCTTGCTGT | Integrated DNA Technology (IDT) |
| RT-ddPCR primers- Ifna4 forward | GAGTGACCAGCATCTACAAGAC | Integrated DNA Technology (IDT) |
| RT-ddPCR primers- Ifna4 reverse | AGAACAGGCTGACCAGTAGTA | Integrated DNA Technology (IDT) |
| RT-ddPCR FAMprobe- Ifna4 | FAM/AATGGCTAG/ZEN/GCTTGCTTTCCT/3IABkFQ | Integrated DNA Technology (IDT) |
| RT-ddPCR primers- Ifnb1 forward | TGGGAGATGTCCTCAACTGC | Integrated DNA Technology (IDT) |
| RT-ddPCR primers- Ifnb1 reverse | CCAGGCGTAGCTGTTGTACT | Integrated DNA Technology (IDT) |
| RT-ddPCR HEXprobe- Ifnb1 | HEX/ACCTTTGCA/ZEN/CCCTCCAGTAATAGCTC/3IABkFQ | Integrated DNA Technology (IDT) |
| HUMAN | Catalog # | source |
| ACTB | Hs99999903_m1 | ThermoFisher |
| TBP | Hs99999910_m1 | ThermoFisher |
| ADAR1 | Hs00241666_m1 | ThermoFisher |
| IFIH1 | Hs00223420_m1 | ThermoFisher |
| IRF7 | Hs00185375_m1 | ThermoFisher |
| IRF9 | Hs00196051_m1 | ThermoFisher |
| IFNA1 | Hs00256882_s1 | ThermoFisher |
| IFNA2 | Hs00265051_s1 | ThermoFisher |
| IFNA4 | Hs01681284_sH | ThermoFisher |
| IFNB1 | Hs01077958_s1 | ThermoFisher |
| ZBP1 | Hs00229199_m1 | ThermoFisher |
| IFIT2 | Hs00533665_m1 | ThermoFisher |
| IFIT3 | Hs00382744_m1 | ThermoFisher |
| ISG15 | Hs01921425_s1 | ThermoFisher |
| IFI44 | Hs00197427_m1 | ThermoFisher |
| INS | Hs00355773_m1 | ThermoFisher |
| GCG | Hs01031536_m1 | ThermoFisher |
| MAFA | Hs01651425_s1 | ThermoFisher |
| MAFB | Hs00534343_s1 | ThermoFisher |
| PDX1 | Hs00236830_m1 | ThermoFisher |
| NKX6–1 | Hs00232355_m1 | ThermoFisher |
Supplementary Material
Data S1 – Source Data
An excel file with each spreadsheet containing the values used to generate all graphs in this paper.
Highlights.
Disrupted RNA editing in beta cells triggers islet inflammation and diabetes
Glycolysis via calcium enhances interferon response of beta cells
Editing-deficient diabetes recapitulates features of early human T1D
T1D might be driven by non-viral, endogenous dsRNA
ACKNOWLEDGEMENTS
This study used human pancreatic islets that were provided by the NIDDK-funded Integrated Islet Distribution Program at the City of Hope (DK098085).
Supported by grants from the Juvenile Diabetes Research Foundation (JDRF, 2-SRA-2022–1250-S-B), HIRN (U01DK135001), NIDDK (R01DK133442), The Alex U Soyka pancreatic cancer fund, The Israel Science Foundation and the DON Foundation (to Y.D.). Y.D holds the Walter and Greta Stiel Chair and Research grant in Heart studies. Supported also by the Human Islet Research Network (RRID:SCR_014393), the Human Pancreas Analysis Program (RRID:SCR_016202), DK133442, DK106755, DK123716, DK117147, DK112217, DK20593 (Vanderbilt Diabetes Research and Training Center), The Leona M. and Harry B. Helmsley Charitable Trust, and the Department of Veterans Affairs (BX000666).
Footnotes
DECLARATION OF INTERESTS
The authors declare no competing interests.
Publisher's Disclaimer: This is a PDF file of an unedited manuscript that has been accepted for publication. As a service to our customers we are providing this early version of the manuscript. The manuscript will undergo copyediting, typesetting, and review of the resulting proof before it is published in its final form. Please note that during the production process errors may be discovered which could affect the content, and all legal disclaimers that apply to the journal pertain.
References
- 1.Eisenberg E, and Levanon EY (2018). A-to-I RNA editing - immune protector and transcriptome diversifier. Nat. Rev. Genet. 19, 473–490. 10.1038/s41576-018-0006-1. [DOI] [PubMed] [Google Scholar]
- 2.Ahmad S, Mu X, Yang F, Greenwald E, Park JW, Jacob E, Zhang C-Z, and Hur S (2018). Breaching Self-Tolerance to Alu Duplex RNA Underlies MDA5-Mediated Inflammation. Cell 172, 797–810.e13. 10.1016/j.cell.2017.12.016. [DOI] [PMC free article] [PubMed] [Google Scholar]
- 3.Rice GI, Kasher PR, Forte GMA, Mannion NM, Greenwood SM, Szynkiewicz M, Dickerson JE, Bhaskar SS, Zampini M, Briggs TA, et al. (2012). Mutations in ADAR1 cause Aicardi-Goutières syndrome associated with a type I interferon signature. Nat. Genet. 44, 1243–1248. 10.1038/ng.2414. [DOI] [PMC free article] [PubMed] [Google Scholar]
- 4.Liddicoat BJ, Piskol R, Chalk AM, Ramaswami G, Higuchi M, Hartner JC, Li JB, Seeburg PH, and Walkley CR (2015). RNA editing by ADAR1 prevents MDA5 sensing of endogenous dsRNA as nonself. Science 349, 1115–1120. 10.1126/science.aac7049. [DOI] [PMC free article] [PubMed] [Google Scholar]
- 5.Liu H, Golji J, Brodeur LK, Chung FS, Chen JT, deBeaumont RS, Bullock CP, Jones MD, Kerr G, Li L, et al. (2019). Tumor-derived IFN triggers chronic pathway agonism and sensitivity to ADAR loss. Nat. Med. 25, 95–102. 10.1038/s41591-018-0302-5. [DOI] [PubMed] [Google Scholar]
- 6.Ishizuka JJ, Manguso RT, Cheruiyot CK, Bi K, Panda A, Iracheta-Vellve A, Miller BC, Du PP, Yates KB, Dubrot J, et al. (2019). Loss of ADAR1 in tumours overcomes resistance to immune checkpoint blockade. Nature 565, 43–48. 10.1038/s41586-018-0768-9. [DOI] [PMC free article] [PubMed] [Google Scholar]
- 7.Pestal K, Funk CC, Snyder JM, Price ND, Treuting PM, and Stetson DB (2015). Isoforms of RNA-Editing Enzyme ADAR1 Independently Control Nucleic Acid Sensor MDA5-Driven Autoimmunity and Multi-organ Development. Immunity 43, 933–944. 10.1016/j.immuni.2015.11.001. [DOI] [PMC free article] [PubMed] [Google Scholar]
- 8.Hartner JC, Walkley CR, Lu J, and Orkin SH (2009). ADAR1 is essential for the maintenance of hematopoiesis and suppression of interferon signaling. Nat. Immunol. 10, 109–115. 10.1038/ni.1680. [DOI] [PMC free article] [PubMed] [Google Scholar]
- 9.Apaolaza PS, Balcacean D, Zapardiel-Gonzalo J, Nelson G, Lenchik N, Akhbari P, Gerling I, Richardson SJ, Rodriguez-Calvo T, and nPOD-Virus Group (2021). Islet expression of type I interferon response sensors is associated with immune infiltration and viral infection in type 1 diabetes. Sci. Adv. 7. 10.1126/sciadv.abd6527. [DOI] [PMC free article] [PubMed] [Google Scholar]
- 10.Lundberg M, Krogvold L, Kuric E, Dahl-Jørgensen K, and Skog O (2016). Expression of Interferon-Stimulated Genes in Insulitic Pancreatic Islets of Patients Recently Diagnosed With Type 1 Diabetes. Diabetes 65, 3104–3110. 10.2337/db16-0616. [DOI] [PubMed] [Google Scholar]
- 11.Richardson SJ, Rodriguez-Calvo T, Gerling IC, Mathews CE, Kaddis JS, Russell MA, Zeissler M, Leete P, Krogvold L, Dahl-Jørgensen K, et al. (2016). Islet cell hyperexpression of HLA class I antigens: a defining feature in type 1 diabetes. Diabetologia 59, 2448–2458. 10.1007/s00125-016-4067-4. [DOI] [PMC free article] [PubMed] [Google Scholar]
- 12.Szymczak F, Colli ML, Mamula MJ, Evans-Molina C, and Eizirik DL (2021). Gene expression signatures of target tissues in type 1 diabetes, lupus erythematosus, multiple sclerosis, and rheumatoid arthritis. Sci. Adv. 7. 10.1126/sciadv.abd7600. [DOI] [PMC free article] [PubMed] [Google Scholar]
- 13.Liu S, Wang H, Jin Y, Podolsky R, Reddy MVPL, Pedersen J, Bode B, Reed J, Steed D, Anderson S, et al. (2009). IFIH1 polymorphisms are significantly associated with type 1 diabetes and IFIH1 gene expression in peripheral blood mononuclear cells. Hum. Mol. Genet. 18, 358–365. 10.1093/hmg/ddn342. [DOI] [PMC free article] [PubMed] [Google Scholar]
- 14.Nejentsev S, Walker N, Riches D, Egholm M, and Todd JA (2009). Rare variants of IFIH1, a gene implicated in antiviral responses, protect against type 1 diabetes. Science 324, 387–389. 10.1126/science.1167728. [DOI] [PMC free article] [PubMed] [Google Scholar]
- 15.Dunne JL, Richardson SJ, Atkinson MA, Craig ME, Dahl-Jørgensen K, Flodström-Tullberg M, Hyöty H, Insel RA, Lernmark Å, Lloyd RE, et al. (2019). Rationale for enteroviral vaccination and antiviral therapies in human type 1 diabetes. Diabetologia 62, 744–753. 10.1007/s00125-019-4811-7. [DOI] [PMC free article] [PubMed] [Google Scholar]
- 16.Lloyd RE, Tamhankar M, and Lernmark Å (2022). Enteroviruses and type 1 diabetes: multiple mechanisms and factors? Annu. Rev. Med. 73, 483–499. 10.1146/annurev-med-042320-015952. [DOI] [PMC free article] [PubMed] [Google Scholar]
- 17.Lincez PJ, Shanina I, and Horwitz MS (2015). Reduced expression of the MDA5 Gene IFIH1 prevents autoimmune diabetes. Diabetes 64, 2184–2193. 10.2337/db14-1223. [DOI] [PubMed] [Google Scholar]
- 18.Li Q, Gloudemans MJ, Geisinger JM, Fan B, Aguet F, Sun T, Ramaswami G, Li YI, Ma J-B, Pritchard JK, et al. (2022). RNA editing underlies genetic risk of common inflammatory diseases. Nature 608, 569–577. 10.1038/s41586-022-05052-x. [DOI] [PMC free article] [PubMed] [Google Scholar]
- 19.Athanasiadis A, Rich A, and Maas S (2004). Widespread A-to-I RNA editing of Alu-containing mRNAs in the human transcriptome. PLoS Biol. 2, e391. 10.1371/journal.pbio.0020391. [DOI] [PMC free article] [PubMed] [Google Scholar]
- 20.Levanon EY, Eisenberg E, Yelin R, Nemzer S, Hallegger M, Shemesh R, Fligelman ZY, Shoshan A, Pollock SR, Sztybel D, et al. (2004). Systematic identification of abundant A-to-I editing sites in the human transcriptome. Nat. Biotechnol. 22, 1001–1005. 10.1038/nbt996. [DOI] [PubMed] [Google Scholar]
- 21.Bazak L, Haviv A, Barak M, Jacob-Hirsch J, Deng P, Zhang R, Isaacs FJ, Rechavi G, Li JB, Eisenberg E, et al. (2014). A-to-I RNA editing occurs at over a hundred million genomic sites, located in a majority of human genes. Genome Res. 24, 365–376. 10.1101/gr.164749.113. [DOI] [PMC free article] [PubMed] [Google Scholar]
- 22.Barak M, Porath HT, Finkelstein G, Knisbacher BA, Buchumenski I, Roth SH, Levanon EY, and Eisenberg E (2020). Purifying selection of long dsRNA is the first line of defense against false activation of innate immunity. Genome Biol. 21, 26. 10.1186/s13059-020-1937-3. [DOI] [PMC free article] [PubMed] [Google Scholar]
- 23.Porath HT, Knisbacher BA, Eisenberg E, and Levanon EY (2017). Massive A-to-I RNA editing is common across the Metazoa and correlates with dsRNA abundance. Genome Biol. 18, 185. 10.1186/s13059-017-1315-y. [DOI] [PMC free article] [PubMed] [Google Scholar]
- 24.Neeman Y, Levanon EY, Jantsch MF, and Eisenberg E (2006). RNA editing level in the mouse is determined by the genomic repeat repertoire. RNA 12, 1802–1809. 10.1261/rna.165106. [DOI] [PMC free article] [PubMed] [Google Scholar]
- 25.Roth SH, Levanon EY, and Eisenberg E (2019). Genome-wide quantification of ADAR adenosine-to-inosine RNA editing activity. Nat. Methods 16, 1131–1138. 10.1038/s41592-019-0610-9. [DOI] [PubMed] [Google Scholar]
- 26.Mauvais-Jarvis F (2016). Role of sex steroids in β cell function, growth, and survival. Trends Endocrinol. Metab. 27, 844–855. 10.1016/j.tem.2016.08.008. [DOI] [PMC free article] [PubMed] [Google Scholar]
- 27.Rusinova I, Forster S, Yu S, Kannan A, Masse M, Cumming H, Chapman R, and Hertzog PJ (2013). Interferome v2.0: an updated database of annotated interferon-regulated genes. Nucleic Acids Res. 41, D1040–6. 10.1093/nar/gks1215. [DOI] [PMC free article] [PubMed] [Google Scholar]
- 28.Walker JT, Haliyur R, Nelson HA, Ishahak M, Poffenberger G, Aramandla R, Reihsmann C, Luchsinger JR, Saunders DC, Wang P, et al. (2020). Integrated human pseudoislet system and microfluidic platform demonstrate differences in GPCR signaling in islet cells. JCI Insight 5. 10.1172/jci.insight.137017. [DOI] [PMC free article] [PubMed] [Google Scholar]
- 29.Szabat M, Page MM, Panzhinskiy E, Skovsø S, Mojibian M, Fernandez-Tajes J, Bruin JE, Bround MJ, Lee JTC, Xu EE, et al. (2016). Reduced insulin production relieves endoplasmic reticulum stress and induces β cell proliferation. Cell Metab. 23, 179–193. 10.1016/j.cmet.2015.10.016. [DOI] [PubMed] [Google Scholar]
- 30.Wasserfall C, Nick HS, Campbell-Thompson M, Beachy D, Haataja L, Kusmartseva I, Posgai A, Beery M, Rhodes C, Bonifacio E, et al. (2017). Persistence of Pancreatic Insulin mRNA Expression and Proinsulin Protein in Type 1 Diabetes Pancreata. Cell Metab. 26, 568–575.e3. 10.1016/j.cmet.2017.08.013. [DOI] [PMC free article] [PubMed] [Google Scholar]
- 31.Rodriguez-Calvo T, Suwandi JS, Amirian N, Zapardiel-Gonzalo J, Anquetil F, Sabouri S, and von Herrath MG (2015). Heterogeneity and Lobularity of Pancreatic Pathology in Type 1 Diabetes during the Prediabetic Phase. J. Histochem. Cytochem. 63, 626–636. 10.1369/0022155415576543. [DOI] [PMC free article] [PubMed] [Google Scholar]
- 32.Abdul-Rasoul M, Habib H, and Al-Khouly M (2006). “The honeymoon phase” in children with type 1 diabetes mellitus: frequency, duration, and influential factors. Pediatr Diabetes 7, 101–107. 10.1111/j.1399-543X.2006.00155.x. [DOI] [PubMed] [Google Scholar]
- 33.Atkinson MA, Maclaren NK, and Luchetta R (1990). Insulitis and diabetes in NOD mice reduced by prophylactic insulin therapy. Diabetes 39, 933–937. 10.2337/diab.39.8.933. [DOI] [PubMed] [Google Scholar]
- 34.Vlahos WD, Seemayer TA, and Yale JF (1991). Diabetes prevention in BB rats by inhibition of endogenous insulin secretion. Metab. Clin. Exp. 40, 825–829. 10.1016/0026-0495(91)90010-t. [DOI] [PubMed] [Google Scholar]
- 35.Ludvigsson J, and Heding LG (1978). beta-cell function in children with diabetes. Diabetes 27 Suppl 1, 230–234. 10.2337/diab.27.1.s230. [DOI] [PubMed] [Google Scholar]
- 36.Shah SC, Malone JI, and Simpson NE (1989). A randomized trial of intensive insulin therapy in newly diagnosed insulin-dependent diabetes mellitus. N. Engl. J. Med. 320, 550–554. 10.1056/NEJM198903023200902. [DOI] [PubMed] [Google Scholar]
- 37.Grimsby J, Sarabu R, Corbett WL, Haynes N-E, Bizzarro FT, Coffey JW, Guertin KR, Hilliard DW, Kester RF, Mahaney PE, et al. (2003). Allosteric activators of glucokinase: potential role in diabetes therapy. Science 301, 370–373. 10.1126/science.1084073. [DOI] [PubMed] [Google Scholar]
- 38.Stark GR, and Darnell JE (2012). The JAK-STAT pathway at twenty. Immunity 36, 503–514. 10.1016/j.immuni.2012.03.013. [DOI] [PMC free article] [PubMed] [Google Scholar]
- 39.Lombardi A, and Tomer Y (2017). Interferon alpha impairs insulin production in human beta cells via endoplasmic reticulum stress. J. Autoimmun. 80, 48–55. 10.1016/j.jaut.2017.02.002. [DOI] [PMC free article] [PubMed] [Google Scholar]
- 40.Rodriguez-Calvo T, Chen Y-C, Verchere CB, Haataja L, Arvan P, Leete P, Richardson SJ, Morgan NG, Qian W-J, Pugliese A, et al. (2021). Altered β-Cell Prohormone Processing and Secretion in Type 1 Diabetes. Diabetes 70, 1038–1050. 10.2337/dbi20-0034. [DOI] [PMC free article] [PubMed] [Google Scholar]
- 41.Atkinson MA, von Herrath M, Powers AC, and Clare-Salzler M (2015). Current concepts on the pathogenesis of type 1 diabetes--considerations for attempts to prevent and reverse the disease. Diabetes Care 38, 979–988. 10.2337/dc15-0144. [DOI] [PMC free article] [PubMed] [Google Scholar]
- 42.Brown RJ, and Rother KI (2008). Effects of beta-cell rest on beta-cell function: a review of clinical and preclinical data. Pediatr Diabetes 9, 14–22. 10.1111/j.1399-5448.2007.00272.x. [DOI] [PMC free article] [PubMed] [Google Scholar]
- 43.Mirouze J, Selam JL, Pham TC, Mendoza E, and Orsetti A (1978). Sustained insulin-induced remissions of juvenile diabetes by means of an external artificial pancreas. Diabetologia 14, 223–227. 10.1007/BF01219420. [DOI] [PubMed] [Google Scholar]
- 44.Forlenza GP, McVean J, Beck RW, Bauza C, Bailey R, Buckingham B, DiMeglio LA, Sherr JL, Clements M, Neyman A, et al. (2023). Effect of verapamil on pancreatic beta cell function in newly diagnosed pediatric type 1 diabetes: A randomized clinical trial. JAMA 329, 990–999. 10.1001/jama.2023.2064. [DOI] [PMC free article] [PubMed] [Google Scholar]
- 45.Ovalle F, Grimes T, Xu G, Patel AJ, Grayson TB, Thielen LA, Li P, and Shalev A (2018). Verapamil and beta cell function in adults with recent-onset type 1 diabetes. Nat. Med. 24, 1108–1112. 10.1038/s41591-018-0089-4. [DOI] [PMC free article] [PubMed] [Google Scholar]
- 46.Keller RJ, Jackson RA, Eisenbarth GS, and Eisenbarth G (1993). Insulin prophylaxis in individuals at high risk of type 1 diabetes. Lancet 341, 927–928. 10.1016/0140-6736(93)91215-8. [DOI] [PubMed] [Google Scholar]
- 47.Ziegler A-G, Achenbach P, Berner R, Casteels K, Danne T, Gündert M, Hasford J, Hoffmann VS, Kordonouri O, Lange K, et al. (2019). Oral insulin therapy for primary prevention of type 1 diabetes in infants with high genetic risk: the GPPAD-POInT (global platform for the prevention of autoimmune diabetes primary oral insulin trial) study protocol. BMJ Open 9, e028578. 10.1136/bmjopen-2018-028578. [DOI] [PMC free article] [PubMed] [Google Scholar]
- 48.Effect of intensive therapy on residual beta-cell function in patients with type 1 diabetes in the diabetes control and complications trial. A randomized, controlled trial. The Diabetes Control and Complications Trial Research Group. (1998). Ann. Intern. Med. 128, 517–523. [DOI] [PubMed] [Google Scholar]
- 49.Horwitz MS, Bradley LM, Harbertson J, Krahl T, Lee J, and Sarvetnick N (1998). Diabetes induced by Coxsackie virus: initiation by bystander damage and not molecular mimicry. Nat. Med. 4, 781–785. 10.1038/nm0798-781. [DOI] [PubMed] [Google Scholar]
- 50.Atkinson MA (2012). The pathogenesis and natural history of type 1 diabetes. Cold Spring Harb. Perspect. Med. 2. 10.1101/cshperspect.a007641. [DOI] [PMC free article] [PubMed] [Google Scholar]
- 51.Sims EK, Syed F, Nyalwidhe J, Bahnson HT, Haataja L, Speake C, Morris MA, Balamurugan AN, Mirmira RG, Nadler J, et al. (2019). Abnormalities in proinsulin processing in islets from individuals with longstanding T1D. Transl. Res. 213, 90–99. 10.1016/j.trsl.2019.08.001. [DOI] [PMC free article] [PubMed] [Google Scholar]
- 52.Oram RA, Sims EK, and Evans-Molina C (2019). Beta cells in type 1 diabetes: mass and function; sleeping or dead? Diabetologia 62, 567–577. 10.1007/s00125-019-4822-4. [DOI] [PMC free article] [PubMed] [Google Scholar]
- 53.Olsson R, and Carlsson P-O (2011). A low-oxygenated subpopulation of pancreatic islets constitutes a functional reserve of endocrine cells. Diabetes 60, 2068–2075. 10.2337/db09-0877. [DOI] [PMC free article] [PubMed] [Google Scholar]
- 54.Taddeo EP, Stiles L, Sereda S, Ritou E, Wolf DM, Abdullah M, Swanson Z, Wilhelm J, Bellin M, McDonald P, et al. (2018). Individual islet respirometry reveals functional diversity within the islet population of mice and human donors. Mol. Metab. 16, 150–159. 10.1016/j.molmet.2018.07.003. [DOI] [PMC free article] [PubMed] [Google Scholar]
- 55.Ackermann AM, Wang Z, Schug J, Naji A, and Kaestner KH (2016). Integration of ATAC-seq and RNA-seq identifies human alpha cell and beta cell signature genes. Mol. Metab. 5, 233–244. 10.1016/j.molmet.2016.01.002. [DOI] [PMC free article] [PubMed] [Google Scholar]
- 56.Morán I, Akerman I, van de Bunt M, Xie R, Benazra M, Nammo T, Arnes L, Nakić N, García-Hurtado J, Rodríguez-Seguí S, et al. (2012). Human β cell transcriptome analysis uncovers lncRNAs that are tissue-specific, dynamically regulated, and abnormally expressed in type 2 diabetes. Cell Metab. 16, 435–448. 10.1016/j.cmet.2012.08.010. [DOI] [PMC free article] [PubMed] [Google Scholar]
- 57.Berthault C, Staels W, and Scharfmann R (2020). Purification of pancreatic endocrine subsets reveals increased iron metabolism in beta cells. Mol. Metab. 42, 101060. 10.1016/j.molmet.2020.101060. [DOI] [PMC free article] [PubMed] [Google Scholar]
- 58.Benner C, van der Meulen T, Cacéres E, Tigyi K, Donaldson CJ, and Huising MO (2014). The transcriptional landscape of mouse beta cells compared to human beta cells reveals notable species differences in long non-coding RNA and protein-coding gene expression. BMC Genomics 15, 620. 10.1186/1471-2164-15-620. [DOI] [PMC free article] [PubMed] [Google Scholar]
- 59.Helman A, Klochendler A, Azazmeh N, Gabai Y, Horwitz E, Anzi S, Swisa A, Condiotti R, Granit RZ, Nevo Y, et al. (2016). p16(Ink4a)-induced senescence of pancreatic beta cells enhances insulin secretion. Nat. Med. 22, 412–420. 10.1038/nm.4054. [DOI] [PMC free article] [PubMed] [Google Scholar]
- 60.Brereton MF, Rohm M, and Ashcroft FM (2016). β-Cell dysfunction in diabetes: a crisis of identity? Diabetes Obes. Metab. 18 Suppl 1, 102–109. 10.1111/dom.12732. [DOI] [PMC free article] [PubMed] [Google Scholar]
- 61.Swisa A, Avrahami D, Eden N, Zhang J, Feleke E, Dahan T, Cohen-Tayar Y, Stolovich-Rain M, Kaestner KH, Glaser B, et al. (2017). PAX6 maintains β cell identity by repressing genes of alternative islet cell types. J. Clin. Invest. 127, 230–243. 10.1172/JCI88015. [DOI] [PMC free article] [PubMed] [Google Scholar]
- 62.Tamarina NA, Roe MW, and Philipson L (2014). Characterization of mice expressing Ins1 gene promoter driven CreERT recombinase for conditional gene deletion in pancreatic β-cells. Islets 6, e27685. 10.4161/isl.27685. [DOI] [PMC free article] [PubMed] [Google Scholar]
- 63.Noordeen NA, Khera TK, Sun G, Longbottom ER, Pullen TJ, da Silva Xavier G, Rutter GA, and Leclerc I (2010). Carbohydrate-responsive element-binding protein (ChREBP) is a negative regulator of ARNT/HIF-1beta gene expression in pancreatic islet beta-cells. Diabetes 59, 153–160. 10.2337/db08-0868. [DOI] [PMC free article] [PubMed] [Google Scholar]
- 64.Dai C, Kayton NS, Shostak A, Poffenberger G, Cyphert HA, Aramandla R, Thompson C, Papagiannis IG, Emfinger C, Shiota M, et al. (2016). Stress-impaired transcription factor expression and insulin secretion in transplanted human islets. J. Clin. Invest. 126, 1857–1870. 10.1172/JCI83657. [DOI] [PMC free article] [PubMed] [Google Scholar]
- 65.Dai C, Hang Y, Shostak A, Poffenberger G, Hart N, Prasad N, Phillips N, Levy SE, Greiner DL, Shultz LD, et al. (2017). Age-dependent human β cell proliferation induced by glucagon-like peptide 1 and calcineurin signaling. J. Clin. Invest. 127, 3835–3844. 10.1172/JCI91761. [DOI] [PMC free article] [PubMed] [Google Scholar]
- 66.Smith T, Heger A, and Sudbery I (2017). UMI-tools: modeling sequencing errors in Unique Molecular Identifiers to improve quantification accuracy. Genome Res. 27, 491–499. 10.1101/gr.209601.116. [DOI] [PMC free article] [PubMed] [Google Scholar]
- 67.Dobin A, Davis CA, Schlesinger F, Drenkow J, Zaleski C, Jha S, Batut P, Chaisson M, and Gingeras TR (2013). STAR: ultrafast universal RNA-seq aligner. Bioinformatics 29, 15–21. 10.1093/bioinformatics/bts635. [DOI] [PMC free article] [PubMed] [Google Scholar]
- 68.Putri GH, Anders S, Pyl PT, Pimanda JE, and Zanini F (2022). Analysing high-throughput sequencing data in Python with HTSeq 2.0. Bioinformatics. 10.1093/bioinformatics/btac166. [DOI] [PMC free article] [PubMed] [Google Scholar]
- 69.Love MI, Huber W, and Anders S (2014). Moderated estimation of fold change and dispersion for RNA-seq data with DESeq2. Genome Biol. 15, 550. 10.1186/s13059-014-0550-8. [DOI] [PMC free article] [PubMed] [Google Scholar]
Associated Data
This section collects any data citations, data availability statements, or supplementary materials included in this article.
Supplementary Materials
Data S1 – Source Data
An excel file with each spreadsheet containing the values used to generate all graphs in this paper.
Data Availability Statement
The RNA-seq data generated in this study were deposited to GEO under accession number GSE245574. This paper does not report original code. The values for all graphs shown in the paper are provided in Data S1.
Any additional information required to reanalyze the data reported in this paper is available from the lead contact upon request.