

Abstract
Disease, injury, and aging induce pathological reactive astrocyte states that contribute to neurodegeneration. Modulating reactive astrocytes therefore represents an attractive therapeutic strategy. Here, we describe the development of an astrocyte phenotypic screening platform for identifying chemical modulators of astrocyte reactivity. Leveraging this platform for chemical screening, we identify HDAC3 inhibitors as effective suppressors of pathological astrocyte reactivity. We demonstrate that HDAC3 inhibition reduces molecular and functional characteristics of reactive astrocytes in vitro. Transcriptional and chromatin mapping studies show that HDAC3 inhibition disarms pathological astrocyte gene expression and function while promoting the expression of genes associated with beneficial astrocytes. Administration of RGFP966, a small molecule HDAC3 inhibitor, blocks reactive astrocyte formation and promotes neuroprotection in vivo in mice. Collectively, these results establish a platform for discovering modulators of reactive astrocyte states, inform the mechanisms that control astrocyte reactivity, and demonstrate the therapeutic benefits of modulating astrocyte reactivity for neurodegenerative diseases.
Astrocytes in the central nervous system (CNS) play important homeostatic roles. Astrocytes provide neurons with trophic support, promote functional synapse formation, and contribute to the formation and maintenance of the blood-brain barrier1–3. In the context of disease, injury, and even normal aging, astrocytes can adopt a pathological reactive state that can contribute to the death of neurons and oligodendrocytes4–12. Pathological reactive astrocytes are found in neurodegenerative diseases including Alzheimer’s disease, Parkinson’s disease, Huntington’s disease, amyotrophic lateral sclerosis, vanishing white matter disease13, and multiple sclerosis9, 14. Thus, there is considerable interest in modulating pathological reactive astrocytes to reduce the progression of these diseases4, 10, 15, 16. Here, we report on the development of an astrocyte discovery platform and how we leveraged the power of high-throughput phenotypic drug screening17 to inform the mechanisms that regulate astrocyte reactivity and identify chemical inhibitors of reactive astrocytes.
Results
A screening platform for modulators of astrocyte reactivity
Current astrocyte culture systems are limited by scale or confounded by the addition of serum, which irreversibly alters the astrocyte transcriptome18. It is therefore challenging to use these systems as platforms for exploring regulators of astrocyte reactivity. Therefore, we set out to develop an in vitro system that allowed for culturing hundreds of millions of physiological mouse cortical astrocytes in defined media conditions (Extended Data Fig. 1a). These astrocyte cultures share defining molecular, cellular, and functional properties with in vivo astrocytes. These shared properties include a stellate morphology, comparable transcriptional and chromatin state profiles, canonical astrocyte functions including glutamate uptake, and the ability to become reactive in response to inflammatory insults (Extended Data Fig. 1b–d). To demonstrate the purity of our astrocyte cultures, we performed single-cell RNA sequencing (scRNAseq) and found that nearly all cells expressed astrocyte specific transcripts (Fig. 1a). Further analysis of cell purity by ATACseq confirmed these findings, as evidenced by open chromatin at astrocyte marker genes, and closed chromatin at marker genes for other CNS cell types (Extended Data Fig. 1e–h). Together, these data demonstrate the near 100% purity of our astrocyte cultures and show that our platform could facilitate rapid high-throughput studies of astrocyte reactivity.
Figure 1. A reactive astrocytes cellular platform.
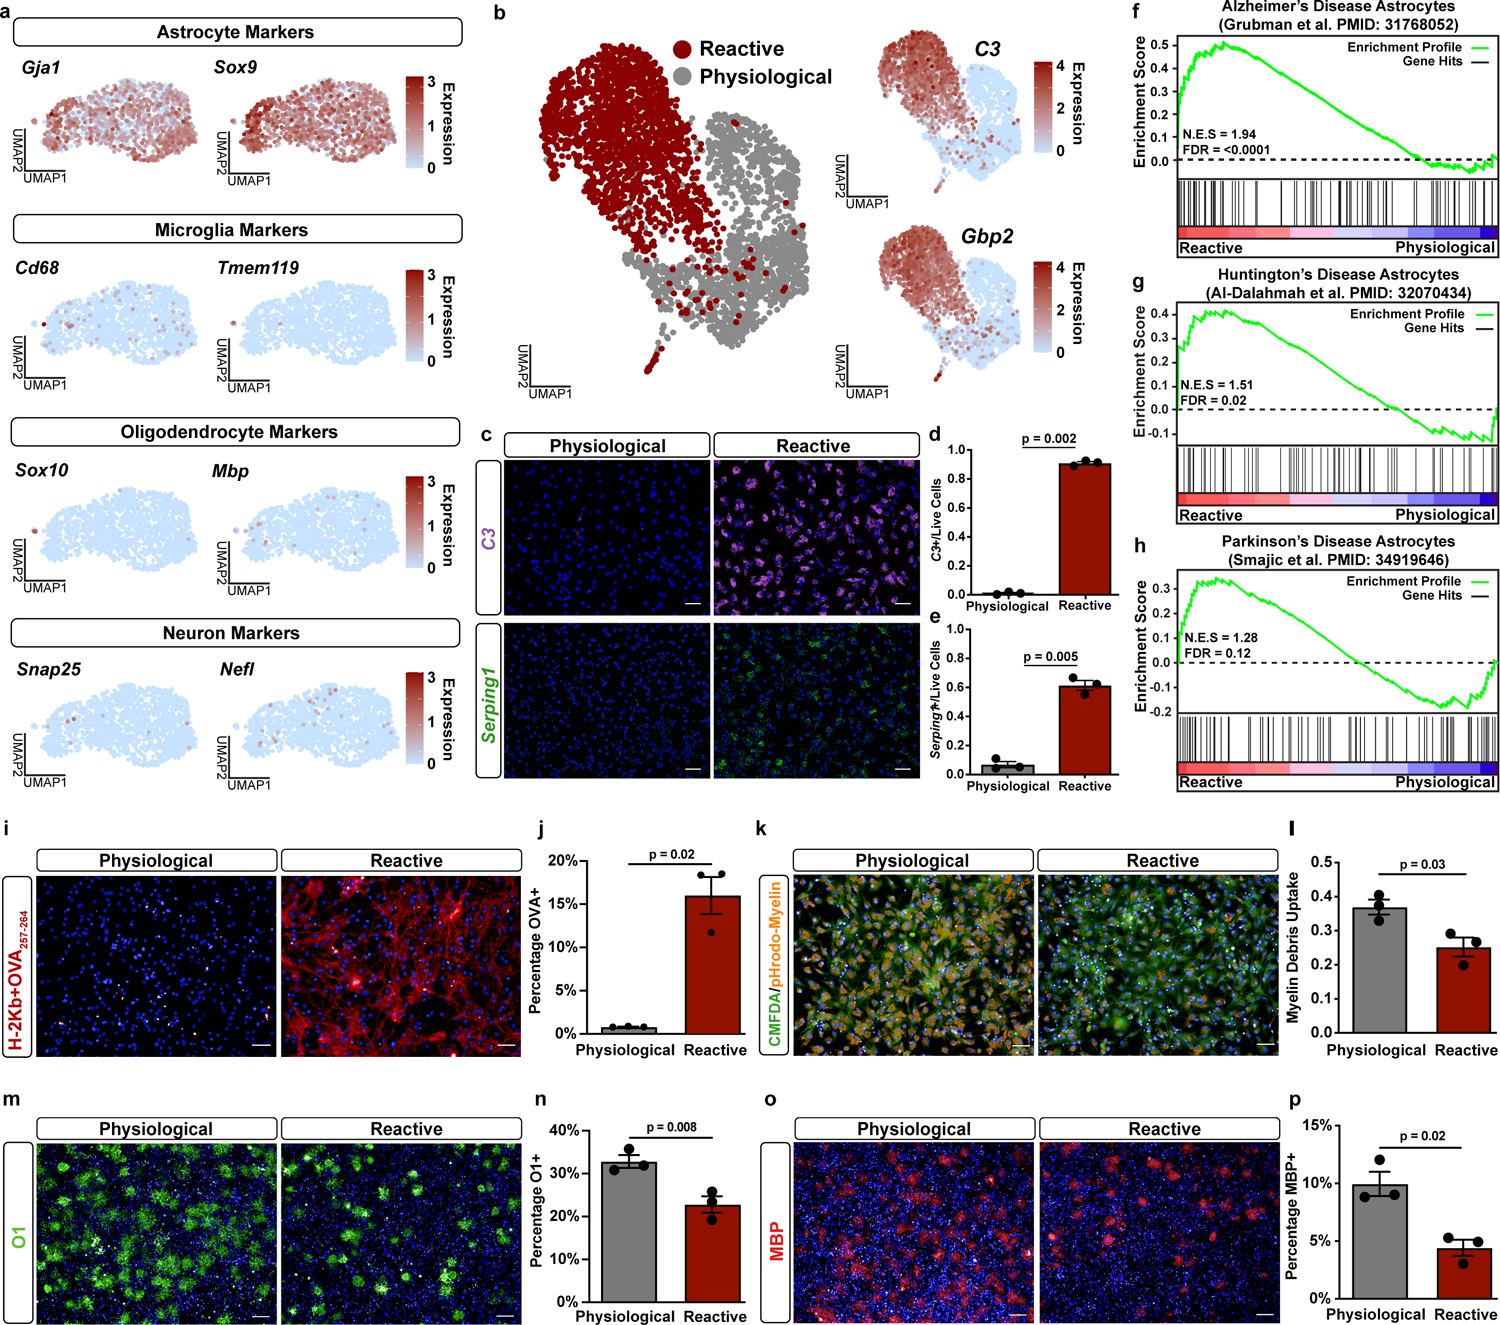
a, UMAP plots of cell-type specific marker expression from single-cell RNAseq of primary physiological astrocytes. Data represents n = 1,558 cells. b, UMAP plot of physiological and pathological reactive astrocytes (abbreviated to reactive in figures) single-cell RNAseq. Additional UMAP plots showing expression levels for the pathological reactive astrocyte markers C3 and Gbp2. c-e, Representative images and quantification of in situ hybridization with probes against the pathological reactive astrocyte transcripts C3 and Serping1. Scale bar is 50um. Data as mean ± s.e.m, n = 3 biological replicates (independent astrocyte isolation), p-value by paired two-sided t-test. f-h, Gene set enrichment analysis (GSEA) comparing pathological reactive astrocytes to the top 100 genes upregulated in astrocytes from single nucleus RNAseq data from f, Alzheimer’s, g, Huntington’s, and h, Parkinson’s disease patient brain tissue. i-j, Representative images, and quantification of cultures exposed to the OVA257–264 peptide and then stained for MHC Class I bound to OVA257–264 (H-2Kb+OVA257–264) in red. Scale bar is 50um. Data as mean ± s.e.m, n = 3 biological replicates, p-value by paired two-sided t-test. k-l, Representative images, and quantification of astrocytes exposed to pHrodo-labelled myelin debris (orange) with cell bodies visualized using CMFDA (green). Scale bar is 50um. Data as mean ± s.e.m, n = 3 biological replicates, p-value by paired two-sided t-test. m-n, Representative images, and quantification of oligodendrocytes co-cultured with physiological or reactive astrocytes and stained for the mature oligodendrocyte marker O1 (green). Scale bar is 100um. Data as mean ± s.e.m, n = 3 biological replicates, p-value by paired two-sided t-test. o-p, Representative images of oligodendrocytes co-cultured with physiological or reactive astrocytes and stained for the mature oligodendrocyte marker MBP (red). Scale bar is 100um. Data as mean ± s.e.m, n = 3 biological replicates, p-value by paired two-sided t-test.
To validate that our astrocyte platform is suitable for exploring the biology of astrocyte reactivity, we assessed responses to multiple inflammatory insults, including the microglial-derived cytokines tumor necrosis factor (TNF), interleukin 1 alpha (IL1α), and complement component 1q (C1q)9, here after referred to as TIC cytokines, and Theiler’s murine encephalitis virus (TMEV), a model of CNS viral infection19. Collectively, we found that exposure to inflammatory insults led to robust astrocyte reactivity, as measured by expression of reactivity markers including complement component 3 (C3), guanylate-binding protein 2 (Gbp2), C1 inhibitor (Serping1), and proteasome subunit beta type-8 (Psmb8) (Fig. 1b–e; Extended Data Fig. 2a–f). At a molecular and cellular level, scRNAseq and in situ hybridization confirmed robust reactivity and a near 100% response to TIC cytokines (Fig. 1b–c, Supplementary Table 1). At a functional level, we confirmed that TIC cytokine-treated astrocyte cultures acquire features of reactive astrocytes, including cross-presentation of antigen on major histocompatibility complex (MHC) Class I20, increased secretion of proinflammatory cytokines, and decreased phagocytosis of labelled myelin debris, which corresponded with decreased expression of the phagocytic receptors Megf10 and Mertk21 (Fig. 1i–l, Extended Data Fig. 1i–j). Finally, we confirmed astrocyte pathogenicity in co-culture experiments with differentiating oligodendrocyte progenitor cells, finding that the formation of mature oligodendrocytes was reduced when co-cultured with TIC cytokine-induced reactive astrocytes compared to co-cultured with physiological astrocytes (Fig. 1m–p). These data demonstrate that astrocytes in our platform functionally transition to a pathological reactive state in response to inflammatory insults.
To show that TIC cytokine-induced reactive astrocytes resemble in vivo reactive astrocytes we next integrated our scRNAseq data with publicly available scRNAseq data from systemic bacterial lipopolysaccharide (LPS) driven neuroinflammation in mice, a widely used model of neuroinflammation. Indeed, we found that our TIC cytokine-induced reactive astrocytes and reactive astrocytes from LPS-challenged mice were specifically enriched in the same single-cell clusters and expressed shared reactive astrocyte and inflammatory transcripts (Extended Data Fig. 2g–j, Supplementary Tables 2 and 3). In addition, comparison to astrocyte transcriptional signatures from single-nuclei analysis of brain tissue from patients with Alzheimer’s disease22, Huntington’s disease23, and Parkinson’s disease24 showed that, at the molecular level, our in vitro reactive astrocytes recapitulate the reactive astrocyte states found in these human neurodegenerative diseases (Fig. 1f–h). These results show that we can successfully model an in vivo, disease relevant, pathological reactive state using our astrocyte platform.
Astrocyte reactivity results in global chromatin remodeling
Having confirmed that we could generate large numbers of functional reactive astrocytes that molecularly mirror in vivo astrocytes in human disease, we next leveraged our astrocyte platform to define the global chromatin and gene expression changes that occur as astrocytes become reactive. We first performed ATACseq in physiological and TIC cytokine-induced reactive astrocytes to identify changes to open chromatin as pathological reactive astrocytes form. We identified 80,256 total ATACseq peaks (Fig. 2a). Of those ATACseq peaks, 19,660 (24.5%) were new regions of open chromatin in TIC cytokine-induced reactive astrocytes, 9,276 (11.5%) were regions that closed as astrocytes became reactive, and the remaining 51,320 (64.0%) were open regions shared between physiological and reactive astrocytes. We found that 25.4% (492/1,938) of gained ATAC peak target genes, including C3, were significantly upregulated in pathological reactive astrocytes and involved pro-inflammatory signaling pathways including NF-κB (Fig. 2b–d, Extended Data Fig. 3a, Supplementary Tables 3 and 4). Finally, through motif analysis within gained ATAC peaks in reactive astrocytes, we identified the RelA/p65 subunit of NF-κB as the top enriched putative driver of the changing chromatin landscape in TIC cytokine-induced reactive astrocyte (Fig. 2e, Supplementary Table 5). Taken together, our ATAC-seq data suggests that as astrocytes become reactive in response to TIC cytokines, RelA/p65 acts as a pioneer factor that promotes nucleosome unraveling and makes chromatin accessible to other transcription factors.
Figure 2. Extensive chromatin remodeling during astrocyte reactivity.
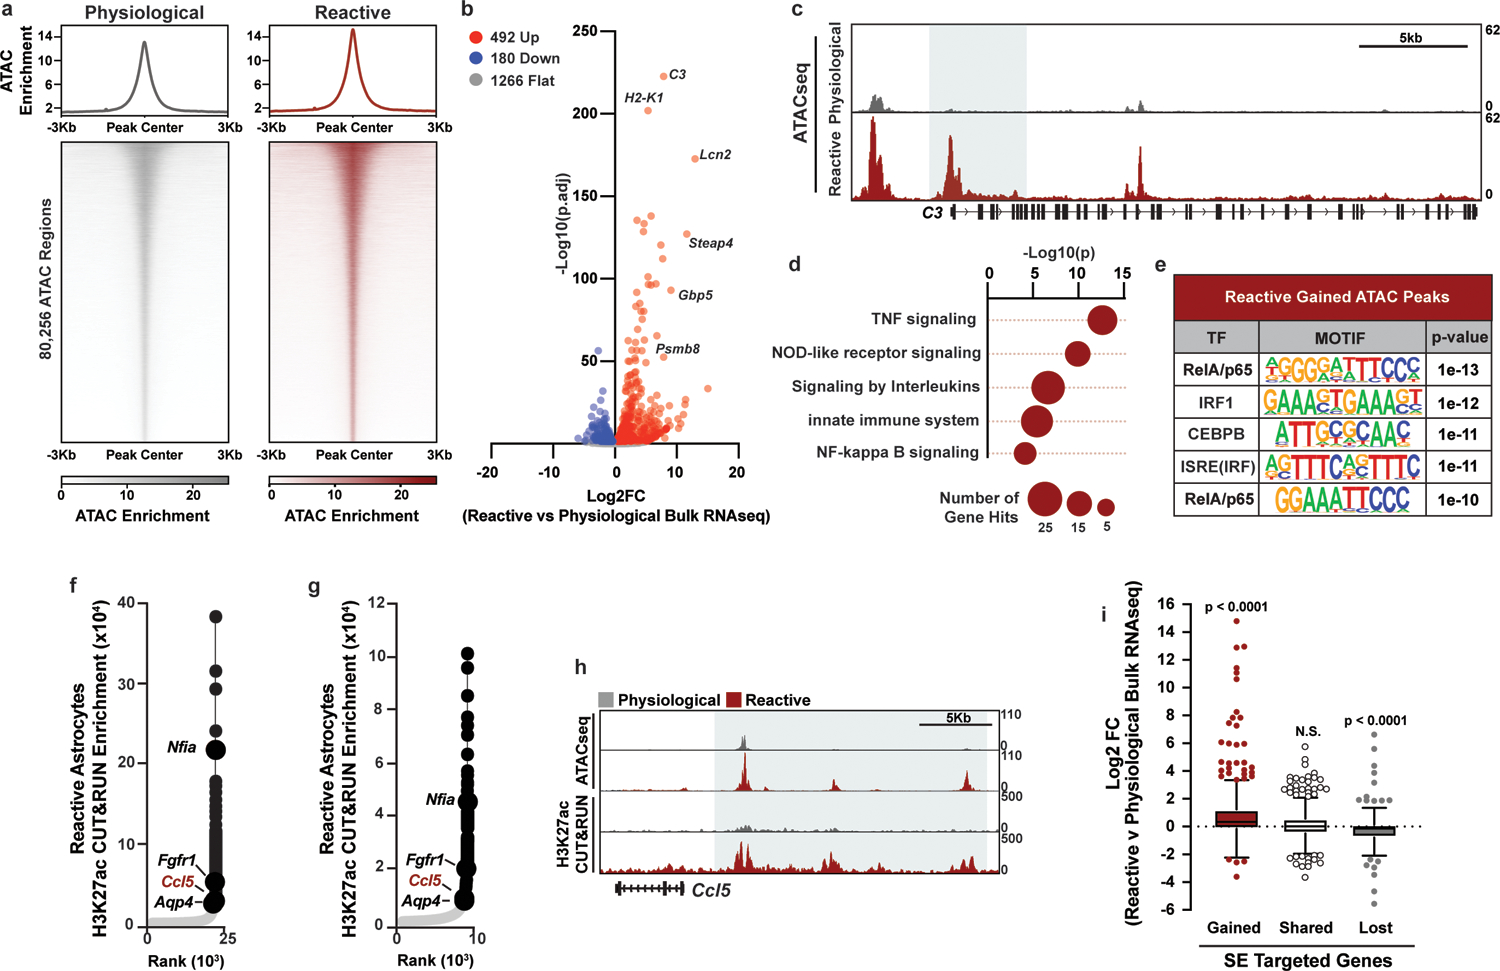
a, Aggregate heatmaps of ATAC enrichment at ATACseq peaks in physiological and reactive astrocytes. b, Bulk RNAseq volcano plot of genes with a gained ATAC peak (± 5Kb of the transcription start site (TSS)) in reactive astrocytes. Log2FC and adjusted p-values were calculated with DESeq2. c, Example track of the average ATAC signal at C3 in physiological and reactive astrocytes with a gained reactive ATAC peak shaded. d, Enriched terms from gene ontology analysis of genes targeted by a gained ATAC peak and with increased expression in reactive astrocytes. p-values generated by Benjamini-Hochberg false discovery rate. e, Transcription factor motifs enriched in gained ATAC peaks in reactive astrocytes. p-values for enriched motifs were generated by HOMER. f-g, Hockey stick plot depicting H3K27ac enrichment at enhancers (grey) and super-enhancers (black), and the nearest annotated target genes, in reactive astrocytes from two independent astrocyte isolations. Genes in black are targeted by shared super-enhancers, while Ccl5 in red is targeted by a gained super-enhancer. h, Example track of average H3K27ac CUT&RUN and ATAC signal at the gained super-enhancer target gene Ccl5 in physiological and reactive astrocytes. i, Tukey box and whisker plot showing the average Log2FC between pathological reactive and physiological astrocytes for genes targeted by gained, shared, and lost super-enhancers (SE) in pathological reactive astrocytes. Data are presented for n = 3 biological replicates. p-value is generated with a two-tailed one-sample Wilcoxon Signed Ranked test comparing to a hypothetical median of Log2FC = 0, which would designate no difference in expression between reactive and physiological astrocytes.
We next performed H3K27ac CUT&RUN25, 26, which revealed substantial chromatin remodeling in pathological reactive astrocytes in gene promoters and in super-enhancers, which are regions of densely-packed active enhancers that control gene expression and cell state27. In TIC cytokine-induced reactive astrocytes, we found that over a third (510/1,511) of the super-enhancers identified with H3K27ac CUT&RUN were distinct from those in physiological astrocytes, demonstrating a substantial shift in the enhancer landscape. Of these gained super-enhancers, 495 (97%) were in regions of already open chromatin in physiological astrocytes, revealing that astrocytes are poised to activate a reactivity gene expression program. Consistently, genes associated with gained super-enhancers in reactive astrocytes (Extended Data Fig. 3b) were significantly upregulated, including Ccl5, a proinflammatory chemokine involved in innate and adaptive immunity, as well as genes involved in RelA/p65 signaling (Fig. 2f–i, Extended Data Fig. 3c–d, Supplementary Tables 3 and 6). In contrast, expression of genes associated with shared super-enhancers remained largely unchanged between physiological and TIC cytokine induced reactive astrocytes, including astrocyte-defining lineage markers (Nfia, Fgfr1, and Aqp4)28, while expression of genes associated with lost super-enhancers decreased in reactive astrocytes (Fig. 2f–i). Similar to our findings with super-enhancer changes in TIC cytokine-induced reactive astrocytes, we also found gained, lost, and shared H3K27ac peaks in gene promoters (Extended Data Fig. 3b). As with super-enhancers, genes associated with gained H3K27ac promoter peaks were consistently upregulated and enriched for genes associated with inflammatory signaling pathways including RelA/p65 (Extended Data Fig. 3e–h). Combined, our ATACseq and H3K27ac CUT&RUN data highlight the dramatic chromatin remodeling that occurs as astrocytes transition into a reactive state and demonstrate the utility of our astrocyte platform for understanding the biology of astrocyte reactivity.
Phenotypic screen identifies small-molecules that suppress pathological reactive astrocytes
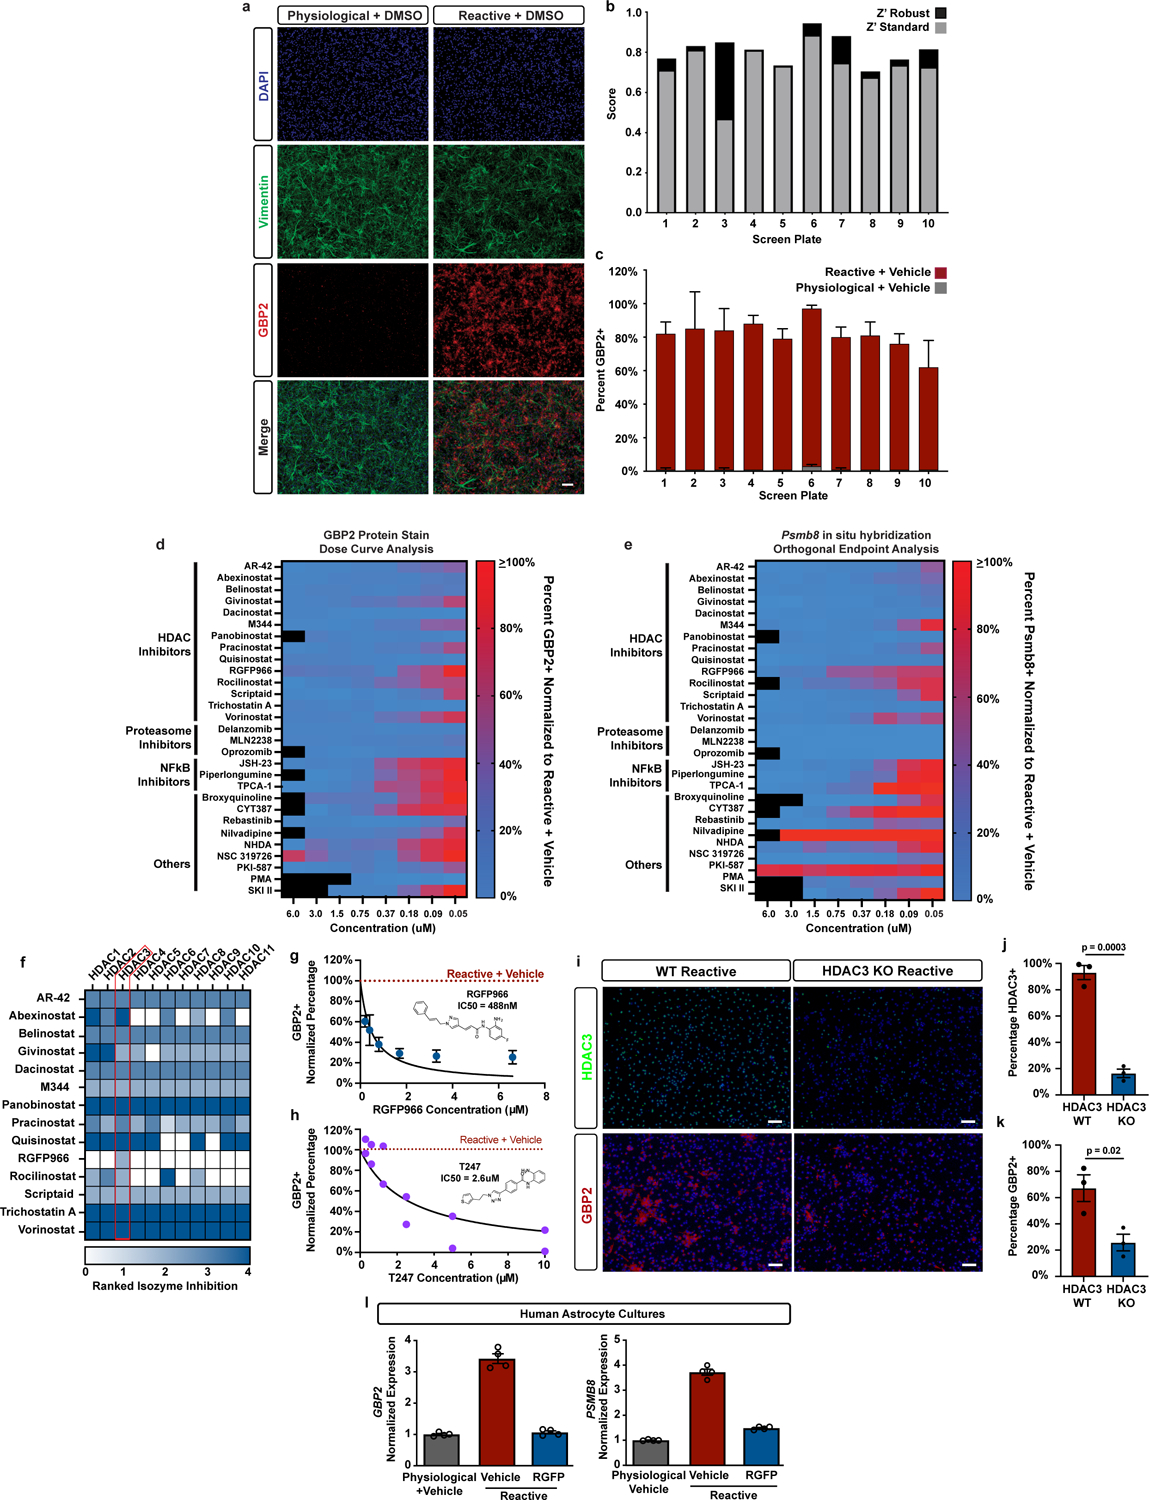
Because pathological reactive astrocytes contribute to neurodegeneration, they represent promising cellular target for therapeutics, and small molecule modulators of pathological astrocyte reactivity could have broad therapeutic potential. Thus, we leveraged our astrocyte cellular platform and the power of high-throughput phenotypic screening to identify small-molecules that suppress pathological astrocyte reactivity. To do this, we treated physiological astrocytes with 3,115 bioactive small molecules for 1 hour and then added TIC cytokines in a 384-well plate format. After 24 hours, we fixed the astrocytes and performed immunostaining for GBP2, a protein specifically upregulated in both mouse and human reactive astrocytes in disease9, 29, to measure the formation of pathological reactive astrocytes (Extended Data Fig. 4a). Across all screening plates, the assay consistently displayed a high signal-to-background ratio, demonstrating the suitability of GBP2 upregulation as a phenotypic endpoint (Extended Data Fig. 4b–c, Supplementary Table 7). Our phenotypic screen successfully identified 29 small molecules that decreased the percentage of GBP2-positive astrocytes by ≥90% compared to cultures treated with DMSO vehicle (Fig. 3a). We validated these 29 small molecules as reactive astrocyte modulators over at least three concentrations and used decreased expression of proteasome 20S subunit beta 8 (Psmb8) as a secondary marker (Extended Data Fig. 4d–e). Although validated hits covered a broad range of compound classes, they were statistically enriched for histone deacetylase (HDAC) inhibitors which accounted for 48% (14/29) of the hits (Fig. 3b–c). For the fourteen HDAC inhibitors identified in our primary screen, only HDAC3 was a shared target. In addition, RGFP966, the only HDAC3 isozyme-specific molecule, was also identified as a hit in primary screen (Extended Data Fig. 4f). RGFP966 is an HDAC3 specific inhibitor with no reported inhibition of other HDAC isozymes at up to 15μM30. This led us to focus on HDAC3 as a putative target for modulating pathological reactive astrocytes.
Figure 3. Phenotypic screen identifies HDAC3 as a regulator of pathological reactive astrocytes.
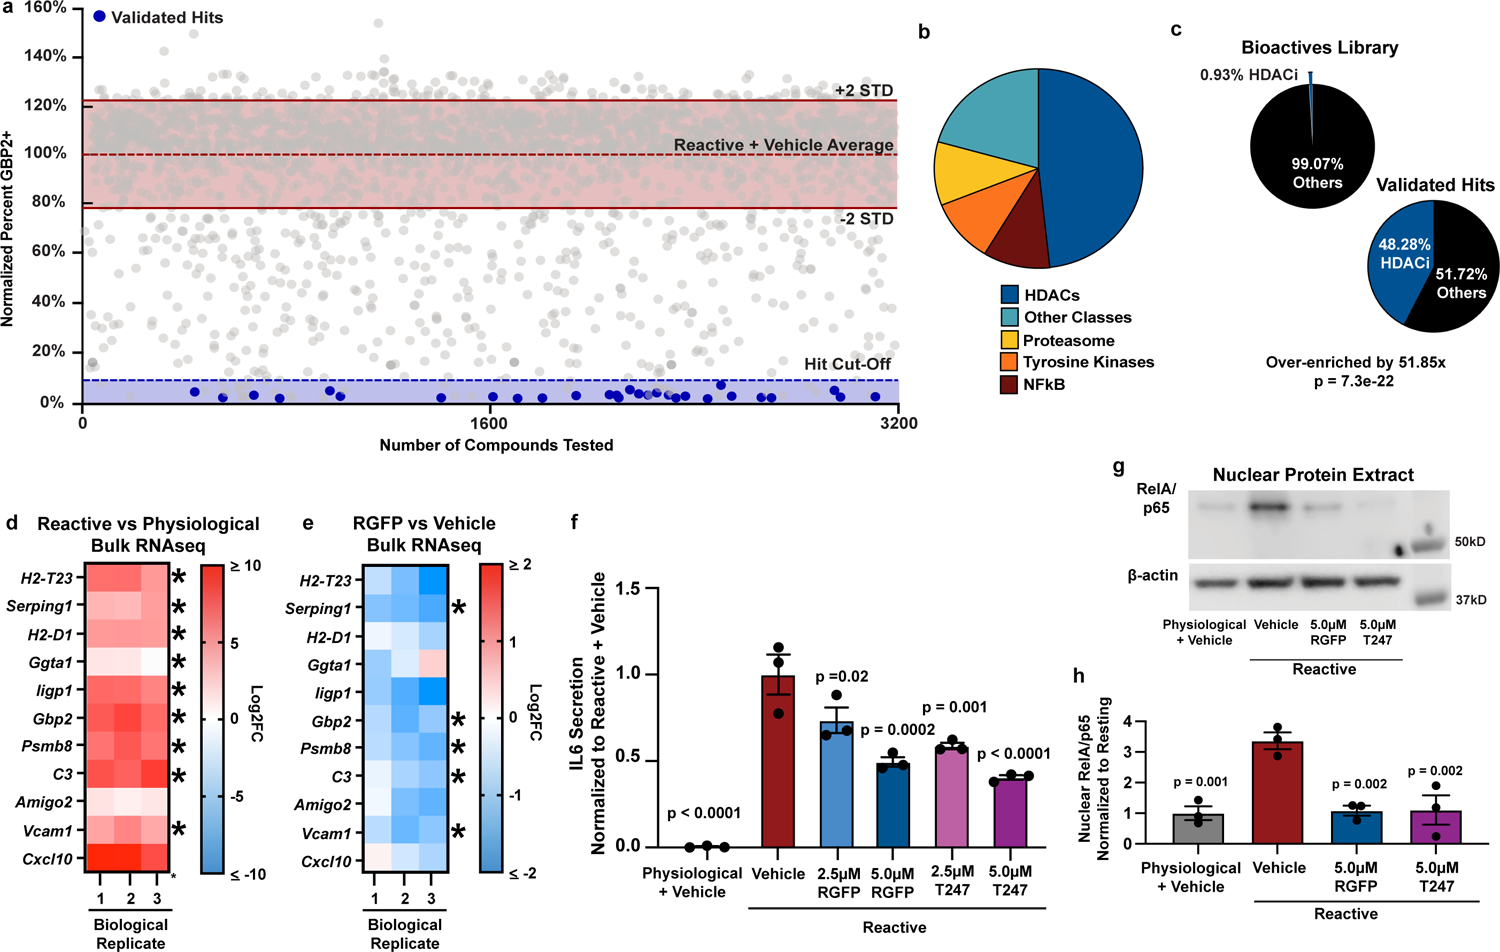
a, Scatter plot of primary screen results displayed as percent GBP2 positive, normalized to reactive astrocyte plus vehicle controls for all non-toxic chemicals. Validated hit chemicals colored in blue. The dashed blue line represents the hit cut-off at a ≥90% decrease in GBP2- positive astrocytes compared to reactive astrocyte plus vehicle controls. Dashed red line represents the average percent GBP2 positive for reactive astrocytes plus vehicle set at 100%. Solid lines represent +/− 2 standard deviations from the mean of reactive plus vehicle control wells. b, Pie chart depicting the chemical class breakdown of all 29 validated chemical hits. c, Pie charts depicting the frequency of HDAC inhibitor compounds enriched in primary screen validated hit list compared to the primary screen chemical library as a whole, showing that HDAC inhibitors are significantly enriched in the validated hit list. p-value generated by a two-tailed hypergeometric test. d-e, Heatmap of the Log2 fold-change (Log2FC) from bulk RNAseq analysis of reactive vs physiological, and RGFP966 (RGFP) vs vehicle (DMSO) treated reactive astrocytes. Red is upregulated and blue is downregulated. Data are presented as Log2FC for n = 3 biological replicates with asterisks denoting a p < 0.05 calculated by DESeq2. f, Quantification of IL6 ELISAs performed on astrocyte conditioned media. Data presented as mean ± s.e.m for an n = 3 biological replicates with significance calculated compared to reactive plus vehicle control. p-value generated by one-way ANOVA with Dunnett multiple comparison correction. g, Representative western blot image of nuclear protein extracts from physiological astrocytes, reactive astrocytes, and reactive astrocytes treated with either of the HDAC3 inhibitors RGFP966 or T247 probed for RelA/p65 and β-Actin. h, Quantification of experiments represented in g. Data are presented as mean ± s.e.m for an n = 3 biological replicates (independent astrocyte isolations). p-value generated by one-way ANOVA with Dunnett multiple comparison correction.
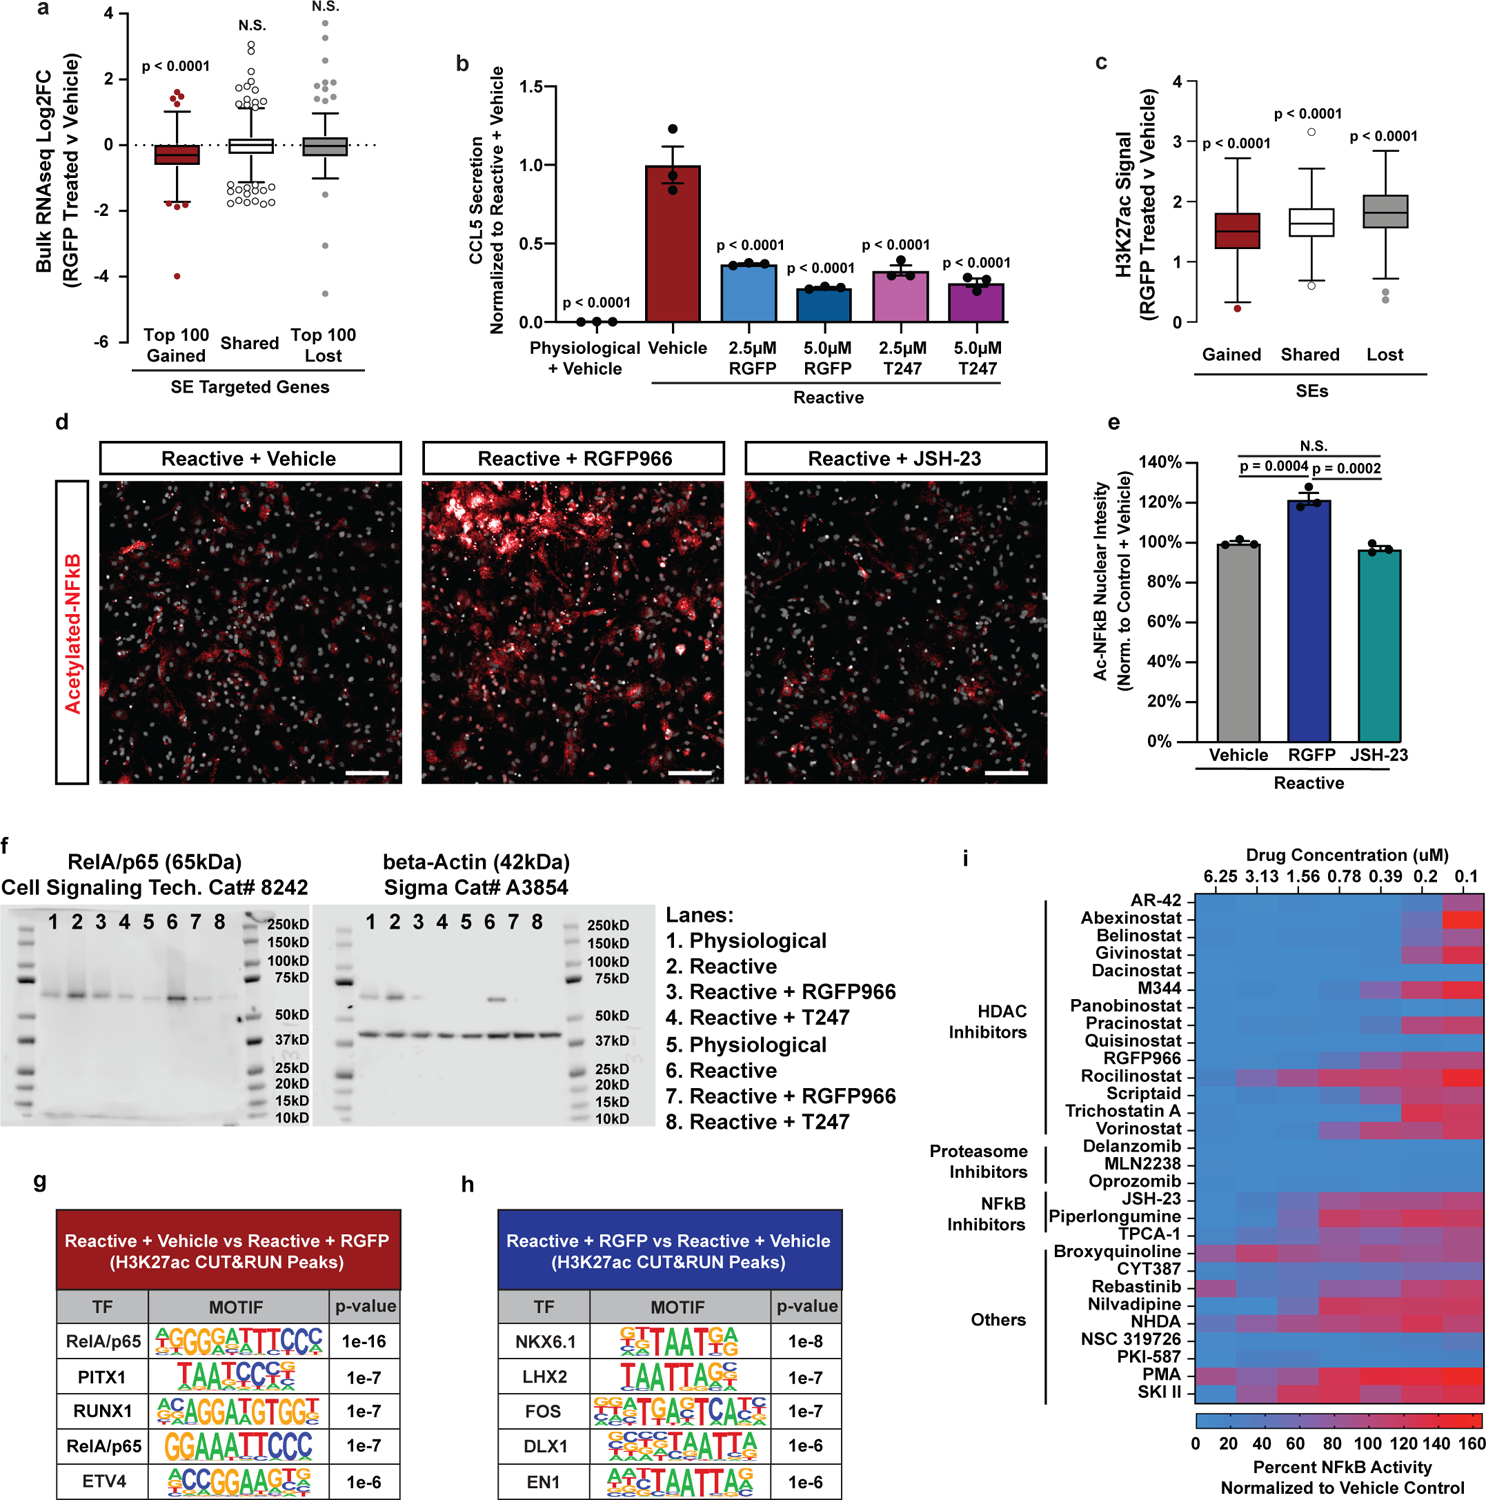
Using the additional HDAC3-specific inhibitor T24731, and genetic ablation of Hdac332, 33, we pharmacologically and genetically confirmed that HDAC3 inhibition suppresses pathological reactive astrocyte formation (Extended Data Fig. 4h–k). Inhibition of HDAC3 in human astrocyte cultures also suppressed TIC cytokine-induced astrocyte reactivity, showing that the effects of HDAC3 inhibition are conserved across species (Extended Data Fig. 4l). Through RNA sequencing, we also confirmed that RGFP966 treatment significantly downregulated expression of multiple pathological reactive astrocytes genes, demonstrating that the effects of HDAC3 inhibition were global and not limited to decreasing GBP2 (Fig. 3d–e). Pharmacological HDAC3 inhibition by RGFP966 or T247 also functionally suppressed secretion of the proinflammatory cytokine IL-6 from pathological reactive astrocytes (Fig. 3f). Together, these data show that HDAC3 is involved in regulating astrocyte reactivity and that inhibiting HDAC3 reduces pathological reactive astrocyte gene expression and function.
HDAC3 regulates pathological reactive astrocytes via RelA/p65
Histone hyperacetylation can disrupt the 3D organization of chromatin leading to decreased gene expression34. Therefore, we next asked whether suppression of pathological astrocyte reactivity by HDAC3 inhibition is mediated by histone hyperacetylation. We found that HDAC3 inhibition led to increased acetylation genome-wide, which did not correlate with gene expression changes caused by HDAC3 inhibition. For example, HDAC3 inhibition led to hyperacetylation at reactive astrocyte gained, shared, and lost super-enhancers, but only led to decreased expression of gained super-enhancer targeted genes including Ccl5 (Extended Data Fig. 5a–c). Therefore, changes in histone acetylation did not predict gene expression changes and are likely not the central mechanism by which HDAC3 inhibition suppresses reactive astrocyte gene expression and function.
Beyond histone acetylation, HDAC3 is also known to regulate non-histone proteins including transcription factors. This includes the RelA/p65 subunit of NFkB35, which is regulated by changes in acetylation36, and was the top motif enriched in new open chromatin regions in TIC cytokine-induced reactive astrocytes, and a top enriched term in gene ontology analysis of upregulated genes targeted by gained super-enhancer and gained H3K27ac peaks in reactive astrocytes (Extended Data Fig. 3c, Supplementary Table 3). Therefore, we set out to test the hypothesis that HDAC3 inhibition suppresses astrocyte reactivity by decreasing RelA/p65 signaling. Indeed, we found that HDAC3 inhibition with RGFP966 had a direct effect on RelA/p65 leading to increased levels of acetylated RelA/p65 in the nucleus of reactive astrocytes, while JSH-23, an RelA/p65 inhibitor that does not work via acetylation, had no effect (Extended Data Fig. 5d–e). Moreover, HDAC3 inhibition reduced levels of total nuclear RelA/p65 protein in reactive astrocytes relative to untreated reactive astrocytes where levels were significantly increased (Fig. 3g–h, Extended Data Fig. 5f). We also found that RelA/p65 binding sites under H3K27ac CUT&RUN peaks were enriched in reactive astrocytes treated with vehicle compared to reactive astrocytes treated with RGFP966 (Extended Data Fig. 5g–h). Finally, a striking 82.75% (24/29) of the validated hits from our primary screen, including RGFP966, significantly inhibited RelA/p65 transcriptional activity in an orthogonal reporter assay (Extended Data Fig. 5i). Collectively, these data highlight a critical role of RelA/p65 in regulating pathological astrocyte reactivity and show that multiple molecular nodes, including HDAC3, can be targeted to pharmacologically to impede RelA/p65-driven pathological astrocyte reactivity.
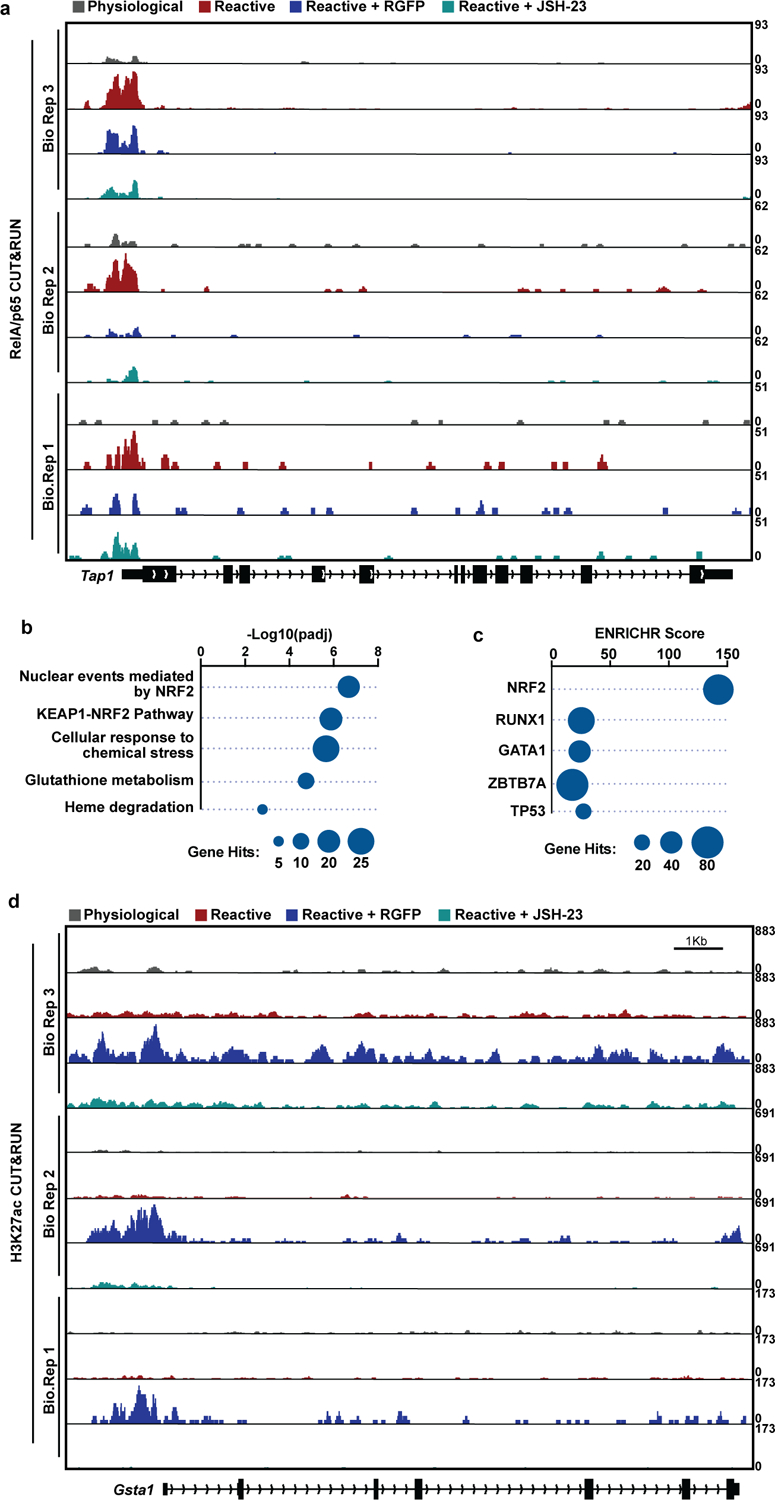
To further explore the role of RelA/p65 as a driver of pathological reactive astrocytes, we next performed RelA/p65 CUT&RUN. We found that RelA/p65 DNA binding increases significantly as astrocytes become reactive (Fig. 4a). Of the RelA/p65 DNA binding sites in reactive astrocytes 56.2% (8,729/15,520) overlapped with regions of open chromatin in physiological astrocytes while 43.8% (6,791/15,520) did not. We next identified RelA/p65 target genes as genes with a RelA/p65 peak within 5Kb of the transcription start site. Of the 1,809 RelA/p65 target genes, 30.2% (547/1,809) had increased expression in reactive astrocytes (Fig. 4b–d). To understand how HDAC3 inhibition affects RelA/p65 DNA binding, we also performed RelA/p65 CUT&RUN in reactive astrocytes treated with the HDAC3 inhibitor RGFP966, and for comparison, the RelA/p65 inhibitor JSH-2337. We found that both RGFP966 and JSH-23 decreased RelA/p65 binding and that the effect of both drugs at RelA/p65 sites was highly correlated (Fig. 4e–f). Both drugs also led to a significantly correlated decrease in the expression of RelA/p65 target genes upregulated in reactive astrocytes (Fig. 4g–h), including MHC Class I gene expression and functional antigen presentation (Fig. 4i–m, Extended Data Fig. 6a). Together, these data support that mechanistically, HDAC3 inhibition leads to decreased RelA/p65 signaling which suppresses pathological astrocyte gene expression and function.
Figure 4. HDAC3 mediates a switch between pro-inflammatory and anti-inflammatory gene expression by decreasing RelA/p65 signaling.
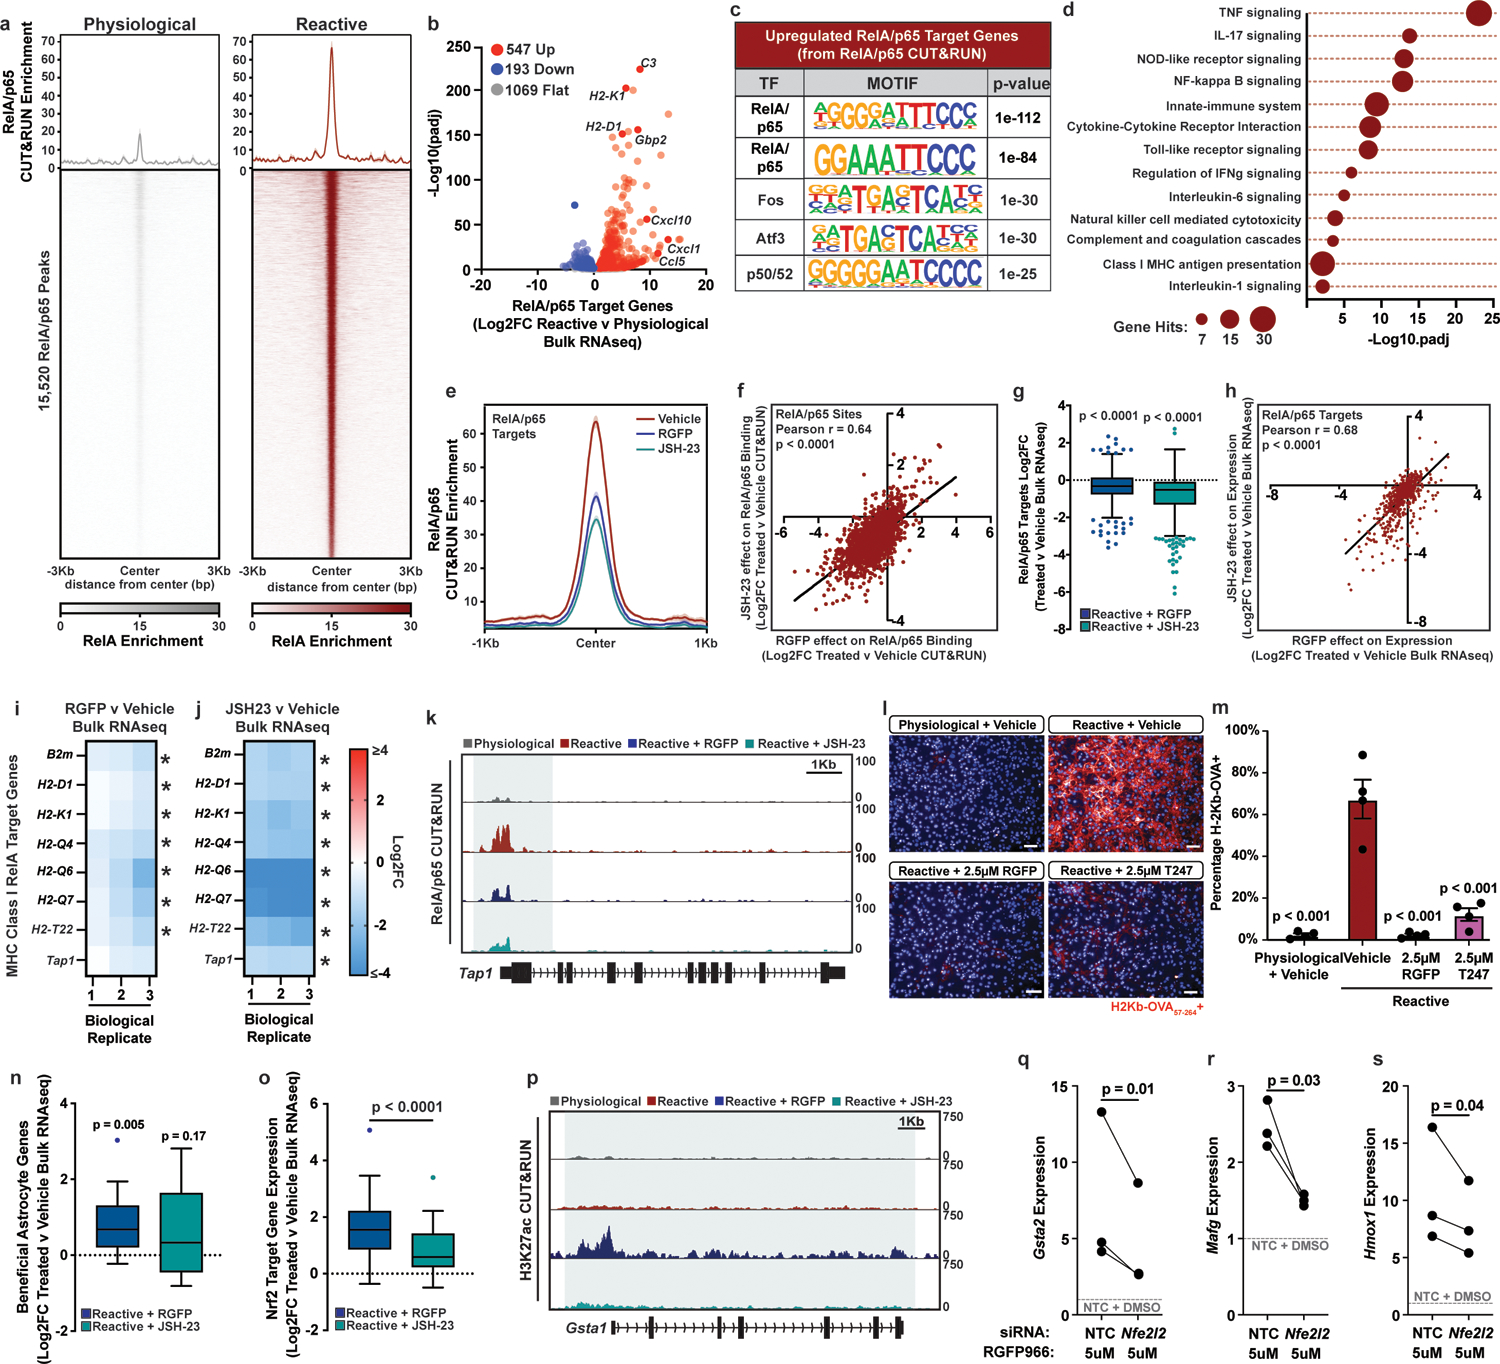
a, Aggregate profile of RelA/p65 DNA binding in physiological and reactive astrocytes. b, Bulk RNAseq volcano plot of RelA/p65 target genes. Log2FC and p-adj values were generated with DESEQ2 with an n = 3 biological replicates (independent astrocyte isolations). c, Transcription factor motifs under RelA/p65 peaks at genes upregulated in reactive astrocytes. p-values generated by HOMER. d, Gene ontology for RelA/p65 target genes significantly upregulated in reactive astrocytes. p-values generated by Benjamini-Hochberg false discovery rate. e, Aggregate profile of RelA/p65 binding at RelA/p65 target genes in reactive astrocytes plus vehicle, RGFP966, or JSH-23. f, Correlation between RGFP966 and JSH-23 effect on RelA/p65 binding at RelA/p65 targets in reactive astrocytes. r and two-tailed p-value by Pearson correlation. g, Tukey box and whisker plots depicting RGFP966 and JSH-23 effect on expression of RelA/p65 target genes upregulated in reactive astrocytes. Data are Log2FC for n = 3 biological replicates. Two-tailed p-values by one-sample Wilcoxon Signed Ranked test. h, Correlation between RGFP966 and JSH-23 effect on expression of RelA/p65 target genes that are upregulated in reactive astrocytes. r and two-tailed p-value calculated by Pearson correlation. i-j, RGFP966 and JSH-23 effect on MHC Class I genes expression in reactive astrocytes. Data are Log2FC, n = 3 biological replicates, * p < 0.05 by DESeq2. k, Example CUT&RUN track of the RelA/p65 target gene Tap1. l-m, Representative images and quantification of astrocytes exposed to the OVA257–264 peptide and stained for MHC Class I bound to OVA257–264 (H-2Kb+OVA). Scale bar is 50μm. Data are mean ± s.e.m., n = 4 biological replicates, p-values by one-way ANOVA with Dunnett correction for multiple comparisons. n-o, Tukey box and whisker plot depicting RGFP966 and JSH-23 effect on beneficial astrocyte and NRF2 target gene expression in reactive astrocytes. Data are Log2FC, n = 3 biological replicates, p-values by one-sample Wilcoxon Signed Ranked test. p, Example CUT&RUN tracks of the NRF2 target gene Gsta1. q-s, qPCR showing expression of NRF2 genes Gsta2, Mafg, and Hmox1 in physiological astrocytes treated with RGFP966 and non-targeting control (NTC) or NRF2 (Nfe2l2) siRNAs. Data are mean ± s.e.m. n = 3 biological replicates, p-value by paired two-tailed t-test.
HDAC3 inhibition promotes gene expression associated with beneficial astrocytes
In addition to decreasing pathological astrocyte gene expression, in vitro HDAC3 inhibition also led to a significant increase in genes associated with a beneficial reactive astrocyte state9. This increase in beneficial reactive astrocyte genes was not seen in reactive astrocytes treated with the RelA/p65 specific inhibitor JSH-23 (Fig. 4n). Genes induced by HDAC3 inhibition were also enriched for gene ontology terms and DNA binding motifs associated with the cytoprotective transcription factor nuclear factor erythroid 2-related factor (NRF2) (Extended Data Fig. 6b,c). In agreement, we found that HDAC3 inhibition, and to a significantly lesser degree RelA/p65 inhibition, induced cytoprotective NRF2 target genes38, and that this induction was decreased by Nrf2 siRNA treatment (Fig. 4o–s, Extended Data Fig. 6d). Astrocyte-specific genetic activation of NRF2 has been shown to protect against neurodegeneration in models of Alzheimer’s, Huntington’s, Parkinson’s, stroke, spinal cord injury, and multiple sclerosis10, 39–44. Taken together, these findings show that HDAC3 inhibition not only mitigates pathological astrocyte gene expression, but also promotes expression of genes that have been associated with beneficial reactive astrocytes.
Inhibition of HDAC3 suppresses reactive astrocytes in vivo
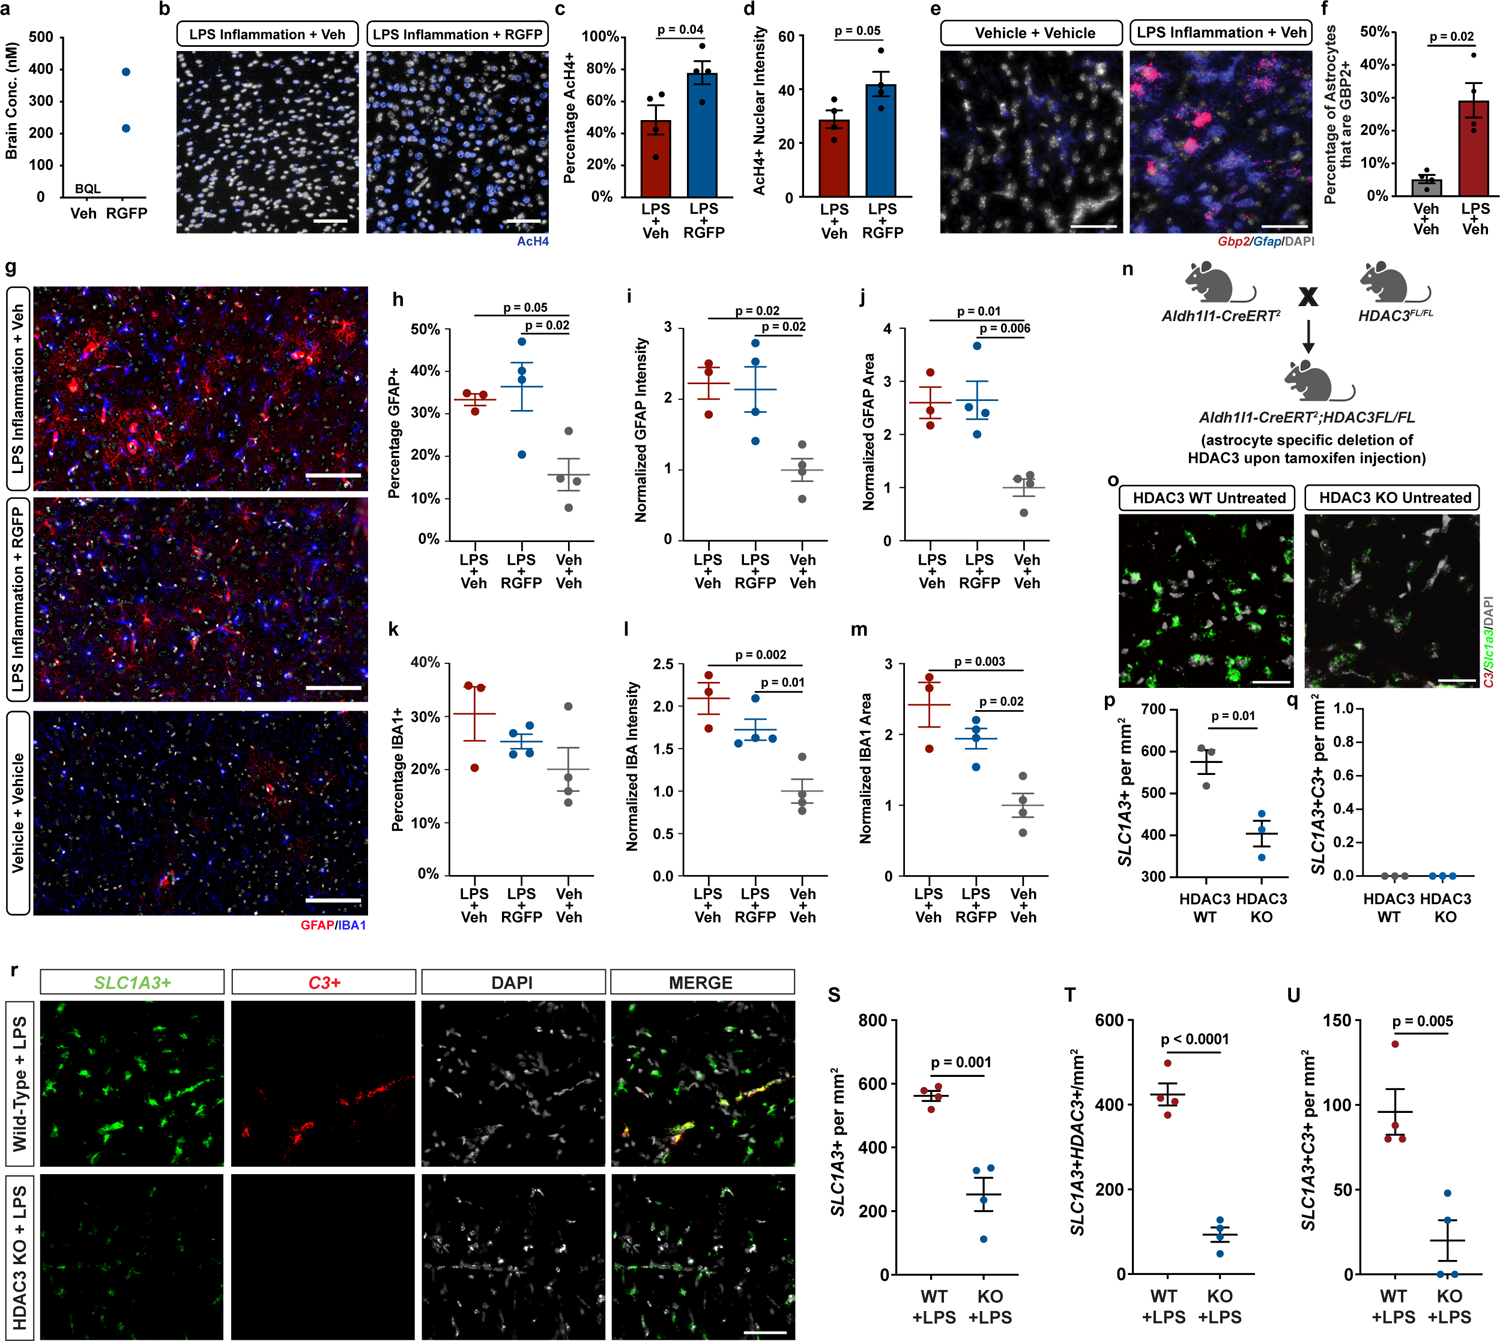
We next tested whether chemical HDAC3 inhibition could reduce pathological reactive astrocytes in vivo. We confirmed that daily intraperitoneal (i.p.) dosing of 10mg/kg RGFP966 achieved brain concentrations consistent with previously established and published pharmacokinetic analyses of RGFP966 in mice, including reaching concentrations in brain tissue above what is required to inhibit astrocyte reactivity (Extended Data Fig. 7a)30, 45. We also confirmed that daily i.p. dosing of 10mg/kg RGFP966 led to an increase in acetylated histone 4 (AcH4) levels in the brain, demonstrating a pharmacodynamic effect to inhibit the histone deacetylase activity of HDAC3 (Extended Data Fig. 7b–d). We then used a well-established model of systemic LPS injection46, 47 to test whether HDAC3 inhibition with RGFP966 could reduce astrocyte reactivity in the context of neuroinflammation. We first confirmed that LPS injection leads to increased formation of Gbp2-positive reactive astrocytes (Extended Data Fig. 7e–f). We next compared to vehicle treated LPS-exposed mice with LPS-exposed mice treated with 10mg/kg RGFP966 and found that HDAC3 inhibition by RGFP966 treatment decreased the formation of Gbp2-positive pathological reactive astrocytes in LPS-exposed mice (Fig. 5a–d, Extended Data Fig. 7e–f). Importantly, treatment with 10mg/kg RGFP966 had no effect on general astrocyte reactivity as assessed by GFAP immunostaining and had no effect on generalized microgliosis as measured with IBA-1 immunostaining (Extended Data Fig. 7g–m). To confirm that HDAC3 inhibition specifically in astrocytes is sufficient to suppress generation of pathological reactive astrocytes, we generated Aldh1l1-CreERT;HDAC3 floxed mice to genetically ablate HDAC3 in astrocytes32, 33. Astrocyte specific knockout of HDAC3 alone did not induce astrocyte reactivity (Extended Data Fig 7o–q). Following LPS exposure, we detected a lower density of C3 positive pathological reactive astrocytes in HDAC3 knockout mice compared to wild-type controls (Extended Data Fig. 7r–u). Complete genetic loss of HDAC3 in astrocytes resulted in a decrease in total astrocyte numbers that may be due to death of astrocytes completely lacking HDAC3, or due to decreased proliferation of HDAC3 knockout reactive astrocytes (Extended Data Fig. 7r–s). These experiments demonstrate that genetic and pharmacological HDAC3 inhibition can specifically decrease the formation of pathological reactive astrocyte state in vivo.
Figure. 5. HDAC3 inhibition blocks reactive astrocyte formation in vivo and promotes neuroprotection.
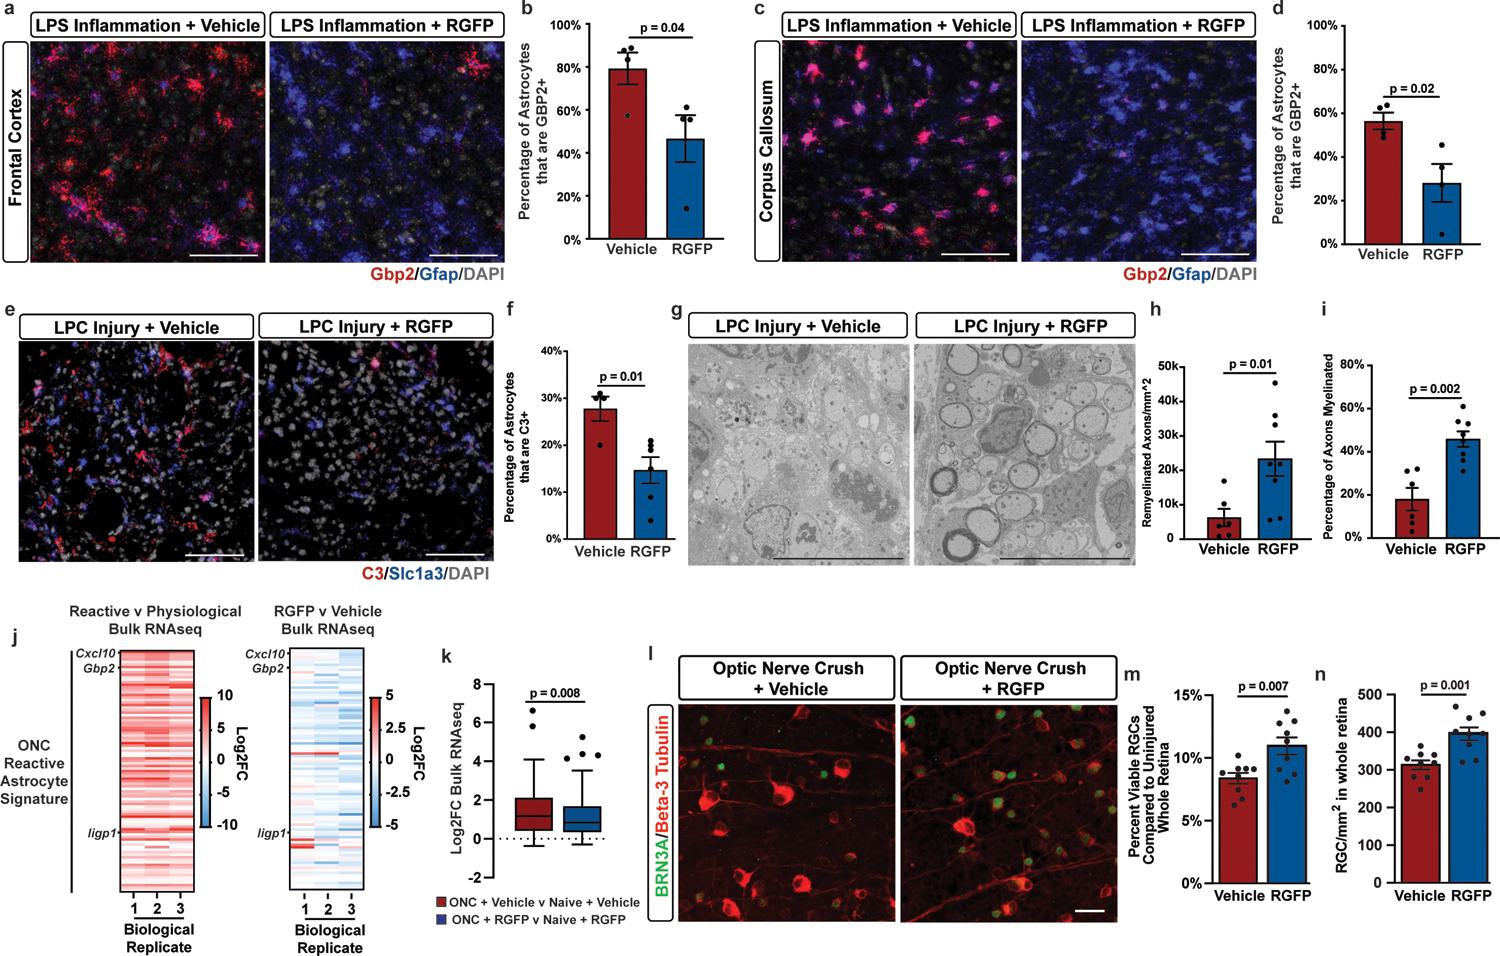
a-d, Representative images and quantification of Gbp2 and Gfap in situ hybridization from the frontal cortex or corpus callosum of LPS exposed mice treated with vehicle or 10mg/kg RGFP. Scale bar is 100um. Data presented as mean ± s.e.m for n = 4 mice with p-value generated by unpaired two-tailed t-test. e-f, Representative images and quantification of the reactive astrocyte marker C3 and pan-astrocyte marker Slc1a3 in situ hybridization in the dorsal column of LPC lesioned mice at 12 days post lesion and treated with vehicle or 10mg/kg RGFP. Scale bar is 50um. Data are presented as the mean ± s.e.m for n = 4 or 6 mice. p-value generated by unpaired two-tailed t-test. g-i, Representative electron microscopy (EM) images and quantification of remyelinated axon density and percentage. Scale bar is 10um. Data is presented as mean ± s.e.m. for n = 6 or 8 mice with p-values generated by unpaired two tailed t-test. j, Heatmaps depicting Log2FC of a previously identified set of 100 reactive astrocyte genes in single-cell RNAseq analysis of ONC retina. k, Tukey box and whisker plot depicting the Log2FC of ONC reactive astrocyte genes in ONC versus naïve retina from mice treated with vehicle or 10mg/kg RGFP966. n = 7 mice with p-value generated by a paired two-tailed t-test. l-n, Representative images and quantification of RGCs stained with BRN3A and Beta-3 Tubulin in the retina from ONC mice treated with vehicle or 10mg/kg RGFP966. Scale bar is 20um. Data is presented as mean ± s.e.m for n = 9 or 10 mice per group with p-values generated by unpaired two-tailed t-test.
Inhibition of HDAC3 promotes neuroprotection in vivo
To examine whether chemical suppression of pathological astrocyte reactivity is neuroprotective, we assessed HDAC3 inhibition in two different models of neural injury. First, we used a toxin-based model of CNS tissue damage in which lysolecithin (lysophosphatidylcholine; LPC) is injected into the dorsal column of the spinal cord, resulting in astrogliosis, demyelination, and loss of oligodendrocytes and axons. We first confirmed that LPC induced injury led to increased C3+ astrocyte reactivity in the dorsal spinal column (Extended Data Fig. 8a–b). We next asked whether pharmacological inhibition of HDAC suppresses astrocyte reactivity following LPC induced injury. To do this we performed a two-arm efficacy study, similar to previously published preclinical efficacy studies of HDAC inhibitors48–52, by comparing LPC injured mice plus vehicle to LPC injured mice plus RGFP966. Indeed, we found that treatment with the brain penetrant HDAC3 inhibitor RGFP966 led to a significantly lower percentage of C3-positive reactive astrocytes in mice injected with toxic LPC compared to mice treated with vehicle (Fig. 5e–f). This reduced astrocyte reactivity occurred without a significant effect on astrogliosis assessed by GFAP immunostaining, microgliosis assessed by IBA-1 immunostaining, and microglial polarization assessed by CD86 and CD206 immunostaining (Extended Data Fig. 8c–i). We next utilized electron microscopy to assess myelin and axonal pathology following LPC induced injury. We found that HDAC3 inhibition with RGFP966 resulted in significantly increased density and percentage of myelinated axons compared to vehicle-treated LPC mice (Fig. 5g–i).
We next examined the effect of pathological reactive astrocyte suppression in the optic nerve crush model of injury-induced neurodegeneration. In this model, optic nerve crush leads to loss of retinal ganglion cells, the hallmark of glaucoma53, a neurodegenerative process driven in part by pathological reactive astrocytes4, 9, 54. We first confirmed that ONC led to increased expression of reactive astrocyte genes (Gfap, Gbp2, H2–D1) in the retina and that HDAC3 inhibition with RGFP966 decreased the expression of genes upregulated by ONC (Extended Data Figure 9a–c, Supplementary Table 9). Moreover, we found that a previously identified signature of astrocyte reactivity in ONC was decreased by RGFP966 treatment, both in our in vitro reactive astrocyte cultures, and in vivo following ONC (Fig. 5j–k). Importantly, RGFP966 treatment had no effect on the expression of these ONC reactive astrocyte genes in naïve retinas that did not experience ONC (Extended Data Figure 9d). Finally, we tested whether inhibition of HDAC3 would provide significant protection to retinal ganglion cells after optic nerve crush. Indeed, we demonstrate that pharmacological inhibition of HDAC3 with RGFP966 resulted in a significant increase in retinal ganglion cell survival after ONC, while having no effect on retinal ganglion cell numbers in naïve retinas (Fig 5l–n, Extended Data Figure 9e–f). The magnitude of this protective effect was similar to the reported effects of latanoprost, a prostaglandin analog currently used to treat patients with glaucoma55. Together, these data show that inhibition of HDAC3 suppressed pathological astrocyte reactivity and promoted neuroprotection following in vivo tissue damage in two animal neuroinjury models.
Discussion
Here, we developed a platform that enables the generation of highly pure cultures of functional astrocytes that transition into a disease relevant pathological reactive state in response to inflammatory stimuli. Using this platform, we demonstrated that pathological astrocyte reactivity involves a global reorganization of the chromatin landscape driven in part by RelA/p65 and performed a phenotypic chemical screen that identified HDAC3 as a functional regulator of cytokine-induced pathological reactive astrocyte formation. HDAC3 inhibition in reactive astrocytes suppresses RelA/p65 proinflammatory gene programs and increases expression of protective astrocyte-associated genes downstream of NRF2. We further confirm that pharmacological and genetic inhibition of HDAC3 decreases the formation of pathological reactive astrocytes in an in vivo model of neuroinflammation, indicating that therapies that target HDAC3 may be protective in neurodegenerative disease. We support this by showing, in two distinct neuroinjury models, that pharmacological inhibition of HDAC3 decreases formation of pathological reactive astrocytes and promotes neural protection. Taken together, our work lays a foundation for identification of additional molecules that can modulate pathological astrocyte reactivity, provides a deeper understanding of pathological reactive astrocyte formation, and supports the development of reactive astrocyte-targeted therapies for neurodegenerative diseases.
Methods
Mouse studies
Mice were housed under a temperature-controlled environment, 12 h:12 h light:dark cycle with ad libitum access to water and rodent chow. Primary cell isolation and LPS studies were performed at Case Western Reserve University. LPC studies were performed at George Washington University Medical Center. ONC studies were performed at Ohio State University Wexner Medical Center. All animal procedures were in accordance with the National Institutes of Health Guidelines for the Care and Use of Laboratory Animals and were approved by the Animal Care and Use Committees of Case Western Reserve University, George Washington University, or Ohio State University.
Isolation and generation of physiological astrocytes
Timed-pregnant C57BL/6N mice were purchased from Charles River (Wilmington, MA). Brains were extracted from both male and female postnatal day 2–2 (P3) pups, meninges removed, and cotices isolate which were then dissociated according to manufacturer’s instructions using a Tumor Dissociation Kit (Miltenyi, 130-095-929). Cells were then plated on poly-L-ornithine (Sigma Aldrich, P3655) and laminin (Sigma Aldrich, L2020) coated flasks and cultured for 24 hours in media consisting of Dulbecco’s Modified Eagle Medium/Nutrient Mixture F-12 (DMEM/F-12; ThermoFisher 11320033), N-2 MAX Supplement (ThermoFisher, 17502048), B-27 Supplement (ThermoFisher, 17504044), GlutaMAX Supplement (ThermoFisher, 35050079), Penicillin-Streptomycin (ThermoFisher, 15070063), and 20ng/mL FGF-2. After 24 hours media was to astrocyte enrichment media, comprised of 1:1 DMEM (ThermoFisher, 11960044) and Neurobasal Medium (ThermoFisher, 21103049) supplemented with GlutaMAX (ThermoFisher, 35050061), Sodium Pyruvate (ThermoFisher, 11360070), N-2 MAX Supplement (R&D, AR009), 5ug/ml N-acetyl cysteine (Sigma Aldrich, A8199), Penicillin-Streptomycin (ThermoFisher, 15070–063), 5 ng/mL HB-EGF (R&D Systems, 259-HE-050), 10 ng/mL CNTF (R&D Systems, 557-NT-010), 10 ng/mL BMP4 (R&D Systems, 314-BP-050), and 20 ng/mL FGF2 (R&D Systems, 233-FB-01M). Media was changed every 48 hours. Once confluent, astrocytes were either cryopreserved or passaged once and then cryopreserved. To conduct experiments, cryopreserved astrocytes were thawed in astrocyte maturation media (1:1 DMEM and Neurobasal Medium with GlutaMAX Supplement, Sodium Pyruvate, N-2 MAX Supplement, N-acetyl cysteine supplemented with 5 ng/mL HB-EGF, 10 ng/mL CNTF, 50 ng/mL BMP4, and 20 ng/mL FGF-2) for 48 hours, followed by astrocyte maintenance media (1:1 DMEM and Neurobasal Medium with 5ng/mL HB-EGF) for another 72 hours then used for experiments. Unless noted, primary astrocyte experiments used astrocytes generated by this protocol.
To drive astrocytes towards a pathological reactive state cells were treated for 24hrs with 3 ng/mL IL1α (Sigma Aldrich, I3901), 400 ng/mL C1q (MyBioSource, MBS143105 or MBS147305), and 30 ng/mL TNF (R&D Systems, 210-TA-020)9.
Single-cell RNAseq sample preparation and analysis
Astrocytes were lifted from culture plates using TrypLE (ThermoFisher, 12563011), collected in PBS with 1% bovine serum albumin (BSA), spun down at 190 × g for 10 minutes, washed once with PBS with 1% BSA, and then filtered through 40um FlowMi Strainers (VWR, 10032–802). Cells were loaded onto the Chromium 10x Controller for partitioning into single-cells according to manufacturer’s instructions. Then reverse-transcription and library preparation were performed according to 10x Single Cell 3’ v2 chemistry kit instructions. Libraries were sequenced by the Case Western Reserve University Genomics Core on an Illumina HiSeq2500 with paired-end reads and a target sequence depth of 50,000 reads per cell. Sequence data were processed by 10x Cell Ranger v3.1 using default settings to remove empty droplets, remove droplets containing multiple cells, and generate a gene expression matrix. Downstream analysis was performed with the R package, Seurat v4.012. UMI count matrices of single-cell RNA-seq data Hasel et al.56 were downloaded from GEO (GSE148611). Integration with publicly available single-cell RNAseq data from LPS treated mice was performed using SCTransform integration57 (nfeatures = 1000 features, 50 k.achors = 50) within the R package, Seurat v4.0.
Glutamate uptake assay
Glutamate uptake assays were performed as previously described58. Briefly, astrocytes were incubated for 30 minutes in Hank’s balanced salt solution (HBSS) buffer without calcium, magnesium, and phenol red (ThermoFisher #14175095). Then incubated for three hours with 100 μM glutamate in HBSS with calcium and magnesium without phenol red (ThermoFisher #14025092). Identical volumes of 100μM glutamate in HBSS with calcium and magnesium without phenol red were incubated in empty cell-free wells for determining the percentage of glutamate uptake. Samples of medium were collected after three hours and analyzed with a glutamate assay kit (Abcam #AB138883) according to manufacturer’s instructions using colorimetric measurements from a Synergy Neo2 (BioTek) plate reader.
ViewRNA in situ hybridization (ISH) in vitro
In situ hybridization of cultured cells was performed with ThermoFisher ViewRNA according to manufacturer’s instructions (ThermoFisher #QVC0001). Briefly, cells were fixed, permeabilized, then hybridized with probes for 2hrs at 40°C. Probe signal was then amplified, imaged using the PerkinElmer Operetta CLS High-Content Analysis System, and analyzed in PerkinElmer Columbus Image Analysis software. Probes for C3 (ThermoFisher, VB4–3112231-VC) and Serping1 (ThermoFisher, VB4–3114232-VC) RNA were used.
Myelin uptake assay
Myelin debris was isolated as previously described59 and labelled with pHrodo (ThermoFisher Cat# P36600) according to manufacturer’s instructions. Astrocytes were plated and driven towards a reactive state with TNF, IL1α, and C1q as described above. After 48 hours 1mg/mL of labelled myelin debris was added and incubated for 24hrs. After incubation with labelled myelin debris cell bodies were visualized with 5-chloromethylfluorescein diacetate (CMFDA) (ThermoFisher Cat#C2925) and nuclei were visualized with Hoechst33342 (ThermoFisher Cat#H1399). Cells were live imaged using the PerkinElmer Operetta CLS High-Content Analysis System (PerkinElmer Operetta) and analyzed using automated scripts in PerkinElmer Columbus Image Analysis software (Perkin Elmer Columbus).
Astrocyte and oligodendrocyte co-cultures
Induced pluripotent-stem cell derived oligodendrocyte progenitor cells were derived and cultured as previous described60. Astrocytes were plated and driven towards a reactive state with TNF, IL1α, and C1q as described above. After 24 hours of cytokine treatment, astrocytes were washed with oligodendrocyte base media, then oligodendrocyte progenitor cells were plated onto astrocytes and allowed to differentiation for 48hrs in oligodendrocyte media consisting of DMEM/F12 (ThermoFisher, 11320033) supplemented with N2 Max, B27, 100ng/mL noggin (R&D, 3344NG050), 100ng/mL IGF-1 (R&D, 291G1200), 10uM cyclic AMP (Sigma, D0260–100MG), 10ng/mL NT3 (R&D, 267N3025) and 40ng/mL T3 (Thyroid hormone, Sigma, T-6397). After 48 hours of differentiation, cells were fixed and stained for O1 (Cleveland Clinic Hybridoma Core Facility) and MBP (R&D Systems #MAB42282), imaged using the PerkinElmer Operetta, and analyzed with PerkinElmer Columbus.
Enzyme-linked immunosorbent assay (ELISA) and cytokine profiling
Secreted cytokine levels in media conditioned by astrocytes for 24hrs were measured by ELISA and cytokine profiling arrays. ELISA assays were performed according to the manufacturer’s instructions for CCL5 (R&D Systems, DY478–05) and IL6 (DY406–05). Relative CCL5 and IL6 concentrations were calculated based on absorbance measured on a Synergy Neo2 (BioTek) plate reader. Secreted cytokines were measured using the Proteome Profiler Array Mouse XL Cytokine Array Kit (R&D Systems, ARY028) according to manufacturer’s instructions.
OVA257–264 peptide antigen presentation assay
Mouse astrocytes were treated with reactive astrocyte driving cytokines with or without the HDAC3 specific inhibitors, RGFP966 or T247. After 24 hours of treatment, cells were fed OVA257–264 peptide (GenScript RP10611 or Sigma Aldrich S7951) for 12 hours, then live-stained for two hours for OVA257–264 peptide antigen bound to H-2Kb of MHC class I (BioLegend, 141605). Cells were then fixed with 4% paraformaldehyde (PFA), imaged using the PerkinElmer Operetta, and analyzed with PerkinElmer Columbus.
Gene ontology, transcription factor enrichment, and gene set enrichment analysis (GSEA)
Gene ontology analysis was performed using gProfiler (https://biit.cs.ut.ee/gprofiler/gost)24 on ranked gene lists with a Benjamini-Hochberg false discovery rate (FDR) significance threshold set at < 0.05 against a custom background of all genes expressed in astrocytes from our bulk RNAseq data. Analysis for enrichment of transcription factors targeting gene lists was performed using ENRICHR61–63 (https://maayanlab.cloud/Enrichr/). GSEA scores were generated for curated gene sets from publicly-available data. GSEA was run using classical scoring, 1000 gene-set permutations, and signal-to-noise metrics. Normalized enrichment scores (NES) and FDR were calculated by the GSEA software64 (https://www.gsea-msigdb.org/gsea/index.jsp).
Theiler’s murine encephalomyelitis virus (TMEV) generation and infection
Baby hamster kidney cells (BHK-21) were maintained in Dulbecco’s Modified Eagle’s Medium (Life Sciences) supplemented with 10% fetal calf serum (Atlanta Biologicals), 100 IU penicillin/mL, and 100μg streptomycin/mL (Life Sciences). The DA strain of TMEV was produced using a linearized cDNA clone, pTMDA, as described65. Briefly, in vitro-transcribed viral RNA was transfected into BHK-21 cells and virus collected by repeated freeze thaw and centrifugation, followed by titration in triplicate by standard plaque assay in BHK-21 cells. Astrocytes were infected in astrocyte maintenance medium at a multiplicity of infection of 10. Then, 48 hours after infection, these cells were fixed and stained, or collected for RNA as described below.
Astrocyte Bulk RNAseq sample preparation and analysis
Total RNA was extracted using the same procedure as described for qPCR and sent to Novogene for mRNA Sequencing. For gene expression analysis, reads were mapped to the mm10 genome using kallisto v0.46.1 (https://pachterlab.github.io/kallisto/)13. Transcripts were summarized to genes with tximport v1.2 (https://bioconductor.org/packages/release/bioc/html/tximport.html)14. Normalized expression and differential gene expression were then generated using DESeq2 v1.32.0 (https://bioconductor.org/packages/release/bioc/html/DESeq2.html)15.
Omni Assay for Transposase-Accessible Chromatin using sequencing (ATAC-seq)
Omni ATAC-Seq was performed on 50,000 physiological and reactive astrocytes following protocol outlined in Corces et al.22 In brief, nuclei were extracted and treated with transposition mixture containing Nextera Tn5 Transposase for (Illumina, FC-121–1030). Transposed fragments were then purified using QIAGEN MinElute columns (QIAGEN, 28004), PCR amplified, and libraries were purified with PCRClean DX (Aline Biosciences, C-1003–5) with a sample to bead ratio of 1:1.2. Final libraries were sequenced on the Illumina NovaSeq with paired-end 50bp reads with 100 million reads per sample. Reads were quality and adaptor trimmed using cutadapt v2.9. Trimmed reads were aligned to the mm10 genome using BWA v0.7.15-r1140, sorted and indexed using samtools v1.15.1, and peaks called while ignoring duplicates using GENRICH v0.5 in ATACseq mode.
H3K27ac and RelA/p65 CUT&RUN
CUT&RUN was performed on fresh or frozen nuclei using the CUTANA™ ChIC/CUT&RUN kit (EpiCypher Cat#: 14–1048) according to manufacturer’s instructions. Briefly, 500,000 nuclei per sample were bound to activated ConA Beads then incubated overnight with primary antibody (1:100 RelA/p65 Cell Signaling Cat #: 8242, 0.5ug IgG EpiCypher Cat#: 14–1048, and 0.5ug either H3K27ac EpiCypher Cat #: 13–0045 or H3K27ac Abcam Cat #: AB4729). Nuclei were permeabilized then pAG-MNase added. The reaction was terminated and E. coli SpikeIn DNA added. DNA was purified and stored at −20C prior to library preparation. Libraries were prepared using the NEBNext® Ultra™ II DNA Library Prep Kit for Illumina (NEB Cat # E7645) according to manufacturer’s instructions, with modifications recommended by Epicypher CUT&RUN Kit Manual Version 2. Libraries were sequenced on the Illumina NovaSeq with paired-end 150bp or 75bp reads and nearly 10 million reads per sample.
Sequencing data was processed and analyzed using CUT&RUNTools2.066, then reads were quality and adaptor trimmed using Trimmomatic Version 0.36, then aligned to mm10 and the spike in genome with Bowtie2 version 2.3.217. Duplicate reads (potential PCR artifacts) were removed using Picard MarkDuplicates v3.1.1. For RelA/p65, fragments less than 120bp were filtered using SAMtools. Peaks were called with MACS version 2.1.11, visualized with the Integrative Genomics Viewer (IGV, Broad Institute) and compared and contrasted using bedtools implemented in R using the BedtoolsR package (http://phanstiel-lab.med.unc.edu/bedtoolsr.html). Peaks were assigned to the nearest gene using the R packages ChIPSeeker67, ChIPpeakanno68, and GenomicRanges69. RelA/p65 target genes were defined as genes with a RelA/p65 peak 5Kb up- or downstream of the transcription start site. Super-enhancers were called using rank ordering of super-enhancers (ROSE) analysis package26. Super-enhancers and genes targeted by super-enhancers were generated for the H3K27ac biological replicate with the strongest signal and key findings confirmed with a second biological replicate.
Motif enrichment analysis
Motifs were called under using HOMERv4.11.170. The findMotifsGenome.pl tool was used with mm10 as the reference genome.
Primary screen and secondary dose response screen
Liquid handling was performed using a BioTek EL406 Washer Dispenser. Astrocytes were plated onto 384-well plates at a density of 600–700 cells/mm2. A Perkin Elmer Janus G3 Varispan Automated Workstation was used to treat cells with one chemical per well at 2μM, followed one hour later by 3 ng/mL IL1α (Sigma Aldrich I3901), 400 ng/mL C1q (MyBioSource MBS143105 or MBS147305), and 30 ng/mL TNF (R&D Systems 210-TA-020). After 24 hours, cells were fixed using 4% PFA and stained for GBP2 (1:500, Proteintech 11854–1-AP) using the procedure in the immunocytochemistry section below, imaged using the PerkinElmer Operetta, and analyzed using automated PerkinElmer Columbus. Chemicals that decreased live cell number by >30% compared to reactive astrocyte plus DMSO vehicle control were considered toxic. Hits were determined as chemicals that decreased the percentage of GBP2-positive astrocytes by ≥ 90% compared to reactive astrocyte plus DMSO vehicle.
Secondary dose curve assays were performed exactly as described for the primary screen except with custom generated dose curve plates containing the following drug concentrations: 6μM, 3μM, 1.5μM, 0.75μM, 0.37μM, 0.18μM, 0.09μM, and 0.05μM.
Z-Score Calculation
Z-scores are standard measures of drug screen quality. To calculate the Z’ standard where σ = standard deviation and μ = mean of either the positive or negative control wells:
To calculate Z’ Robust where (mad) = mean absolute deviation and x̃ = median of either the positive or negative control wells:
Generation of Hdac3 knockout astrocytes
To generate Hdac3 knockout astrocytes cells were isolated from Aldh1l1-CreERT2;Hdac3fl/fl mice, that were generated by crossing Aldh1l1-CreERT2 (Jax #031008)32 and Hdac3fl/fl (Jax #024119)33 mice. Aldh1l1-CreERT2;Hdac3fl/fl astrocytes were thawed and matured as described above then treated with 1μM tamoxifen (Selleck, S7827) for three days followed by four to five days to allow for recombination. Cells were treated with TNFa, IL1α, and C1q as described, 24 hours later fixed, stained, imaged, and analyzed as described in the immunocytochemistry section.
Human astrocyte generation
Human induced pluripotent stem cells (iPSCs) used in this study (healthy male line CWRU14579) were generated from peripheral blood mononuclear cells obtained under informed consent (Johns Hopkins IRB approval number IRB00068613) and transferred to Case Western Reserve University under a material transfer agreement. Human iPSCs were differentiated into astrocytes as previously described71. Briefly, iPSC colonies were placed in a neural induction medium for seven to ten days until neural rosettes could be picked, dissociated, and plated in a glial expansion medium. These cells were allowed to proliferate and become a homogenous population of glial progenitor cells (GPCs) over eight passages on poly-L-ornithine and laminin-coated plates. These GPCs were then passaged onto a Matrigel-coated plate and cultured in astrocyte induction media for two weeks, followed for another four weeks in astrocyte maturation medium.
Real-time polymerase chain reaction (qPCR)
Cells were lysed in TRIzol and total RNA was extracted with phenol-chloroform followed by spin columns from the RNEasy Mini Kit (Qiagen, 74104). RNA quality and quantity was determined using a NanoDrop spectrophotometer. The RNA was then reverse transcribed using the iScript cDNA synthesis kit (BioRad, 1708891) according to the manufacturer’s instructions. Real-time qPCR was performed using the Taqman Gene Expression Master Mix (Applied Biosystems, 4369016) and the Taqman assay probes for human: GBP2 (ThermoFisher Assay ID: Hs00894837_m1) and PSMB8 (ThermoFisher Assay ID: Hs00544758_m1).
NF-κB Jurkat reporter assay
Jurkat NF-κB reporter cells were purchased from BPS Bioscience (60651). Cells were grown in RPMI 1640 with 10% FBS, 1x Pen/Strep, and 1mg/mL Geneticin (ThermoFisher, 10131027. Cells were exposed to drugs or DMSO vehicle for one hour before the addition of 3 ng/mL IL-1a (Sigma Aldrich, I3901), 400 ng/mL C1q (MyBioSource, MBS143105), and 30 ng/mL TNF (R&D Systems, 210-TA-020). Cells were incubated for 24hrs, then luciferase activity was measured using the One-Step Luciferase Assay System (BPS Bioscience, 60690–1) and a Synergy Neo2 plate reader (BioTek).
siRNA knockdown
Physiological astrocytes were transfected with either non-targeting control (NTC) siRNA or Nfe2l2 (NRF2) targeting siRNA (Horizon Discovery, M-040766-01-0005) using Lipofectamine 3000 (ThermoFisher, L3000008). Two days after transfection cells were treated with 5uM RGFP966 for 24hrs and then lysed to collect RNA.
Immunocytochemistry
Cells were fixed with ice-cold 4% PFA for 15 minutes at room temperature, washed three times with PBS, blocked and permeabilized with 10% donkey serum and 0.1% Triton X-100 in PBS for one hour, and stained with primary antibodies overnight, washed three times with PBS, and incubated for one hour at room temperature with Alexa fluor secondary antibodies and DAPI. Stained cells were imaged using the PerkinElmer Operetta analyzed using PerkinElmer Columbus. Primary antibodies used were GBP2 (1:500, ProteinTech, 11854–1-AP), Vimentin (1:1000, BioLegend, 919101), AQP4 (1:100, Sigma Aldrich, HPA014784), GLT-1 (1:100, Novus Biologicals, NBP1–20136), ALDH1L1 (1:100, Novus Biologicals, NBP2–50045), HDAC3 (1:100, BioLegend, 685202), dsRNA (1:500, Millipore, MABE1134), and Acetyl-p65 K310 (1:100, Cell Signaling, 3045).
Lipopolysaccharide (LPS) model of neuroinflammation
C57BL/6N mice were purchased from Charles River (Wilmington, MA). Male and female mice at 7-weeks of age were injected i.p. with either RGFP966 vehicle (30% hydroxypropyl-b-cyclodextrin, 0.1M sodium acetate, and 10% DMSO) or 10mg/kg RGFP966 (Selleck Chemical, Cat #: S7229) daily for 11 days. Subsequently, mice were injected i.p. daily for two days with either LPS vehicle (saline) plus RGFP966 vehicle, 5mg/kg LPS plus RGFP966 vehicle, or 5mg/kg LPS plus 10mg/kg RGFP966. Animals were sacrificed and processed for immunohistochemistry.
Generation of astrocyte specific HDAC3 knockout mice in vivo
To generate astrocyte specific Hdac3 knockout mice (Aldh1l1-CreERT2;Hdac3fl/fl), Aldh1l1-CreERT2 (Jax #031008)32 were crossed with Hdac3fl/fl (Jax #024119)33 mice. To induce Cre expression mice between seven and ten weeks old were treated with 75mg/kg tamoxifen, or corn-oil vehicle, daily by i.p. for 7 days. Mice were left untreated for 48 hours prior to LPS injection as described above.
Lysolecithin (LPC) injection model of focal tissue damage
Focal tissue damage in the spinal cord was induced by the injection of 1% LPC solution. 10–12-week-old C57BL/6J female mice were obtained from The Jackson Laboratory and were anesthetized using isoflurane and a T10 laminectomy was performed. 1μL of 1% LPC was infused into the dorsal column at a rate of 15 mL/hour. The animals were euthanized at day twelve after the laminectomy. Animals received either RGFP966 vehicle or 10mg/kg RGFP966 daily by i.p. injections that began one day prior to LPC injection and ended 11 days after LPC injection. Experiments were terminated twelve days after LPC injection and tissue was then processed for immunohistochemistry or electron microscopy.
Optic nerve crush (ONC) surgery
Adult male or female C57BL/6J mice (aged 8–10 weeks) were purchased from The Jackson Laboratory and were anesthetized with 100 mg/kg body weight ketamine and 10 mg/kg xylazine i.p. The optic nerves were exposed through an incision in the conjunctiva while being visualized under a Nikon microscope. The right nerve was then compressed, ~1–2 mm behind the eye, for five seconds using a curved self-closing forceps (Dumont no. 5; Roboz). As a control the left nerve was only surgically exposed, but not crushed. The eyes were then rinsed with a few drops of sterile PBS. Ophthalmic ointment (Puralube; Fera Pharmaceuticals) was applied on the operated eyes. For all surgical procedures, buprenorphine (0.1 mg/kg, subcutaneous) was given before and after surgery (12, 24, 36, 48 and 60 h). All operated mice were closely monitored until the endpoint. Either seven days, for bulk RNA sequencing analysis, or two weeks after surgery, for retinal ganglion cell quantification, mice were given a lethal dose of ketamine/xylazine i.p. and then perfused transcardially with PBS for 5 min.
ONC Retina BulkRNAseq sample preparation and analysis
Retina from crushed and naive eyes were isolated and homogenized in RLT buffer prior to Qiagen RNeasy RNA purification according to manufacturer’s instructions. RNA was then sent to Novogene for mRNA Sequencing. For gene expression analysis, reads were mapped to the mm10 genome using kallisto v0.46.1 (https://pachterlab.github.io/kallisto/)13. Transcripts were summarized to the gene level with tximport v1.2 (https://bioconductor.org/packages/release/bioc/html/tximport.html)14. Normalized expression and differential gene expression were then generated using DESeq2 v1.32.0 (https://bioconductor.org/packages/release/bioc/html/DESeq2.html)15.
Immunohistochemistry and quantification of retinal whole mount viable retinal ganglion cells (RGCs)
Eyes were removed from the mice and placed in 4% PFA for one hour followed by a five-minute wash in PBS. PFA-fixed retinas were placed in a 35-mm dish (Corning) with sterile PBS. The retinal neural layer was dissected out of the globe under a dissecting microscope. Each retina was placed in a well of a 96 well flat bottom plate for immunohistochemistry. Retinas were permeabilized in 3% Triton X-100 in PBS for one hour at room temperature followed by three one-hour PBS washes. Retinas were blocked with 5% normal goat serum and 1% Triton X in PBS (blocking buffer) for two hours. Retinas were then incubated with Brn3a (1ug/ml, Synaptic Systems, 411–003) and Beta-3 tubulin (Promega, G712A) in blocking buffer (1ug/ml, Synaptic Systems) for three days at 4°C, followed by 3 one-hour PBS washes at room temperature. Retinas were incubated with Alexa Fluor 488-conjugated goat anti-rabbit secondary antibody in blocking buffer (2ug/ml, Invitrogen) for 24 hours at 4°C. Retinas were washed for one hour 3 times, placed on Superfrost Plus microscope slides and imaged. Images were acquired using an Olympus IX83 inverted microscope attached to a Hamamatsu C11440 digital camera at 40x. Brn3a+Beta-3 tubulin+ RGCs were counted using Imaris v9.8 over eight fields distributed between four quadrants per retina.
Pharmacokinetics
C57BL/6 adult mice were injected i.p. with 10mg/kg RGFP966 daily for 11 days. Four hours after the last dose, mice were then perfused with saline to remove blood from the brain. Brain tissue was then collected and snap frozen. Brain tissues were thawed at room temperature and homogenized in PBS. Calibration standards and study samples were extracted with 3x volume of acetonitrile containing 0.1% formic acid with 200 ng/ml internal standard solution. Samples were then each vortexed for 1 minute, then transferred to an Eppendorf R5417R and centrifuged at 21,000 × g for 7 minutes. Following extraction of tissue, homogenate calibrators and study samples were transferred directly to an autosampler microtiter plate for analysis. Samples were analyzed by LC-MS-MS in the positive ion electrospray ionization mode.
Immunohistochemistry for LPS
Mice were perfused with PBS followed by 4% PFA, after which brains were extracted and cryopreserved in 30% sucrose, then frozen in OCT and sectioned. To stain, slides were washed with PBS and then incubated overnight with primary antibody. After primary incubation, slides were then washed and labeled with Alexa Fluor secondary antibodies (ThermoFisher). Images were captured on a Hamamatsu Nanozoomer S60 Digital slide scanner with NDPview 2.0 software. Image analysis was performed using automated scripts with Perkin Elmer Columbus Image Analysis Software or by a blinded investigator with ImageJ. Primary antibodies used were AcH4 (1:100, EMD Millipore, 06–866), GFAP (1:1000, DAKO, Z0334), and IBA-1 (1:250, Abcam, 685202).
Western Blotting
Protein samples were collected in RIPA buffer (Sigma Aldrich, R0278) with Halt Protease and Phosphatase Inhibitor (ThermoFisher, 78441). Nuclear protein extracts were generated using the NE-PER Nuclear and Cytoplasmic Extraction Reagents (ThermoFisher Cat #: 78833) according to manufacturer’s instructions. Protein concentration was determined by BCA assay (ThermoFisher, 23225). Equal amounts of total protein were loaded onto 4–12% Bis-Tris gels (Invitrogen). Proteins were then separated by gel-electrophoresis and transferred to PVDF membranes (ThermoFisher, LC2002). Blots were probed with RelA/p65 (1:250, Cell Signaling Technology, 8242) and beta-Actin (1:5000, Sigma Aldrich, A3854), developed using SuperSignal West Pico Plus Chemiluminescent Substrate (ThermoFisher, 34577), and visualized using a Li-Cor Odyssey XF Imager.
In situ hybridization with RNAscope
In situ hybridization for in vivo studies was performed using RNAscope Multiplex Fluorescence V2 Assay (ACD Bio, 323136) according to manufacturer’s instructions for fixed frozen samples. Briefly, tissue was dehydrated, dried, blocked with hydrogen peroxide, followed by antigen retrieval for 5 minutes, dried again, and then incubated with provided Protease III. RNA-Targeting probes purchased from ACD Bio were then annealed at 40°C for 2 hours followed by washing and a series of amplification steps before finally tagging the RNA with Opal Dye fluorophores (Perkin Elmer). In situ hybridization Images were captured on a Hamamatsu Nanozoomer S60 Digital Slide scanner with NDPview 2.0 software or a Leica DMi8 microscope and analyzed with automated scripts with Perkin Elmer Columbus by a blinded investigator with ImageJ. The following mouse specific RNAscope probes were used: Slc1a3 (ACD Bio, 430781), Gbp2 (ACD Bio, 572491), Gfap (ACD Bio, 313211), and C3 (ACD Bio, 417841).
Electron microscopy sample preparation and analysis
Mice were perfused with 4% PFA, 2% gluteraldehyde, and 0.1 M sodium cacodylate. Spinal cords were extracted, and samples were osmicated, stained en bloc with uranyl acetate and embedded in EMbed 812, an EPON-812 substitute (Electron Microscopy Sciences, 14900). Thin sections were cut, carbon-coated and imaged on a Helios NanoLab 660 Scanning Electron Microscope (FEI).
Statistical analysis
Unless otherwise noted, GraphPad Prism was used to perform statistical analyses. Outliers were statistically defined using Grubbs’ test with alph = 0.05, or ROUT with Q = 2%, in GraphPad Prism 9. Unless otherwise noted in the figure legend, a two-tailed t-test was used to compare the mean of two groups, while a one-way ANOVA with Dunnett post-test for multiple comparisons was used to compare the mean between three or more groups. Unless otherwise noted, sample sizes were determined by reference to previous literature. Unless otherwise noted data distribution was assumed to be normal but was not formally tested. For all Tukey box-and-whisker plots, the middle line of the box is the median, the box extends from the 25th to 75th percentile, the upper whisker is placed at the 75th percentile plus 1.5x the inter-quartile distance, the lower whisker is placed at the 25th percentile minus 1.5x the inter-quartile distance, and any individual data points that fall outside of the upper and lower whiskers are plotted. For in vivo studies mice were randomly assigned to experimental groups and analysis was performed by blinded investigators or by automated scripts with the Perkin Elmer Columbus Image Analysis Software.
Extended Data
Extended Data Figure 1. Purity and function of astrocyte cultures.
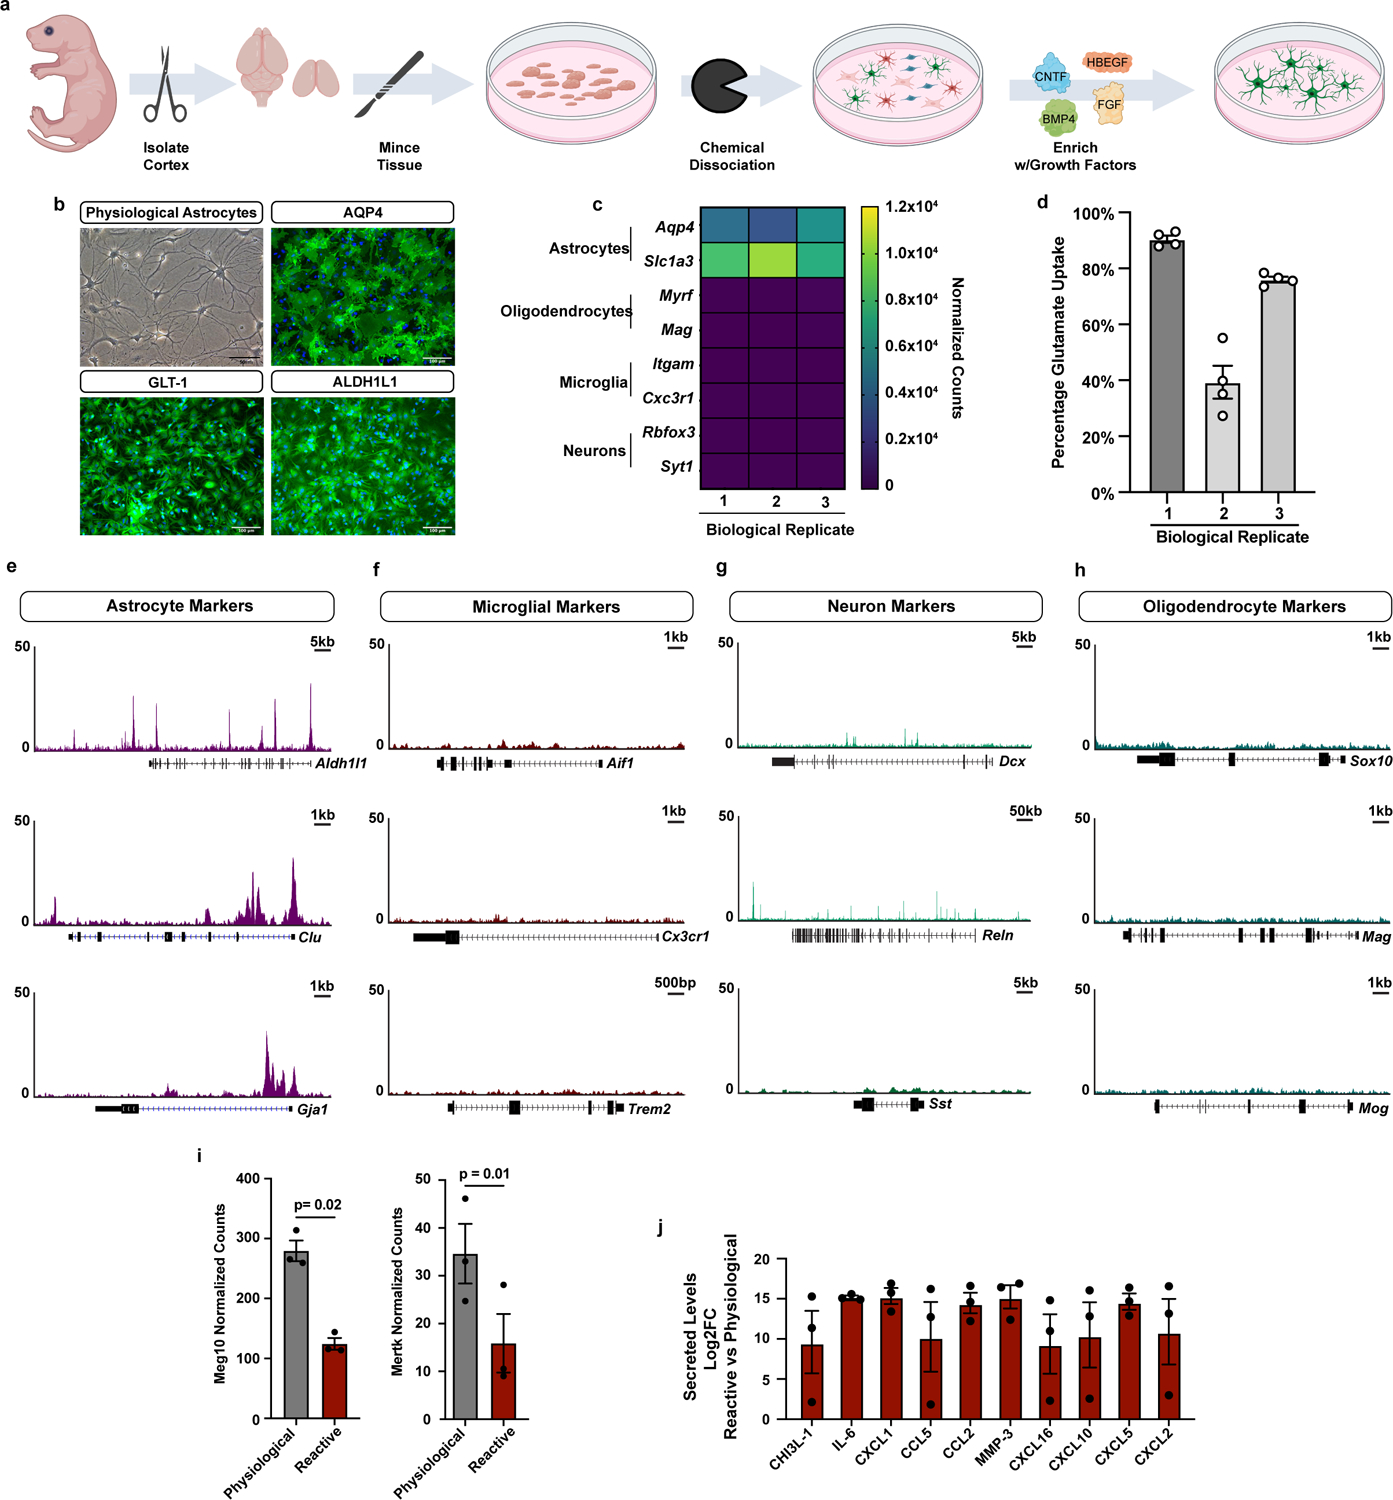
a, Overview diagram of astrocyte isolation and enrichment protocol (images generated by BioRender). b, Phase contrast image showing prototypical astrocyte morphology from a single astrocyte culture. Scale bar is 50um. Immunofluorescence images showing expression of canonical astrocyte markers AQP4, GLT-1 (SLC1A2), and ALDH1L1 in a single astrocyte culture. Scale bar is 100um. c, Bulk RNAseq data showing high expression of astrocyte marker genes and no expression of marker genes for other CNS cell types. Data are from 3 biological replicates (independent astrocyte isolations). d, Glutamate uptake by physiological astrocytes in culture. Data presented as the mean ± s.e.m. for technical replicates (open circles) from 3 biological replicates (independent astrocyte isolations).e-h, ATACseq tracks at marker genes for CNS cell types. Chromatin is only open at astrocyte genes. i, Bulk RNAseq data showing decreased expression of Meg10 and Mertk in agreement with decreased phagocytosis of myelin debris by reactive astrocytes. Data presented as mean ± s.e.m. for n = 3 biological replicates. p-value generated by paired two-tailed t-test. j, The Log2 fold-change (Log2FC) of secreted cytokines in reactive vs physiological astrocytes conditioned media. Data presented as mean ± s.e.m for n = 3 biological replicates.
Extended Data Figure 2. In vitro reactive astrocytes correspond to in vivo counterparts.
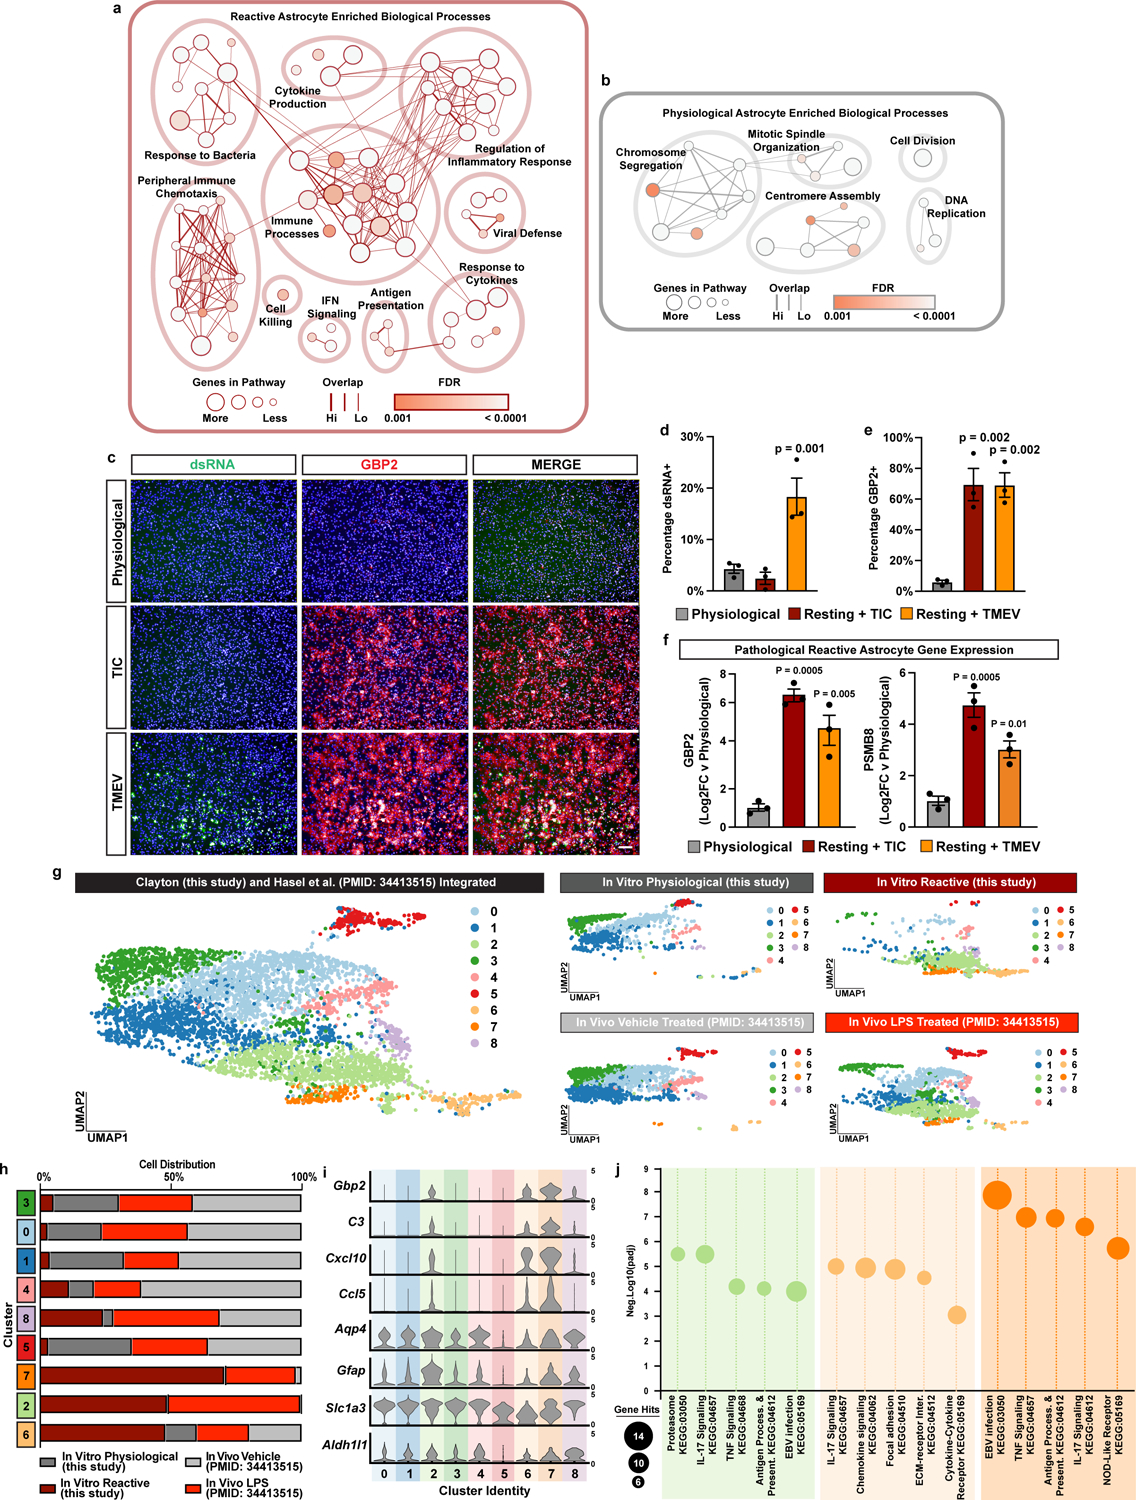
a, Enrichment map of gene ontology terms for genes upregulated in reactive vs physiological astrocytes. b, Enrichment map of gene ontology terms for genes upregulated in physiological vs reactive astrocytes. c, Representative images of physiological astrocytes, astrocytes exposed to TIC cytokines, and astrocytes infected with TMEV and stained for double stranded RNA to show viral infection (dsRNA in green) and GBP2 (red). d, Quantification of the percentage of astrocytes that are positive for the viral marker dsRNA. Data presented as mean ± s.e.m for n = 3 biological replicates, with p-value calculated by a one-way ANOVA. e, Quantification of the percentage of astrocytes that are GBP2 positive. Data presented as mean ± s.e.m for n = 3 biological replicates, with p-value calculated by a one-way ANOVA with Dunnett correction for multiple comparisons. f, Quantitative PCR results comparing the expression of pathological reactive astrocyte markers Gbp2 and Psmb8 by physiological astrocytes, astrocytes exposed to TIC cytokines, and astrocytes infected with TMEV. p-value calculated by one-way ANOVA with Dunnett correction for multiple comparisons. g, UMAP plots from integrated single-cell RNAseq analysis of in vitro physiological and reactive astrocytes from this study with in vivo astrocytes from LPS or vehicle treated mice56. h, Frequency of cells distributed across different astrocyte clusters. i, Expression of pathological reactive astrocyte genes and astrocyte marker genes in each single-cell cluster. j, Gene ontology results showing enriched terms for genes enriched in cluster 2, 6, and 7 that contain mainly astrocytes from reactive cultures and LPS treated mice. p-values generated by Benjamini-Hochberg false discovery rate.
Extended Data Figure 3. Epigenomics of astrocyte reactivity.
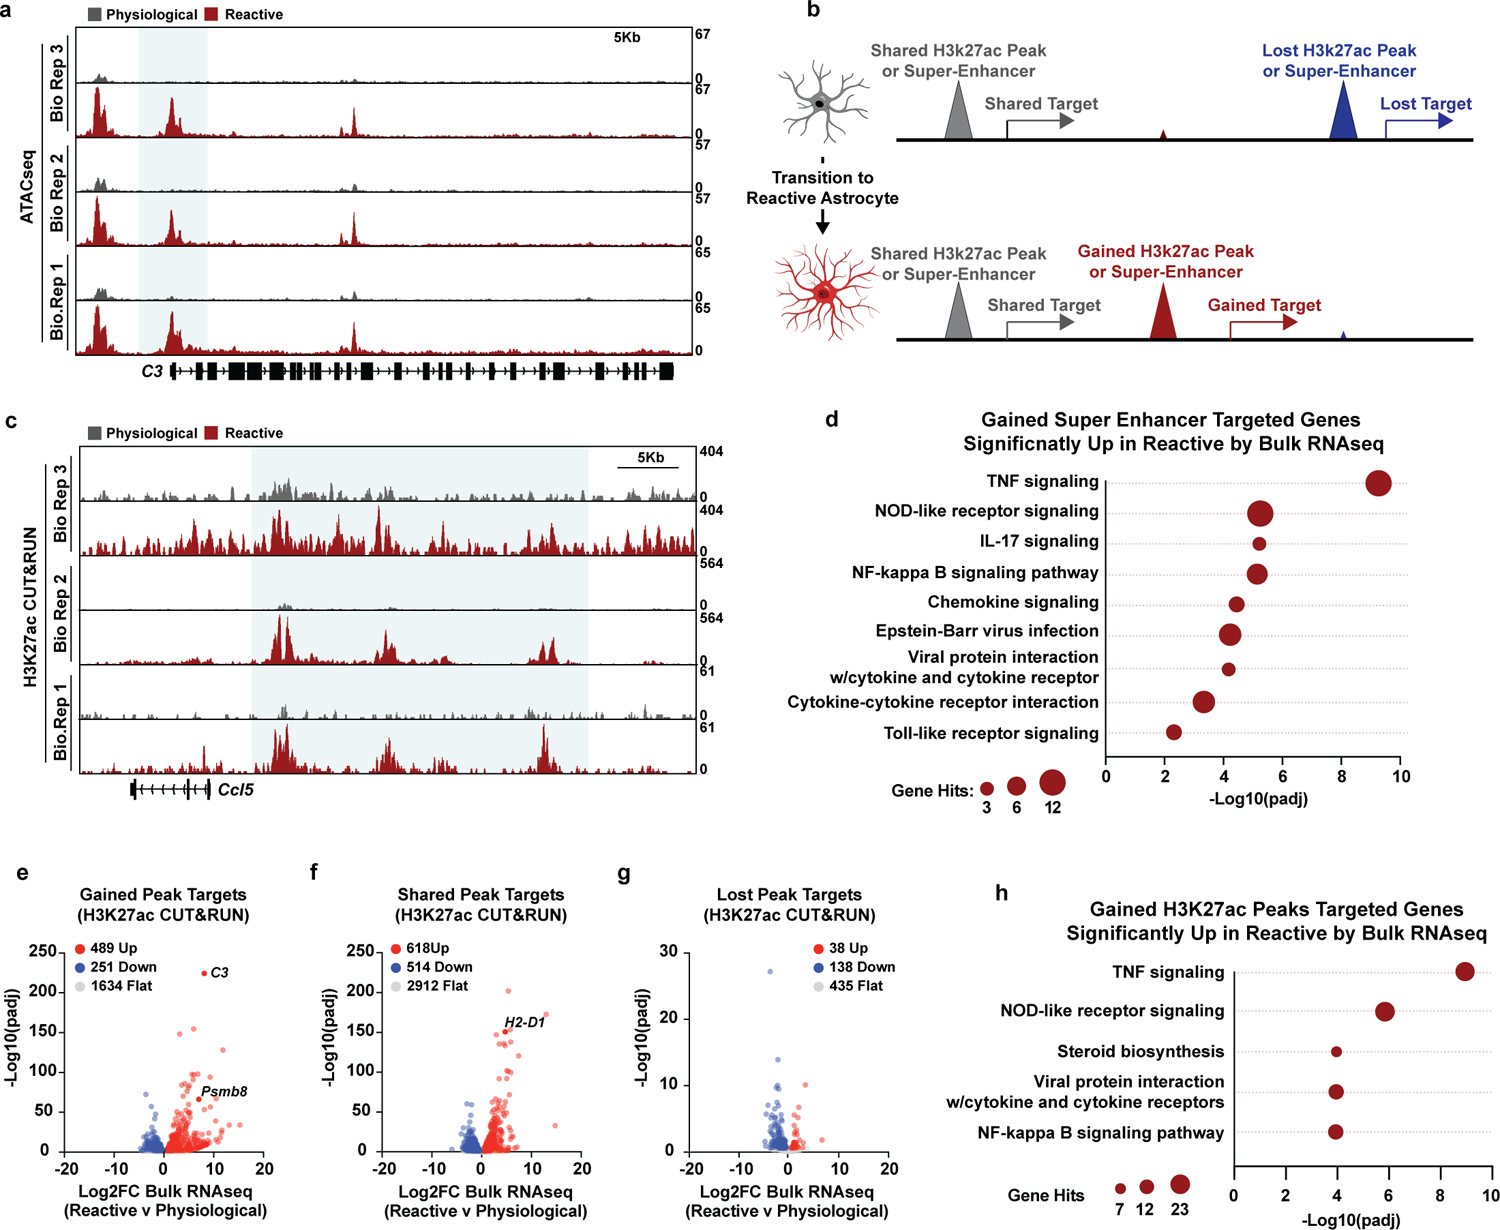
a, Biological (Bio) replicate ATACseq tracks for figure 2c. b, Depiction of gained, lost, and shared H3K27ac or super-enhancer peaks during the transition from physiological to reactive astrocytes. c, Biological replicate H3K27ac CUT&RUN tracks in figure 2i. d, Gene ontology analysis of genes targeted by gained super-enhancers in reactive astrocytes that are also upregulated in reactive astrocytes compared to physiological in bulk RNAseq analysis. p-values generated by Benjamini-Hochberg false discovery rate. e, Bulk RNAseq volcano plot of genes with a gained H3K27ac CUT&RUN peak (+/−5Kb of the transcription start site (TSS)) in reactive astrocytes. Log2FC and p-adj values were generated from bulk RNAseq analysis with DESEQ2 f, Bulk RNAseq volcano plot of genes with a shared H3K27ac CUT&RUN peak (+/−5Kb of the transcription start site (TSS)) in both reactive and physiological astrocytes. Log2FC and p-adj values were generated from bulk RNAseq analysis with DESEQ2 g, Bulk RNAseq volcano plot of genes with a lost H3K27ac CUT&RUN peak (+/−5Kb of the transcription start site (TSS)) in reactive astrocytes. Log2FC and p-adj values were generated from bulk RNAseq analysis with DESEQ2. h, Gene ontology analysis of genes targeted by gained H3K27ac CUT&RUN peak in reactive astrocytes that are also upregulated in reactive astrocytes compared to physiological in bulk RNAseq analysis. p-values generated by Benjamini-Hochberg false discovery rate.
Extended Data Figure 4. High-throughput chemical screen quality control and validation of HDAC3.
a, Example images of DMSO vehicle-treated reactive and physiological control wells from the phenotypic screen. Scale bar is 100um. b, Z-prime standard, and robust scores for primary screen plates. c, Percent GBP2 positive astrocytes in DMSO vehicle treated reactive and physiological control wells on each primary screen plate. Data as the mean ± s.e.m., n = 16 wells per group on each primary screen plate. d, Dose curve of primary screen hits. Data are percent of GBP2 positive cells normalized to DMSO vehicle treated reactive astrocyte control wells. n = 2 biological replicates (independent astrocyte isolations). Black data points represent toxic doses where total cell number decreased by >50% compared to vehicle treated reactive astrocyte control wells. e, Dose curve analysis of hits from primary screen with Psmb8 positivity by in situ hybridization as a secondary endpoint. Data are percent of Psmb8 mRNA positive normalized to DMSO vehicle treated reactive astrocyte control wells with an n = 1 biological replicate (independent astrocyte isolation). Black data points represent toxic doses where total cell number decreased by >50% compared to vehicle treated reactive astrocyte control wells. f, Ranked inhibition against each HDAC isozyme for validated HDAC inhibitors in the primary screen. Highlighted is HDAC as the only shared target between all HDAC inhibitor hits. Ranked efficiency was pulled from target data provided by Selleck Chemical. g, Dose curve and IC50 value for the HDAC3 specific inhibitor RGFP966 to block astrocyte reactivity with an n = 5 biological replicates. h, Dose curve and IC50 value for the HDAC3 specific inhibitor T247 to block astrocyte reactivity with an n = 2 biological replicates. i-k, Representative images and quantification of wild-type (WT) and HDAC3 knockout (KO) astrocyte cultures exposed to TIC cytokines. Scale bar is 100um. Data are mean ± s.e.m., n = 3 independent experiments, p-value by a paired t-test. l, GBP2 and PSMB8 qPCR results for human iPSC derived physiological or reactive astrocyte cultures treated with vehicle or 5uM RGFP966. Data are mean ± s.e.m., n = 4 technical replicates.
Extended Data Figure 5. Histone acetylation does not predict HDAC3 inhibition induced gene expression changes in reactive astrocytes.
a, Tukey box and whisker plot showing the average Log2 fold-change (Log2FC), from bulk RNAseq, of the top 100 upregulated genes targeted by gained super-enhancers, all genes targeted by shared super-enhancers, and the top 100 downregulated genes targeted by lost super-enhancers in pathological reactive astrocytes. Data are presented for n = 3 biological replicates. Two-tailed p-value is generated with a one-sample Wilcoxon Signed Ranked test comparing to a hypothetical median of Log2FC = 0 which would designate no difference in expression between reactive and physiological astrocytes. b, Quantification of CCL5 ELISAs performed on astrocyte conditioned media. Data presented as mean ± s.e.m for an n = 3 biological replicates with p-values compared to reactive plus vehicle control and calculated by one-way ANOVA with Dunnett correction for multiple comparisons. c, Tukey box and whisker plot showing the level of H3K27ac, from CUT&RUN, at gained, shared, and lost super-enhancer in reactive astrocytes treated with RGFP966. Data are presented for n = 3 biological replicates. Two-tailed p-value is generated with a one-sample Wilcoxon Signed Ranked test comparing to a hypothetical median of Log2FC = 0. d-e, Representative images and quantification of physiological astrocytes treated with vehicle, 5uM RGFP966, or 5uM JSH-23 and then stained for acetyl-RelA/p65 (K310). Scale bar is 100um. Data are mean ± s.e.m, n = 3 biological replicates, p-value by one-way ANOVA with Dunnett multiple comparison correction. f, Uncropped western blots for figure 3g. g, Transcription factor motifs enriched in H3K27ac CUT&RUN peaks from vehicle treated reactive astrocytes versus RGFP966 (RGFP) treated reactive astrocytes. p-values generated by HOMER. h, Transcription factor motifs enriched in H3K27ac CUT&RUN peaks from RGFP treated reactive astrocytes versus vehicle treated reactive astrocytes. p-values generated by HOMER. i, Normalized NFkB luciferase activity in Jurkat reporter cells treated with the validated hits from the primary drug screen. Data presented as percentage of NFkB activity from a single independent experiment.
Extended Data Figure 6. HDAC3 inhibition modulates pro- and anti-inflammatory gene expression in reactive astrocytes.
a, Biological (Bio) replicate tracks for RelA/p65 CUT&RUN in figure 4k. b, Enriched gene ontology terms for genes significantly upregulated in reactive astrocytes treated with RGFP. p-values generated by Benjamini-Hochberg false discovery rate. c, Enriched transcription factors targeting genes significantly upregulated in reactive astrocytes treated with RGFP. d, Biological replicate tracks for H3K27ac CUT&RUN in figure 4p.
Extended Data Figure 7. In vivo pharmacology of RGFP966 and in vivo genetic validation of HDAC3 as a mediator of astrocyte reactivity.
a, Brain concentration of RGFP966 (RGFP) 4hrs after treatment with vehicle (Veh) or 10mg/kg RGFP. Data presented as mean ± the range for n = 2 biological replicates (mice). Concentration of RGFP in brain from vehicle treated mice was below quantifiable levels (BQL). b-d, Representative images and quantification of immunohistochemistry for AcH4 in the cortex of mice treated with vehicle or 10mg/kg RGFP and then exposed to systemic LPS injections to induce neuroinflammation. Scale bar 100um. Data are mean ± s.e.m., n = 4 biological replicates (mice), p-value by unpaired two-tailed t-test e-f, Representative in situ hybridization images and quantification of untreated and LPS-exposed mice probed for the pan-reactive astrocyte marker Gfap (blue) and the reactive astrocyte marker Gbp2 (red) in the corpus callosum. Scale bar is 50um. Data are mean ± s.e.m., n = 4 biological replicates (mice), p-value by unpaired two-tailed t-test. g-m, Representative images and quantification of immunohistochemistry for GFAP (red) and IBA-1 (blue) in the cortex of mice treated with vehicle or 10mg/kg RGFP and exposed to systemic LPS or saline vehicle. Scale bar 100um. Data are mean ± s.e.m., n = 3 or 4 biological replicates (mice), p-value calculated by one-way ANOVA and Tukey multiple comparison correction. n, Diagram of astrocyte specific HDAC3 knockout mouse breeding. o-q, Representative in situ hybridization images and quantification of untreated wild-type (WT) and HDAC3 knockout (KO) mice and then probed for the pan-astrocyte marker Slc1a3 (green) and the reactive astrocyte marker C3 (red). Scale bar is 50um. Data are mean ± s.e.m., n = 3 biological replicates (mice), p-value by unpaired two-tailed t-test. r-u, Representative in situ hybridization images and quantification of wild-type and HDAC3 knockout (KO) mice exposed to systemic LPS and then probed for the pan-astrocyte marker Slc1a3 (green) and the reactive astrocyte marker C3 (red). Scale bar is 50um. Data are mean ± s.e.m., n = 4 biological replicates (mice), p-value by unpaired two-tailed t-test.
Extended Data Figure 8. RGFP966 has no effect on generalized gliosis in the toxin-based injury model of LPC.
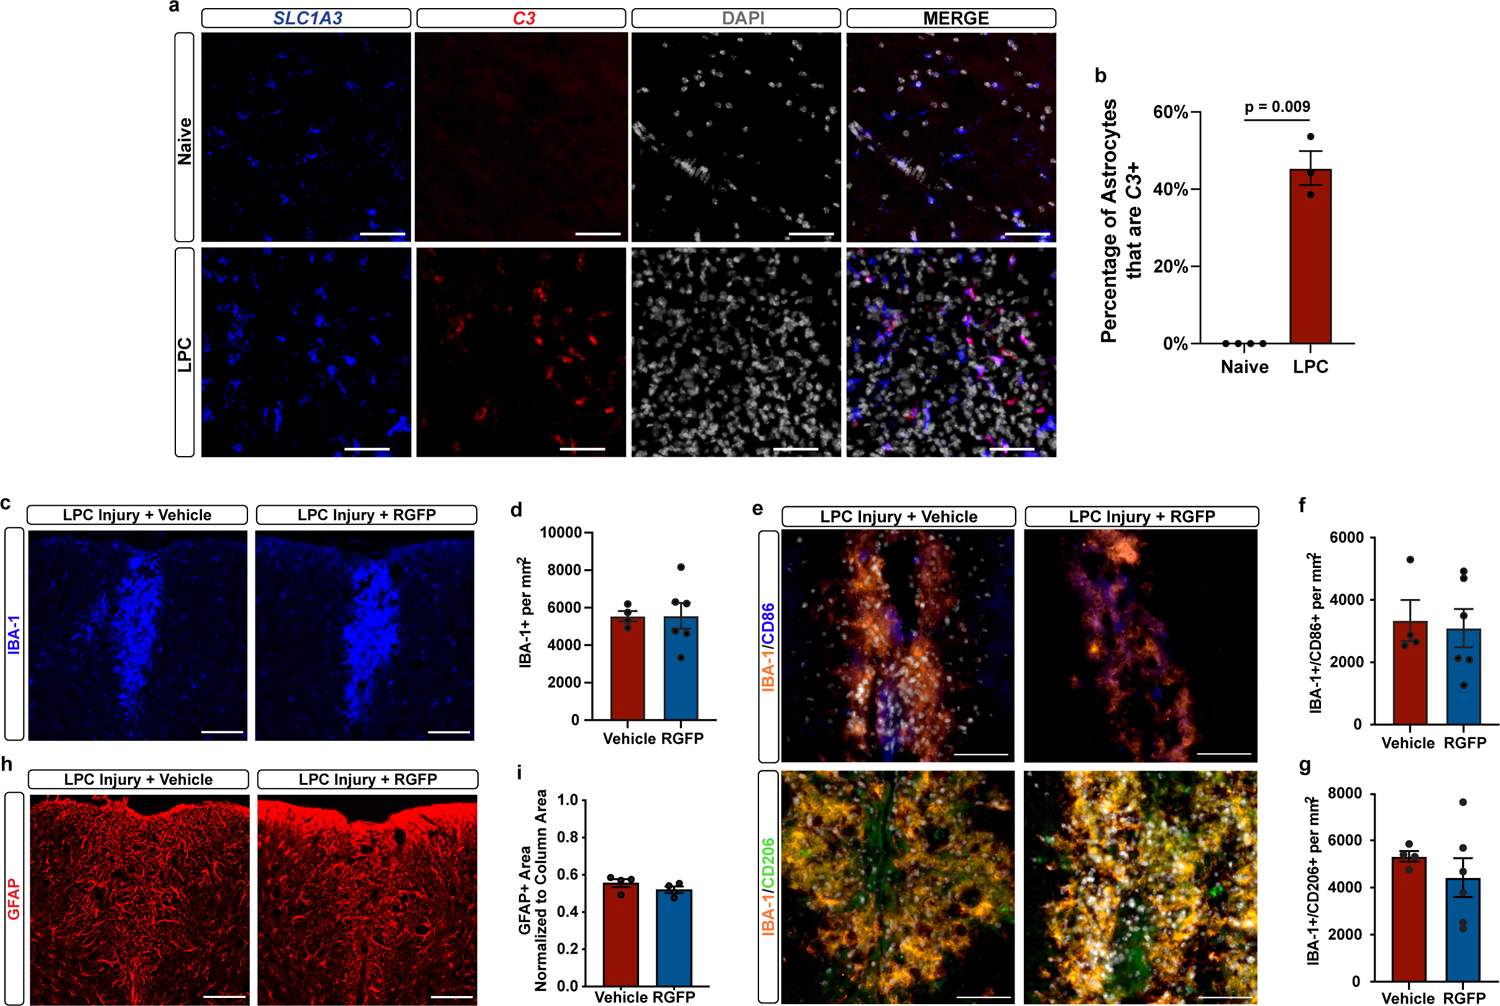
a-b, Representative in situ hybridization images and quantification of naïve and LPC lesioned mice probed for the pan-astrocyte marker Slc1a3 (blue) and the reactive astrocyte marker C3 (red). Scale bar is 50um. Data are mean± s.e.m., n = 3 or 4 biological replicates (mice), p-value by unpaired two-tailed t-test. c-d, Representative images, and quantification of LPC lesions from vehicle or RGFP966 (RGFP) treated mice stained for IBA-1. Scale bar is 100um. Data are mean ± s.e.m., n = 4 biological replicates (mice). e-g, Representative images, and quantification of LPC lesions from RGFP966 or vehicle treated mice stained for IBA-1 (orange), CD86 (blue), and CD206 (green). Scale bar is 100um. Data are mean ± s.e.m., n = 4 or 6 biological replicates (mice). h-i, Representative images, and quantification of LPC lesion from vehicle or RGFP treated mice stained for GFAP. Scale bar is 100um. Data are mean ± s.e.m., n = 4 biological replicates (mice).
Extended Data Figure 9. RGFP decreases gene expression associated with reactive astrocytes in ONC.
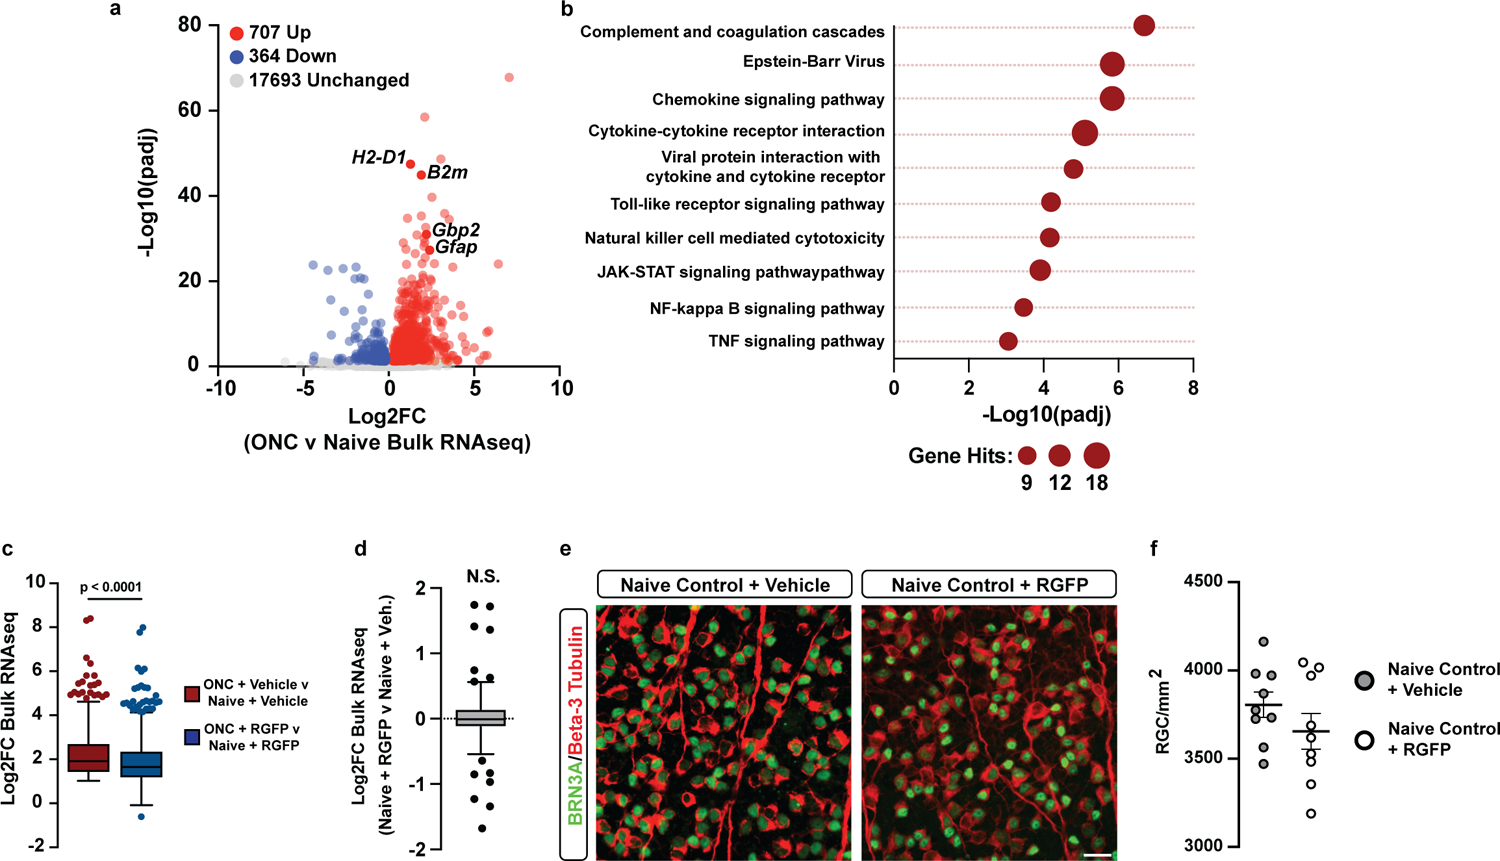
a, Bulk RNAseq volcano plot of genes up and downregulated in ONC retina versus naïve retina. Log2FC and p-adj values were generated from bulk RNAseq analysis with DESEQ2. b, Gene ontology terms for enriched for genes upregulated in ONC retina versus naïve retina. p-values generated by Benjamini-Hochberg false discovery rate. c, Tukey box and whisker plot depicting how the expression of genes upregulated in ONC retina change between crushed and naïve retina in mice treated with vehicle and mice treated with 10mg/kg RGFP. Data are presented as Log2FC for n = 7 biological replicates. p-value generated by a paired two-tailed t-test. d, Tukey box and whisker plot depicting the Log2FC expression of ONC reactive astrocyte genes (same as in Figure 5k) between naïve retina treated with 10mg/kg RGFP and naïve retina treated with vehicle. Data are presented as Log2FC for n = 7 biological replicates. p-value generated with a one-sample Wilcoxon Signed Ranked test comparing to a hypothetical median of Log2FC = 0, which would designate no difference in expression. e-f, Representative images, and quantification of retinal ganglion cells (RGCs) double stained with BRN3A (green) and Beta-3 Tubulin (red) in retina from naive mice treated with vehicle or 10mg/kg RGFP966. Scale bar is 20um. Data are mean± s.e.m., n = 9 or 10 biological replicates (mice), p-value by unpaired two-tailed t-test.
Supplementary Material
Acknowledgments
This study was supported by grants from the National Multiple Sclerosis Society TA-2105-37619 (B.L.L.C), the National Institutes of Health R35NS116842 (P.J.T.), F30HD096784 (K.C.A.), T32GM007250 (K.C.A), K08EY029362 (A.R.S), F31NS124282 (E.F.C.), T32NS077888 (E.F.C.), and T32GM007250 (E.F.C.), the Hartwell Foundation (B.L.L.C), as well as institutional support from the Case Western Reserve University School of Medicine and philanthropic support from sTF5 Care and the R. Blane & Claudia Walter, Long, Goodman, Geller, and Weidenthal families and the Research Institute for Children’s Health. Additional support was provided by the Small Molecule Drug Development and Genomics core facilities of the CWRU Comprehensive Cancer Center (P30CA043703), the CWRU Light Microscopy Imaging Center, and the University of Chicago Genomics Facility. The authors thank D. Adams, Y. Fedorov, W. Harte, M. Scavuzzo, M. Madhavan, D. Kassel, and M. Elitt for technical assistance and/or discussion and C. Lilliehook for editorial support.
Footnotes
Code availability
Data analysis was performed with publicly available packages by following available tutorials and vignettes.
Competing interests B.L.L.C. and P.J.T. are listed as inventors on pending patent claims filed by Case Western Reserve University covering methods and compositions for treating neurodegenerative disorders. All other authors declare no competing interests.
Data availability
All sequencing datasets generated in this study have been deposited in Gene Expression Omnibus (https://www.ncbi.nlm.nih.gov/geo/) under SuperSeries accession code GSE185215 with subseries for astrocyte RNA-seq, optic nerve crush RNAseq, scRNA-seq, CUT&RUN, and ATAC-seq. Previously published data for Hasel et al. PMID: is available under GEO accession number GSE148612. Previously published data for Grubman et al. (PMID:31768052) is available under accession number GSE138852. Previously published data for Al-Dalahmah et al. (PMID: 32070434) available under GEO accession number GSE180928. Previously published data for Smajic et al. (PMID: 34919646) available under GSE157783.
References
- 1.Hasel P & Liddelow SA Astrocytes. Curr Biol 31, R326–R327 (2021). [DOI] [PubMed] [Google Scholar]
- 2.Allen NJ & Eroglu C Cell Biology of Astrocyte-Synapse Interactions. Neuron 96, 697–708 (2017). [DOI] [PMC free article] [PubMed] [Google Scholar]
- 3.Nagai J, et al. Behaviorally consequential astrocytic regulation of neural circuits. Neuron 109, 576–596 (2021). [DOI] [PMC free article] [PubMed] [Google Scholar]
- 4.Guttenplan KA, et al. Neurotoxic reactive astrocytes induce cell death via saturated lipids. Nature (2021). [DOI] [PMC free article] [PubMed] [Google Scholar]
- 5.Di Giorgio FP, Carrasco MA, Siao MC, Maniatis T & Eggan K Non-cell autonomous effect of glia on motor neurons in an embryonic stem cell-based ALS model. Nat Neurosci 10, 608–614 (2007). [DOI] [PMC free article] [PubMed] [Google Scholar]
- 6.Ilieva H, Polymenidou M & Cleveland DW Non-cell autonomous toxicity in neurodegenerative disorders: ALS and beyond. J Cell Biol 187, 761–772 (2009). [DOI] [PMC free article] [PubMed] [Google Scholar]
- 7.Meyer K, et al. Direct conversion of patient fibroblasts demonstrates non-cell autonomous toxicity of astrocytes to motor neurons in familial and sporadic ALS. Proc Natl Acad Sci U S A 111, 829–832 (2014). [DOI] [PMC free article] [PubMed] [Google Scholar]
- 8.Clarke LE, et al. Normal aging induces A1-like astrocyte reactivity. Proc Natl Acad Sci U S A 115, E1896–E1905 (2018). [DOI] [PMC free article] [PubMed] [Google Scholar]
- 9.Liddelow SA, et al. Neurotoxic reactive astrocytes are induced by activated microglia. Nature 541, 481–487 (2017). [DOI] [PMC free article] [PubMed] [Google Scholar]
- 10.Wheeler MA, et al. MAFG-driven astrocytes promote CNS inflammation. Nature 578, 593–599 (2020). [DOI] [PMC free article] [PubMed] [Google Scholar]
- 11.Smith HL, et al. Astrocyte Unfolded Protein Response Induces a Specific Reactivity State that Causes Non-Cell-Autonomous Neuronal Degeneration. Neuron 105, 855–866 e855 (2020). [DOI] [PMC free article] [PubMed] [Google Scholar]
- 12.Burda JE, et al. Divergent transcriptional regulation of astrocyte reactivity across disorders. Nature 606, 557–564 (2022). [DOI] [PMC free article] [PubMed] [Google Scholar]
- 13.Dooves S, et al. Astrocytes are central in the pathomechanisms of vanishing white matter. J Clin Invest 126, 1512–1524 (2016). [DOI] [PMC free article] [PubMed] [Google Scholar]
- 14.Absinta M, et al. A lymphocyte-microglia-astrocyte axis in chronic active multiple sclerosis. Nature 597, 709–714 (2021). [DOI] [PMC free article] [PubMed] [Google Scholar]
- 15.Leng K, et al. CRISPRi screens in human astrocytes elucidate regulators of distinct inflammatory reactive states. BioRxiv, 2021.2008.2023.457400 (2021). [DOI] [PMC free article] [PubMed] [Google Scholar]
- 16.Yun SP, et al. Block of A1 astrocyte conversion by microglia is neuroprotective in models of Parkinson’s disease. Nat Med 24, 931–938 (2018). [DOI] [PMC free article] [PubMed] [Google Scholar]
- 17.Najm FJ, et al. Drug-based modulation of endogenous stem cells promotes functional remyelination in vivo. Nature 522, 216–220 (2015). [DOI] [PMC free article] [PubMed] [Google Scholar]
- 18.Foo LC, et al. Development of a method for the purification and culture of rodent astrocytes. Neuron 71, 799–811 (2011). [DOI] [PMC free article] [PubMed] [Google Scholar]
- 19.Pike SC, Welsh N, Linzey M & Gilli F Theiler’s virus-induced demyelinating disease as an infectious model of progressive multiple sclerosis. Front Mol Neurosci 15, 1019799 (2022). [DOI] [PMC free article] [PubMed] [Google Scholar]
- 20.Chastain EM, Duncan DS, Rodgers JM & Miller SD The role of antigen presenting cells in multiple sclerosis. Biochim Biophys Acta 1812, 265–274 (2011). [DOI] [PMC free article] [PubMed] [Google Scholar]
- 21.Chung WS, et al. Astrocytes mediate synapse elimination through MEGF10 and MERTK pathways. Nature 504, 394–400 (2013). [DOI] [PMC free article] [PubMed] [Google Scholar]
- 22.Grubman A, et al. A single-cell atlas of entorhinal cortex from individuals with Alzheimer’s disease reveals cell-type-specific gene expression regulation. Nat Neurosci 22, 2087–2097 (2019). [DOI] [PubMed] [Google Scholar]
- 23.Al-Dalahmah O, et al. Single-nucleus RNA-seq identifies Huntington disease astrocyte states. Acta Neuropathol Commun 8, 19 (2020). [DOI] [PMC free article] [PubMed] [Google Scholar]
- 24.Smajic S, et al. Single-cell sequencing of human midbrain reveals glial activation and a Parkinson-specific neuronal state. Brain 145, 964–978 (2022). [DOI] [PMC free article] [PubMed] [Google Scholar]
- 25.Loven J, et al. Selective inhibition of tumor oncogenes by disruption of super-enhancers. Cell 153, 320–334 (2013). [DOI] [PMC free article] [PubMed] [Google Scholar]
- 26.Whyte WA, et al. Master transcription factors and mediator establish super-enhancers at key cell identity genes. Cell 153, 307–319 (2013). [DOI] [PMC free article] [PubMed] [Google Scholar]
- 27.Hnisz D, et al. Super-enhancers in the control of cell identity and disease. Cell 155, 934–947 (2013). [DOI] [PMC free article] [PubMed] [Google Scholar]
- 28.Molofsky AV & Deneen B Astrocyte development: A Guide for the Perplexed. Glia 63, 1320–1329 (2015). [DOI] [PubMed] [Google Scholar]
- 29.Hartmann K, et al. Complement 3(+)-astrocytes are highly abundant in prion diseases, but their abolishment led to an accelerated disease course and early dysregulation of microglia. Acta Neuropathol Commun 7, 83 (2019). [DOI] [PMC free article] [PubMed] [Google Scholar]
- 30.Malvaez M, et al. HDAC3-selective inhibitor enhances extinction of cocaine-seeking behavior in a persistent manner. Proceedings of the National Academy of Sciences 110, 2647–2652 (2013). [DOI] [PMC free article] [PubMed] [Google Scholar]
- 31.Suzuki T, et al. Identification of highly selective and potent histone deacetylase 3 inhibitors using click chemistry-based combinatorial fragment assembly. PLoS ONE 8, e68669 (2013). [DOI] [PMC free article] [PubMed] [Google Scholar]
- 32.Srinivasan R, et al. New Transgenic Mouse Lines for Selectively Targeting Astrocytes and Studying Calcium Signals in Astrocyte Processes In Situ and In Vivo. Neuron 92, 1181–1195 (2016). [DOI] [PMC free article] [PubMed] [Google Scholar]
- 33.McQuown SC, et al. HDAC3 is a critical negative regulator of long-term memory formation. J Neurosci 31, 764–774 (2011). [DOI] [PMC free article] [PubMed] [Google Scholar]
- 34.Gryder BE, et al. Histone hyperacetylation disrupts core gene regulatory architecture in rhabdomyosarcoma. Nat Genet 51, 1714–1722 (2019). [DOI] [PMC free article] [PubMed] [Google Scholar]
- 35.Leus NG, Zwinderman MR & Dekker FJ Histone deacetylase 3 (HDAC 3) as emerging drug target in NF-kappaB-mediated inflammation. Curr Opin Chem Biol 33, 160–168 (2016). [DOI] [PMC free article] [PubMed] [Google Scholar]
- 36.Chen LF & Greene WC Regulation of distinct biological activities of the NF-kappaB transcription factor complex by acetylation. J Mol Med (Berl) 81, 549–557 (2003). [DOI] [PubMed] [Google Scholar]
- 37.Shin HM, et al. Inhibitory action of novel aromatic diamine compound on lipopolysaccharide-induced nuclear translocation of NF-kappaB without affecting IkappaB degradation. FEBS Lett 571, 50–54 (2004). [DOI] [PubMed] [Google Scholar]
- 38.Tonelli C, Chio IIC & Tuveson DA Transcriptional Regulation by Nrf2. Antioxid Redox Signal 29, 1727–1745 (2018). [DOI] [PMC free article] [PubMed] [Google Scholar]
- 39.Vargas MR, Johnson DA, Sirkis DW, Messing A & Johnson JA Nrf2 activation in astrocytes protects against neurodegeneration in mouse models of familial amyotrophic lateral sclerosis. J Neurosci 28, 13574–13581 (2008). [DOI] [PMC free article] [PubMed] [Google Scholar]
- 40.Calkins MJ, Vargas MR, Johnson DA & Johnson JA Astrocyte-specific overexpression of Nrf2 protects striatal neurons from mitochondrial complex II inhibition. Toxicol Sci 115, 557–568 (2010). [DOI] [PMC free article] [PubMed] [Google Scholar]
- 41.Gan L, Vargas MR, Johnson DA & Johnson JA Astrocyte-specific overexpression of Nrf2 delays motor pathology and synuclein aggregation throughout the CNS in the alpha-synuclein mutant (A53T) mouse model. J Neurosci 32, 17775–17787 (2012). [DOI] [PMC free article] [PubMed] [Google Scholar]
- 42.Sigfridsson E, et al. Astrocyte-specific overexpression of Nrf2 protects against optic tract damage and behavioural alterations in a mouse model of cerebral hypoperfusion. Sci Rep 8, 12552 (2018). [DOI] [PMC free article] [PubMed] [Google Scholar]
- 43.Zhao W, et al. Astrocytic Nrf2 expression protects spinal cord from oxidative stress following spinal cord injury in a male mouse model. J Neuroinflammation 19, 134 (2022). [DOI] [PMC free article] [PubMed] [Google Scholar]
- 44.Draheim T, et al. Activation of the astrocytic Nrf2/ARE system ameliorates the formation of demyelinating lesions in a multiple sclerosis animal model. Glia 64, 2219–2230 (2016). [DOI] [PubMed] [Google Scholar]
- 45.Bowers ME, Xia B, Carreiro S & Ressler KJ The Class I HDAC inhibitor RGFP963 enhances consolidation of cued fear extinction. Learn Mem 22, 225–231 (2015). [DOI] [PMC free article] [PubMed] [Google Scholar]
- 46.Hasel P, Rose IVL, Sadick JS, Kim RD & Liddelow SA Neuroinflammatory astrocyte subtypes in the mouse brain. Nat Neurosci (2021). [DOI] [PubMed] [Google Scholar]
- 47.Zamanian JL, et al. Genomic analysis of reactive astrogliosis. J Neurosci 32, 6391–6410 (2012). [DOI] [PMC free article] [PubMed] [Google Scholar]
- 48.Sun L, et al. Loss of HDAC11 ameliorates clinical symptoms in a multiple sclerosis mouse model. Life Sci Alliance 1, e201800039 (2018). [DOI] [PMC free article] [PubMed] [Google Scholar]
- 49.Zhang S, Fujita Y, Matsuzaki R & Yamashita T Class I histone deacetylase (HDAC) inhibitor CI-994 promotes functional recovery following spinal cord injury. Cell Death Dis 9, 460 (2018). [DOI] [PMC free article] [PubMed] [Google Scholar]
- 50.Kuboyama T, et al. HDAC3 inhibition ameliorates spinal cord injury by immunomodulation. Sci Rep 7, 8641 (2017). [DOI] [PMC free article] [PubMed] [Google Scholar]
- 51.Janczura KJ, et al. Inhibition of HDAC3 reverses Alzheimer’s disease-related pathologies in vitro and in the 3xTg-AD mouse model. Proc Natl Acad Sci U S A 115, E11148–E11157 (2018). [DOI] [PMC free article] [PubMed] [Google Scholar] [Retracted]
- 52.Zhang MJ, et al. The HDAC3 inhibitor RGFP966 ameliorated ischemic brain damage by downregulating the AIM2 inflammasome. FASEB J 34, 648–662 (2020). [DOI] [PubMed] [Google Scholar]
- 53.Smith CA, Vianna JR & Chauhan BC Assessing retinal ganglion cell damage. Eye (Lond) 31, 209–217 (2017). [DOI] [PMC free article] [PubMed] [Google Scholar]
- 54.Guttenplan KA, et al. Neurotoxic Reactive Astrocytes Drive Neuronal Death after Retinal Injury. Cell Rep 31, 107776 (2020). [DOI] [PMC free article] [PubMed] [Google Scholar]
- 55.Kanamori A, Naka M, Fukuda M, Nakamura M & Negi A Latanoprost protects rat retinal ganglion cells from apoptosis in vitro and in vivo. Exp Eye Res 88, 535–541 (2009). [DOI] [PubMed] [Google Scholar]
- 56.Hasel P, Rose IVL, Sadick JS, Kim RD & Liddelow SA Neuroinflammatory astrocyte subtypes in the mouse brain. Nat Neurosci 24, 1475–1487 (2021). [DOI] [PubMed] [Google Scholar]
- 57.Hafemeister C & Satija R Normalization and variance stabilization of single-cell RNA-seq data using regularized negative binomial regression. Genome Biol 20, 296 (2019). [DOI] [PMC free article] [PubMed] [Google Scholar]
- 58.Barbar L, Rusielewicz T, Zimmer M, Kalpana K & Fossati V Isolation of Human CD49f(+) Astrocytes and In Vitro iPSC-Based Neurotoxicity Assays. STAR Protoc 1, 100172 (2020). [DOI] [PMC free article] [PubMed] [Google Scholar]
- 59.Rolfe AJ, Bosco DB, Broussard EN & Ren Y In Vitro Phagocytosis of Myelin Debris by Bone Marrow-Derived Macrophages. J Vis Exp (2017). [DOI] [PMC free article] [PubMed] [Google Scholar]
- 60.Lager AM, et al. Rapid functional genetics of the oligodendrocyte lineage using pluripotent stem cells. Nat Commun 9, 3708 (2018). [DOI] [PMC free article] [PubMed] [Google Scholar]
- 61.Xie Z, et al. Gene Set Knowledge Discovery with Enrichr. Curr Protoc 1, e90 (2021). [DOI] [PMC free article] [PubMed] [Google Scholar]
- 62.Kuleshov MV, et al. Enrichr: a comprehensive gene set enrichment analysis web server 2016 update. Nucleic Acids Res 44, W90–97 (2016). [DOI] [PMC free article] [PubMed] [Google Scholar]
- 63.Chen EY, et al. Enrichr: interactive and collaborative HTML5 gene list enrichment analysis tool. BMC Bioinformatics 14, 128 (2013). [DOI] [PMC free article] [PubMed] [Google Scholar]
- 64.Subramanian A, et al. Gene set enrichment analysis: a knowledge-based approach for interpreting genome-wide expression profiles. Proc Natl Acad Sci U S A 102, 15545–15550 (2005). [DOI] [PMC free article] [PubMed] [Google Scholar]
- 65.Michiels T, Dejong V, Rodrigus R & Shaw-Jackson C Protein 2A is not required for Theiler’s virus replication. J Virol 71, 9549–9556 (1997). [DOI] [PMC free article] [PubMed] [Google Scholar]
- 66.Yu F, Sankaran VG & Yuan GC CUT&RUNTools 2.0: a pipeline for single-cell and bulk-level CUT&RUN and CUT&Tag data analysis. Bioinformatics 38, 252–254 (2021). [DOI] [PMC free article] [PubMed] [Google Scholar]
- 67.Yu G, Wang LG & He QY ChIPseeker: an R/Bioconductor package for ChIP peak annotation, comparison and visualization. Bioinformatics 31, 2382–2383 (2015). [DOI] [PubMed] [Google Scholar]
- 68.Zhu LJ, et al. ChIPpeakAnno: a Bioconductor package to annotate ChIP-seq and ChIP-chip data. BMC Bioinformatics 11, 237 (2010). [DOI] [PMC free article] [PubMed] [Google Scholar]
- 69.Lawrence M, et al. Software for computing and annotating genomic ranges. PLoS Comput Biol 9, e1003118 (2013). [DOI] [PMC free article] [PubMed] [Google Scholar]
- 70.Heinz S, et al. Simple combinations of lineage-determining transcription factors prime cis-regulatory elements required for macrophage and B cell identities. Mol Cell 38, 576–589 (2010). [DOI] [PMC free article] [PubMed] [Google Scholar]
- 71.Perriot S, et al. Human Induced Pluripotent Stem Cell-Derived Astrocytes Are Differentially Activated by Multiple Sclerosis-Associated Cytokines. Stem Cell Reports 11, 1199–1210 (2018). [DOI] [PMC free article] [PubMed] [Google Scholar]
Associated Data
This section collects any data citations, data availability statements, or supplementary materials included in this article.
Supplementary Materials
Data Availability Statement
All sequencing datasets generated in this study have been deposited in Gene Expression Omnibus (https://www.ncbi.nlm.nih.gov/geo/) under SuperSeries accession code GSE185215 with subseries for astrocyte RNA-seq, optic nerve crush RNAseq, scRNA-seq, CUT&RUN, and ATAC-seq. Previously published data for Hasel et al. PMID: is available under GEO accession number GSE148612. Previously published data for Grubman et al. (PMID:31768052) is available under accession number GSE138852. Previously published data for Al-Dalahmah et al. (PMID: 32070434) available under GEO accession number GSE180928. Previously published data for Smajic et al. (PMID: 34919646) available under GSE157783.