

Abstract
This study aimed at the detailed bibliometric analysis (BA) of fused deposition modeling (FDM) to understand the trend and research area. Web of Science database was used for extracting data using keywords, and 2793 documents were analyzed. From the analysis, the most influential and productive authors, countries, sources, and so on were identified and corresponding interrelations were represented by a three-field plot. Lotka's law was derived for author productivity and its reliability was verified by the Kolmogorov–Smirnov (K–S) test. Bradford's law was used for identifying the core sources contributing to the field of FDM. From the trend topic analysis, it was found that initially the research was focused upon removing error related to deposition as well as part orientation, but with the course of time, it diversified to include topics such as optimization of printing parameters, materials, and applications. Based on the inferences from BA, the article also discusses on current research trend and highlights certain future areas for research work.
Keywords: fused deposition modeling, 3D printing, additive manufacturing, bibliometric analysis, fused filament fabrication
Introduction
Fused deposition modeling (FDM) was invented in 1988, commercialized in 1990,1 and patented in 19922 by Steven Scott Crump, cofounder of Stratasys. As per ISO/ASTM classification, FDM comes under the category of the material extrusion process of additive manufacturing (AM) shown in Figure 1. The FDM printer consists of filament spool, extruder head assembly, base or platform3 over which material is deposited, as shown in Figure 2. The extruder head assembly further consists of the liquefier, heat block containing temperature sensor, heating element, and nozzle. The liquefier or heat sink is connected with the heater block with the help of heat break, which is a small cylindrical element having threads on both sides. Separate heating element and temperature sensor are also connected to the bed so that the required temperature can be maintained at the time of deposition. Three stepper motors are used each for X, Y, and Z directions and one for extruding filament. Generally, the bed moves in Z direction, while the extrusion head assembly in X–Y direction. The stepper motor used for extruding filament can be in-house with extruder head known as direct type, while in some cases it is at a distance and fitted on to the body of printer known as bourdon type. The filament of material is inserted into extruder assembly through force exerted by the rollers of the stepper motor, heated to semisolid stage in the liquefier, and deposited in heated bed through nozzle.4 The filament part above the extruder assembly acts as a piston for the heated part, which is inside the liquefier and forces its way out of the nozzle. The quality of deposit largely depends on the input parameter settings such as printing speed, bead height, raster/part orientation, and bead angle. Optimization of the process parameters largely influences mechanical properties and physical appearance resulting in better performance of FDM parts.
FIG. 1.
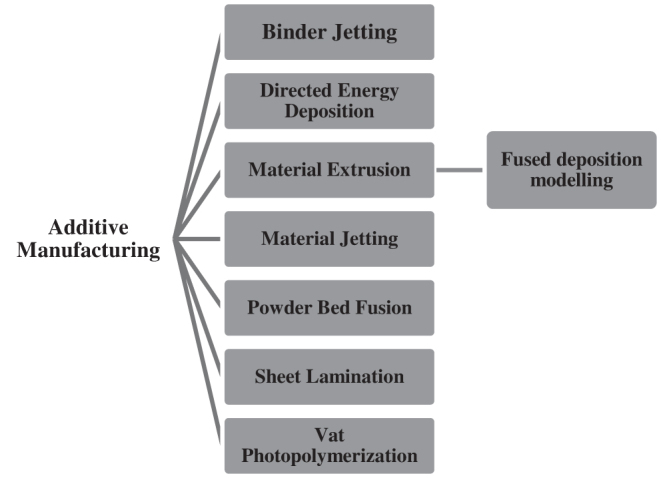
ISO/ASTM 52900:2015 (International Organization for Standardization/American Society for Testing and Materials) Classification of additive manufacturing highlighting FDM. FDM, fused deposition modeling.
FIG. 2.

FDM or material extrusion process.
The various steps involved in the FDM process are shown in Figure 3, which is like other AM processes. The very first step is the computer aided design (CAD) model design in software such as solid works, creo, and fusion 360. The next step is to save that file in STL (Standard Triangle Language) format, which is simply the conversion of CAD model into several triangles. The STL file is then imported to slicing software such as CURA and 3D Slicer, in which various input printing parameters such as layer height, infill density, temperature, and print speed, value can be set accordingly and then the file is sliced in the form of layers.5 The sliced file information is extracted in the form of GM-codes, fed into the FDM machine, and the required geometry can be three-dimensional (3D) printed. The postprocessing in the form of machining, dipping in solution, and so on for removing support structures or eliminating minor defects can be done once the printing is completed. The advantage of FDM is its low cost, reduced time for production,6 and wide acceptance in prototyping application. However, it is limited by low temperature and a limited range of materials.1 FDM as in 3D printing is one of the revolutionary technologies, which is also the key enabling element of industry 4.0 and can achieve the target of smart and lean manufacturing.7 Since 3D printing is an automation process that can print customized geometry on demand, also it is easy to deploy and maintain. The on-demand print feature of 3D printing helps in reducing the inventory and production in small batches leading to pull systems, which are the requisites of lean manufacturing. The other objectives such as 5S and man/machine separation are achieved by automation and easy maintenance feature of 3D printing. Isolation and easy deploy feature of 3D printing lead to reduction in lead time, downsizing of factory capacity, just in time, effective logistics system, and so on. One such example is illustrated by the industrial case study8 in which AM led to considerable saving of time in maintenance, repair, and overall activities by simply 3D printing the part and replacing it with the defected part. The only time required is in designing/downloading the STL file and 3D printing of the part, which is negligible compared with ordering and waiting time of the new part. Another example is the case of academic research done through case studies in Finland,9 which demonstrated the use of AM for reducing the material and inventory, minimizing the wastages and energy usages, making supply chain more flexible, simplified, efficient, or compressed, bringing on more customization.
FIG. 3.
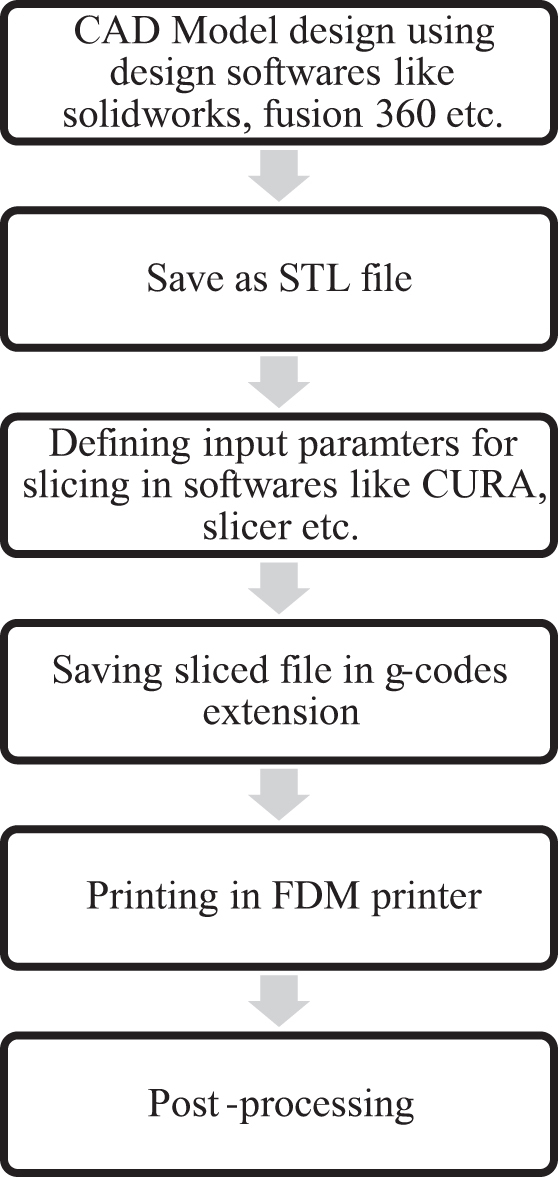
Flow diagram representing process flow of 3D printing model using FDM printer, each subsequent process acts as an input to the next step. 3D, three-dimensional.
Bibliometric analysis (BA) means exploring the past, current, and future trend in a particular field. It deals with both qualitative and quantitative analysis of literature in terms of the number of articles (productivity),10 number of citations (influential), a particular country or university contributing majorly in specific research, and so on, and therefore helps in identifying the area, which is unexplored or requires sufficient amount of research. There are various techniques described for BA in literature for understanding the research done on existing work dynamically and structurally,11 which include citation and productivity analysis, Bradford analysis, research front identification, bibliographic coupling, and so on.
FDM advantage is its wide variety of application, low cost, customized products, lower lead times, and so on. Major research is going on with regard to the materials used in FDM and the probable application they bring with them. So, BA will help in focusing on the countries, universities, authors, and so on leading in FDM technology, other keywords associated with it, and probable area of future research. The following steps have been followed for BA in this article.
Searching of one of the most widely used and reputed databases, Web of Science (WOS), using keywords.
Data collection
BA of the data using software and app such as Biblioshiny, VOSviewer, and HistCite, and presenting in a meaningful way.
Results and Conclusion
Future scope
Scientific productivity is an important aspect of BA and is the measure of published output of a domain with respect to number of authors.12 Although there are various approaches for measuring the same, one such is Lotka's law for finding out the author's productivity, which simply states that in every field whether scientific, humanity, and so on, the number of published articles is inversely proportional to the number of authors who have contributed. To ensure whether the observed author's published data distribution fits the theoretical distribution, a goodness-of-fit test is performed.13 The test for the same should be nonparametric, since author's data are non-normally distributed. The two hypotheses, null and alternate, are tested between expected and observed frequency. The two most widely used tests for hypothesis testing are the chi-square (χ2) test and Kolmogorov–Smirnov (K–S) test.14 The prerequisites for the χ2 test are that data should be categorized in discrete class and the value of expected frequencies should be sufficiently large. While the nature of the author's data is such that most of the publications are done by a handful of authors, a major number of them have a small contribution such as one article, which is a small-frequency case. In the case if more than 20% of the expected frequencies are lesser than 5, then their information is clubbed to form a larger frequency. So, some of the information is lost in combining the frequencies, and therefore, the χ2 test does not prove to be effective in this case, unlike the K–S test that treats each observation separately and does not lose any information in the process. The detailed explanation of Lotka's law and its correlation with the K–S test are given further under the Author Impact and Productivity section. Similar to this, sources' (journal) contribution generally follows the Bradford law founded by Bradford in the year 1948,15 which states that for a particular domain if the sources are divided in the decreasing order of the articles contributed, then this result in the formations of zones of sources having equal number of articles and number of zones follows the geometric progression. The first zone is generally the nucleus and sources in it are known as core sources, which are lesser in number but contributed the most articles in that domain. Lotka's and Bradford laws are important in the context of FDM literature as it helps in finding the trend in authors and source productivity, respectively. The K–S test ensures the reliability of the Lotka's law, that is, how effectively the given author's data of FDM domain fit in it. The Bradford law also helps in identifying the core sources corresponding to FDM literature. The details of which are given in the Journal Contributions and Bradford's Law section.
Data Extraction
WOS is selected as it is one of the powerful research tools for searching different types of article-related information in a time phase manner. The search query in WOS can be general to very specific, supported by IF, OR, AND, NOT, and so on. statement, depending on the information required. WOS provides access to various reputed databases around the world containing diversified and peer-reviewed articles. The keywords used for extracting data from the WOS database are mentioned in Table 1. It was found that combining FDM and fused filament fabrication (FFF) by using OR statement results in a larger number of documents. The idea behind this is not to leave any document using FDM or FFF technology. The final search was performed on November 30, 2020, on the WOS database, which resulted in a total of 3483 articles (articles, review articles, proceedings articles, etc.), out of which 149 review articles and 361 other articles, which were included in the search due to the keywords “fused,” “deposition,” “modeling,” and so on, but had no relevancy to FDM, were discarded. So, 2973 articles were considered for BA, the details of which are given in Table 2.
Table 1.
Keywords Used in Web of Science Database
| S. No. | Keywords | No. of research articles |
|---|---|---|
| 1. | FFF | 966 |
| 2. | FDM | 2887 |
| 3. | “Fused Deposition Modelling” OR “Fused Filament Fabrication” | 3483 |
FDM, fused deposition modeling; FFF, fused filament fabrication.
Table 2.
Details of Documents Used for Bibliometric Analysis
| Description | Results |
|---|---|
| Main information about data | |
| Time span | 1994:2021 |
| Sources (Journals, Books, etc.) | 676 |
| Documents | 2973 |
| Average years from publication | 2.78 |
| Average citations per document | 18.69 |
| References | 58,943 |
| Document types | |
| Article | 2790 |
| Article; Book chapter | 1 |
| Article; Early access | 92 |
| Article; Proceedings article | 67 |
| Article; Retracted publication | 1 |
| Correction | 8 |
| Editorial material | 5 |
| Meeting abstract | 9 |
| Total | 2973 |
| Document contents | |
| Keyword Plus (ID) | 3574 |
| Author's keywords (DE) | 6550 |
| Authors | |
| Authors | 9259 |
| Author appearances | 13,909 |
| Authors of single-authored documents | 54 |
| Authors of multiauthored documents | 9205 |
| Authors' collaboration | |
| Single-authored documents | 63 |
| Documents per author | 0.321 |
| Authors per document | 3.11 |
| Coauthors per document | 4.68 |
| Collaboration index | 3.16 |
Bibliometric Analysis
The Biblioshiny app in the library of bibliometrix package of RStudio software and HistCite and VOSviewer were used for analysis and to extract meaningful information. The information includes top authors, journals, countries, universities, and so on, having a major impact on FDM and paving the way for others.
FDM growth
The first article in WOS using FDM or rapid prototyping technology goes back to the year 1994. Since then, the rate remained slow till 2013 with an annual growth rate of 6.14%. The reason for this can be traced back to the expiration of FDM patent on October 30, 20092, as it takes 4–5 years for the technology to be popularized and developed. Therefore, the major chunk of articles in this field was published post-2014 with a maximum of 720 in the year 2020. The publications on FDM over the years have been depicted in Figure 4 and as far as average article citation is concerned, it shows an increased trend over the years (Fig. 5) with a patch of decrement in between. The maximum average citation was in the year 2015.
FIG. 4.

Annual production over the years in WOS (x axis shows the number of articles and y axis shows the year). WOS, Web of Science.
FIG. 5.

Annual average citation of documents over the years (x axis shows the average number of citations of documents and y axis shows the year).
Author impact and productivity
The author contribution and its impact can be categorized in two ways, most cited, that is, influential, and the number of articles, that is, productive. The top 20 authors with maximum citations and other details are shown in Table 3, while the ones having the highest number of articles are shown in Table 4. Hutmacher leads the list with the highest number of citations with a relatively low number of 20 articles, while Rupinder leads the list for the highest number of articles. The first three columns in Tables 3 and 4 represent the following:
Table 3.
Top 20 Authors with the Maximum Number of Citations (Influential)
| S. No. | Author | h_index | g_index | m_index | TC | NP | FPY |
|---|---|---|---|---|---|---|---|
| 1 | Hutmacher | 14 | 20 | 0.70 | 3055 | 20 | 2001 |
| 2 | Teoh | 5 | 5 | 0.25 | 2333 | 5 | 2001 |
| 3 | Tan | 2 | 2 | 0.10 | 2053 | 2 | 2001 |
| 4 | Zein | 2 | 2 | 0.10 | 2053 | 2 | 2001 |
| 5 | Basit | 15 | 17 | 2.14 | 1692 | 17 | 2014 |
| 6 | Gaisford | 15 | 17 | 2.14 | 1692 | 17 | 2014 |
| 7 | Goyanes | 15 | 17 | 2.14 | 1692 | 17 | 2014 |
| 8 | Masood | 18 | 30 | 0.72 | 1446 | 30 | 1996 |
| 9 | Ahn | 6 | 8 | 0.32 | 1249 | 8 | 2002 |
| 10 | Chin Tze Ng | 1 | 1 | 0.05 | 1004 | 1 | 2001 |
| 11 | Schantz | 1 | 1 | 0.05 | 1004 | 1 | 2001 |
| 12 | Wright | 4 | 4 | 0.21 | 989 | 4 | 2002 |
| 13 | Singh | 17 | 23 | 2.12 | 949 | 104 | 2013 |
| 14 | Montero | 1 | 1 | 0.05 | 905 | 1 | 2002 |
| 15 | Odell | 1 | 1 | 0.05 | 905 | 1 | 2002 |
| 16 | Roundy | 1 | 1 | 0.05 | 905 | 1 | 2002 |
| 17 | Alhnan | 11 | 12 | 1.83 | 853 | 12 | 2015 |
| 18 | Mahapatra | 7 | 9 | 0.58 | 842 | 9 | 2009 |
| 19 | Wicker | 8 | 11 | 1.14 | 815 | 11 | 2014 |
| 20 | Sood | 8 | 9 | 0.67 | 800 | 9 | 2009 |
FPY, first publication year; NP, number of articles; TC, total citations.
Table 4.
Top 20 Authors with the Maximum Number of Articles (Productive)
| S. No. | Author | h_index | g_index | m_index | TC | NP | FPY |
|---|---|---|---|---|---|---|---|
| 1 | Singh | 17 | 23 | 2.12 | 949 | 104 | 2013 |
| 2 | Singh | 9 | 15 | 1.5 | 267 | 33 | 2015 |
| 3 | Masood | 18 | 30 | 0.72 | 1446 | 30 | 1996 |
| 4 | Wang | 7 | 15 | 0.58 | 229 | 22 | 2009 |
| 5 | Kumar | 7 | 11 | 2.33 | 137 | 21 | 2018 |
| 6 | Hutmacher | 14 | 20 | 0.70 | 3055 | 20 | 2001 |
| 7 | Ahuja | 7 | 11 | 1.4 | 142 | 19 | 2015 |
| 8 | Kumar | 7 | 11 | 0.54 | 128 | 18 | 2008 |
| 9 | Basit | 15 | 17 | 2.14 | 1692 | 17 | 2014 |
| 10 | Fu | 10 | 17 | 1.67 | 477 | 17 | 2015 |
| 11 | Gaisford | 15 | 17 | 2.14 | 1692 | 17 | 2014 |
| 12 | Goyanes | 15 | 17 | 2.14 | 1692 | 17 | 2014 |
| 13 | Jain | 9 | 14 | 1.8 | 200 | 17 | 2016 |
| 14 | Zhang | 5 | 10 | 1.25 | 106 | 16 | 2017 |
| 15 | Bhowmik | 9 | 15 | 1.50 | 547 | 15 | 2015 |
| 16 | Mohamed | 9 | 15 | 1.50 | 547 | 15 | 2015 |
| 17 | Batish | 5 | 11 | 1 | 132 | 14 | 2016 |
| 18 | Belhabib | 5 | 10 | 0.83 | 118 | 14 | 2015 |
| 19 | Guessasma | 5 | 10 | 0.83 | 118 | 14 | 2015 |
| 20 | Pearce | 7 | 14 | 1.16 | 212 | 14 | 2015 |
-
(1)
h_index16 of any author is equal to the minimum number of articles having “h” citation.
-
(2)
g_index17 of any author is the largest number of top articles “g” when arranged in decreasing order of citations, which have at least “g2” citations.
-
(3)
m_index of any author is where n is the number of years after the first article has been published.
Consider the example of Hutmacher (Table 3), having h_index of 14, it means out of his total articles 20, he has 14 articles that have at least 14 citations each, g_index of 20, which is nothing but equal to his total number of articles, since 202 is 400, which is less than his total citations 3055, m_index of 0.70, which is , since the first articles was published in 2001, so “n” is 20 (2001–2020).
Hutmacher is the most influential author in the field of FDM it seems. The 20 articles related to FDM literature are mainly in the medical domain. The research interest includes scaffold development, bone and tissue regeneration, breast cancer, tissue reconstruction, and so on using FDM technology. Two articles among the list, published in the years 200118 and 2002,19 are having more than 1000 citations each, in which the polycaprolactone (PCL) filament is prepared from the one-shot extruder using PCL pellets, which is subsequently used for fabricating a honeycomb-structured porous scaffold using FDM. The mechanical properties of the same are measured and evaluated for enhanced applications. The research work also includes in vivo and in vitro studies on both human and animal tissues. The latest published work involves fabrication of scaffold for breast reconstruction, bone model for metastasis in vivo for breast cancer, evaluation of bioresorbable filament, and using an advanced AM technique known as melt electrowriting (MEW) for depositing and fabricating fibrous scaffolds that are anatomically relevant.
Lotka's law for author productivity
Lotka was an American statistician who published the first article20 on the productivity of scientific documents related to frequency distribution in 1926, where he found out that author's productivity over an entire life follows a power law. Potter in his article “Lotka's law revisited”21 illustrated that the first time Lotka's article20 was cited was in 1941 and it was termed as “law” in the year 1949. The first attempt made to test its applicability in other disciplines was in the year 1973. Macroberts in the year 1982 published an article on revaluation of Lotka's law,22 in which it was demonstrated that the law is applicable only to the productivity of an author within a particular field (area) instead of an author's or scientist's lifetime productivity. From all these discussions, it was inferred that Lotka's law is used for finding out the productivity of authors in a particular domain; it also gives a sense of understanding and awareness among researchers related to that field.
According to Lotka's law,13 a large percent of a number of articles in a particular field are written by a small fraction of authors, and therefore, as the number of articles23 by a single author increases, the number of authors in that area decreases. The law is given by “xyn = C” where y is the number of authors publishing x articles in a particular domain, and n and C are constants represented by the Equations (1) and (2), respectively. Of the total 2793 documents, it was found that 76.6% (Table 5) of the total 9259 authors have published one article. The graphical result obtained is shown in Figure 6, and it is clearly visible that as the number of documents by an individual author approaches 100, the percentage of authors approaches zero and vice versa. The Lotka test was applied for the current observation and its reliability was verified by the K–S test. Table 5 shows the number of documents (x) written against the number of authors (y), so here n = 24, which is the number of rows or pairs, X = log x and Y = log y. All these terms are utilized in Equation (1) to find the value of exponent “n.” The value of p, which is the limit of x in Equation (2), is taken as 20 for getting the minimum residual error in least number of iterations and n = −2.401 calculated from Equation (1) is in the range according to Pao (1985) and its absolute value is taken in Equation (2) for calculation of C = 0.7272. The function is represented by Equation (3).
Table 5.
Documents Written Corresponding to the Number of Authors*
| S. No. | Documents written (x) | No. of authors (y) | X = log(x) | Y = log(y) | XY | X 2 |
|---|---|---|---|---|---|---|
| 1 | 1 | 7089 | 0.00 | 3.85 | 0.00 | 0.00 |
| 2 | 2 | 1247 | 0.30 | 3.10 | 0.93 | 0.09 |
| 3 | 3 | 429 | 0.48 | 2.63 | 1.26 | 0.23 |
| 4 | 4 | 226 | 0.60 | 2.35 | 1.42 | 0.36 |
| 5 | 5 | 103 | 0.70 | 2.01 | 1.41 | 0.49 |
| 6 | 6 | 42 | 0.78 | 1.62 | 1.26 | 0.61 |
| 7 | 7 | 27 | 0.85 | 1.43 | 1.21 | 0.71 |
| 8 | 8 | 27 | 0.90 | 1.43 | 1.29 | 0.82 |
| 9 | 9 | 19 | 0.95 | 1.28 | 1.22 | 0.91 |
| 10 | 10 | 11 | 1.00 | 1.04 | 1.04 | 1.00 |
| 11 | 11 | 9 | 1.04 | 0.95 | 0.99 | 1.08 |
| 12 | 12 | 4 | 1.08 | 0.60 | 0.65 | 1.16 |
| 13 | 13 | 4 | 1.11 | 0.60 | 0.67 | 1.24 |
| 14 | 14 | 6 | 1.15 | 0.78 | 0.89 | 1.31 |
| 15 | 15 | 2 | 1.18 | 0.30 | 0.35 | 1.38 |
| 16 | 16 | 1 | 1.20 | 0.00 | 0.00 | 1.45 |
| 17 | 17 | 5 | 1.23 | 0.70 | 0.86 | 1.51 |
| 18 | 18 | 1 | 1.26 | 0.00 | 0.00 | 1.58 |
| 19 | 19 | 1 | 1.28 | 0.00 | 0.00 | 1.64 |
| 20 | 20 | 1 | 1.30 | 0.00 | 0.00 | 1.69 |
| 21 | 22 | 2 | 1.34 | 0.30 | 0.40 | 1.80 |
| 22 | 30 | 1 | 1.48 | 0.00 | 0.00 | 2.18 |
| 23 | 33 | 1 | 1.52 | 0.00 | 0.00 | 2.31 |
| 24 | 104 | 1 | 2.02 | 0.00 | 0.00 | 4.07 |
| Total | 9259 | 24.74 | 24.99 | 15.86 | 29.63 |
FIG. 6.

Author productivity and Lotka's law (x axis represents the percentage of authors, while y axis represents the number of documents written by them, as the number of documents increases, the percentage of authors contributing the same decreases).

| (2) |
| (3) |
K–S test for Lotka's law
As already discussed in the introduction, the goodness-of-fit test is used to check how well the observed frequency matches with the theoretical one. The χ2 test power is compromised since it combines the low adjacent frequencies. While in the K–S test, the theoretical distribution is known and its cumulative frequency is compared with the observed frequency. The two hypotheses are formulated as follows: (1) null hypothesis, which states that the observed distribution is not different with the expected and (2) alternate hypothesis, the expected and observed distribution is different. The difference between the cumulative frequencies is expected to be small and test helps in determining the probability associated with the maximum divergence occurring between observed and expected frequencies within the limits. As discussed earlier, each observation is considered separately in this test resulting in no loss of information and therefore provides better result than the χ2 test.
Table 6 shows the value corresponding to the K–S test, the last column is the difference between observed and expected accumulated values, if Dmax is greater than the critical value of K–S test, then null hypothesis is rejected and vice versa for alternate hypothesis. For a sample size greater than 35 at 0.01 level of significance, Equation (4) is used for calculating the critical value, in the current case it is 24, which is less than 35 and so the direct value from the K–S table can be taken, which is 0.270.
Table 6.
K–S Fit Test
| S. No. | Documents published (x) | No. of authors (y) | Observed value of contribution of authors fo(yx) = yx/∑ yx | Observed accumulated value ∑ fo(yx) | Expected value of contribution of authors fe(yx) = yx/∑ yx | Expected accumulated value ∑ fe(yx) | Diffrence (D)|∑ fo(yx)−∑ fe(yx)| |
|---|---|---|---|---|---|---|---|
| 1 | 1 | 7089 | 0.7656 | 0.7656 | 0.7276 | 0.7276 | 0.0380a |
| 2 | 2 | 1247 | 0.1347 | 0.9003 | 0.1378 | 0.8654 | 0.0350 |
| 3 | 3 | 429 | 0.0463 | 0.9466 | 0.0520 | 0.9174 | 0.0292 |
| 4 | 4 | 226 | 0.0244 | 0.9711 | 0.0261 | 0.9435 | 0.0276 |
| 5 | 5 | 103 | 0.0111 | 0.9822 | 0.0153 | 0.9587 | 0.0234 |
| 6 | 6 | 42 | 0.0045 | 0.9867 | 0.0099 | 0.9686 | 0.0181 |
| 7 | 7 | 27 | 0.0029 | 0.9896 | 0.0068 | 0.9754 | 0.0142 |
| 8 | 8 | 27 | 0.0029 | 0.9925 | 0.0049 | 0.9803 | 0.0122 |
| 9 | 9 | 19 | 0.0021 | 0.9946 | 0.0037 | 0.9841 | 0.0105 |
| 10 | 10 | 11 | 0.0012 | 0.9958 | 0.0029 | 0.9870 | 0.0088 |
| 11 | 11 | 9 | 0.0010 | 0.9968 | 0.0023 | 0.9892 | 0.0075 |
| 12 | 12 | 4 | 0.0004 | 0.9972 | 0.0019 | 0.9911 | 0.0061 |
| 13 | 13 | 4 | 0.0004 | 0.9976 | 0.0015 | 0.9927 | 0.0050 |
| 14 | 14 | 6 | 0.0006 | 0.9983 | 0.0013 | 0.9939 | 0.0043 |
| 15 | 15 | 2 | 0.0002 | 0.9985 | 0.0011 | 0.9950 | 0.0035 |
| 16 | 16 | 1 | 0.0001 | 0.9986 | 0.0009 | 0.9960 | 0.0026 |
| 17 | 17 | 5 | 0.0005 | 0.9991 | 0.0008 | 0.9968 | 0.0024 |
| 18 | 18 | 1 | 0.0001 | 0.9992 | 0.0007 | 0.9975 | 0.0018 |
| 19 | 19 | 1 | 0.0001 | 0.9994 | 0.0006 | 0.9981 | 0.0013 |
| 20 | 20 | 1 | 0.0001 | 0.9995 | 0.0005 | 0.9986 | 0.0008 |
| 21 | 22 | 2 | 0.0002 | 0.9997 | 0.0004 | 0.9991 | 0.0006 |
| 22 | 30 | 1 | 0.0001 | 0.9998 | 0.0002 | 0.9993 | 0.0005 |
| 23 | 33 | 1 | 0.0001 | 0.9999 | 0.0002 | 0.9995 | 0.0004 |
| 24 | 104 | 1 | 0.0001 | 1.0000 | 0.0000 | 0.9995 | 0.0005 |
| Total | 9259 |
Dmax.
From Table 6 it can be observed that Dmax 0.0380 is smaller than the critical value 0.270 at 0.01 level of significance. Therefore, the alternate hypothesis is rejected, which states that the above data hold to Lotka's law (Fig. 6).
| (4) |
Journal contributions and Bradford's law
The source impact includes the top journals in the field of FDM in terms of citations and numbers of articles. The top 20 journals having the maximum number of citations over the years are shown in Table 7, while the ones with the maximum number of articles are shown in Table 8. The Rapid Prototyping Journal is leading in both the lists, while Material Design is second in the list having a high number of citations with a relatively low number of articles, and Additive Manufacturing is second in the list of maximum articles. Interestingly, the Additive Manufacturing Journal by the Elsevier group started in the year 2015 has performed tremendously well in both the fields in a short span of time and therefore having the highest m_index of 4.33.
Table 7.
Top 20 Journals with the Maximum Number of Citations (Influential)
| S. No. | Source | h_index | g_index | m_index | TC | NP | FPY |
|---|---|---|---|---|---|---|---|
| 1 | Rapid Prototyping Journal | 38 | 74 | 1.46 | 6270 | 246 | 1995 |
| 2 | Materials & Design | 30 | 60 | 1.58 | 3712 | 69 | 2002 |
| 3 | International Journal of Advanced Manufacturing Technology | 28 | 46 | 1.22 | 2445 | 126 | 1998 |
| 4 | Additive Manufacturing | 26 | 42 | 4.33 | 2344 | 157 | 2015 |
| 5 | International Journal of Pharmaceutics | 22 | 42 | 3.14 | 1993 | 42 | 2014 |
| 6 | Journal of Materials Processing Technology | 20 | 23 | 0.80 | 1950 | 23 | 1996 |
| 7 | Biomaterials | 8 | 8 | 0.42 | 1693 | 8 | 2002 |
| 8 | Composites Part B-Engineering | 19 | 37 | 3.17 | 1388 | 45 | 2015 |
| 9 | Materials | 18 | 29 | 3.00 | 1081 | 116 | 2015 |
| 10 | Journal of Biomedical Materials Research | 1 | 1 | 0.05 | 1004 | 1 | 2001 |
| 11 | Journal of the American Ceramic Society | 6 | 6 | 0.25 | 855 | 6 | 1997 |
| 12 | International Journal of Machine Tools & Manufacture | 3 | 4 | 0.13 | 841 | 4 | 1998 |
| 13 | Scientific Reports | 8 | 20 | 1.60 | 604 | 20 | 2016 |
| 14 | Journal of Manufacturing Science and Engineering-Transactions of the ASME | 12 | 24 | 0.55 | 593 | 25 | 1999 |
| 15 | European Journal of Pharmaceutics and Biopharmaceutics | 9 | 10 | 1.50 | 584 | 10 | 2015 |
| 16 | European Journal of Pharmaceutical Sciences | 9 | 15 | 1.50 | 552 | 15 | 2015 |
| 17 | ACS Applied Materials & Interfaces | 10 | 19 | 1.43 | 545 | 19 | 2014 |
| 18 | Composites Part A-Applied Science and Manufacturing | 8 | 12 | 1.60 | 536 | 12 | 2016 |
| 19 | Proceedings of the Institution of Mechanical Engineers Part B-Journal of Engineering Manufacture | 12 | 19 | 0.63 | 518 | 19 | 2002 |
| 20 | Polymer | 12 | 19 | 1.71 | 507 | 19 | 2014 |
Table 8.
Top 20 Journals with the Maximum Number of Articles (Productive)
| S. No. | Source | h_index | g_index | m_index | TC | NP | FPY |
|---|---|---|---|---|---|---|---|
| 1 | Rapid Prototyping Journal | 38 | 74 | 1.46 | 6270 | 246 | 1995 |
| 2 | Additive Manufacturing | 26 | 42 | 4.33 | 2344 | 157 | 2015 |
| 3 | International Journal of Advanced Manufacturing Technology | 28 | 46 | 1.22 | 2445 | 126 | 1998 |
| 4 | Materials | 18 | 29 | 3.00 | 1081 | 116 | 2015 |
| 5 | Polymers | 13 | 18 | 2.60 | 481 | 88 | 2016 |
| 6 | Materials & Design | 30 | 60 | 1.58 | 3712 | 69 | 2002 |
| 7 | Composites Part B-Engineering | 19 | 37 | 3.17 | 1388 | 45 | 2015 |
| 8 | International Journal of Pharmaceutics | 22 | 42 | 3.14 | 1993 | 42 | 2014 |
| 9 | Journal of Applied Polymer Science | 8 | 21 | 0.44 | 465 | 38 | 2003 |
| 10 | 3D Printing and Additive Manufacturing | 8 | 16 | 1.14 | 300 | 34 | 2014 |
| 11 | Applied Sciences-Basel | 6 | 10 | 1.50 | 130 | 31 | 2017 |
| 12 | Journal of Manufacturing Processes | 12 | 21 | 2.00 | 490 | 29 | 2015 |
| 13 | Polymer Testing | 10 | 22 | 1.25 | 488 | 28 | 2013 |
| 14 | Journal of Manufacturing Science and Engineering-Transactions of the ASME | 12 | 24 | 0.55 | 593 | 25 | 1999 |
| 15 | Virtual and Physical Prototyping | 11 | 18 | 2.20 | 363 | 25 | 2016 |
| 16 | Journal of Materials Processing Technology | 20 | 23 | 0.80 | 1950 | 23 | 1996 |
| 17 | Journal of Thermoplastic Composite Materials | 6 | 8 | 2 | 81 | 22 | 2018 |
| 18 | Scientific Reports | 8 | 20 | 1.60 | 604 | 20 | 2016 |
| 19 | ACS Applied Materials & Interfaces | 10 | 19 | 1.43 | 545 | 19 | 2014 |
| 20 | Polymer | 12 | 19 | 1.71 | 507 | 19 | 2014 |
According to Bradford's law24 when journals or sources are arranged in decreasing order of the number of articles on a particular domain, then for the same number of articles, sources are divided in the form of zones, which follow the geometric progression 1:n:n2:n3. The very first zone in this outcome is basically the core or nucleus of that domain and has a major contribution to it. When applied to 676 sources with their respective number of articles, it was found that the first 11 sources out of top 20 in Table 7 are the core sources and are in zone 1. Table 9 shows the 11 core sources in zone 1 with their corresponding rank, frequency (number of articles), recent impact factor, and publishing house. Elsevier is the publishing house of four core source journals, while Emerald is publishing for the Rapid Prototyping Journal, which is leading the list. The graphical result of the same is represented in Figure 7.
Table 9.
Core Sources Contributing Toward Fused Deposition Modeling (Zone 1)
| Rank | Journal | NP | Impact factor | Publishing house |
|---|---|---|---|---|
| 1 | Rapid Prototyping Journal | 246 | 3.714 | Emerald Group Publishing Ltd. |
| 2 | Additive Manufacturing | 157 | 7.002 | Elsevier |
| 3 | International Journal of Advanced Manufacturing Technology | 126 | 2.633 | Springer London |
| 4 | Materials | 116 | 3.057 | MDPI AG |
| 5 | Polymers | 88 | 3.426 | MDPI AG |
| 6 | Materials & Design | 69 | 6.289 | Elsevier |
| 7 | Composites Part B-Engineering | 45 | 7.635 | Elsevier |
| 8 | International Journal of Pharmaceutics | 42 | 4.845 | Elsevier |
| 9 | Journal of Applied Polymer Science | 38 | 2.520 | John Wiley and Sons, Inc. |
| 10 | 3D Printing and Additive Manufacturing | 34 | 3.579 | Mary Ann Liebert, Inc. |
FIG. 7.

Sources impact using Bradford's Law (x axis represents the number of articles, while y axis represents the sources contributing the same).
Institutions and countries
The top 20 institutions working in the field of FDM in terms of the number of articles and citations are shown in Tables 10 and 11, respectively. The citations in the tables are shown as Total Local Citation Score (TLCS) and Total Global Citation Score (TGCS). TLSC is the number of times an article is referred within the articles of the same collection,25 while TGCS is the number of times it is referred in the WOS collection. Guru Nanak Dev's Engg Coll is first in the list of articles and is at the 12th position in the global citation list. The National University of Singapore is at the top in the list of the number of global citations and is also third when it comes to the number of articles. The countries leading in the same fields are shown in Tables 12 and 13, respectively. The United States is at the top of both lists, China is more productive than the United Kingdom, but on the contrary, the United Kingdom is more influential than China with a relatively lesser number of articles.
Table 10.
Top 20 Most Institutions with the Maximum Number of Global Citations (Influential)
| S. No. | Institution | NP | TLCS | TGCS |
|---|---|---|---|---|
| 1 | National University of Singapore | 35 | 299 | 3313 |
| 2 | University College of London, United Kingdom | 23 | 515 | 1793 |
| 3 | FabRx Pvt. Ltd, London, United Kingdom | 16 | 515 | 1692 |
| 4 | Swinburne University Technology, Australia | 36 | 593 | 1584 |
| 5 | University of Texas El Paso, U.S. | 33 | 366 | 1432 |
| 6 | National University Hospital, Singapore | 4 | 129 | 1282 |
| 7 | University of California, Berkeley, U.S. | 11 | 415 | 1265 |
| 8 | Gyeongsang National University, South Korea | 5 | 524 | 1169 |
| 9 | Temasek Polytechnic, Singapore | 3 | 191 | 2176 |
| 10 | Nanyang Technological University, Singapore | 28 | 244 | 1019 |
| 11 | University of Central Lancashire, United Kingdom | 12 | 310 | 853 |
| 12 | Guru Nanak Dev Engineering College, Ludhiana, India | 92 | 326 | 848 |
| 13 | Natl Inst Foundry & Forge Technol, India | 9 | 404 | 810 |
| 14 | Rutgers State University, New Jersey, U.S. | 16 | 195 | 667 |
| 15 | Zhejiang University, Hangzhou, China | 33 | 131 | 627 |
| 16 | Chinese Academy of Sciences, Beijing, China | 32 | 176 | 592 |
| 17 | Texas Tech University, Texas, U.S. | 4 | 245 | 588 |
| 18 | University of Minho, Gualtar, Portugal | 12 | 206 | 573 |
| 19 | University of Illinois, Chicago, U.S. | 9 | 72 | 570 |
| 20 | Georgia Institute of Technology, U.S. | 24 | 130 | 562 |
TGCS, Total Global Citation Score; TLCS, Total Local Citation Score.
Table 11.
Top 20 Most Institutions with the Maximum Number of Articles (Productive)
| S. No. | Institution | NP | TLCS | TGCS |
|---|---|---|---|---|
| 1 | Guru Nanak Dev Engineering College, Ludhiana, India | 92 | 326 | 848 |
| 2 | Swinburne University Technology, Australia | 36 | 593 | 1584 |
| 3 | National University of Singapore | 35 | 299 | 3313 |
| 4 | University of Texas El Paso, U.S. | 33 | 366 | 1432 |
| 5 | Zhejiang University, Hangzhou, China | 33 | 131 | 627 |
| 6 | Chinese Academy of Sciences, Beijing, China | 32 | 176 | 592 |
| 7 | Nanyang Technological University, Singapore | 28 | 244 | 1019 |
| 8 | Georgia Institute of Technology, U.S. | 24 | 130 | 562 |
| 9 | Punjabi University, Patiala, Punjab | 24 | 77 | 172 |
| 10 | University College of London | 23 | 515 | 1793 |
| 11 | Virginia Tech, U.S. | 23 | 99 | 412 |
| 12 | University of Chinese Academy of Sciences, China | 22 | 146 | 404 |
| 13 | University of Delaware, U.S. | 22 | 120 | 413 |
| 14 | Warsaw University of Technology, Poland | 22 | 15 | 301 |
| 15 | University of Alberta, Canada | 21 | 44 | 140 |
| 16 | University of Salerno, Italy | 21 | 115 | 399 |
| 17 | University of Wisconsin-Madison, U.S. | 21 | 73 | 252 |
| 18 | Massachusetts Institute of Technology, U.S. | 20 | 183 | 433 |
| 19 | Sichuan University, China | 19 | 30 | 221 |
| 20 | University of Leoben, Austria | 19 | 71 | 222 |
Table 12.
Top 20 Most Countries with the Maximum Number of Global Citations (Influential)
| S. No. | Country | Recs | TGCS | TLCS |
|---|---|---|---|---|
| 1 | The United States | 716 | 15710 | 4232 |
| 2 | The United Kingdom | 218 | 6857 | 1477 |
| 3 | People's Republic of China | 434 | 6386 | 1518 |
| 4 | Singapore | 78 | 4683 | 618 |
| 5 | Italy | 172 | 4167 | 1339 |
| 6 | India | 240 | 3909 | 1388 |
| 7 | Australia | 113 | 2985 | 746 |
| 8 | Germany | 170 | 2357 | 328 |
| 9 | Spain | 146 | 2156 | 392 |
| 10 | South Korea | 123 | 1715 | 452 |
| 11 | Canada | 108 | 1421 | 504 |
| 12 | Wales | 18 | 1393 | 532 |
| 13 | Poland | 95 | 1344 | 309 |
| 14 | France | 112 | 1087 | 213 |
| 15 | Denmark | 26 | 914 | 324 |
| 16 | Portugal | 43 | 829 | 269 |
| 17 | New Zealand | 29 | 714 | 205 |
| 18 | Taiwan | 60 | 709 | 179 |
| 19 | Japan | 42 | 703 | 86 |
| 20 | Brazil | 59 | 695 | 186 |
Table 13.
Top 20 Most Countries with the Maximum Number of Articles (Productive)
| S. No. | Country | NP | TGCS | TLCS |
|---|---|---|---|---|
| 1 | The United States | 716 | 15710 | 4232 |
| 2 | People's Republic of China | 434 | 6386 | 1518 |
| 3 | India | 240 | 3909 | 1388 |
| 4 | The United Kingdom | 218 | 6857 | 1477 |
| 5 | Italy | 172 | 4167 | 1339 |
| 6 | Germany | 170 | 2357 | 328 |
| 7 | Spain | 146 | 2156 | 392 |
| 8 | South Korea | 123 | 1715 | 452 |
| 9 | Australia | 113 | 2985 | 746 |
| 10 | France | 112 | 1087 | 213 |
| 11 | Canada | 108 | 1421 | 504 |
| 12 | Poland | 95 | 1344 | 309 |
| 13 | Singapore | 78 | 4683 | 618 |
| 14 | Taiwan | 60 | 709 | 179 |
| 15 | Brazil | 59 | 695 | 186 |
| 16 | Iran | 57 | 607 | 141 |
| 17 | Portugal | 43 | 829 | 269 |
| 18 | Japan | 42 | 703 | 86 |
| 19 | Switzerland | 42 | 558 | 70 |
| 20 | Belgium | 41 | 499 | 149 |
Interconnections among authors, countries, sources, and universities
Interrelations between three different fields are represented by three-field plots and are also known as Sankey diagram. Figure 8 represents the interrelations among the top 10 authors, countries, and sources in terms of productivity. From the figure, it can be seen that the United States and China have articles in every source. The major chunk of articles from the United States is in the Rapid Prototyping and Additive Manufacturing Journals. Singh from India has single handedly contributed toward a number of articles, which means that in India, a major number of research articles are contributed by a handful of authors, while in the United States, it has been uniformly distributed. Therefore, although the United States tops the list with regard to the number of articles, none of the authors of the United States is in the top 10 (Fig. 8) list of individual production. The plot also shows the collaborations among authors of different countries. Figure 9 represents author with university and countries. The United States leads the way in production and diversity, with its 4 universities (Texas, Virginia, Michigan, and Delaware) out of 10. While in China and Australia, it is mainly associated with a single university (Zhejiang and Swinburne, respectively) and author (Wang and Masood). Interestingly, Hutmacher, who is currently working in Queensland University, Australia, has many publications associated with the National University of Singapore, from where he obtained his PhD. The University of Leoben, Austria, made it to the list due to its association with countries such as Germany and Spain, same goes with the Singapore universities National and Nanyang with their respective associations with the United States, the United Kingdom, France, Korea, Italy, Germany, India, and Spain. While in India, the publications are dominated by one group of authors and university (Guru Nanak Dev).
FIG. 8.

Three-field plot representing authors, countries, and sources (Sankey diagram representing three distinguished fields).
FIG. 9.

Three-field plot representing author, university, and countries.
Most cited documents
The documents under this category are top globally and locally cited documents. Local and global citations are already explained before. So, the top 20 documents with their citations and digital object identifier (DOI) are shown in Table 14 (decreasing order of globally cited) and Table 15 (decreasing order of locally cited). From the table, it can be seen that the article written by Zein in 2002 has the highest global citations, but 10th in the list of local citations. Surprisingly, the article by Hutmacher (2001), which is second in the list of highest global citations, has zero local citations, and the article by Ans (2002) is highest in the list of local citations and also third highest in the list of global citations.
Table 14.
Top 20 Globally Cited Documents
| S. No. | Document | DOI | Global citations | Local citations |
|---|---|---|---|---|
| 1 | Zein (2002), Biomaterials | 10.1016/S0142-9612(01)00232-0 | 1049 | 117 |
| 2 | Hutmacher (2001), J Biomed Mater Res | 10.1002/1097-4636(200105)55:2 ≤ 203::AID-JBM1007 ≥ 3.0.CO;2-7 | 1004 | 0 |
| 3 | Ahn (2002), Rapid Prototyping J | 10.1108/13552540210441166 | 905 | 400 |
| 4 | Pham (1998), Int J Mach Tool Manu | 10.1016/S0890-6955(97)00137-5 | 460 | 66 |
| 5 | Ning (2015), Compos Part B-Eng | 10.1016/j.compositesb.2015.06.013 | 440 | 175 |
| 6 | Sood (2010), Mater Design | 10.1016/j.matdes.2009.06.016 | 417 | 229 |
| 7 | Sun (2008), Rapid Prototyping J | 10.1108/13552540810862028 | 409 | 235 |
| 8 | Lewis (2006), J Am Ceram Soc | 10.1111/j.1551-2916.2006.01382.x | 355 | 8 |
| 9 | Zocca (2015), J Am Ceram Soc | 10.1111/jace.13700 | 301 | 9 |
| 10 | Jones (2011), Robotica | 10.1017/S026357471000069X | 293 | 51 |
| 11 | Mohamed (2015), Adv Manuf | 10.1007/s40436-014-0097-7 | 290 | 134 |
| 12 | Anitha (2001), J Mater Process Tech | 10.1016/S0924-0136(01)00980-3 | 284 | 131 |
| 13 | Bellini (2003), Rapid Prototyping J | 10.1108/13552540310489631 | 280 | 138 |
| 14 | Zhong (2001), Mat Sci Eng A-Struct | 10.1016/S0921-5093(00)01810-4 | 270 | 110 |
| 15 | Kalita (2003), Mater Sci Eng C Mater Biol Appl | 10.1016/S0928-4931(03)00052-3 | 268 | 42 |
| 16 | Thrimurthulu (2004), Int J Mach Tool Manu | 10.1016/j.ijmachtools.2003.12.004 | 261 | 101 |
| 17 | Espalin (2014), Int J Adv Manuf Tech | 10.1007/s00170-014-5717-7 | 258 | 46 |
| 18 | Chacon (2017), Mater Design | 10.1016/j.matdes.2017.03.065 | 255 | 142 |
| 19 | Lee (2005), J Mater Process Tech | 10.1016/j.jmatprotec.2005.02.259 | 253 | 110 |
| 20 | Macdonald (2014), IEEE Access | 10.1109/ACCESS.2014.2311810 | 249 | 24 |
DOI, Digital Object Identifier.
Table 15.
Top 20 Locally Cited Documents
| S. No. | Document | DOI | Local citations | Global citations |
|---|---|---|---|---|
| 1 | Ahn (2002), Rapid Prototyping J | 10.1108/13552540210441166 | 400 | 905 |
| 2 | Sun (2008), Rapid Prototyping J | 10.1108/13552540810862028 | 235 | 409 |
| 3 | Sood (2010), Mater Design | 10.1016/j.matdes.2009.06.016 | 229 | 417 |
| 4 | Ning (2015), Compos Part B-Eng | 10.1016/j.compositesb.2015.06.013 | 175 | 440 |
| 5 | Chacon (2017), Mater Design | 10.1016/j.matdes.2017.03.065 | 142 | 255 |
| 6 | Bellini (2003), Rapid Prototyping J | 10.1108/13552540310489631 | 138 | 280 |
| 7 | Mohamed (2015), Adv Manuf | 10.1007/s40436-014-0097-7 | 134 | 290 |
| 8 | Carneiro (2015), Mater Design | 10.1016/j.matdes.2015.06.053 | 132 | 245 |
| 9 | Anitha (2001), J Mater Process Tech | 10.1016/S0924-0136(01)00980-3 | 131 | 284 |
| 10 | Zein (2002), Biomaterials | 10.1016/S0142-9612(01)00232-0 | 117 | 1049 |
| 11 | Sood (2009), Mater Design | 10.1016/j.matdes.2009.04.030 | 115 | 240 |
| 12 | Wu (2015), Materials | 10.3390/ma8095271 | 111 | 204 |
| 13 | Zhong (2001), Mat Sci Eng A-Struct | 10.1016/S0921-5093(00)01810-4 | 110 | 270 |
| 14 | Lee (2005), J Mater Process Tech | 10.1016/j.jmatprotec.2005.02.259 | 110 | 253 |
| 15 | Dawoud (2016), J Manuf Process | 10.1016/j.jmapro.2015.11.002 | 102 | 166 |
| 16 | Thrimurthulu (2004), Int J Mach Tool Manu | 10.1016/j.ijmachtools.2003.12.004 | 101 | 261 |
| 17 | Nikzad (2011), Mater Design | 10.1016/j.matdes.2011.01.056 | 100 | 196 |
| 18 | Masood (2004), Mater Design | 10.1016/j.matdes.2004.02.009 | 98 | 220 |
| 19 | Lee (2007), J Mater Process Tech | 10.1016/j.jmatprotec.2006.11.095 | 97 | 219 |
| 20 | Ahn (2009), J Mater Process Tech | 10.1016/j.jmatprotec.2009.05.016 | 96 | 194 |
Keywords and keyword plus in WOS database related to FDM articles
Author keywords and keyword plus are the two different word features provided by the WOS database. The former represents the keywords used in one's article, while the latter is extracted from the title of cited references in the WOS database.26 Although keyword plus can be used for BA for gaining useful insights, it is less effective in representing the content of an article. The top 20 keywords extracted with the help of VOSviewer software from the articles and their co-occurrence network are shown in Figure 10. The size of the node represents the frequency of the words used in articles. “3d printing” is the most used keyword followed by “additive manufacturing.” Therefore, the dark lines in the figure represent the network of 3D printing with respect to other keywords, while the light lines show the interconnections of the rest of the keywords. Some words are repeated multiple times due to changed spelling and acronyms used by different researchers. So, to avoid this ambiguity, the keyword plus feature was used to better understand the research and application area of FDM. Figure 11 represents the growth of keyword plus over the years, represented by the y-axis, while the x-axis represents the annual occurrences, the software drew the best fitted curve, there is an increase from 2013 due to the increase in the number of articles (Fig. 4). Figure 12 represents the three-field plot representing authors, keyword plus, and countries. From the figure, it can be inferred that top authors and countries are uniformly working in all the fields represented by keyword plus.
FIG. 10.

Co-occurrence network of keywords (size of node represents the frequency of keywords).
FIG. 11.

Growth of keyword plus over the years (represents the occurrences of keyword plus over the years).
FIG. 12.

Three-field plot representing authors, keyword plus, and countries.
Bibliometric coupling
Bibliometric coupling is defined as the connection between two articles from respective countries, which have used a common reference. This coupling was broadly defined in two categories by Kessler in 1962.27 Category 1 is the group A in which the different articles are coupled by one particular article (P) in that group and strength of the coupling units is defined as the number of connections between P and other articles in the group. Category 2 is group B in which all the articles are connected with each other at least once. The bibliometric coupling between the top 20 countries in terms of the number of citations (Table 12) is shown in Figure 13. The dark lines show the interconnections of the United States with respect to other countries as it is the one having maximum citations and link strength, while the light lines show the interconnections between the rest. The diameter of the node represents the link strength of the coupling units, which means that articles of the United States are cited majorly all over the world.
FIG. 13.

Bibliometric coupling of top 20 countries having highest citations (size of node represents the link strength of countries).
Trend topics
The trend topic represents the sequence of topics explored with respect to the phase of past, present, and their connection with the future. Basically, it helps in identifying the current research area and potential domain, to be focused and explored upon. Figure 14 represents the trend topics over the years. In the initial phase from 2003 to 2005, the research was mainly focused on part orientation, and volumetric error, the corresponding frequency that is represented in x-axis was also low due to the lesser number of articles. From 2007 to 2011, it was focused upon rapid prototypes or rapid prototyping with medium frequency. Similar to word growth described above, from 2013, there is an increase in topics of research due to greater exploration of FDM. The major research in terms of frequency is mainly in the mechanical properties of the 3D-printed product, optimization of printing parameters, dimensional accuracy of the end product, testing of different materials as filament for improved properties, and so on. The other field in which FDM is highly used and explored upon is the medical field, especially for tablets, scaffolds, tissues, and so on. Based on the inferences from the trend topics, the materials and their corresponding application with respect to highly cited articles are further discussed in the next section.
FIG. 14.

Trend topics over the years (represents the logarithmic frequency of the topic trend over the years).
Materials and Application of FDM
Materials used since the inception of FDM were mostly polymers such as acrylonitrile butadiene styrene (ABS),28–35 PCL,18,19,36 and polylactic acid (PLA),37,38 initially due to various properties such as the ease with which they can be printed, the low range of melting temperature of the order of 250°C, low cost, biocompatible, and chemical resistance. Table 16 shows the extrusion, bed, and glass transition temperature of the frequent filament materials used in FDM. Extrusion temperature is the temperature at which a material is extruded from the nozzle also known as hot end temperature of the heater block. Bed temperature is the temperature of the platform on which a material is deposited, and bed heating helps in easy removal of the part, once it is fully printed. While glass transition temperature represents the temperature at which transition of the material from glassy to rubbery state starts to take place.39 The material is in stiff solid phase below this temperature and subcooled to liquid or elastic solid above this temperature. Elastic modulus of the material changes at this temperature resulting in phase transition. From the table it can be clearly seen that maximum extrusion temperature is about 315°C, while average is around 250°C. Therefore, the material is well suited for the FDM printer and all the materials in the table have a range of extrusion or melting temperature since the materials are amorphous, which have no fixed melting temperature.
Table 16.
Extrusion, Bed, and Glass Transition Temperature of the Fused Deposition Modeling Filament Material
| S. No. | Filament material | Extrusion temperature °C (Te) | Bed temperature °C | Glass transition temperature °C (Tg) |
|---|---|---|---|---|
| 1 | ABS | 220–240 | 80–110 | 105–110 |
| 2 | PLA | 180–220 | 20–55 | 50–80 |
| 3 | HIPS | 220–230 | 50–60 | 100 |
| 4 | TPU | 230–260 | 40–60 | 60 |
| 5 | PETG | 230–255 | 55–70 | 70–80 |
| 6 | Nylon | 235–270 | 60–80 | 47–60 |
| 7 | PC | 270–315 | 90–120 | 145–150 |
ABS, acrylonitrile butadiene styrene; HIPS, high-impact polystyrene; PC, polycarbonate; PETG, polyethylene terephthalate glycol; PLA, polylactic acid; TPU, thermoplastic polyurethane.
With the course of time, various other materials such as carbon fibers,40–44 glass fibers,45 carbon nanotube (CNT),46–48 graphene,49–51 and other polymers,52–59 and metal60–62 were reinforced in polymer filaments (ABS and PLA) to form composites to enhance their properties, resulting in a wide range of applications. Some researchers have also successfully deposited low melting point metal alloys especially solders1,63–65 using a 3D printer, and this technology is known as FDM for metals (FDMm). The application of FDMm is in the printing of 3D electronic circuits,1,44,66 complex prototypes of tool, mold and dies, and so on. FDM is also currently being utilized for extruding and depositing the industrial-grade plastics such as PEEK (polyether ketone), having melting temperature around 350°C.52 Another important application of FDM is in the medical field in 3D printing tablets,67–80 drug loading and delivery,81–92 scaffolds,18,37,58,93–114 implants,115,116 and so on. Therefore, it can be clearly inferred that apart from applications such as rapid prototyping and rapid tooling, FDM is playing an important role in the medical field. Table 17* shows the summary of the top globally cited articles (citations >200) on FDM with materials, temperatures, and applications. The articles are divided into two major headings based on the end application: (1) Medical domain and (2) Aerospace, automobile, prototyping, and so on. Although there are some more application areas of FDM such as electronics, fashion, and food, the articles under those categories are not highly cited. Therefore, these application areas are not discussed in detail in the following sections. The articles are arranged in decreasing order of their citations under each heading in Table 17.† Under the medical domain, among the top cited articles, PCL and polyvinyl alcohol are widely used as a filament material, while ABS, PLA, and other polymers composited were dominant in other headings. All the articles that are in Table 14 are not included in Table 17, since some of the top articles have discussed the technology of FDM in their articles in general.
Table 17.
Summary of Most Globally Cited Articles on Fused Deposition Modeling with Materials, Temperature, and Applications Under Two* Heads (Citations >200)
| S. No. | Author and year | Filament materials used in FDM | Extrusion temperature | Applications |
|---|---|---|---|---|
| Medical domain | ||||
| 1 | Zein, et al. (2002)19 | PCL | 125°C | Tissue engineering |
| 2 | Hutmacher et al. (2001)18 | PCL | 120°C | Scaffolds |
| 3 | Kalita et al. (2003)93 | TCP and PP | Not mentioned | Scaffold |
| 4 | Goyanes et al. (2014)67 | PVA loaded with fluorescein | 220°C | Tablets |
| 5 | Goyanes et al. (2015)68 | PVA mixed with paracetamol | 180°C | Tablets of different shapes and geometry affecting drug release |
| 6 | Skowyra et al. (2015)83 | PVA loaded with prednisolone | 230°C | Drug release |
| 7 | Goyanes et al. (2015)69 | PVA loaded with 5-ASA and 4 ASA mixed with ethanol and covered with parafilm | 210°C | Customized medicines and modified oral drug release |
| 8 | Goyanes et al. (2015)70 | PVA loaded with paracetamol | 180°C | Devices containing multiple drugs and unique release properties |
| Aerospace, automobile, prototyping, and so on | ||||
| 9 | Ning et al. (2015)40 | ABS with CF infills | 220°C | High strength and load-bearing components in aerospace, and so on |
| 10 | Sun et al. (2008)117 | P400-ABS | 270°C | Rapid prototyping and development of new materials for FDM |
| 11 | Lewis et al. (2006)118 | Ceramic (filament-based direct ink) | Not mentioned | Advanced composites |
| 12 | Carneiro OS, et al. (2015)119 | PP and glass fiber-reinforced PP | 190°C–230°C | High temperature and stiffness applications in automobile, and so on |
| 13 | Tian et al. (2016)120 | PLA reinforced with CF to form composites | 180°C–240°C | Aerospace and aviation |
| 14 | Matsuzaki et al. (2016)121 | PLA—carbon or jute fiber bundle composites | 210°C | Automobile and aerospace |
| 15 | Masood and Song (2004)60 | P301 Nylon/iron composite | Notmentioned | Rapid tooling, injection molding inserts |
ASA, aminosalicylic acid; CF, carbon fibers; PCL, polycaprolactone; PP, polypropylene; PVA, polyvinyl alcohol; TCP, tricalcium phosphate.
Printing Parameters and Mechanical Properties
The optimum input printing parameter setting leads to improved mechanical properties, which result in superior performance of the FDM parts. Table 18 summarized the top cited articles (citations >200) that have explored important printing parameters and the subsequent improvement in mechanical properties of the printed part. It can be clearly inferred that raster orientation is the frequently explored printing parameter followed by layer thickness and air gap. These parameters also have a profound impact on the mechanical properties such as tensile, compressive, and flexural strength of the FDM-printed part. Raster or part orientation of (45°,45°) and (0°,90°) are the optimum ones for improving the mechanical properties, while negative air gap increases stiffness and strength. Reinforcing polymer filament with other polymers and metals also has a significant effect in improving the mechanical properties.
Table 18.
Summary of Most Globally Cited Articles on Fused Deposition Modeling with Reference to Material Properties and Printing Parameters (Citations >200)
| S. No. | Author and year | Filament material | Printing parameters (input) | Mechanical properties (output response) | Inferences |
|---|---|---|---|---|---|
| 1 | Ahn et al. (2002)29 | P400-ABS | Air gap Raster orientation Extrusion temperature Filament color Road width |
Tensile strength Compressive strength |
FDM-printed part properties compared with injection molding component Raster orientation and air gap influence tensile strength, while air gap influences compressive strength Tensile strength 65–72% and compressive strength 80–90% of injected molded ABS |
| 2 | Bellini and Güçeri (2003)30 | ABS | Raster orientation Deposition path |
Tensile strength Bending strength |
Both selected input parameters have significant effect on mechanical properties |
| 3 | Zhong et al. (2001)45 | ABS reinforced with short glass fiber | Different compositions of ABS composite | Hardness Strength |
Hardness and strength of ABS increased after reinforcing it with short glass fiber, while there is reduction in flexibility and handleability Plasticizer and compatibilizer are added to regain the lost properties. |
| 4 | Thrimurthulu et al. (2004)31 | ABS | Part orientation | Surface finish Deposition time |
Genetic code developed for obtaining optimum part orientation during deposition, resulting in good surface finish and lesser deposition time |
| 5 | Caminero et al. (2017)122 | PLA | Raster/build orientation Layer thickness Feed rate |
Tensile strength Bending strength |
Upright orientations of the part have the poorest of mechanical properties, while flat and on-edge have the highest stiffness and strength For upright orientations on increasing layer thickness, tensile and flexural strength increases, while it does not have significant effect in the case of flat and edge-on For upright orientations on increasing feed rate, tensile and flexural strength increases, while it has a little significant effect in the case of flat and edge-on |
| 6 | Lee et al. (2005)32 | ABS | Air gap Raster orientation Raster width Layer thickness |
Throwing distance (elastic performance) | Air gap, raster orientation, and layer thickness have significant influence on the flexibility of the ABS |
| 7 | Lee et al. (2007)33 | ABS | Air gap Raster orientation Extrusion temperature Filament color Road/bead width |
Compressive strength | Build direction has the most significant effect on the mechanical property Axial specimen has more compressive strength than transverse specimen Compressive strength of FDM-printed part is lower compared with conventional process |
| 8 | Wu et al. (2015)52 | Polyether ketone (PEEK) and ABS | Raster orientation/angle Layer thickness |
Tensile strength Compressive strength Bending strength |
Raster angle 0° and layer thickness 300 μm resulted in optimum mechanical properties of 3D-printed PEEK The tensile, compressive, and bending strength of PEEK is superior to ABS |
| 9 | Shofner et al. (2003)46 | ABS mixed with VGCF'S | Raster orientation | Tensile strength Stiffness |
VGCF incorporation in ABS resulted in increased tensile strength, stiffness, and modulus compared with plain ABS However, fracture mode changed to brittle from ductile due to reduced interlayer fusion, which is further improved by magnum ABS |
3D, three-dimensional; PEEK, polyether ketone; VGCFs, vapor grown carbon fibers.
Research Trends and Future Scope
The first point covered under research trend and future scope is “printing parameters and mechanical properties” which is the basic of FDM process and forms the basis of the application. The second and third points are two important application domains of FDM. The articles reviewed for writing this section have citations greater than 200.
Printing parameters and mechanical properties
Optimization of printing parameters and improvement in mechanical properties of the material used in FDM are a field that required continuous research. Raster orientation, layer thickness, and airgap are the parameters mostly explored. The need is to find the effect of more input parameters such as infill density, print speed, and shell thickness in improving the mechanical properties. Also, the effect of lower layer thickness in the case of different raster orientation must be explored upon. Research on new polymers or metals to be added to the existing filament for improving mechanical properties is of vital interest. Once the parameters are optimized, keeping the application area in mind, the parameter setting can be done, which helps in improving the mechanical properties.
Medical domain
A lot has been achieved in the medical field through FDM technology, authors have done great work in the field of 3D printing of tablets, drug loading on filament, drug delivery, design and 3D printing of devices with multiple containers, complex scaffold fabrication for bone tissue, breast reconstruction, and so on. The current research and results will open a new window of scope for the future. The future scope in this domain lies in the innovative design of tablets that can facilitate better drug release with new specific pharmacokinetic characteristics and also developing a flexible dose with multiple containers for drugs. Coming to implants and scaffolds, research is going on to develop biodegradable and customized implants for breast reconstruction with modified mechanical and architectural properties. Advanced AM techniques such as MEW can be utilized for a wide variety of biomedical applications.
Aerospace, automobile, prototyping, and so on.
The lightweight material with significant mechanical properties is of great use in the aerospace and automobile sector, as it leads to better performance, fuel economy, and ultimately results in cost saving. The FDM machine utilizes the properties of two different materials, which are formed by combining them in a single filament and 3D printing the customized geometry. Research has been carried out in this direction by adding carbon fibers in existing polymer filaments such as ABS and PLA, which resulted in improved mechanical properties such as Young's modulus and tensile strength, and desirable for lightweight applications. However, addition of carbon fibers after a certain percentage (around 10%) resulted in porosity issue and reduction in ductility, toughness, and yield strength. So future research should be focused upon developing new FDM materials by experimentally combining existing FDM materials with new polymers, carbon fibers, CNT, metals, and so on for getting the desired properties without compromising the existing mechanical properties. Another important area of research pertaining to lightweight application is the optimization of FDM printing parameters of high melting point industrial-grade material. The mechanical properties of industrial grade plastic obtained through FDM are almost half when compared with injection molding. So, a lot of scope of improvement lies in it.
Conclusion
The BA of 2793 documents, extracted from WOS, was done. The FDM technology can be traced back to 1988 with the first article in 1994, while the surge in the number of articles started close to 2014 due to expiration of the patent in 2009. There was constant growth in the number of articles with maximum number in the year 2020. Among the authors of articles extracted, Hutmacher is the author having the maximum citations (3055), while Singh leads in the number of articles (104). The K–S test was performed on author's data to verify its conformity to Lotka's law. Interestingly, it was also inferred that the Lotka's law was not felicitous to countries such as the United States, which leads in the number of articles because in the United States, the articles are collectively contributed by a number of authors. In the Journal Contributions and Bradford's Law section, Rapid Prototyping Journal leads in both categories of number of citations (6270) and articles (246). Bradford's law helps in identifying the 11 course sources in zone 1, with the Elsevier publishing house leading the way with four journals. Coming to the institutions, the National University of Singapore has the highest number of citations (3313), while Guru Nanak Dev Engineering College has the highest number of articles (92). In countries, the United States leads in both categories (15,710 citations and 716 articles). Due to the highest number of citations, the United States is also the one having a maximum bibliometric coupling of articles. The most globally cited documents (1049 citations) belong to Zein, published in the year 2002, in Biomaterials Journal. “3d Printing” is the most used author keyword, while “Mechanical properties” is the one in the keyword plus category. Mechanical properties' improvement depends on the printing parameter orientation. Raster orientation, air gap, and layer thickness are the widely explored parameters. In a nutshell, FDM has various application domains, which include medical, aerospace, automobile, electrical, food, fashion, and so on. However, the highly cited works are in the area of mechanical properties, printing parameters, medical, aerospace, automobile, and so on. Based on research trend and future scope, the following research problems are to be focused upon in the future. First, exploring different printing parameters, and their optimization and effect on mechanical properties for new materials. Second, the development of a complex and customized scaffold design, and an innovative design for 3D printing capsule with multiple containers with reference to medical domain. Third, parameter optimization of high melting point industrial-grade material in the FDM printer, and mixing and reinforcing of new materials in the existing filament for inheriting the properties of multiple materials to be utilized for light weight applications in aerospace and automobile industries.
Footnotes
Correction added on November 19, 2021 after first online publication of August 2, 2021: The title for Table 5 was erroneously titled as: “Top 20 Authors with the Maximum Number of Articles (Productive).” The title has been corrected to: “Documents written corresponding to the number of authors.”
Correction added on December 20, 2021 after first online publication of August 2, 2021; Table 14 was erroneously listed. The text has been corrected to list Table 17.
Correction added on November 19, 2021 after first online publication of August 2, 2021: The title for Table 17 was erroneously titled as: “Summary of Most Globally Cited Articles on Fused Deposition Modeling with Materials, Temperature, and Applications Under Three Heads (Citations >200).” The title has been corrected to: “Summary of Most Globally Cited Articles on Fused Deposition Modeling with Materials, Temperature, and Applications Under Two Heads (Citations >200).”
Authors' Contributions
Mr. Rishi generated the data base, filtered it and analyzed the data. He also prepared all the figures and wrote all the relevant explanations in the manuscript. Dr. Prateek was responsible for doing the review of papers related to the field of Mechanical and materials. He also contributed in the section related to the material used in related technology. Dr. Varun prepared the review section related to the biomedical area. He was responsible for drafting sections related to biomedical covering different materials used in related area.
Author Disclosure Statement
No competing financial interests exist.
Funding Information
The work presented in this article is funded by the Science & Engineering Research Board (SERB). Grant no. (CRG/2019/001320).
References
- 1. Mireles J, Kim HC, Lee IH, et al. Development of a fused deposition modeling system for low melting temperature metal alloys. J Electron Packag 2013;135:1–6. [Google Scholar]
- 2. Crump SS. Apparatus and method for creating three-dimensional objects. United States Pat, US00521329A. Published online 1992. DOI: 10.2116/bunsekikagaku.28.3_195. [DOI] [Google Scholar]
- 3. Falck R, Dos Santos JF, Amancio-Filho ST. An overview on the materials and mechanical behavior used in fused deposition modeling. Annu Tech Conf—ANTEC, SPE ANTEC® Anaheim Conf Proc 2017; May 2017:1689–1695. [Google Scholar]
- 4. Turner BN, Strong R, Gold SA. A review of melt extrusion additive manufacturing processes: I. Process design and modeling. Rapid Prototyp J 2014;20:192–204. [Google Scholar]
- 5. Masood SH. Intelligent rapid prototyping with fused deposition modelling. Rapid Prototyp J 1996;2:24–33. [Google Scholar]
- 6. Shahrubudin N, Lee TC, Ramlan R. An overview on 3D printing technology: Technological, materials, and applications. Procedia Manuf 2019;35:1286–1296. [Google Scholar]
- 7. Chen T, Lin YC. Feasibility evaluation and optimization of a smart manufacturing system based on 3D printing: A review. Int J Intell Syst 2017;32:394–413. [Google Scholar]
- 8. Wits WW, García JRR, Becker JMJ. How additive manufacturing enables more sustainable end-user maintenance, repair and overhaul (MRO) strategies. Procedia CIRP 2016;40:693–698. [Google Scholar]
- 9. Flores Ituarte I, Huotilainen E, Mohite A, et al. 3D printing and applications: Academic research through case studies in Finland. Proc Nord Nord 2016 Trondheim, Norway 2016;2. [Google Scholar]
- 10. Muhuri PK, Shukla AK, Abraham A. Industry 4.0: A bibliometric analysis and detailed overview. Eng Appl Artif Intell 2019;78:218–235. [Google Scholar]
- 11. Donohue JC. A bibliometric analysis of certain information science literature. J Am Soc Inf Sci 1972;23:313–317. [Google Scholar]
- 12. Rao IKR. The distribution of scientific productivity and social change. J Am Soc Inf Sci 1980;31:111–122. [Google Scholar]
- 13. Pao ML. Lotka's law: A testing procedure. Inf Process Manag 1985;21:305–320. [Google Scholar]
- 14. Kumar S, Senthilkumar R. Applicability of Lotka's law in astronomy & astrophysics research of India. Libr Philos Pract 2019;2019:14. [Google Scholar]
- 15. Brookes BC. Bradford's law and the bibliography of science. Nature 1969;224:953–956. [DOI] [PubMed] [Google Scholar]
- 16. Ball P. Index aims for fair ranking of scientists. Nature 2005;436:900. [DOI] [PubMed] [Google Scholar]
- 17. Eggue L. Theory and practise of the g-index. Scientometrics 2006;69:131–152. [Google Scholar]
- 18. Hutmacher DW, Schantz T, Zein I, et al. Mechanical properties and cell cultural response of polycaprolactone scaffolds designed and fabricated via fused deposition modeling. J Biomed Mater Res 2001;55:203–216. [DOI] [PubMed] [Google Scholar]
- 19. Zein I, Hutmacher DW, Tan KC, et al. Fused deposition modeling of novel scaffold architectures for tissue engineering applications. Biomaterials 2002;23:1169–1185. [DOI] [PubMed] [Google Scholar]
- 20. Lotka AJ. The frequency distribution of scientific productivity. J Wash Acad Sci 1926;16:317–323. [Google Scholar]
- 21. Potter WG. Lotka's law revisited. Libr Trends 1981;30:21–39. [Google Scholar]
- 22. MacRoberts MH. M and BR. A Re-evaluation of Lotka' s law of scientific productivity. Soc Stud Sci 1982;12:443–450. [Google Scholar]
- 23. Miau S, Yang JM. Bibliometrics-based evaluation of the Blockchain research trend: 2008–March 2017. Technol Anal Strateg Manag 2018;30:1029–1045. [Google Scholar]
- 24. Alabi G. Bradford's law and its application. Int Libr Rev 1979;11:151–158. [Google Scholar]
- 25. Yao Q, Chen K, Yao L, et al. Scientometric trends and knowledge maps of global health systems research. Health Res Policy Syst 2014;12:26. [DOI] [PMC free article] [PubMed] [Google Scholar]
- 26. Zhang J, Yu Q, Zheng F, et al. Comparing keywords plus of WOS and author keywords: A case study of patient adherence research. J Assoc Inf Sci Technol 2016;67:967–972. [Google Scholar]
- 27. Kessler MM. Bibliographic coupling between scientific papers. Am Doc 1963;14:10–25. [Google Scholar]
- 28. Thomas JP, Renaud JE. Mechanical behavior of acrylonitrile butadiene styrene (ABS) fused deposition materials. Exp Invest Âguez 2001;7:148–158. [Google Scholar]
- 29. Ahn SH, Montero M, Odell D, et al. Anisotropic material properties of fused deposition modeling ABS. Rapid Prototyp J 2002;8:248–257. [Google Scholar]
- 30. Bellini A, Güçeri S. Mechanical characterization of parts fabricated using fused deposition modeling. Rapid Prototyp J 2003;9:252–264. [Google Scholar]
- 31. Thrimurthulu K, Pandey PM, Reddy NV. Optimum part deposition orientation in fused deposition modeling. Int J Mach Tools Manuf 2004;44:585–594. [Google Scholar]
- 32. Lee BH, Abdullah J, Khan ZA. Optimization of rapid prototyping parameters for production of flexible ABS object. J Mater Process Technol 2005;169:54–61. [Google Scholar]
- 33. Lee CS, Kim SG, Kim HJ, et al. Measurement of anisotropic compressive strength of rapid prototyping parts. J Mater Process Technol 2007;187–188:627–630. [Google Scholar]
- 34. Kouhi E, Masood S, Morsi Y. Design and fabrication of reconstructive mandibular models using fused deposition modeling. Assem Autom 2008;28:246–254. [Google Scholar]
- 35. Sharma M, Sharma V, Kala P. Optimization of process variables to improve the mechanical properties of FDM structures. J Phys Conf Ser 2019;1240:012061. [Google Scholar]
- 36. Chim H, Hutmacher DW, Chou AM, et al. A comparative analysis of scaffold material modifications for load-bearing applications in bone tissue engineering. Int J Oral Maxillofac Surg 2006;35:928–934. [DOI] [PubMed] [Google Scholar]
- 37. Drescher P, Spath S, Seitz H. Fabrication of biodegradable, porous scaffolds using a low-cost 3D printer. Int J Rapid Manuf 2014;4:140. [Google Scholar]
- 38. Lee KT, Kim ES, Chu WS, et al. Design and 3D printing of controllable-pitch archimedean screw for pico-hydropower generation. J Mech Sci Technol 2015;29:4851–4857. [Google Scholar]
- 39. Bates-Green K, Howie T. Technician Education in Additive Manufacturing and Material Copyright Edmonds Community College Materials for 3D Printing by Fused Deposition. 2017. [Google Scholar]
- 40. Ning F, Cong W, Qiu J, et al. Additive manufacturing of carbon fiber reinforced thermoplastic composites using fused deposition modeling. Compos Part B Eng 2015;80:369–378. [Google Scholar]
- 41. Ning F, Cong W, Hu Y, et al. Additive manufacturing of carbon fiber-reinforced plastic composites using fused deposition modeling: Effects of process parameters on tensile properties. J Compos Mater 2017;51:451–462. [Google Scholar]
- 42. Nakagawa Y, Mori K, Maeno T. 3D printing of carbon fibre-reinforced plastic parts. Int J Adv Manuf Technol 2017;91:2811–2817. [Google Scholar]
- 43. Li Y, Gao S, Dong R, et al. Additive manufacturing of PLA and CF/PLA binding layer specimens via fused deposition modeling. J Mater Eng Perform 2018;27:492–500. [Google Scholar]
- 44. Shah S, Shiblee MNI, Rahman JMH, et al. 3D printing of electrically conductive hybrid organic–inorganic composite materials. Microsyst Technol 2018;24:4341–4345. [Google Scholar]
- 45. Zhong W, Li F, Zhang Z, et al. Short fiber reinforced composites for fused deposition modeling. Mater Sci Eng A 2001;301:125–130. [Google Scholar]
- 46. Shofner ML, Lozano K, Rodrı FJ. Nanofiber-reinforced polymers prepared by fused deposition modeling. J Appl Polym Sci 2003;89:3081–3090. [Google Scholar]
- 47. Dul S, Fambri L, Pegoretti A. Filaments production and fused deposition modelling of ABS/carbon nanotubes composites. Nanomaterials 2018;8:49. [DOI] [PMC free article] [PubMed] [Google Scholar]
- 48. Stefaniak AB, Bowers LN, Knepp AK, et al. Three-dimensional printing with nano-enabled filaments releases polymer particles containing carbon nanotubes into air. Indoor Air 2018;28:840–851. [DOI] [PMC free article] [PubMed] [Google Scholar]
- 49. Dul S, Fambri L, Pegoretti A. Fused deposition modelling with ABS-graphene nanocomposites. Compos Part A Appl Sci Manuf 2016;85:181–191. [Google Scholar]
- 50. Yu WW, Zhang J, Wu JR, et al. Incorporation of graphitic nano-filler and poly(lactic acid) in fused deposition modeling. J Appl Polym Sci 2017;134:1–11. [Google Scholar]
- 51. Aumnate C, Pongwisuthiruchte A, Pattananuwat P, et al. Fabrication of ABS/Graphene oxide composite filament for fused filament fabrication (FFF) 3D Printing. Adv Mater Sci Eng 2018;2018:1–9. [Google Scholar]
- 52. Wu W, Geng P, Li G, et al. Influence of layer thickness and raster angle on the mechanical properties of 3D-printed PEEK and a comparative mechanical study between PEEK and ABS. Materials (Basel) 2015;8:5834–5846. [DOI] [PMC free article] [PubMed] [Google Scholar]
- 53. Rumpf RC, Pazos J, Garcia CR, et al. 3D printed lattices with spatially variant self-collimation. Prog Electromagn Res 2013;139:1–14. [Google Scholar]
- 54. Rocha CR, Torrado Perez AR, Roberson DA, et al. Novel ABS-based binary and ternary polymer blends for material extrusion 3D printing. J Mater Res 2014;29:1859–1866. [Google Scholar]
- 55. Siqueiros JG, Schnittker K, Roberson DA. ABS-maleated SEBS blend as a 3D printable material. Virtual Phys Prototyp 2016;11:123–131. [Google Scholar]
- 56. Rimington RP, Capel AJ, Christie SDR, et al. Biocompatible 3D printed polymers: Via fused deposition modelling direct C2C12 cellular phenotype in vitro. Lab Chip 2017;17:2982–2993. [DOI] [PubMed] [Google Scholar]
- 57. Fafenrot S, Grimmelsmann N, Wortmann M, et al. Three-dimensional (3D) printing of polymer-metal hybrid materials by fused deposition modeling. Materials (Basel) 2017;10:1199. [DOI] [PMC free article] [PubMed] [Google Scholar]
- 58. Wu J, Chen N, Bai F, et al. Preparation of poly(vinyl alcohol)/poly(lactic acid)/hydroxyapatite bioactive nanocomposites for fused deposition modeling. Polym Compos 2018;39:E508–E518. [Google Scholar]
- 59. Tao Y, Shao J, Li P, et al. Application of a thermoplastic polyurethane/polylactic acid composite filament for 3D-printed personalized orthosis. Mater Tehnol 2019;53:71–76. [Google Scholar]
- 60. Masood SH, Song WQ. Development of new metal/polymer materials for rapid tooling using Fused deposition modelling. Mater Des 2004;25:587–594. [Google Scholar]
- 61. Salea A, Prathumwan R, Junpha J, et al. Metal oxide semiconductor 3D printing: Preparation of copper(II) oxide by fused deposition modelling for multi-functional semiconducting applications. J Mater Chem C 2017;5:4614–4620. [Google Scholar]
- 62. Khatri B, Lappe K, Habedank M, et al. Fused deposition modeling of ABS-barium titanate composites: A simple route towards tailored dielectric devices. Polymers (Basel) 2018;10:666. [DOI] [PMC free article] [PubMed] [Google Scholar]
- 63. Mireles J, Espalin D, Roberson D, et al. Fused deposition modeling of metals. 23rd Annu Int Solid Free Fabr Symp—An Addit Manuf Conf SFF 2012. Published online 2012:836–845. [Google Scholar]
- 64. Hsieh PC, Tsai CH, Liu BH, et al. 3D printing of low melting temperature alloys by fused deposition modeling. Proc IEEE Int Conf Ind Technol 2016;2016:1138–1142. [Google Scholar]
- 65. Warrier N, Kate KH. Fused filament fabrication 3D printing with low-melt alloys. Prog Addit Manuf 2018;3:51–63. [Google Scholar]
- 66. Kwok SW, Goh KHH, Tan ZD, et al. Electrically conductive filament for 3D-printed circuits and sensors. Appl Mater Today 2017;9:167–175. [Google Scholar]
- 67. Goyanes A, Buanz ABM, Basit AW, et al. Fused-filament 3D printing (3DP) for fabrication of tablets. Int J Pharm 2014;476:88–92. [DOI] [PubMed] [Google Scholar]
- 68. Goyanes A, Robles Martinez P, Buanz A, et al. Effect of geometry on drug release from 3D printed tablets. Int J Pharm 2015;494:657–663. [DOI] [PubMed] [Google Scholar]
- 69. Goyanes A, Buanz ABM, Hatton GB, et al. 3D printing of modified-release aminosalicylate (4-ASA and 5-ASA) tablets. Eur J Pharm Biopharm 2015;89:157–162. [DOI] [PubMed] [Google Scholar]
- 70. Goyanes A, Wang J, Buanz A, et al. 3D Printing of medicines: Engineering novel oral devices with unique design and drug release characteristics. Mol Pharm 2015;12:4077–4084. [DOI] [PubMed] [Google Scholar]
- 71. Verstraete G, Samaro A, Grymonpré W, et al. 3D printing of high drug loaded dosage forms using thermoplastic polyurethanes. Int J Pharm 2018;536:318–325. [DOI] [PubMed] [Google Scholar]
- 72. Yang Y, Wang H, Li H, et al. 3D printed tablets with internal scaffold structure using ethyl cellulose to achieve sustained ibuprofen release. Eur J Pharm Sci 2018;115:11–18. [DOI] [PubMed] [Google Scholar]
- 73. Kempin W, Domsta V, Grathoff G, et al. Immediate release 3D-printed tablets produced via fused deposition modeling of a thermo-sensitive drug. Pharm Res 2018;35:124. [DOI] [PubMed] [Google Scholar]
- 74. Ibrahim M, Barnes M, McMillin R, et al. 3D printing of metformin HCl PVA tablets by fused deposition modeling: Drug loading, tablet design, and dissolution studies. AAPS PharmSciTech 2019;20:1–11. [DOI] [PubMed] [Google Scholar]
- 75. Xu X, Zhao J, Wang M, et al. 3D printed polyvinyl alcohol tablets with multiple release profiles. Sci Rep 2019;9:1–8. [DOI] [PMC free article] [PubMed] [Google Scholar]
- 76. Matijašić G, Gretić M, Kezerić K, et al. Preparation of filaments and the 3D printing of dronedarone HCl tablets for treating cardiac arrhythmias. AAPS PharmSciTech 2019;20:1–13. [DOI] [PubMed] [Google Scholar]
- 77. Lamichhane S, Park JB, Sohn DH, et al. Customized novel design of 3D printed pregabalin tablets for intra-gastric floating and controlled release using fused deposition modeling. Pharmaceutics 2019;11:1–14. [DOI] [PMC free article] [PubMed] [Google Scholar]
- 78. Wei C, Solanki NG, Vasoya JM, et al. Development of 3D printed tablets by fused deposition modeling using polyvinyl alcohol as polymeric matrix for rapid drug release. J Pharm Sci 2020;109:1558–1572. [DOI] [PubMed] [Google Scholar]
- 79. Wang H, Dumpa N, Bandari S, et al. Fabrication of taste-masked donut-shaped tablets via fused filament fabrication 3D printing paired with hot-melt extrusion techniques. AAPS PharmSciTech 2020;21:1–11. [DOI] [PubMed] [Google Scholar]
- 80. Charoenying T, Patrojanasophon P, Ngawhirunpat T, et al. Three-dimensional (3D)-printed devices composed of hydrophilic cap and hydrophobic body for improving buoyancy and gastric retention of domperidone tablets. Eur J Pharm Sci 2020;155:105555. [DOI] [PubMed] [Google Scholar]
- 81. Pietrzak K, Isreb A, Alhnan MA. A flexible-dose dispenser for immediate and extended release 3D printed tablets. Eur J Pharm Biopharm 2015;96:380–387. [DOI] [PubMed] [Google Scholar]
- 82. Goyanes A, Kobayashi M, Martínez-Pacheco R, et al. Fused-filament 3D printing of drug products: Microstructure analysis and drug release characteristics of PVA-based caplets. Int J Pharm 2016;514:290–295. [DOI] [PubMed] [Google Scholar]
- 83. Skowyra J, Pietrzak K, Alhnan MA. Fabrication of extended-release patient-tailored prednisolone tablets via fused deposition modelling (FDM) 3D printing. Eur J Pharm Sci 2015;68:11–17. [DOI] [PubMed] [Google Scholar]
- 84. Chai X, Chai H, Wang X, et al. Fused deposition modeling (FDM) 3D printed tablets for intragastric floating delivery of domperidone. Sci Rep 2017;7:1–9. [DOI] [PMC free article] [PubMed] [Google Scholar]
- 85. Goyanes A, Fina F, Martorana A, et al. Development of modified release 3D printed tablets (printlets) with pharmaceutical excipients using additive manufacturing. Int J Pharm 2017;527:21–30. [DOI] [PubMed] [Google Scholar]
- 86. Solanki NG, Tahsin M, Shah AV, Serajuddin ATM. Formulation of 3D printed tablet for rapid drug release by fused deposition modeling: Screening polymers for drug release, drug-polymer miscibility and printability. J Pharm Sci 2018;107:390–401. [DOI] [PubMed] [Google Scholar]
- 87. Fu J, Yu X, Jin Y. 3D printing of vaginal rings with personalized shapes for controlled release of progesterone. Int J Pharm. 2018;539:75–82. [DOI] [PubMed] [Google Scholar]
- 88. Tagami T, Nagata N, Hayashi N, et al. Defined drug release from 3D-printed composite tablets consisting of drug-loaded polyvinylalcohol and a water-soluble or water-insoluble polymer filler. Int J Pharm 2018;543:361–367. [DOI] [PubMed] [Google Scholar]
- 89. Long J, Nand AV, Ray S, et al. Development of customised 3D printed biodegradable projectile for administrating extended-release contraceptive to wildlife. Int J Pharm 2018;548:349–356. [DOI] [PubMed] [Google Scholar]
- 90. Fanous M, Gold S, Hirsch S, et al. Development of immediate release (IR) 3D-printed oral dosage forms with focus on industrial relevance. Eur J Pharm Sci 2020;155:105558. [DOI] [PubMed] [Google Scholar]
- 91. Dumpa NR, Bandari S, Repka MA. Novel gastroretentive floating pulsatile drug delivery system produced via hot-melt extrusion and fused deposition modeling 3D printing. Pharmaceutics 2020;12:52. [DOI] [PMC free article] [PubMed] [Google Scholar]
- 92. Sharma V, Shaik KM, Choudhury A, et al. Investigations of process parameters during dissolution studies of drug loaded 3D printed tablets. J Eng Med 2021;235:523–529. [DOI] [PubMed] [Google Scholar]
- 93. Kalita SJ, Bose S, Hosick HL, et al. Development of controlled porosity polymer-ceramic composite scaffolds via fused deposition modeling. Mater Sci Eng C 2003;23:611–620. [Google Scholar]
- 94. Van Uden S, Silva-Correia J, Correlo VM, et al. Custom-tailored tissue engineered polycaprolactone scaffolds for total disc replacement. Biofabrication 2015;7:15008. [DOI] [PubMed] [Google Scholar]
- 95. Albrecht LD, Sawyer SW, Soman P. Developing 3D scaffolds in the field of tissue engineering to treat complex bone defects. 3D Print Addit Manuf 2016;3:106–112. [Google Scholar]
- 96. Kosorn W, Sakulsumbat M, Uppanan P, et al. PCL/PHBV blended three dimensional scaffolds fabricated by fused deposition modeling and responses of chondrocytes to the scaffolds. J Biomed Mater Res B Appl Biomater 2017;105:1141–1150. [DOI] [PubMed] [Google Scholar]
- 97. Vargas-Alfredo N, Dorronsoro A, Cortajarena AL, et al. Antimicrobial 3D porous scaffolds prepared by additive manufacturing and breath figures. ACS Appl Mater Interfaces 2017;9:37454–37462. [DOI] [PubMed] [Google Scholar]
- 98. Ngadiman NHA, Yusof NM, Idris A, et al. Novel processing technique to produce three dimensional polyvinyl alcohol/maghemite nanofiber scaffold suitable for hard tissues. Polymers (Basel) 2018;10:353. [DOI] [PMC free article] [PubMed] [Google Scholar]
- 99. Germain L, Fuentes CA, van Vuure AW, et al. 3D-printed biodegradable gyroid scaffolds for tissue engineering applications. Mater Des 2018;151:113–122. [Google Scholar]
- 100. Song P, Zhou C, Fan H, et al. Novel 3D porous biocomposite scaffolds fabricated by fused deposition modeling and gas foaming combined technology. Compos Part B Eng 2018;152:151–159. [Google Scholar]
- 101. Esposito Corcione C, Gervaso F, Scalera F, et al. Highly loaded hydroxyapatite microsphere/PLA porous scaffolds obtained by fused deposition modelling. Ceram Int 2019;45:2803–2810. [Google Scholar]
- 102. Chen G, Chen N, Wang Q. Fabrication and properties of poly(vinyl alcohol)/β-tricalcium phosphate composite scaffolds via fused deposition modeling for bone tissue engineering. Compos Sci Technol 2019;172:17–28. [Google Scholar]
- 103. Alemán-Domínguez ME, Giusto E, Ortega Z, et al. Three-dimensional printed polycaprolactone-microcrystalline cellulose scaffolds. J Biomed Mater Res B Appl Biomater 2019;107:521–528. [DOI] [PubMed] [Google Scholar]
- 104. Seidenstuecker M, Lange S, Esslinger S, et al. Inversely 3D-printed β-TCP scaffolds for bone replacement. Materials (Basel) 2019;12:1–17. [DOI] [PMC free article] [PubMed] [Google Scholar]
- 105. Chen X, Gao C, Jiang J, et al. 3D printed porous PLA/nHA composite scaffolds with enhanced osteogenesis and osteoconductivity in vivo for bone regeneration. Biomed Mater 2019;14:065003. [DOI] [PubMed] [Google Scholar]
- 106. Jun DR, Ahn GY, Choi IS, et al. 3D-printed poly lactic acid scaffolds with tetrapod-interlocked structure containing dipyridamole. Macromol Res 2020;28:5–8. [Google Scholar]
- 107. Song X, He W, Qin H, et al. Fused deposition modeling of poly (lactic acid)/macadamia composites-thermal, mechanical properties and scaffolds. Materials (Basel) 2020;13:258. [DOI] [PMC free article] [PubMed] [Google Scholar]
- 108. Khodaei M, Amini K, Valanezhad A. Fabrication and characterization of poly lactic acid scaffolds by fused deposition modeling for bone tissue engineering. J Wuhan Univ Technol Mater Sci Ed 2020;35:248–251. [Google Scholar]
- 109. Sahmani S, Khandan A, Esmaeili S, et al. Calcium phosphate-PLA scaffolds fabricated by fused deposition modeling technique for bone tissue applications: Fabrication, characterization and simulation. Ceram Int 2020;46:2447–2456. [Google Scholar]
- 110. Pecci R, Baiguera S, Ioppolo P, et al. 3D printed scaffolds with random microarchitecture for bone tissue engineering applications: Manufacturing and characterization. J Mech Behav Biomed Mater 2020;103:103583. [DOI] [PubMed] [Google Scholar]
- 111. Choi WJ, Hwang KS, Kwon HJ, et al. Rapid development of dual porous poly(lactic acid) foam using fused deposition modeling (FDM) 3D printing for medical scaffold application. Mater Sci Eng C Mater Biol Appl 2020;110:110693. [DOI] [PubMed] [Google Scholar]
- 112. Pierantozzi D, Scalzone A, Jindal S, et al. 3D printed Sr-containing composite scaffolds: Effect of structural design and material formulation towards new strategies for bone tissue engineering. Compos Sci Technol 2020;191:108069. [Google Scholar]
- 113. Sanz-Horta R, Elvira C, Gallardo A, et al. Fabrication of 3d-printed biodegradable porous scaffolds combining multi-material fused deposition modeling and supercritical CO2 techniques. Nanomaterials 2020;10:1080. [DOI] [PMC free article] [PubMed] [Google Scholar]
- 114. Nevado P, Lopera A, Bezzon V, et al. Preparation and in vitro evaluation of PLA/biphasic calcium phosphate filaments used for fused deposition modelling of scaffolds. Mater Sci Eng C Mater Biol Appl 2020;114:111013. [DOI] [PubMed] [Google Scholar]
- 115. Bourell D, Espalin D, Arcaute K, et al. Fused deposition modeling of patient specific polymethylmethacrylate implants. Rapid Prototyp J 2010;16:164–173. [Google Scholar]
- 116. Oladapo BI, Zahedi SA, Ismail SO, et al. 3D printing of PEEK–cHAp scaffold for medical bone implant. Bio-Design Manuf. Published online 2020. DOI: 10.1007/s42242-020-00098-0 [DOI] [Google Scholar]
- 117. Sun Q, Rizvi GM, Bellehumeur CT, et al. Effect of processing conditions on the bonding quality of FDM polymer filaments. Rapid Prototyp J 2008;14:72–80. [Google Scholar]
- 118. Lewis JA, Smay JE, Stuecker J, et al. Direct ink writing of three-dimensional ceramic structures. J Am Ceram Soc 2006;89:3599–3609. [Google Scholar]
- 119. Carneiro OS, Silva AF, Gomes R. Fused deposition modeling with polypropylene. Mater Des 2015;83:768–776. [Google Scholar]
- 120. Tian X, Liu T, Yang C, et al. Composites: Part A interface and performance of 3D printed continuous carbon fiber reinforced PLA composites. Compos Part A 2016;88:198–205. [Google Scholar]
- 121. Matsuzaki R, Ueda M, Namiki M, et al. Three-dimensional printing of continuous-fiber composites by in-nozzle impregnation. Sci Rep 2016;6:1–7. [DOI] [PMC free article] [PubMed] [Google Scholar]
- 122. Caminero MA, Chacón JM, García-Plaza E, et al. Additive manufacturing of PLA structures using fused deposition modelling: Effect of process parameters on mechanical properties and their optimal selection. Mater Des 2017;124:143–157. [Google Scholar]