

Abstract
Members of the Fleischner Society have compiled a glossary of terms for thoracic imaging that replaces previous glossaries published in 1984, 1996, and 2008, respectively. The impetus to update the previous version arose from multiple considerations. These include an awareness that new terms and concepts have emerged, others have become obsolete, and the usage of some terms has either changed or become inconsistent to a degree that warranted a new definition. This latest glossary is focused on terms of clinical importance and on those whose meaning may be perceived as vague or ambiguous. As with previous versions, the aim of the present glossary is to establish standardization of terminology for thoracic radiology and, thereby, to facilitate communications between radiologists and clinicians. Moreover, the present glossary aims to contribute to a more stringent use of terminology, increasingly required for structured reporting and accurate searches in large databases. Compared with the previous version, the number of images (chest radiography and CT) in the current version has substantially increased. The authors hope that this will enhance its educational and practical value.
All definitions and images are hyperlinked throughout the text. Click on each figure callout to view corresponding image.
© RSNA, 2024

Introduction
The present glossary of terms for thoracic imaging is the fourth prepared by members of the Fleischner Society and replaces the previous glossaries of terms for chest radiography (1) and CT (2,3), respectively. The impetus to update the previous version arose from an awareness that new terms have emerged, others have become obsolete, and the usage of some terms has either changed or become inconsistent to a degree that warranted a new definition. The methodology used for compiling this glossary is described in Appendix S1. Appendix S2 summarizes the terms included, excluded, and rearranged, compared with the previous version of the glossary.
The intention of this latest glossary is not to be exhaustive but to focus on terms of clinical importance and those whose meaning may be perceived as vague or ambiguous. This focus is important to establish standardization of terminology and, thereby, to facilitate communications between radiologists and other clinicians. Moreover, the current glossary aims for more stringent, consistent terminology required by structured reporting and essential for reasonably accurate searches in large databases (4,5).
Controversial or misused terms are also included, with recommendations for appropriate usage. Whenever this is not supported by objective evidence, the consensus preference of the authors is clearly identified. In this regard, the current glossary is not only an enumeration of terms and their definitions, but also a commentary regarding their use.
As in previous versions, terms and techniques not specific to thoracic imaging are not included. Despite sporadic references to fluorine 18 (18F) fluorodeoxyglucose PET/CT, most definitions continue to refer to chest radiography and CT, which remain the chief modalities used in thoracic imaging. The overall number of terms was kept almost identical. However, several features are new.
First, the glossary preserves the alphabetical order of terms, but several related terms are now grouped under thematic headings to allow a rapid overview for comparing individual terms. The number of imaging signs was reduced, as these are comprehensively described elsewhere (6–8). Likewise, the number of eponyms was reduced to a minimum, and preference was given to descriptive terms, whenever possible. Most terms continue to have a limited number of pertinent and updated references, but not all terms are referenced.
Second, for brevity, the glossary no longer includes subdivisions into pathology, radiographic, and CT definitions. Each term is now labeled to either reflect normal anatomy (anatomy), a physiologic concept (physiology), or an abnormal finding (pathology). It is important to emphasize that this is a glossary of radiologic terms and that, while often grounded in radiology-pathology correlations, terms labeled as pathology do not necessarily faithfully reflect definitions used by pathologists. Some terms are labeled as descriptors to differentiate them from terms that imply a radiologic diagnosis. Terms described elsewhere are cross-referenced by an asterisk (*).
Third, the glossary includes images for virtually all terms, and we hope that this will increase its practical value. While images were chosen to be typical for a given term, they are merely examples and do not represent the full range of possible imaging appearances, which may be found in the references of this glossary and in comprehensive textbooks.
We hope that this fourth edition of the Fleischner Society Glossary of Terms for Thoracic Imaging will be helpful for both radiologists and the respiratory medicine community at large. Because terminology is evolving, the provided definitions should be understood as a consensus proposal rather than strict rules. It is anticipated that systematic evaluations of the utilization of this glossary will be undertaken.
Acinus (Pl. Acini) (Anatomy)
The acinus is a structural unit of the lung distal to the terminal bronchiole* and is supplied by a first-order respiratory bronchiole, with a diameter of approximately 4-8 mm. The secondary pulmonary lobule* contains between three and 25 acini. Within the acinus, all parts are involved in gas exchange (ie, they contain alveoli). The acinus consists of respiratory bronchioles, alveolar ducts, and alveoli. Normal acini are not visible radiologically but the accumulation of pathologic material within acini may be seen as small ill-defined rounded opacities (opacity*), sometimes called “air space nodules” (9,10).
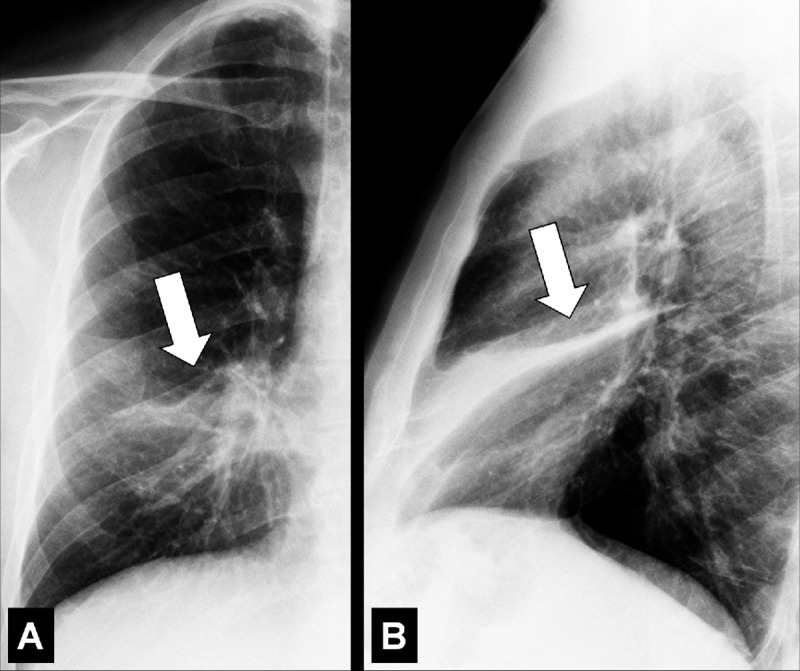
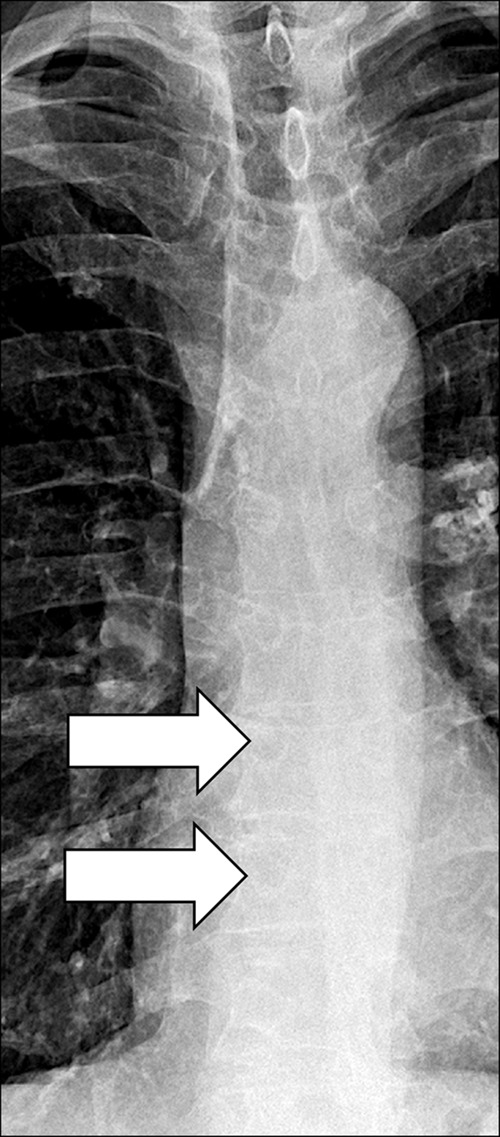
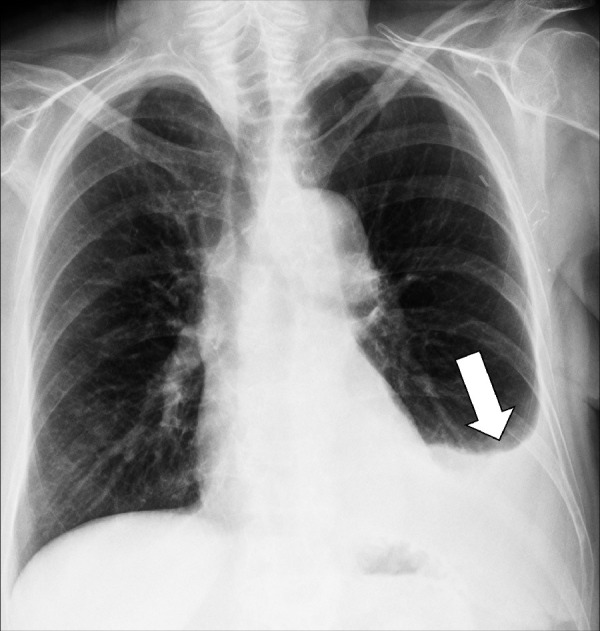
Air Bronchogram (Pathology) [Descriptor] (Fig 1)
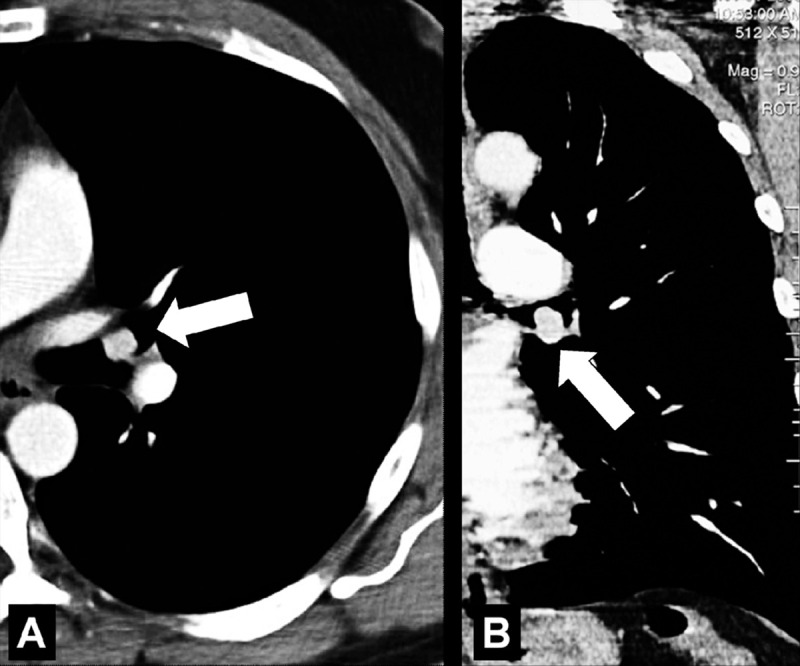
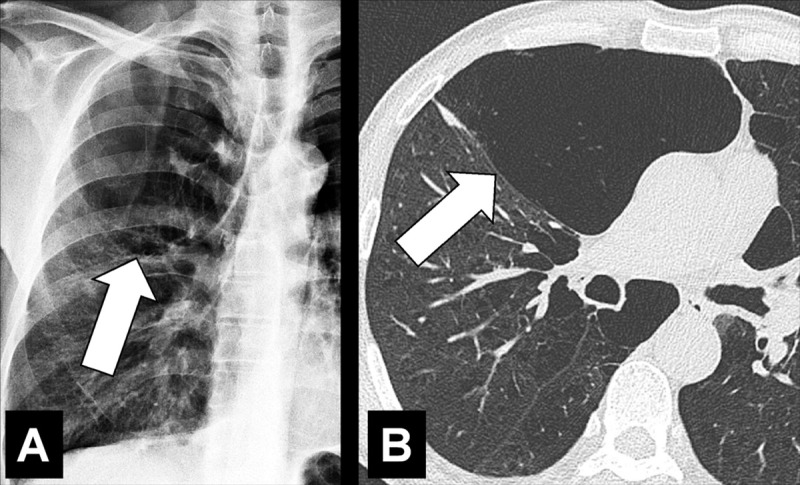
Figure 1:

Air bronchogram: (A) Coronal CT image reconstruction of the right lung and (B) frontal chest radiograph of the left lung show air bronchograms (arrows).
Air bronchogram is the descriptive term for air-filled airways* within lung parenchyma* that is partially or completely airless. The term implies (a) patency of proximal airways, and (b) evacuation of alveolar air by means of absorption (eg, in atelectasis*) or replacement (eg, fluid, tumor), or a combination of these processes (11).
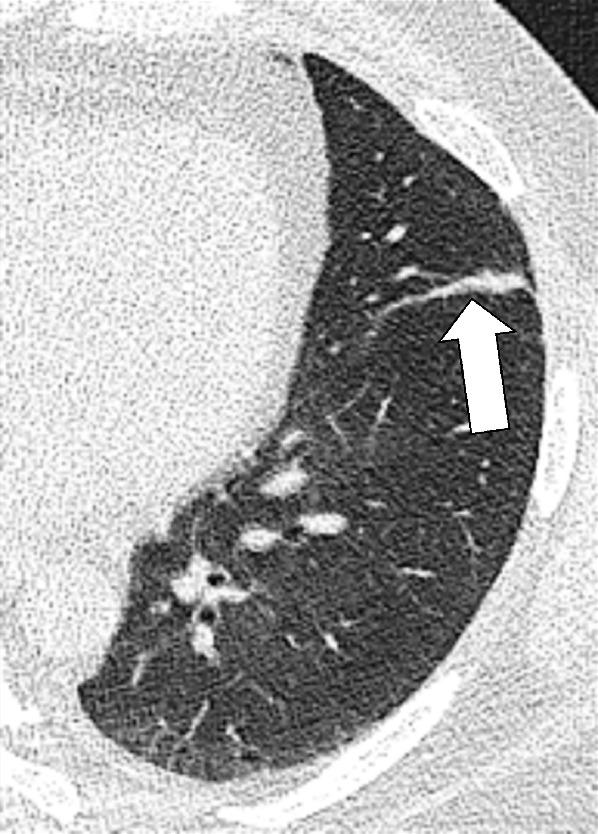
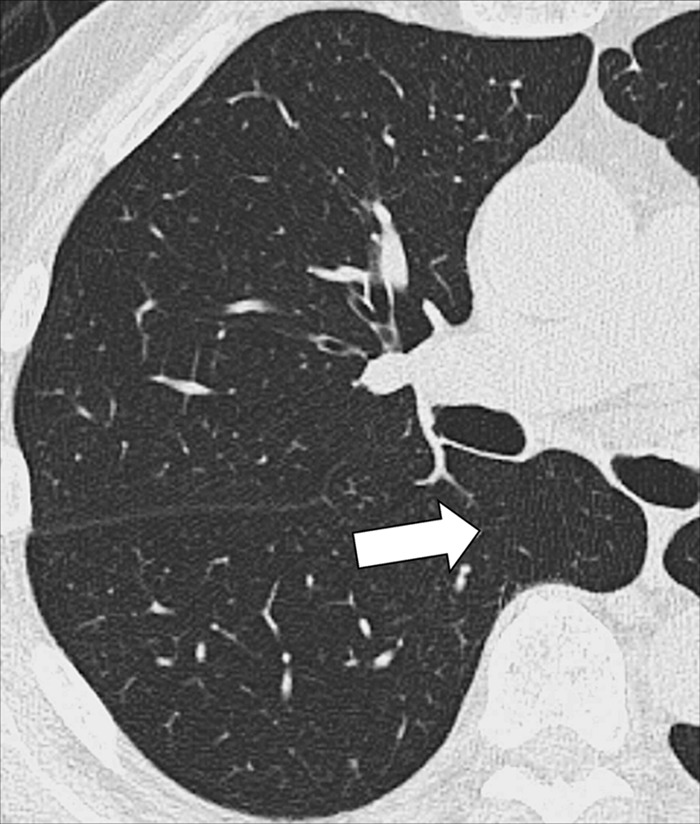
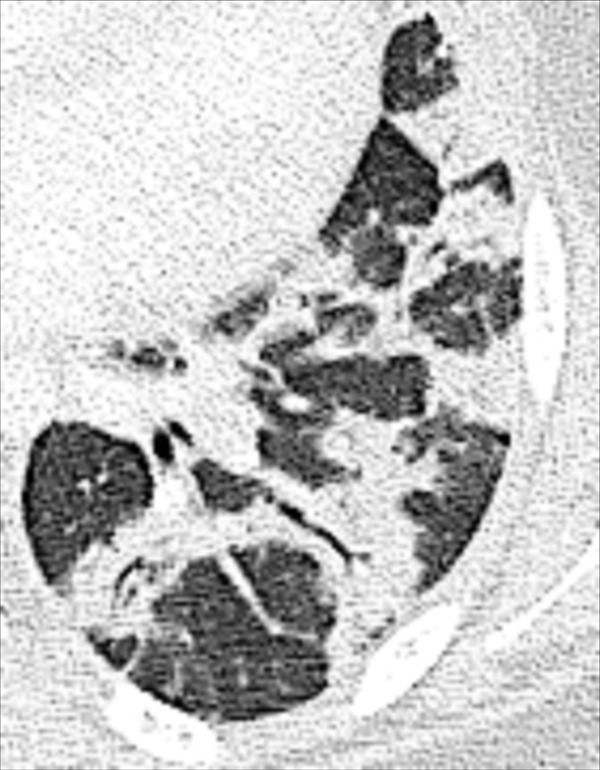
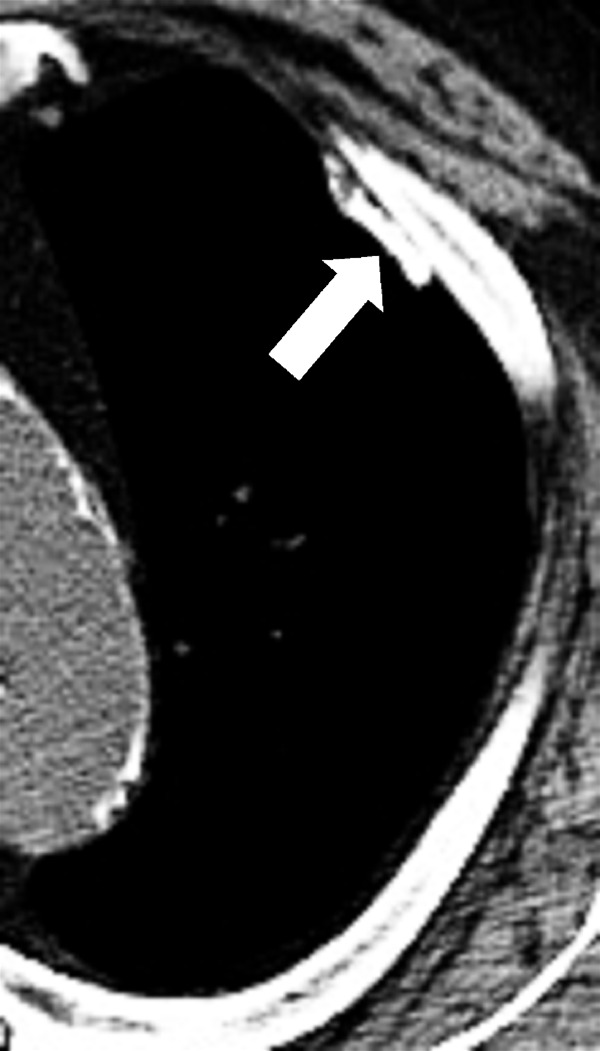
Air Crescent (Pathology) [Descriptor] (Figs 2, 3)
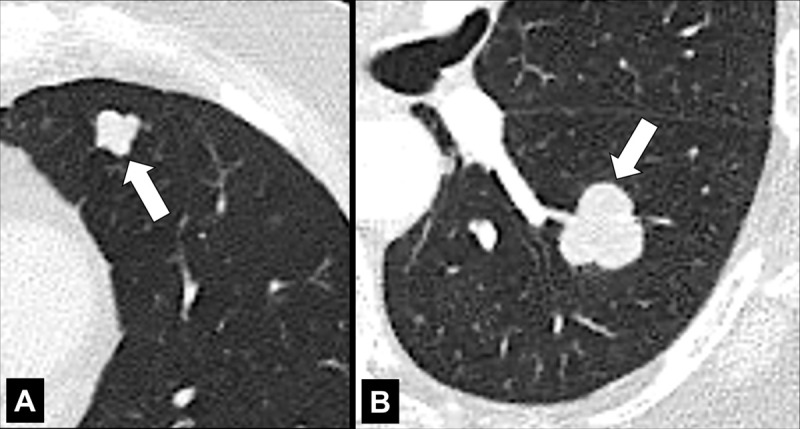
Figure 2:
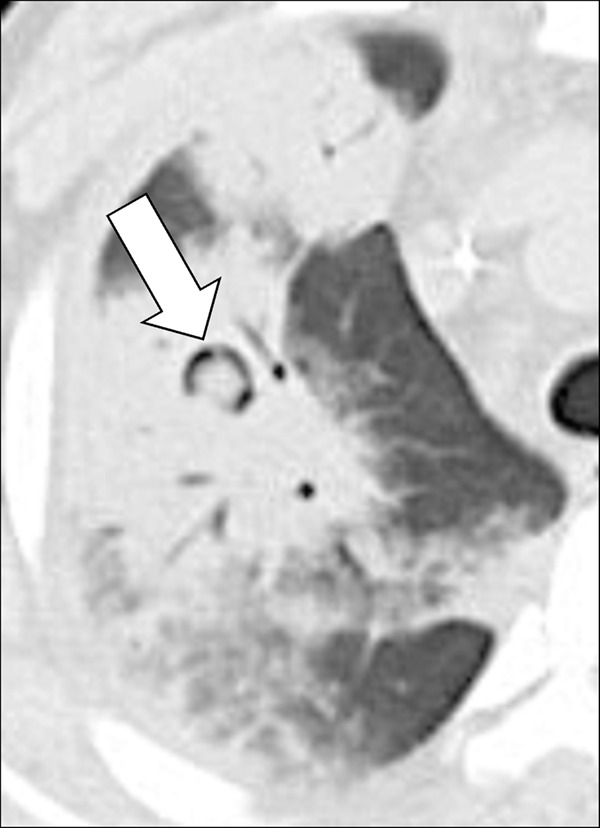
Air crescent: Transverse CT image of the right upper lobe shows air crescent (arrow) caused by angioinvasive aspergillosis.
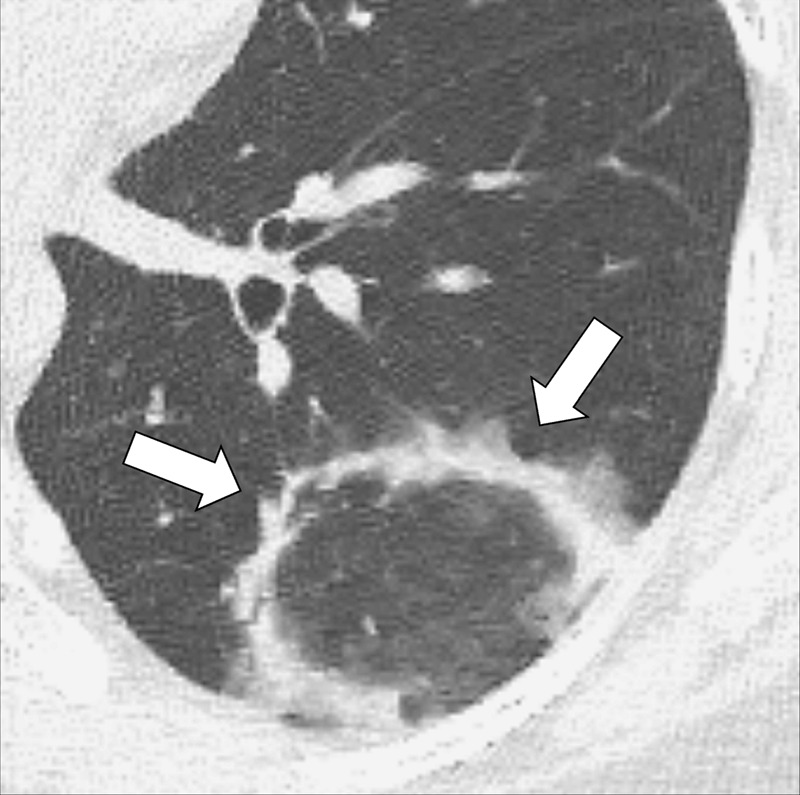
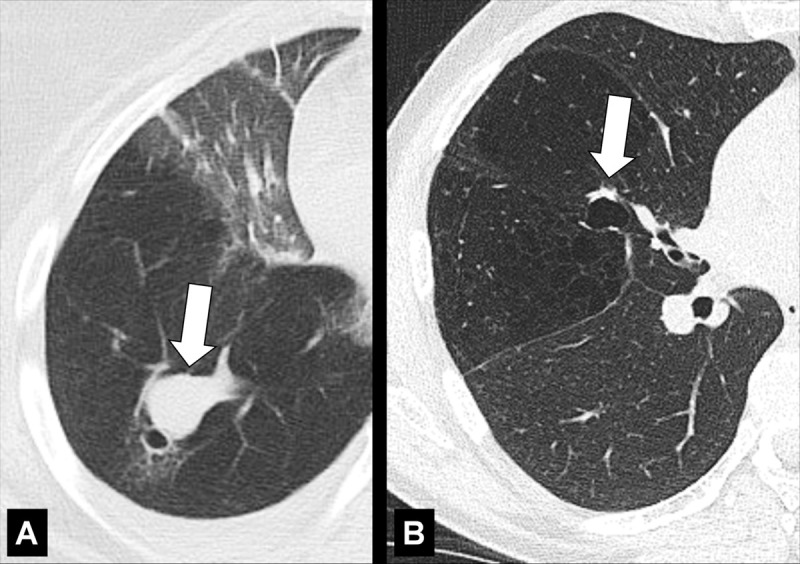
Figure 3:

Air crescent: (A) Frontal chest radiograph and (B) transverse CT image of the left upper lobe show rim-like air crescents (arrows) surrounding a mycetoma (asterisks) within a preexisting cavity.
Air crescent is the descriptive term for a crescent-shaped air collection between the wall of a cavity* and a mass* within the cavity. It is often associated with the retraction of infarcted lung parenchyma* in angio-invasive aspergillosis or with the colonization of preexisting cavities by Aspergillus or other fungi. In the latter case, the resulting fungus ball* may be mobile and change position with changes in the patient’s position. Air crescents can also occur due to necrotic tissue or a blood clot within a cavity* (12,13).
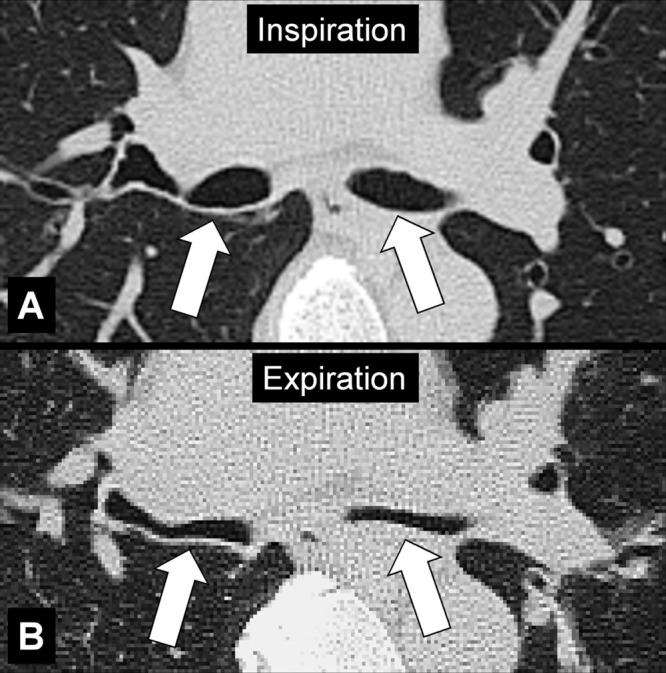
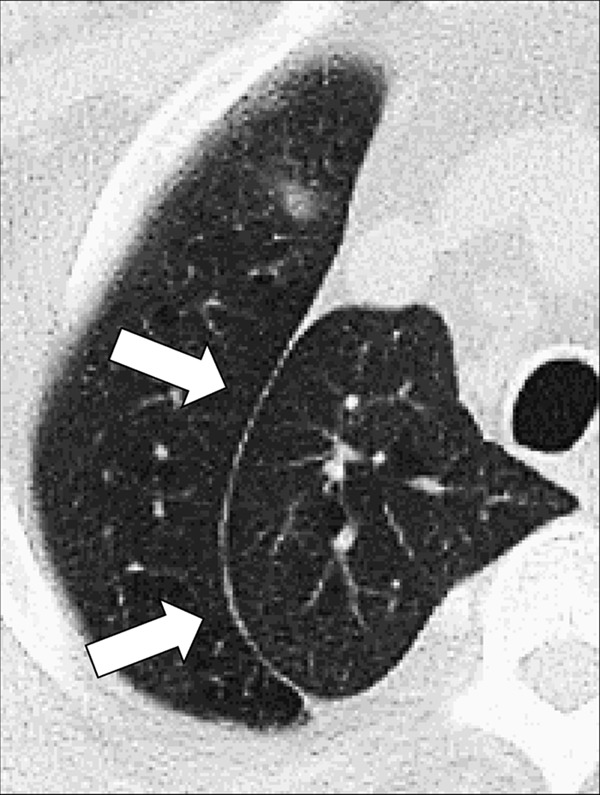
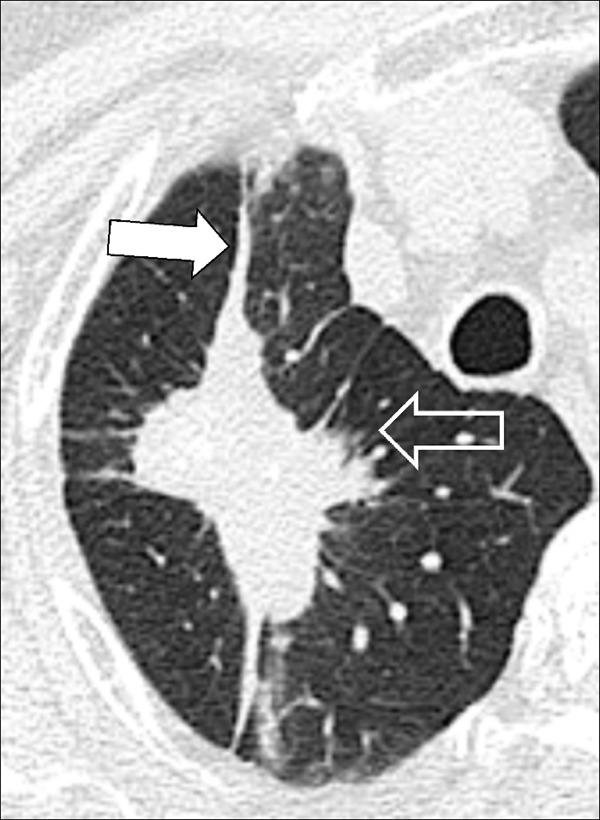
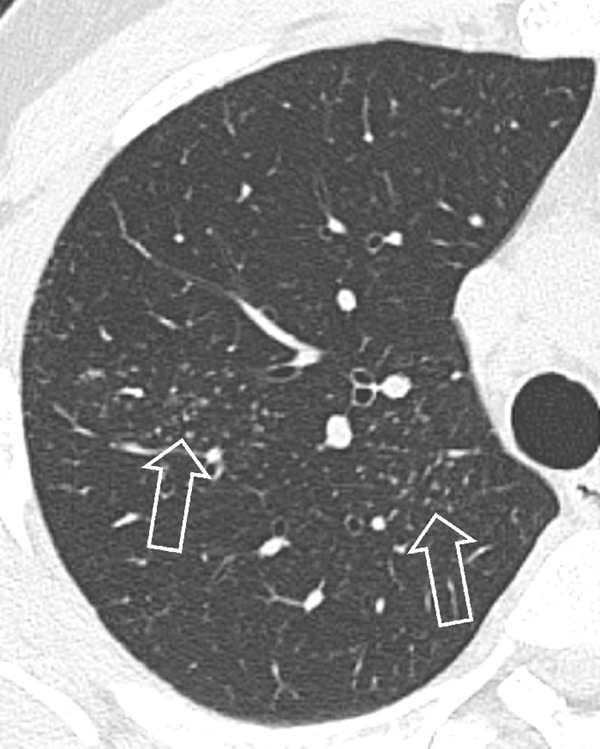
Air Trapping (Physiology/Pathology) (Fig 4)
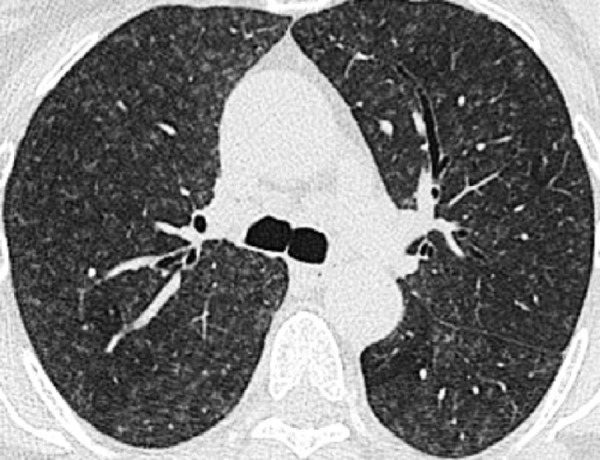
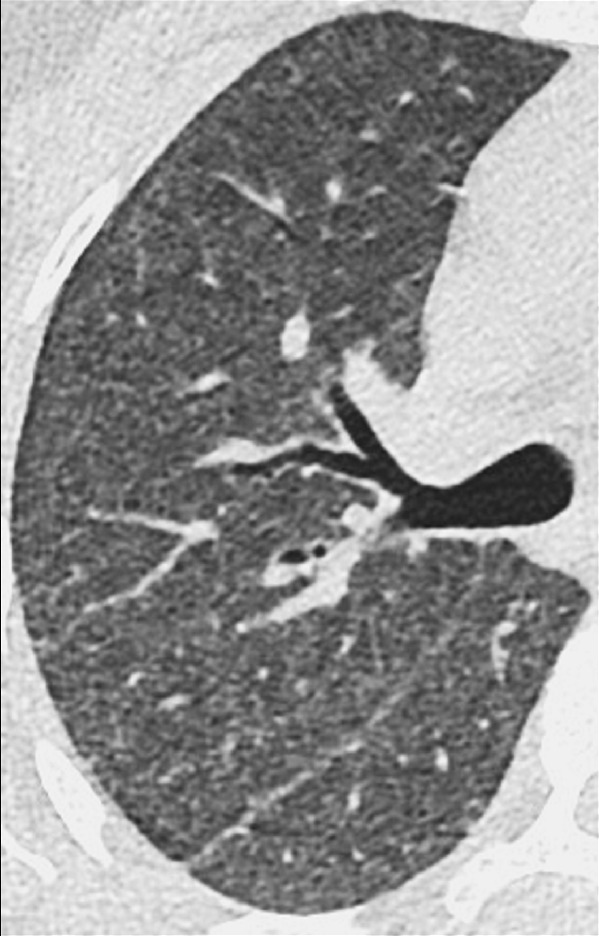
Figure 4:

Air trapping: Transverse CT image at the level of the carina in (A) inspiration and (B) expiration. While the lung parenchyma in inspiration (A) is homogeneous, expiration (B) reveals failure of lung density to increase in areas of air trapping (arrows).
Air trapping is the retention of air in lung parenchyma* distal to more proximal obstruction of one or several airways*. Air trapping (also “gas trapping”) is seen at CT performed during or at the end of expiration. It is characterized by (a) a less-than-normal increase in attenuation and (b) a less-than-normal decrease in volume on expiration. Air trapping should only be called on expiratory CT examinations (14). Of note, areas of air trapping are typically sharply marginated, however distinction between air trapping and decreased attenuation due to vascular occlusion, for example in chronic thromboembolic disease, may be difficult (15,16). Air trapping is also frequently associated with decreased focal perfusion (eg, caused by reactive vasoconstriction) (17–19).
Airspace (Anatomy)
An airspace is the air- or gas-containing part of the lung parenchyma*, including the respiratory bronchioles (bronchiole*), alveolar ducts, and alveoli, but excluding purely conductive airways* such as terminal bronchioles. The term is used in conjunction with opacity* and nodule* to designate the accumulation of material within airspaces (20).
Airways (Anatomy)
The airways are structural parts of the respiratory system that allow airflow. Conducting airways extend from the nares and buccal opening to the terminal bronchioles (bronchiole*). Large airways include the cervical and thoracic part of the trachea, as well as the main, lobar, and segmental bronchi. Small airways include the subsegmental bronchi to bronchioles with an internal diameter of less than 2 mm. Diseases of the central airways can often be visualized directly at CT, whereas diseases of the peripheral airways often manifest through indirect changes (eg, air trapping*) (21–23).
Anatomic Distribution (Anatomy) (Figs 5–25)
Figure 5:

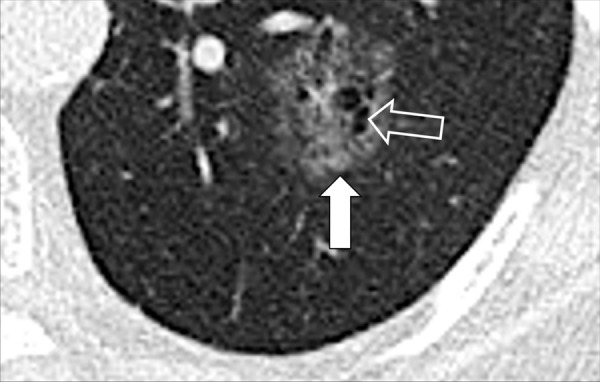
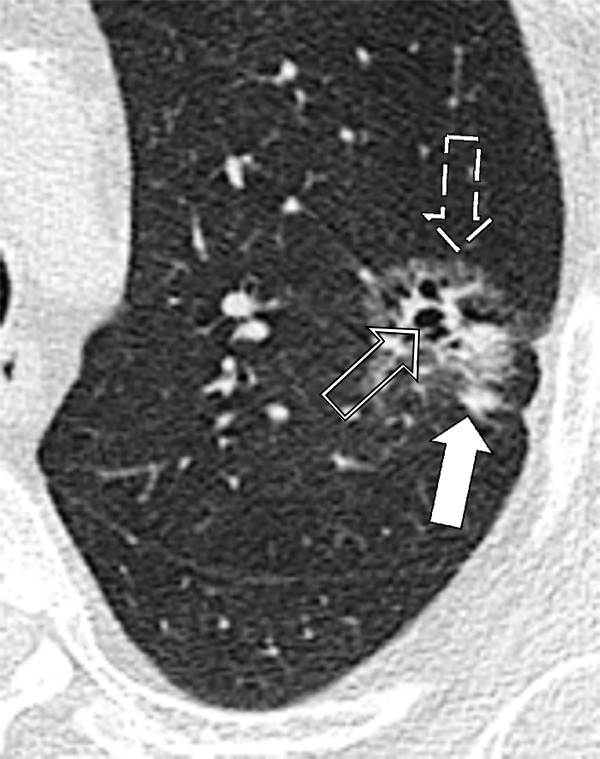
Bronchocentric: Transverse CT image of the left upper lobe shows bronchocentric opacity (arrow).
Figure 25:
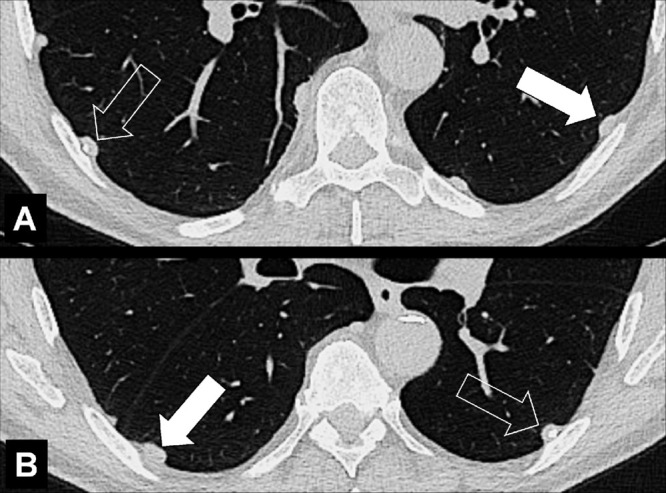
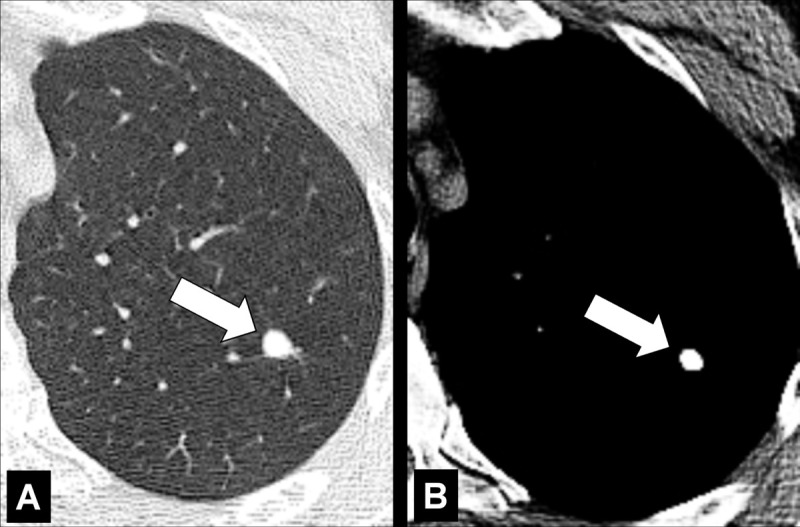
Pleural: (A, B) Transverse CT images of the lung bases show focal pleural nodules (solid arrow), some of which are partially calcified (open arrow).
Bronchocentric: adjacent to or involving the bronchi in the axial interstitium* (Fig 5).
Centrilobular: centered on the core structures of the secondary pulmonary lobule* (Figs 6, 7). Often used to describe the distribution of nodules (nodule*) or micronodules (micronodule*).
Diffuse: distributed throughout a lobe* or lobes without particular regional predominance, for example between central and peripheral parts of the lung (Fig 8).
Endobronchial: located within the lumen of a bronchus (Figs 9, 10).
Extrapleural: external to the pleura, without directly involving the pleura* or the pleural space (Fig 11).
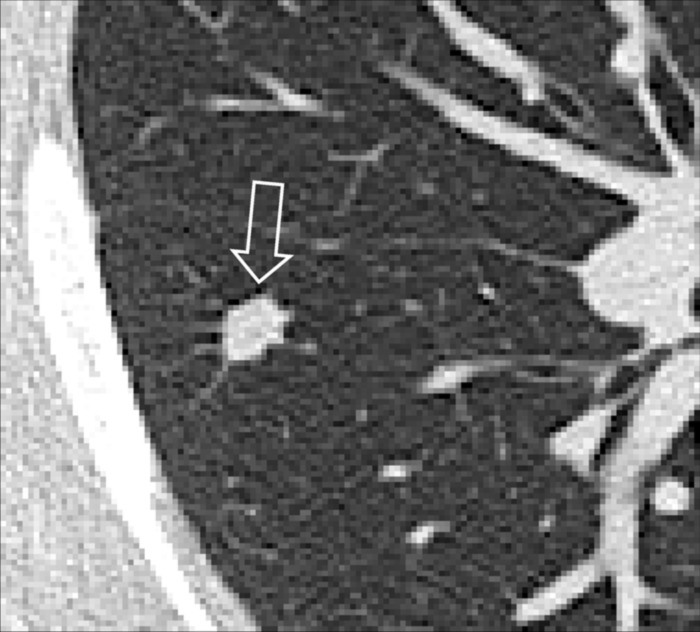
Fissural: refers to a lesion or disease that arises from or involves the fissure* (Fig 12). A lesion or disease that has direct contact with the fissure*, but does not arise from it, should be called “perifissural.”
Focal: confined to one distinct area (Fig 13).
Geographic: distributed in a manner resembling the outline of regions on a map. The term implies well-defined margins between areas of differing attenuation (Fig 14).
Multifocal: involving two or more distinct areas (Figs 15, 16).
Peribronchovascular: distributed along the bronchovascular bundles (Figs 17, 18).
Perilobular: Arcade-like or curvilinear opacities that can be related to the margins of secondary pulmonary lobules (Figs 19, 20).
Perilymphatic: distributed along lymphatic vessels (Figs 21, 22).
Pleural: refers to a lesion or disease that arises from or involves the pleura*. A lesion or disease that has contact with the pleura*, but does not arise from it, should be called pleura-based. The term subpleural should only be used for lesions or diseases in proximity to the pleura*, but without direct contact to it. Because this term has been attributed variable meanings in the literature, the term peripheral is preferred to describe such lesions or diseases. Of note, imaging cannot always determine whether a given lesion is located between two layers of pleura or within the pleura, or in the parenchyma and directly contiguous to the pleura (Figs 23–25).
Figure 6:
Centrilobular: Transverse CT image of the lungs shows diffuse centrilobular micronodules.
Figure 7:

Centrilobular: Transverse CT images of (A) right and (B) left lungs in two different patients show diffuse centrilobular micronodules.
Figure 8:
Diffuse: Transverse CT image of the right lung shows diffuse increase in lung attenuation caused by confluent ground-glass nodules.
Figure 9:

Endobronchial: Transverse CT images in (A) lung and (B) mediastinal window through the right lung show partially obstructing endobronchial lesion in the bronchus intermedius (arrow).
Figure 10:
Endobronchial: (A) Transverse and (B) coronal contrast-enhanced CT images through left lung of the same patient show endobronchial lesion in left upper lobe bronchus (arrow).
Figure 11:
Extrapleural: Transverse CT image of the left lower lobe shows extrapleural fat (arrows).
Figure 12:

Fissural: Transverse CT images of the right lung in two different patients show (A) solitary and (B) multiple perifissural micronodules (arrows).
Figure 13:
Focal ground-glass opacities: Transverse CT image of the upper lobes shows subtle, focal ground-glass opacities in the right and left lungs (arrows).
Figure 14:

Geographic: (A, B) Transverse contrast-enhanced CT images of the right lung in two different patients show ground-glass opacities with geographic distribution.
Figure 15:
Multifocal: Transverse CT image shows multifocal opacities (arrows).
Figure 16:
Multifocal: Transverse CT image shows multifocal opacities (arrows).
Figure 17:
Peribronchovascular: Transverse contrast-enhanced CT image of the right lung shows radiation reaction with peribronchovascular thickening (arrow).
Figure 18:
Peribronchovascular: Transverse CT image of the right lung shows nodules with peribronchovascular distribution (arrow).
Figure 19:

Perilobular: Transverse CT images of the (A) right and (B) left lung in two different patients show opacities with perilobular distribution (arrows).
Figure 20:
Perilobular: Transverse CT image of the left lower lobe shows opacities with perilobular distribution.
Figure 21:

Perilymphatic micronodules: (A, B) Transverse CT images of the left lung in the same patient at different levels show micronodules with perilymphatic distribution (arrows).
Figure 22:
Perilymphatic micronodules: Transverse CT image of the left lung shows micronodules with perilymphatic distribution along the fissure (open arrow) and the bronchus (solid arrow).
Figure 23:

Pleural: Transverse CT images of the left lung in (A) lung and (B) soft tissue window show diffuse nodular pleural thickening (arrows).
Figure 24:

Pleural: Transverse CT images of the right lower lobe in (A) lung and (B) soft tissue window show focal pleural lesion (arrow).
The prefix juxta- has been used inconsistently to describe lesions that are variously in proximity or in contact with the pleura* or a fissure* (juxtafissural, juxtapleural) (24). We recommend instead using the more stringent terminology described above.
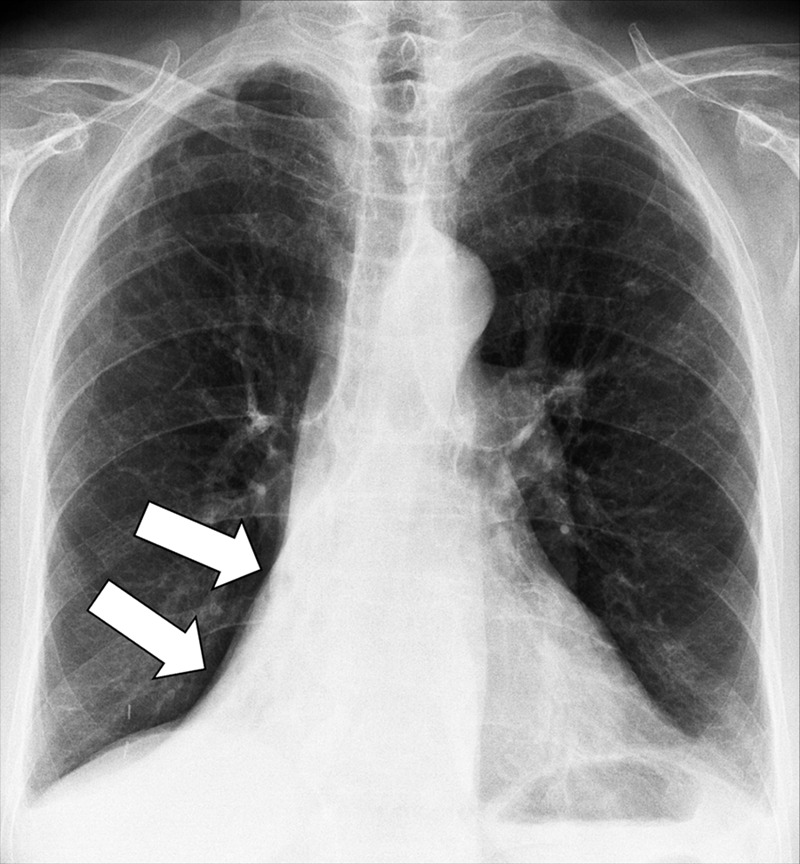
Aortopulmonary Window (Anatomy) (Fig 26)
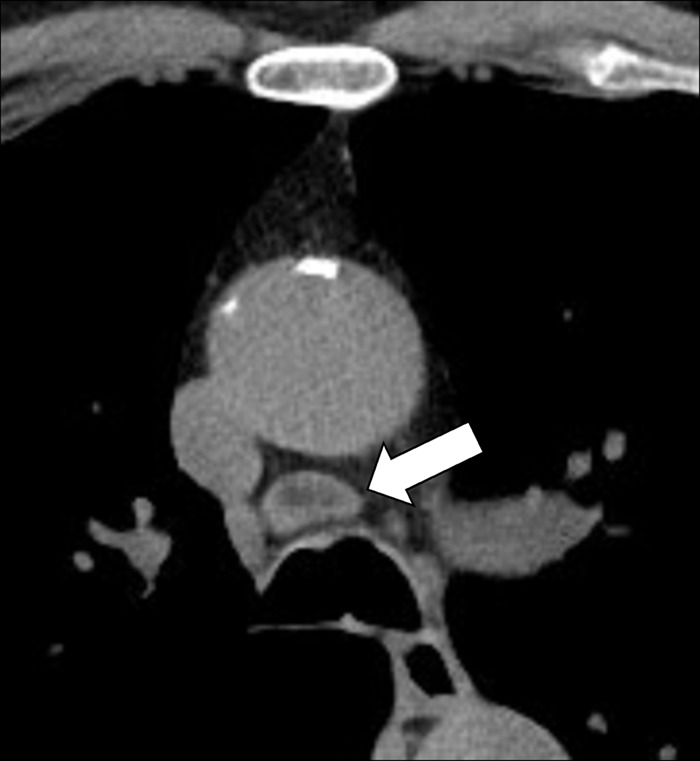
Figure 26:

Aortopulmonary window: (A) Frontal chest radiograph and (B) coronal CT image reconstruction in the same patient show aortopulmonary window (arrow).
The aortopulmonary window is a mediastinal compartment delimited anteriorly by the ascending aorta, posteriorly by the descending aorta, cranially by the aortic arch, caudally by the left pulmonary artery, medially by the trachea and the lateral wall of the left main bronchus, and laterally by the medial pleura* covering the left lung. The aortopulmonary window contains lymph nodes (lymph node*) and connective tissue and is traversed by the left phrenic nerve, the left vagus nerve, the left recurrent laryngeal nerve, and the left bronchial arteries. It is separated into a medial and lateral part by the ligamentum arteriosum (25).
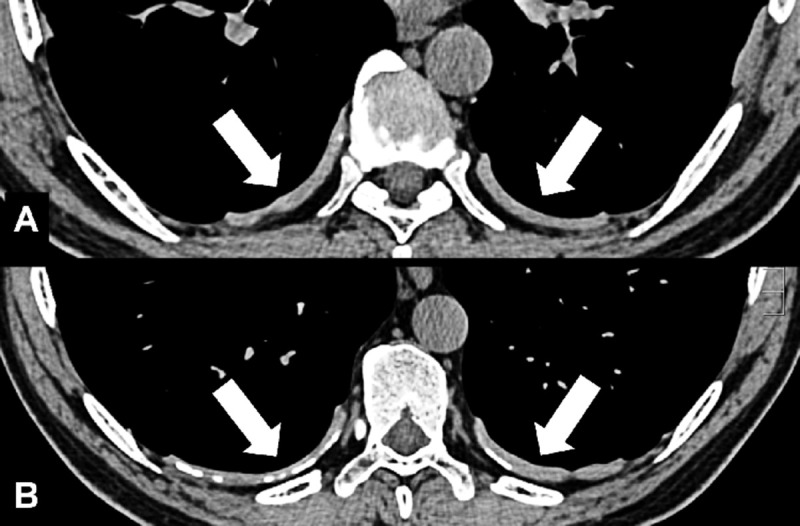
Apical Cap (Pathology) (Fig 27)
Figure 27:
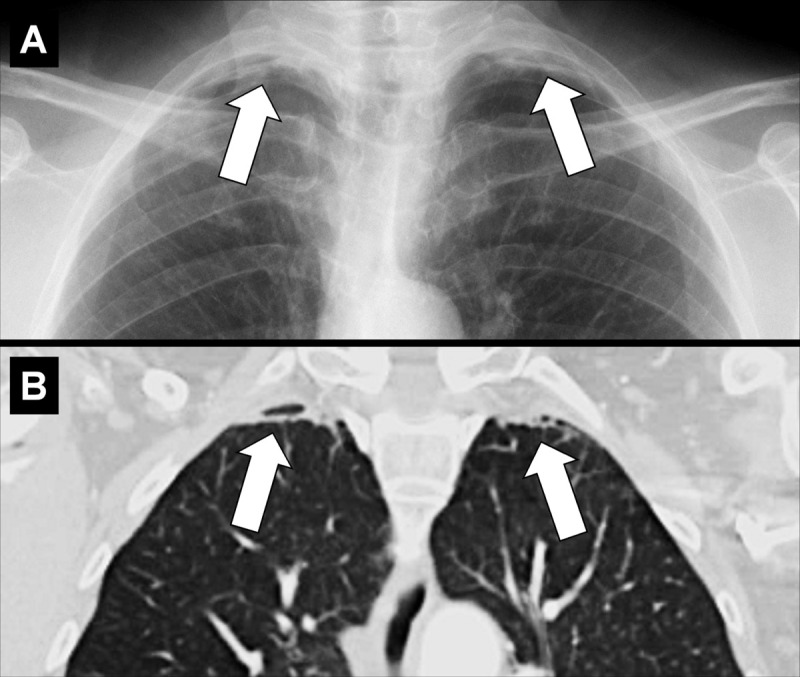
Apical cap: (A) Frontal chest radiograph and (B) coronal CT image reconstruction in the same patient show bilateral apical caps (arrows).
Apical caps are cap-like rims at the lung apices, often bilateral, usually caused by pulmonary and/or pleural fibrosis* displacing extrapleural fat. Chronic ischemia causing a plaque of elastotic fibrosis of the visceral pleura*, with or without subpleural lung parenchyma*, has been suggested as the potential pathogenesis, which is variably associated with aging. In addition, apical caps can be caused by fluid collections associated with infection, neoplasms, or trauma, either extrapleural or within the pleural space. A left apical cap can be caused by hematoma, such as resulting from aortic rupture (26–28). Moderate or severe apical pleural caps also can be seen in upper lobe fibrosis, including pleuroparenchymal fibroelastosis (29).
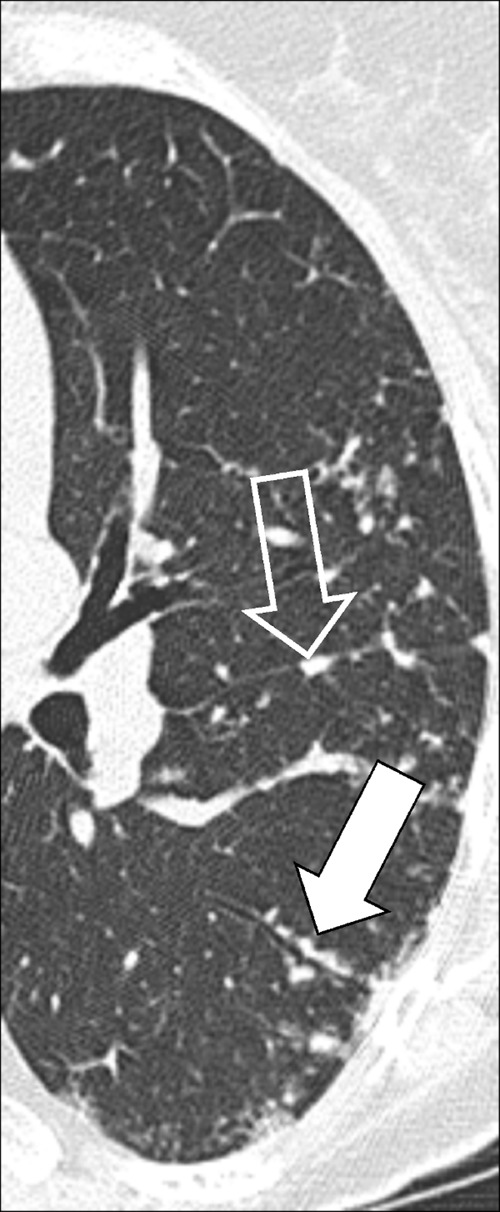
Architectural Distortion (Pathology) (Fig 28)
Figure 28:

Architectural distortion: Transverse CT images of the (A, B) right and (C) left lung of three different patients show traction bronchiectasis (solid arrows). Note the presence of coexisting fibrosis and architectural distortion (open arrow in B and C).
Architectural distortion is characterized by the focal or diffuse derangement of the normal pulmonary anatomy, with abnormal displacement or disruption of airways*, vessels, and interstitium*. It is typically accompanied by volume loss* and is commonly seen in fibrotic lung diseases (30,31).
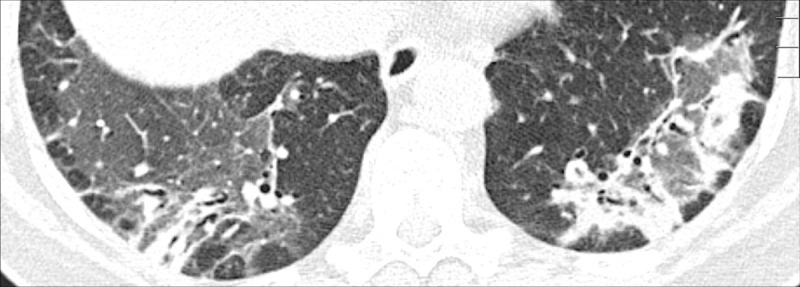
Asbestosis (Pathology) (Fig 29)
Figure 29:
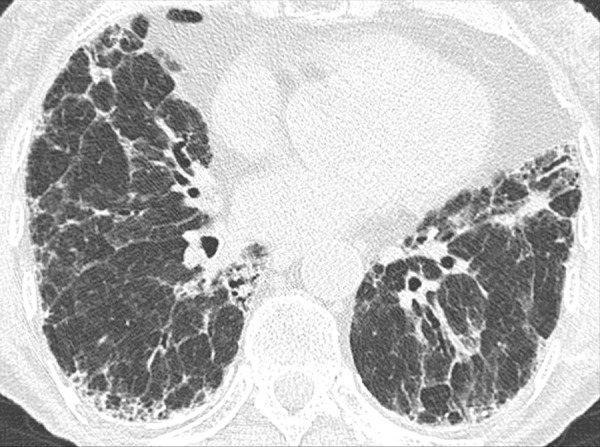
Asbestosis: Transverse CT images of the lower lobes show fibrosis following asbestos exposure. Note that the presence of pleural plaques is not required for the diagnosis.
Asbestosis is an occupational lung disease characterized by lower-lobe predominant pulmonary fibrosis caused by inhalation of asbestos fibers. Once established, fibrosis can progress. However, even without progression, the risk of lung cancer is increased. In addition, asbestos exposure increases the risk of mesothelioma. However, asbestosis is usually associated with high levels of asbestos exposure, in distinction to mesothelioma. Although pleural plaques, calcified or noncalcified, may also be identified, their presence is not essential for the diagnosis (pleural plaque*) (32,33).
Aspiration (Pathology)
Aspiration is the unintended inhalation of solid and/or fluid substances (“aspirate”). Depending on its location and extent within the airways*, the aspirate can cause atelectasis*, inflammation (“aspiration pneumonitis/bronchiolitis”), or infection (“aspiration pneumonia”). Changes caused by aspiration are most commonly seen in the posterior portions of the lungs and predispose to infection with anaerobic bacteria. Sequelae of aspiration, including scarring and bronchiectasis, can be seen in variable anatomic locations but tend to follow the direction of gravity (34,35).
Atelectasis (Pathology) (Figs 30–40)
Figure 30:

Atelectasis: Frontal chest radiographs of two different patients show (A) partial and (B) complete right upper lobe atelectasis (arrows).
Figure 40:
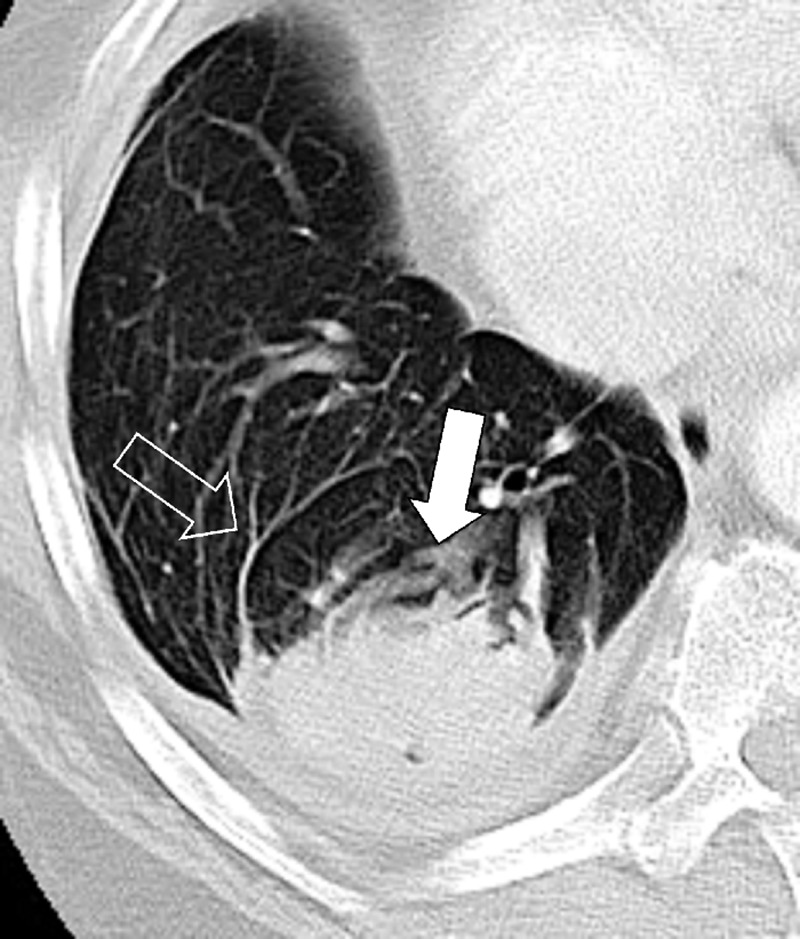
Atelectasis: Transverse CT image of the right lower lobe shows rounded atelectasis (solid arrow) adjacent to thickened pleura and a small pleural effusion, and “comet tail” (open arrow).
Atelectasis is a partial or complete collapse* of the lung. Atelectasis can be caused by loss of negative pressure in the pleural space and/or by compression of lung parenchyma* (eg, by pleural effusions*), by resorption of air following obstruction (eg, by a foreign body or a neoplasm), or by an increase in alveolar surface tension (eg, by surfactant dysfunction). Atelectasis shows lower volume and higher attenuation than normal lung tissue and is often associated with abnormal displacement of fissures (fissure*), bronchi, vessels, hyperinflation of adjacent lobes (lobe*), or obscuration of cardiac and mediastinal interfaces (36,37).
Lobar: atelectasis of an entire pulmonary lobe* (Figs 30–37).
Linear (formerly “plate-like” or “band-like”): descriptor for local atelectasis with a linear, plate-like, or band-like shape (Figs 38, 39).
Figure 37:

Atelectasis: Frontal chest radiographs of two different patients with complete left lower lobe atelectasis (arrow) show that the size of the atelectatic lobe can vary from (A) large to (B) small.
Figure 38:

Atelectasis: (A, B) Frontal chest radiographs of two different patients show bilateral linear atelectasis (arrows).
Figure 39:
Atelectasis: Transverse image of the left upper lobe shows linear atelectasis along the major fissure (arrow).
Figure 31:

Atelectasis: Frontal chest radiographs of the right lung in the same patient show (A) complete and (B) partial atelectasis (arrow) of the right upper lobe.
Figure 32:

Atelectasis: (A) Frontal chest radiograph and (B) coronal CT image reconstruction show right upper lobe atelectasis (solid arrow). Note presence of juxtaphrenic peak in B (open arrow).
Figure 33:

Atelectasis: (A) Frontal chest radiograph and (B, C) coronal CT image reconstructions in mediastinal and lung windows show right upper lobe atelectasis (solid arrow) caused by central tumor (open arrow). Note presence of juxtaphrenic peak in A (open arrow).
Figure 34:
Atelectasis: (A) Frontal and (B) lateral chest radiograph of the same patient show middle lobe atelectasis (arrow).
Figure 35:
Atelectasis: Frontal chest radiograph shows right lower lobe atelectasis (arrows).
Figure 36:

Atelectasis: (A) Frontal and (B) lateral radiograph shows complete left upper lobe and lingula atelectasis (solid arrows). Note presence of juxtaphrenic peak (open arrow).
Often seen in dependent lung regions, paralleling the hemidiaphragms on chest radiographs and the chest wall on CT examinations. Of note, the geometric definition of “line” refers to a one-dimensional structure. While the cross-sectional appearance of an atelectasis may appear linear, the atelectasis itself has greater dimensionality than a line.
Rounded: rounded portion of a collapsed lung, associated with invaginated fibrotic pleura* and thickened and fibrotic interlobular septa (interlobular septum*) (Fig 40).
Rounded atelectasis is the consequence of chronic or recurrent pleural effusions, as seen in asbestos-related disease, chronic cardiac or renal failure, or thoracic malignancies. At imaging, rounded atelectasis presents as a rounded mass* abutting the pleura, associated with adjacent pleural thickening. Distorted vessels and bronchi converging toward the atelectasis can have a curvilinear appearance (“comet tail sign”). It is most commonly seen in the posterior lower lobes.
Segmental: atelectasis of an anatomical segment* of the lung.
Subsegmental: atelectasis of an anatomical subsegment of the lung, which often appears linear.
Atoll Sign (Pathology) [Descriptor] (Figs 41, 42)
Figure 41:

Atoll sign: Transverse CT images of the (A) right and (B) left lower lobes in two different patients show focal ground-glass opacities surrounded by a thin ring of consolidation (arrows).
Figure 42:
Atoll sign: Transverse CT image of the left lower lobe shows focal ground-glass opacities surrounded by a thin ring of consolidation (arrows).
The atoll sign is the descriptive term for a focal ground-glass opacity* surrounded by a partial or complete ring of consolidation*. It is a nonspecific sign originally described in organizing pneumonia* and reported subsequently in various other lung diseases (38). A synonymous term is the “reversed halo” sign.
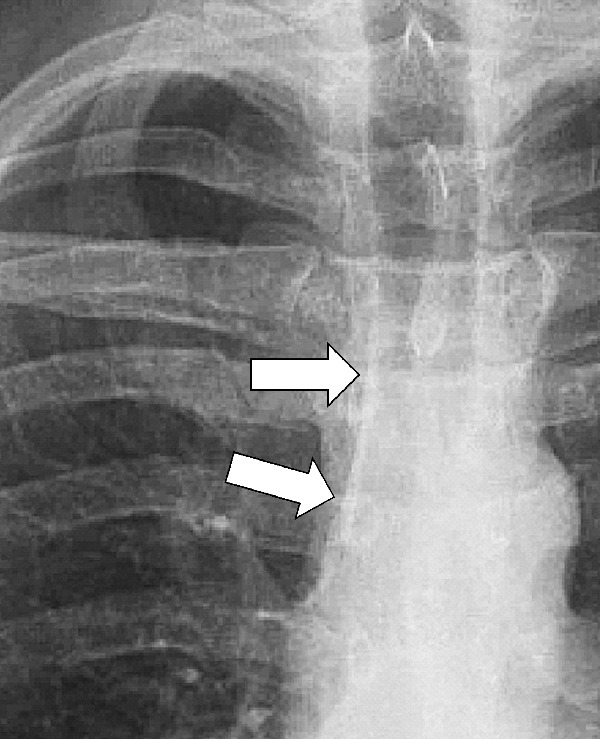
Azygoesophageal Recess (Anatomy) (Figs 43, 44)
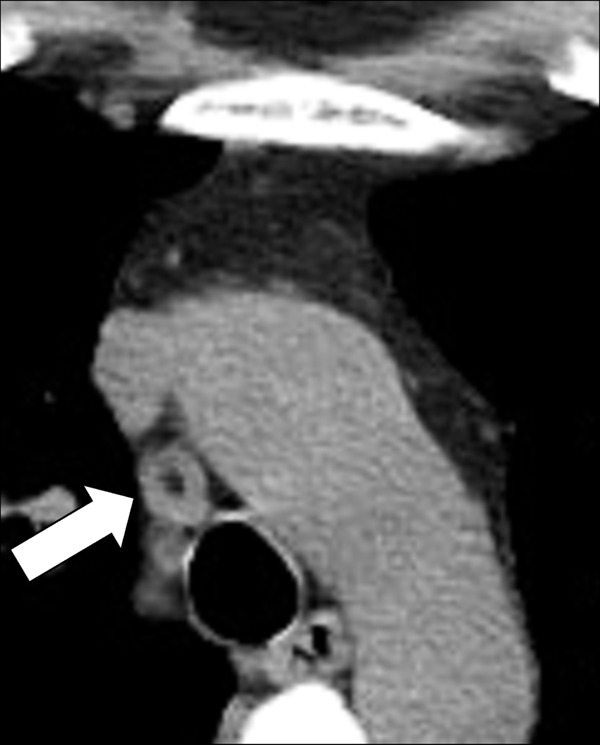
Figure 43:
Azygo-esophageal recess: Frontal chest radiograph of the mediastinum shows the azygo-esophageal recess (arrows).
Figure 44:
Azygo-esophageal recess: Transverse CT image of the right lung shows the azygo-esophageal recess (arrow), bordered by the azygos vein and the neighboring esophagus.
The azygoesophageal recess is the right posterior mediastinal recess into which the medial part of the right lower lobe* extends. It is limited cranially by the azygos arch, posteriorly by the azygos vein and the pleura* anterior to the vertebral bodies, and medially by the esophagus. On frontal radiographs, the medial part of the recess can be seen as a vertically oriented interface between the right lower lobe and the esophagus, and the superior part of the recess is seen as a smooth arc with convexity to the left at the interface with the azygos vein. Distortion or obliteration of the interface can reflect disease (eg, adenopathy or neoplasm). At CT, the recess merits attention because small lesions located in the recess are often invisible on radiographs (39).
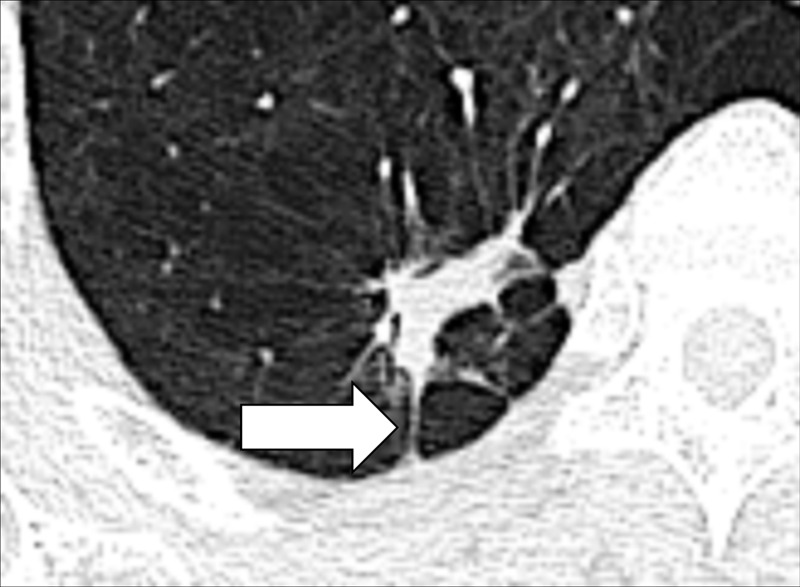
Bleb (Pathology)
A bleb is a circumscribed air-containing cystic* structure, exclusively pleural in location and usually subcentimeter in size. Blebs have been associated with small airways disease* and the occurrence of pneumothorax, notably in patients with active tobacco use (40). Small blebs are more readily appreciated with pathology than with imaging.
Blood Flow Redistribution (Pathology)
Blood flow redistribution is the nonspecific term for changes in blood flow, seen on both radiographs and CT examinations, reflecting regional redistribution resulting from pathologic conditions such as volume overload or chronic heart failure (41).
Bronchiole (Anatomy)
Bronchioles are non–cartilage-containing peripheral airways*. Terminal bronchioles are the most distal of the purely conducting airways. They give rise to respiratory bronchioles, from which alveoli arise. Respiratory bronchioles allow gas exchange, and branch into multiple alveolar ducts. Normal bronchioles are not visible using current CT techniques; however, in diseases of the peripheral airways, bronchioles with thickened walls and/or plugged bronchioles can become visible as nodular opacities (opacity*) on radiographs and/or as tree-in-bud* opacities on CT examinations. Infection and inflammation of the bronchioles are commonly referred to as “bronchiolitis” (9,42).
Bronchiectasis (Pathology) (Figs 28, 45)
Figure 45:

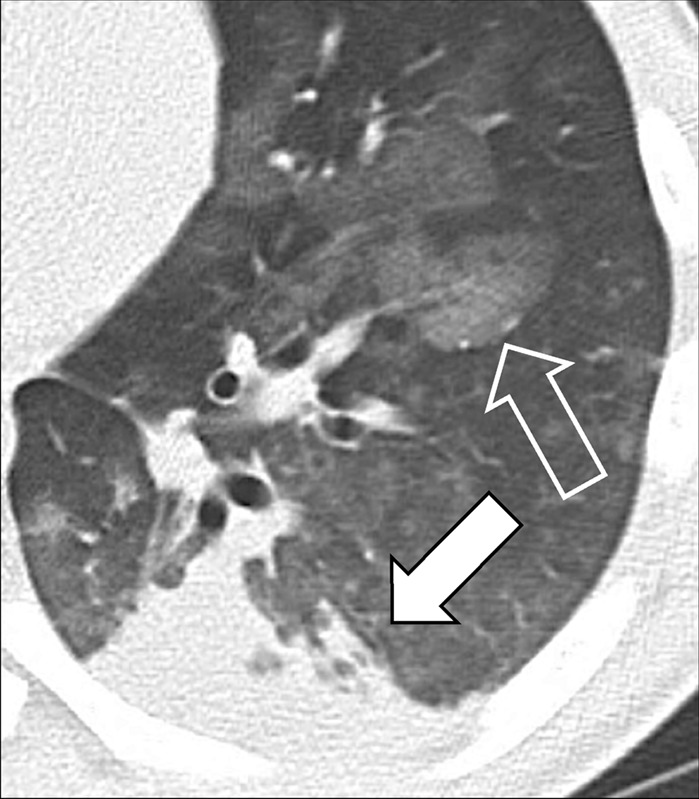
Bronchiectasis: Transverse CT images of the lungs in two different patients show severe bronchiectasis (solid arrow) in (A) right upper lobe and milder bronchiectasis (solid arrow) in (B) left lower lobe. Note the smaller diameter of the accompanying pulmonary artery (signet ring sign) (open arrow).
Bronchiectasis indicates a clinical condition of irreversible bronchial dilatation. In the absence of established chronicity, we recommend using the term “bronchial dilatation.” Bronchiectasis can be secondary to chronic inflammation, congenital, or caused by chronic infection and obstruction of more central airways*. It is often accompanied by bronchial wall thickening and/or mucoid impaction*. At CT, bronchiectasis manifests as dilatation of the bronchus relative to the accompanying pulmonary artery (signet ring sign*), lack of tapering, and presence of visible bronchi within 1 cm of the pleural surface (“tram-tracking”). Bronchial walls can be thickened and accompanied by scarring of the adjacent parenchyma (43,44).
Traction bronchiectasis (pathology): Dilatation of the bronchial lumen associated with thickened, irregular* bronchial walls, caused by fibrosis* (45). This term should only be used in the context of fibrosis (Fig 28).
Traction bronchiolectasis (pathology): Dilatation of bronchioles (bronchiole*) within the central portions of the secondary pulmonary lobule* typically associated with fibrosis* and honeycombing* (46).
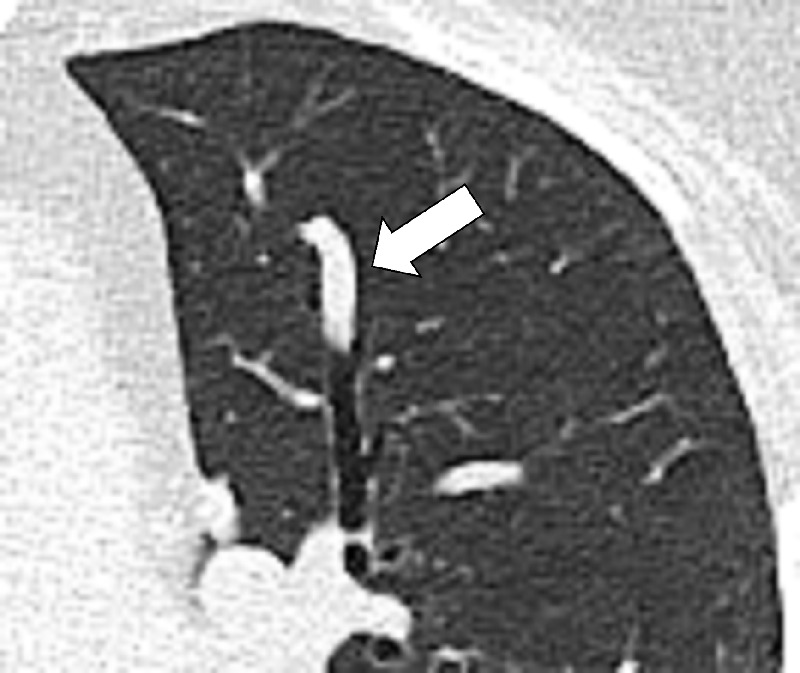
Bronchocele (Pathology) (Fig 46)
Figure 46:
Bronchocele: Transverse CT images of the right lung in two different patients show localized bronchial dilatation (A) with and (B) without mucoid impaction within a hyperlucent lobe, due to congenital bronchial atresia (arrow).
A bronchocele is a focal bronchial dilatation, often with mucoid impaction*. Bronchoceles can be either congenital (eg, in bronchial atresia) or caused by retained secretions or proximal obstruction (eg, by an endobronchial tumor). At CT, bronchoceles are typically branching V- or Y-shaped structures that may have a finger-like appearance. In bronchial atresia, the surrounding lung parenchyma* can have low attenuation because of reduced ventilation and, thus, decreased perfusion (3,47,48).
Broncholith (Pathology) (Fig 47)
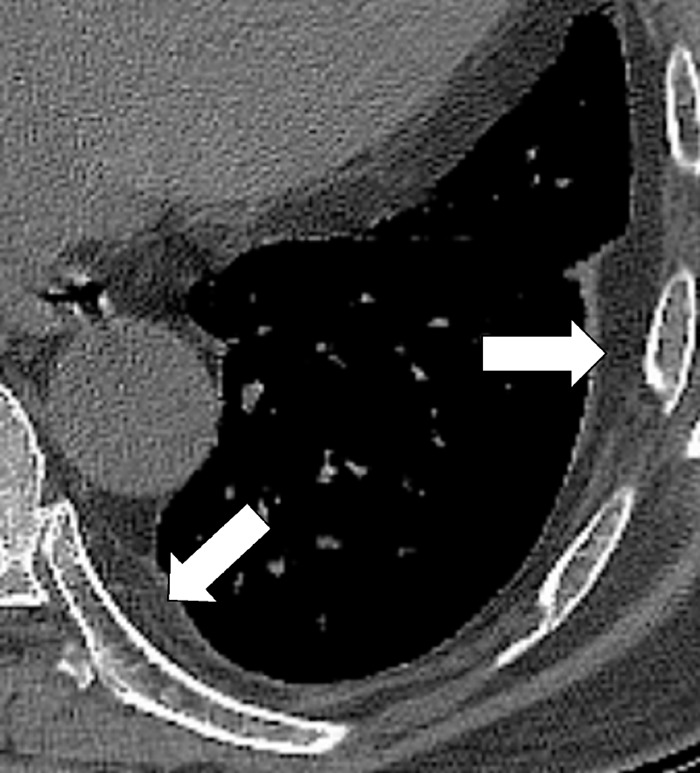
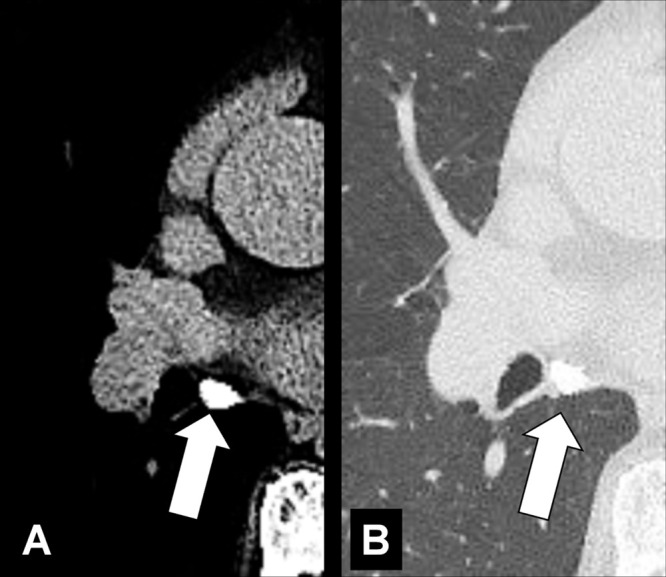
Figure 47:

Broncholith: Transverse CT image through the right lung (A, lung window; B, bone window) show broncholith (arrow).
A broncholith is calcified material within the bronchial lumen, generally caused by erosion of a peribronchial lymph node* into the lumen, and most commonly a result of previous granulomatous infection. Broncholiths manifest when calcified lesions directly adjacent to or within the bronchial wall erode into the lumen; they can be accompanied by distal atelectasis*, bronchiectasis*, or mucoid impaction* (49–51).
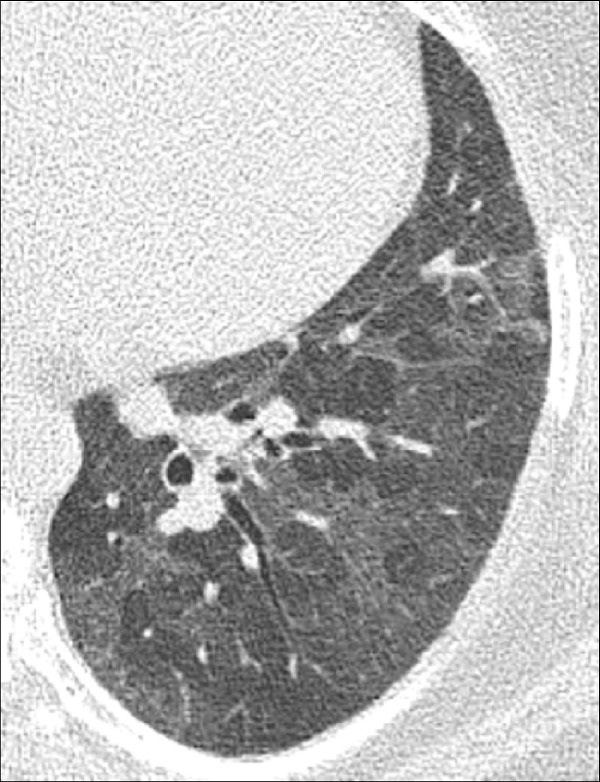
Bronchomalacia (Pathology) (Fig 48)
Figure 48:
Bronchomalacia: Transverse CT image at the level of the main bronchi in (A) inspiration and (B) expiration. Expiration causes substantial collapse of the main bronchi (arrows).
Bronchomalacia is the mechanical weakening of the bronchial cartilage, either congenital or caused by chronic inflammation and damage, leading to excessive bronchial collapsibility, of approximately 70%–80% of the original luminal diameter, and subsequent ventilatory impairment. Excessive collapsibility is best confirmed with dynamic CT performed during forced expiration. Bronchomalacia is often associated with the same phenomenon in the trachea (tracheomalacia*) and can be accompanied by thickening of the airway walls. Of note, a substantial degree of collapse may also occur in healthy individuals (52,53).
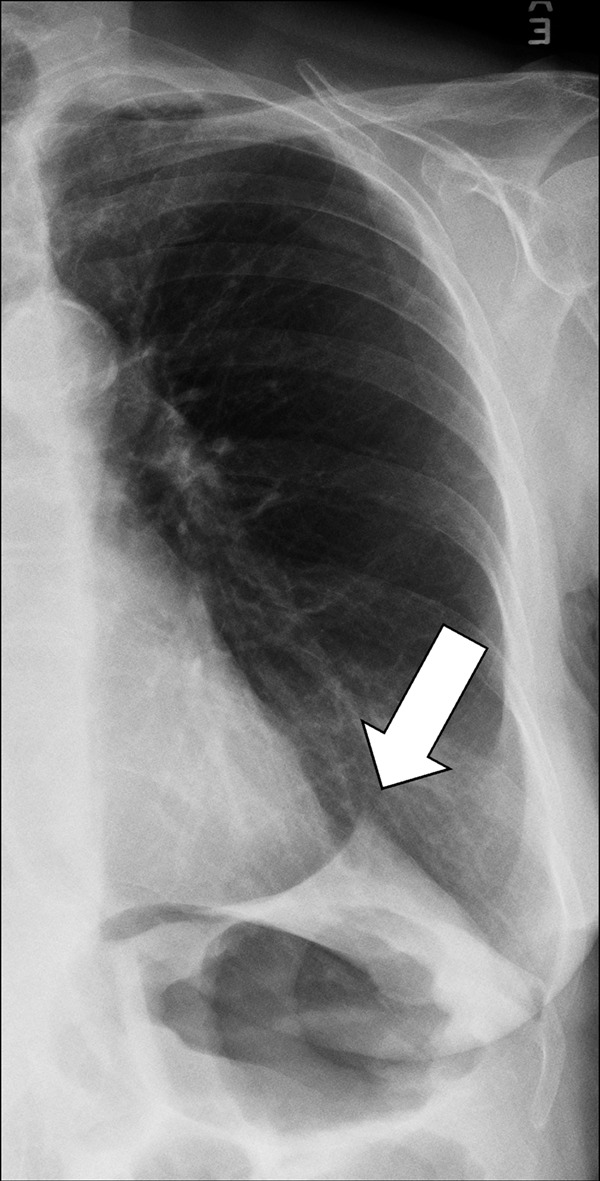
Bulla (Pl. Bullae) (Pathology) (Figs 49, 50)
Figure 49:
Bulla: (A) Frontal chest radiograph and (B) transverse CT image of the right upper lobe show an air-containing cystic structure lined by a thin layer of collapsed lung parenchyma (arrow).
Figure 50:
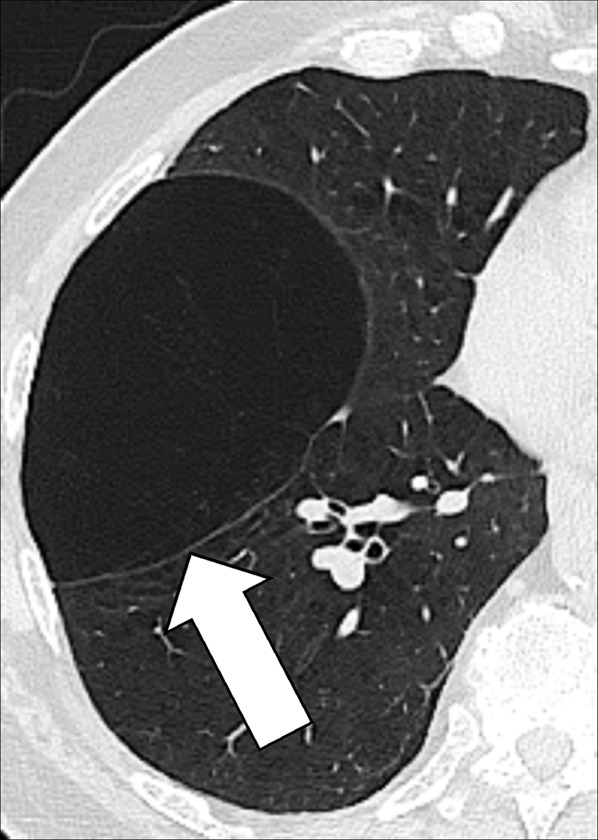
Bulla: Transverse CT image of the right upper lobe shows an air-containing cystic structure lined by a thin layer of collapsed lung parenchyma (arrow).
A bulla is a circumscribed air-containing cystic* structure in the lung parenchyma* lined by a thin layer of collapsed lung parenchyma. It is caused by dilatation, destruction, and confluence of airspaces (airspace*) distal to terminal bronchioles (bronchiole*). At imaging, a bulla typically appears as a rounded lucency, with a very fine and usually smooth wall (54).
Cavity (Pathology) (Figs 51–53)
Figure 51:
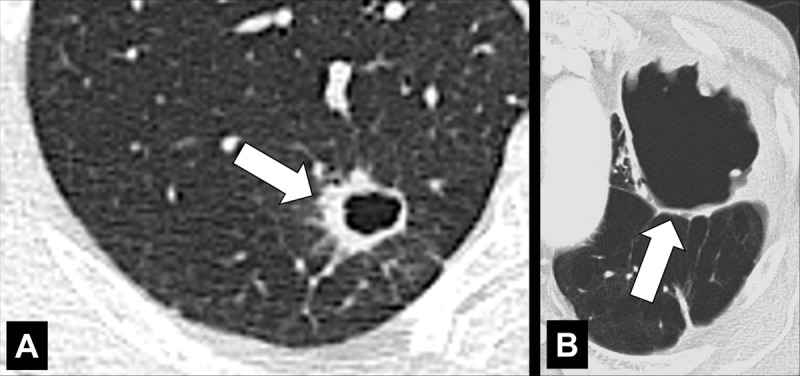
Cavity: Transverse CT image of the (A) right and (B) left upper lobe in two different patients show gas-filled structures with thick and partially irregular walls (arrow).
Figure 53:

Cavity: Transverse contrast-enhanced CT image of the left lower lobe shows (A) soft tissue and (B) lung window of gas-filled structure with thickened and irregular walls (arrow).
A cavity is an abnormal gas- or fluid-filled structure with a typically thick and often irregular* wall, usually produced by the expulsion or drainage of a necrotic part of the lesion via the bronchial tree. It may be isolated or associated with adjacent lung pathology, and a gas-fluid level may be present in the cavity (54,55). Cavities are to be differentiated from pseudocavities (56). A pseudocavity appears as an area of low attenuation in nodules (nodule*), masses (mass*), or consolidations (consolidation*) that represent spared parenchyma, normal or ectatic bronchi (bronchus*), or emphysema (emphysema*), rather than cavitation.
Figure 52:
Cavity: Transverse CT image of the left lower lobe shows two round gas-filled structures (arrows).
Collapse (Pathology)
In the lung, synonymous with atelectasis*.
Consolidation (Pathology) [Descriptor] (Fig 54)
Figure 54:
Consolidation with peripheral ground-glass: Transverse CT image of the left lower lobe shows consolidation (solid arrow) and ground-glass opacities (open arrow).
Consolidation refers to the increased attenuation of lung parenchyma* resulting from evacuation of air from the alveoli, and its replacement by fluid or other material. On radiographs, consolidation appears as a homogeneous increase in attenuation. At CT, it is defined as opacity* causing complete obscuration of the underlying bronchi and vessels, the latter only on unenhanced CT examinations. Patent bronchi within consolidation may form air bronchograms*. The term is a descriptor that does not indicate the pathologic nature of the condition causing the consolidation.
Cyst (Pathology) (Fig 55)
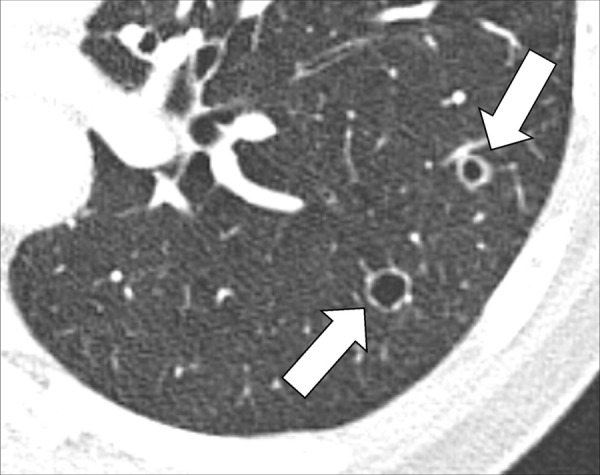
Figure 55:
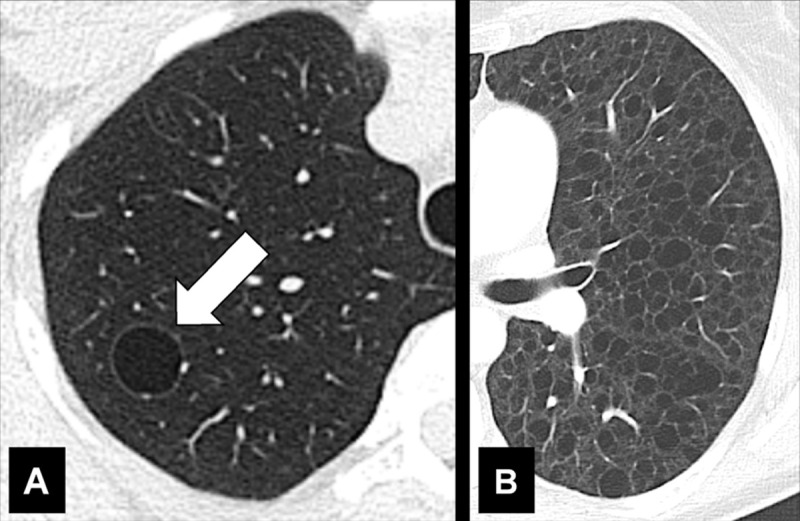
Cyst: Transverse CT images of the (A) right and (B) left lung of two different patients. Cysts are solitary (arrow) in A and diffuse in B.
A cyst is any circumscribed and well-defined air-containing structure in the lung parenchyma*. Cysts can originate from mechanisms such as airway obstruction with distal airspace* dilatation (check-valve mechanism), necrosis of airway* walls, or lung parenchymal destruction by proteases. A small number of lung cysts may be seen with aging (57). At imaging, a cyst appears as a circumscribed and well-defined radiolucency and/or low attenuation area with a thin and usually regular wall. Most cysts contain air but they can occasionally contain fluid or solid material. Of note, the radiologic and pathologic definitions of “cyst” differ (54,58,59).
Cystic (Pathology) [Descriptor] (Figs 49, 50, 55)
Cystic is the descriptive adjective designating lesions characterized by central air-equivalent attenuation, surrounded by a wall of variable thickness and regularity. There is unavoidable morphologic overlap between structures commonly described as “cystic” (bulla*, bleb*, cyst*), due to the lack of objective criteria to quantify the wall thickness of these structures, and because of a multitude of currently proposed definitions, rather than a decisive consensus in the literature. As the cause of cystic lesions is often difficult to determine at CT, the term “cystic” can be used as a descriptor without implying etiology.
Embolism (Embolus, Emboli) (Pathology) (Fig 56)
Figure 56:

Embolism with infarction: Transverse contrast-enhanced CT images in (A) soft tissue and (B) lung window show emboli (solid arrows) and corresponding infarction (open arrows). (C) Coronal CT image reconstruction and (D) frontal chest radiograph in the same patient show central embolus (solid arrow) and peripheral infarction (open arrow). Emphysema.
Embolism refers to the pathologic lodging of partially or completely obstructing material (embolus) inside of a blood vessel. The embolus may be a blood “clot” (ie, a thrombus), fat (fat embolism), air or another gas (gas embolism), amniotic fluid (amniotic fluid embolism), infectious material (septic embolism), neoplastic tissue (tumor embolism), or a foreign body. On ventilation-perfusion scans, areas affected by embolism appear as a “mismatch” between the ventilation and perfusion scans, with a ventilated perfusion defect (60,61). Partial or complete vascular occlusion caused by embolism may cause necrosis of the lung distal to the embolus (infarction*) (62,63).
Emphysema (Pathology) (Figs 57–64)
Figure 57:

Centrilobular: (A, B) Transverse CT images of the right upper lobes of two different patients show centrilobular emphysema.
Figure 64:

Visual subtypes of centrilobular emphysema: Transverse CT images of the right lung in different patients show visual subtypes of centrilobular emphysema according to reference 63: (A) trace emphysema, (B) mild emphysema, (C) moderate emphysema, (D) confluent emphysema, and (E) advanced destructive emphysema.
Emphysema is characterized by irreversible enlarged airspaces (airspace*) distal to and originating from the terminal bronchioles (bronchiole*), with destruction of alveolar walls (64). The absence of fibrosis was historically regarded as an additional criterion, but this is no longer the case because local fibrosis is now recognized to coexist with emphysema both histologically and at imaging. Emphysema is pathologically classified according to the anatomic area predominantly affected (65,66).
Centrilobular: Focal emphysematous destruction that originally affects the center of the secondary pulmonary lobule* and, if progressive, can eventually involve the entire lobule*. Even if severe, centrilobular emphysema tends to respect the borders of the lobule, which are not destroyed. On CT examinations, early centrilobular emphysema is characterized by small areas of low attenuation surrounded by normal lung, without clearly defined walls, often with upper lobe predominance. When progressive, larger areas of low attenuation can span several secondary pulmonary lobules (Figs 57–59).
Panlobular: Diffuse emphysematous destruction across the secondary pulmonary lobule*, the structures of which are effaced, sometimes with lower lobe predominance. On CT examinations, panlobular emphysema is characterized by larger and/or diffuse areas of low attenuation, where components of the normal lung architecture, and notably those of the secondary pulmonary lobule*, are no longer recognizable (Figs 60, 61).
Paraseptal: Focal emphysematous destruction of the distal acinus*, typically located near the pleural surface close to the chest wall, the mediastinum*, and interlobar fissures (fissure*). On CT examinations, paraseptal emphysema is characterized by foci of low attenuation separated by intact interlobular septa (interlobular septum*) thickened by associated mild fibrosis*. Architectural distortion* is typically absent (Figs 62, 63).
Figure 59:

Centrilobular: (A, B) Transverse CT images of the right upper lobes of two different patients show centrilobular emphysema.
Figure 60:
Panlobular: Transverse CT image shows panlobular emphysema.
Figure 61:
Panlobular: (A, B) Transverse CT images of the right upper lobes of two different patients show panlobular emphysema (arrow).
Figure 62:
Paraseptal: Transverse CT image of the left upper lobe shows paraseptal emphysema (arrows). Mild centrilobular emphysema is also present.
Figure 63:
Paraseptal: Transverse CT image of the upper lobes shows paraseptal emphysema (arrows).
Figure 58:

Centrilobular: (A, B) Transverse CT images of the right upper lobes of two different patients show centrilobular emphysema.
In addition to the pathologic definition of emphysema, visually defined CT subtypes of emphysema have been described (65) (Fig 64). The terms “interstitial emphysema” and “subcutaneous emphysema” are sometimes used to designate abnormal air collections in the pulmonary interstitium* and the soft tissues, respectively, as may result from barotrauma. These abnormalities are distinct processes and are not related to the destruction of lung parenchyma.
Empyema (Pathology) (Figs 65, 66)
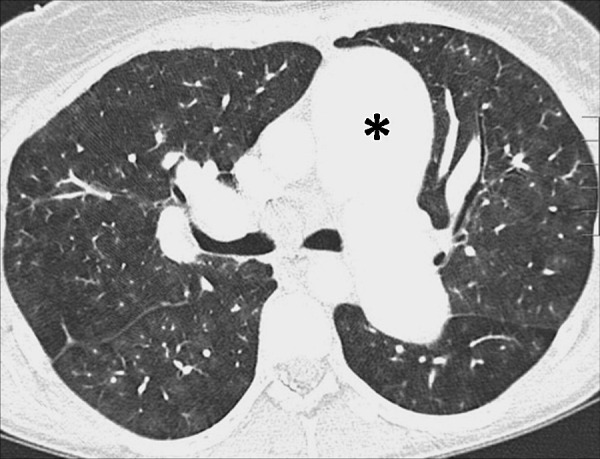
Figure 65:
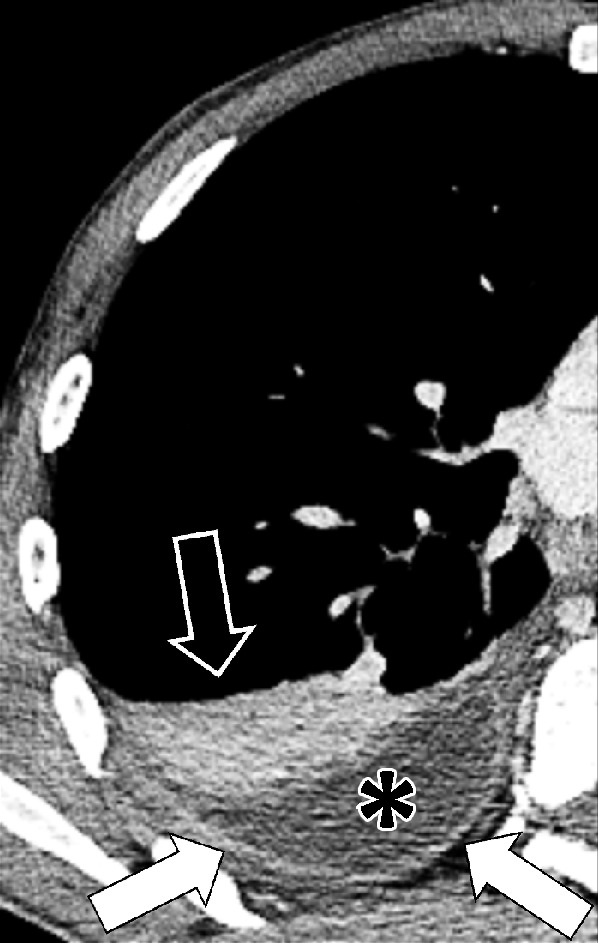
Empyema: Transverse contrast-enhanced CT image of the right lower lobe shows empyema (asterisk) surrounded by thickened and enhancing pleura (solid arrows), with adjacent atelectasis (open arrow).
Figure 66:
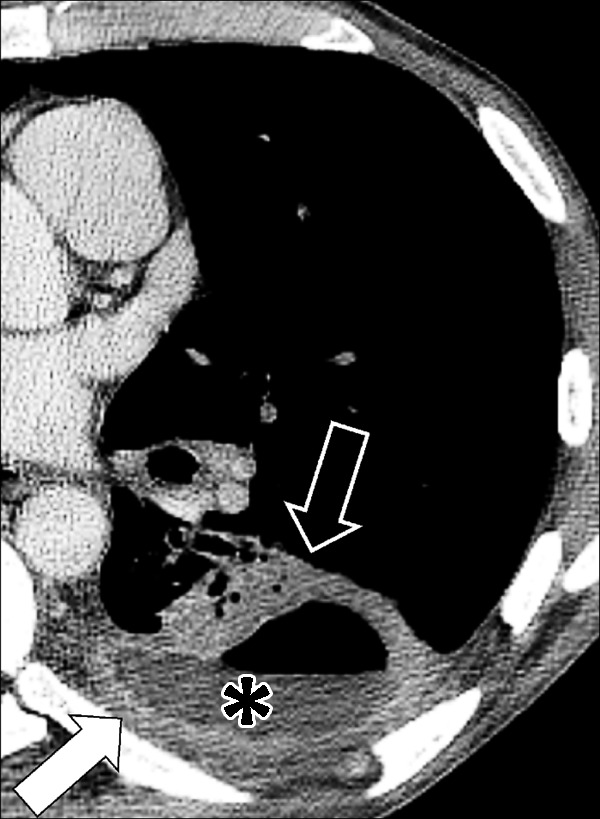
Empyema: Transverse contrast-enhanced CT image of the left lower lobe shows empyema (asterisk) with air-fluid level, surrounded by thickened and enhancing pleura (solid arrow), with adjacent atelectasis (open arrow).
Empyema is a collection of pus in the pleural space, most often occurring as a complication of pneumonia* or esophageal perforation. Empyema is commonly unilateral. On CT examinations, the fluid collection may contain locules of gas, and the pleura* is thickened and enhances after intravenous contrast administration. At the margins of the empyema, the pleura can be seen dividing into its visceral and parietal layers. This is referred to as the “split pleura sign,” which can occasionally help to distinguish an empyema from a parapneumonic effusion or a peripheral lung abscess (67–69).
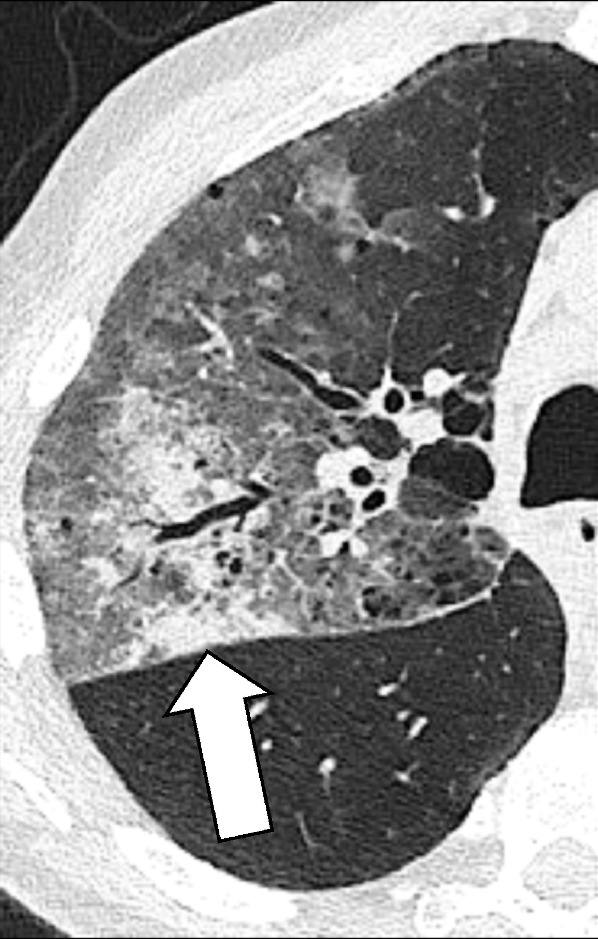
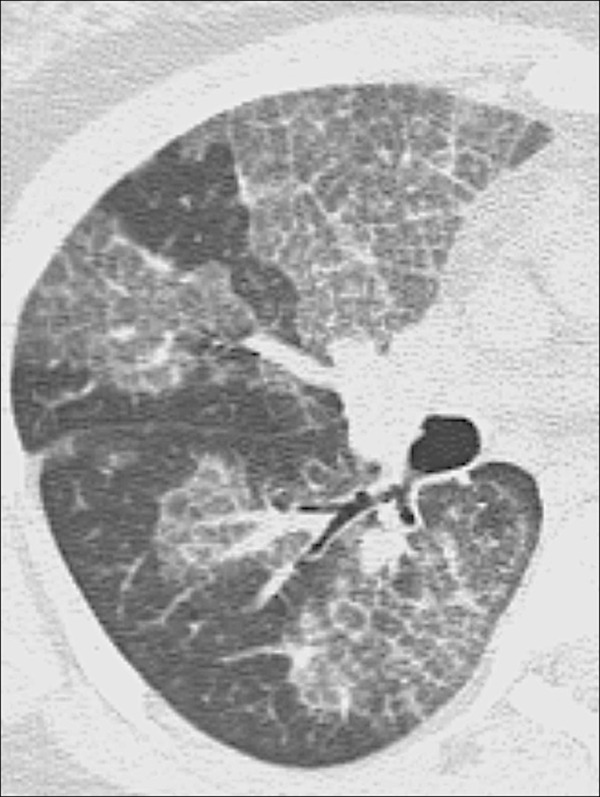
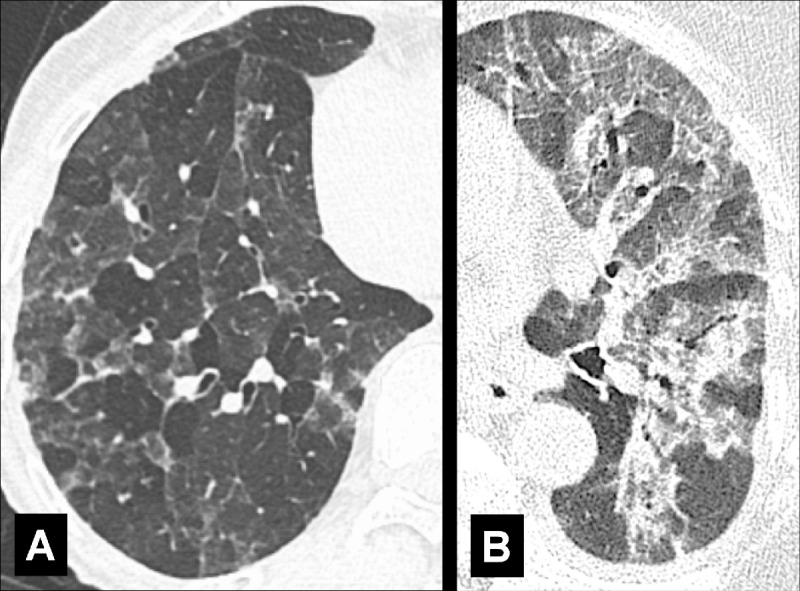
Fibrosis (Adj. Fibrotic) (Pathology) (Fig 67)
Figure 67:
Fibrosis: Transverse CT image of the right lower lobe shows extensive fibrosis with honeycombing and reticular opacities.
Fibrosis is the general term for a repair mechanism of the lung in which parenchyma* is permanently replaced by connective tissue, causing remodeling, architectural distortion*, and volume loss. Other CT signs of fibrosis include traction bronchiectasis* or bronchiolectasis* and, potentially, honeycombing*. Fibrosis can be the result of mechanical, inflammatory, infectious, or iatrogenic damage. It can be focal or diffuse in distribution and is often accompanied by functional impairment.
Fissure (Anatomy) (Figs 68–72)
Figure 68:
Fissure: Transverse CT image of the right lung shows major fissure (arrows).
Figure 72:
Incomplete: Transverse CT image of the left lung shows absence of the medial portion (solid arrow) of the left major fissure (open arrow).
A fissure is a structure consisting of two layers of infolded visceral pleura* that separates lobes (lobe*) (Fig 68). The left major (oblique) fissure separates the left upper lobe* and the left lower lobe. The right minor (horizontal) fissure separates the right upper lobe and the middle lobe. The right major (oblique) fissure separates the right lower lobe from the right upper and middle lobes. On CT examinations, normal fissures are seen as thin and regular lines (70–73).
Accessory: Supernumerary fissures usually separating segments (segment*) rather than lobes (Figs 69, 70).
Azygos: Developmental variant consisting of a fold of pleura* pulled through the lung towards the hilum* by a non-migrating right posterior cardinal vein, one of the embryological precursors of the azygos vein. Because the azygos fissure has two visceral and two parietal layers, it is in fact a pseudofissure (Fig 71).
Incomplete: Partial absence of a fissure between two lobes. Incomplete fissures allow collateral ventilation between two lobes. Therefore, their detection is relevant, for example before emphysema* treatment with endobronchial occlusive devices (Fig 72).
Figure 69:

Accessory: Transverse CT image of the right lung shows two accessory fissures in the right lower lobe (arrows).
Figure 70:
Accessory: (A) Transverse and (B) sagittal CT images of the left lung of the same patient show accessory fissure in the left lower lobe (arrow).
Figure 71:
Azygos: Transverse CT image of the right upper lobe shows azygos fissure (arrows). This structure is in fact a pseudofissure, as it consists of four rather than the normal two pleural layers.
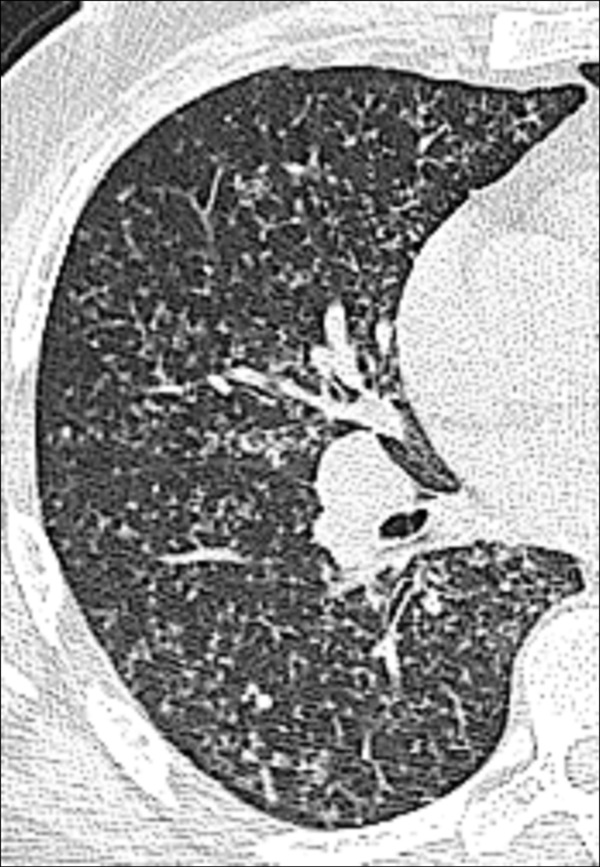
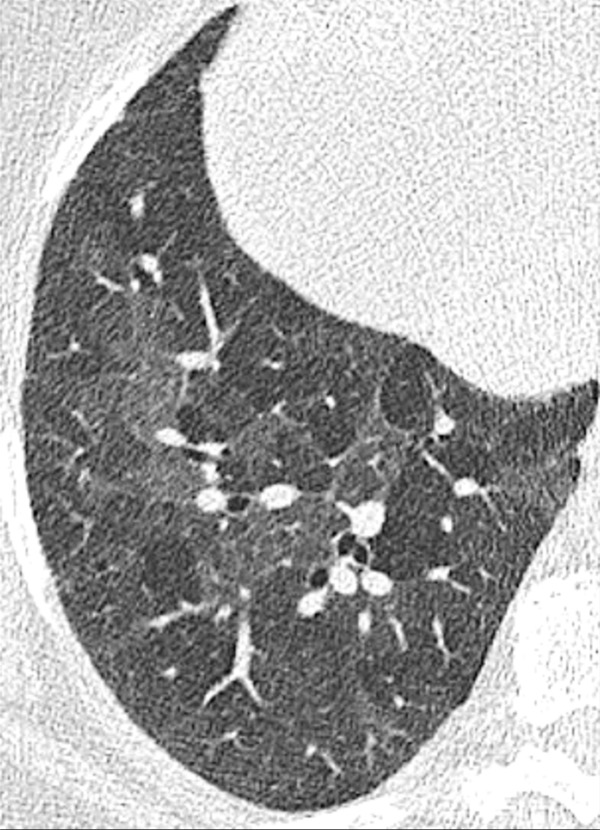
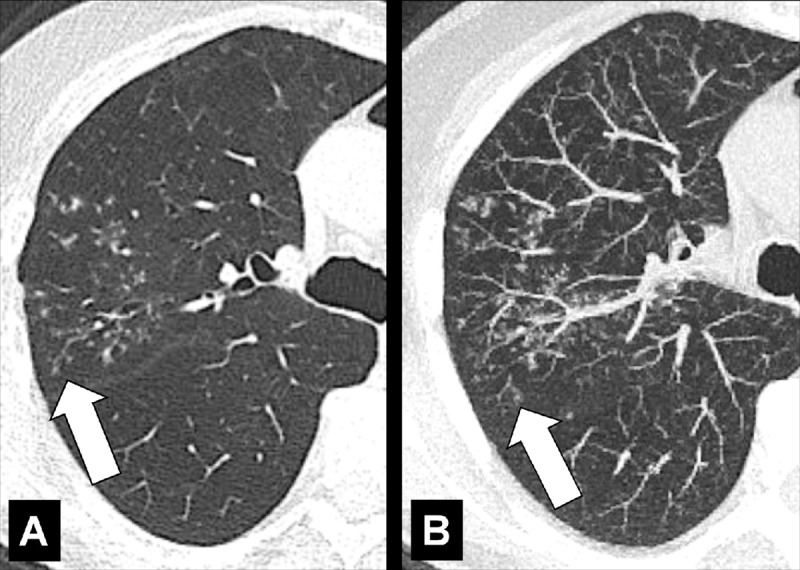
Ground-Glass (Physiology/Pathology) (Figs 73, 74)
Figure 73:

Ground-glass opacity: (A–C) Transverse CT images of the left lung of three different patients show ground-glass opacities. Opacity is subtle and focal in A (arrow), subtle and diffuse with centrilobular nodules in B, and severe and diffuse with mild reactive airway dilatation in C.
Figure 74:
Ground-glass opacities and consolidation: Transverse CT image of the right lung shows ground-glass opacities and focal consolidation (arrow).
Ground-glass refers to an area of increased attenuation that does not completely obscure the underlying bronchial and vascular structures. Although historically first described on radiographs (74), specifics of this term have been defined for CT and it should only be applied in the context of CT. Accurate identification of a ground-glass opacity* requires thin CT sections (equal to or thinner than 1.5 mm) acquired at full inspiration, preferably reconstructed with a high spatial frequency algorithm, and displayed with wide window widths. The finding is nonspecific, as ground-glass can be caused by any abnormal process below the resolution of the CT scanner that does not completely displace alveolar air, for example, partial filling of alveoli by fluid or cellular material, an increase in capillary blood volume, histologic fibrosis, a lepidic pattern of adenocarcinoma, or a combination of the above (75).
Halo (Pathology) (Fig 75)
Figure 75:
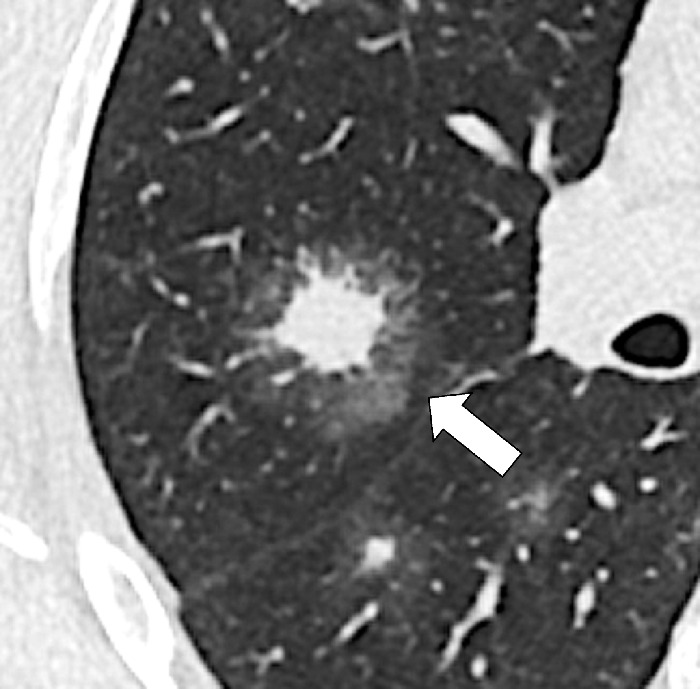
Halo: Transverse CT image of the right lung shows a ground-glass halo (arrow) surrounding central nodular consolidation.
A halo is a rim of ground-glass opacity* surrounding a nodule*, mass*, or consolidation*. The presence of a halo is nonspecific but often reflects local hemorrhage around an infectious or neoplastic lesion (eg, invasive aspergillosis) or lepidic tumor growth (eg, primary adenocarcinoma) (76,77).
Hilum (Pl. Hila, Adj. Hilar) (Anatomy)
The hilum is the site at the medial aspect of the lung, which is not covered by visceral pleura*, adjacent to the mediastinum*, where vessels and bronchi enter and leave the lung. The hilum contains bronchi, arteries, veins, lymphatic vessels, lymph nodes, nerves, and other structures (78,79).
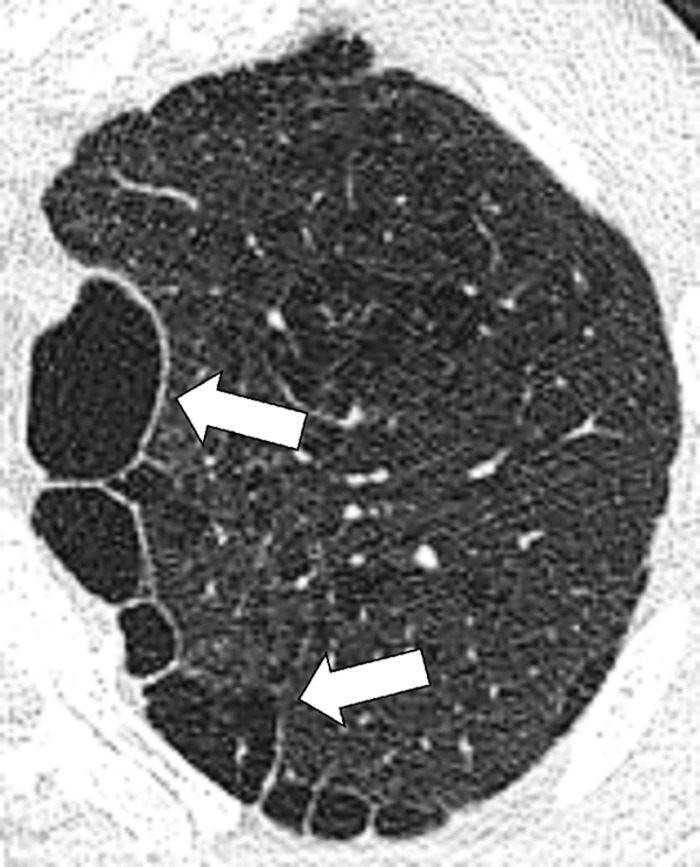
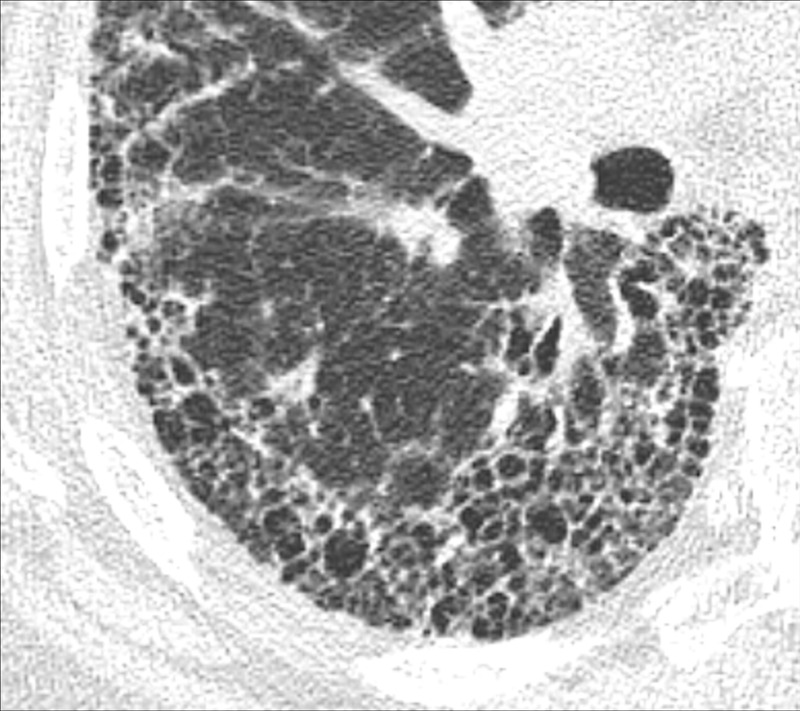
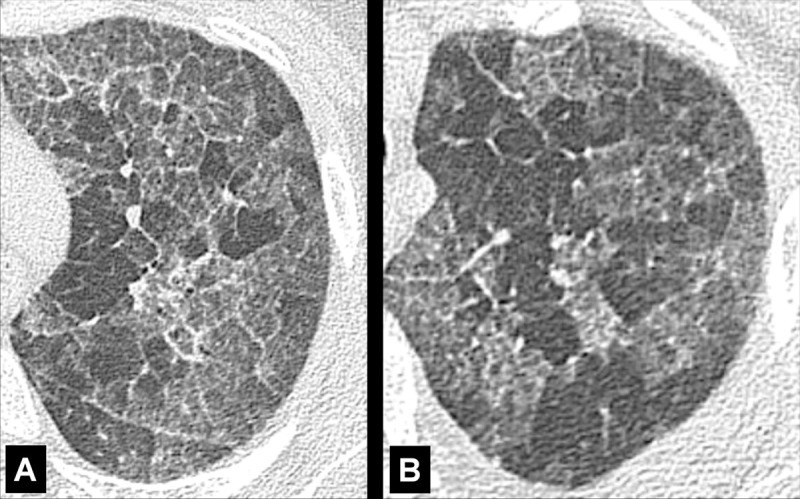
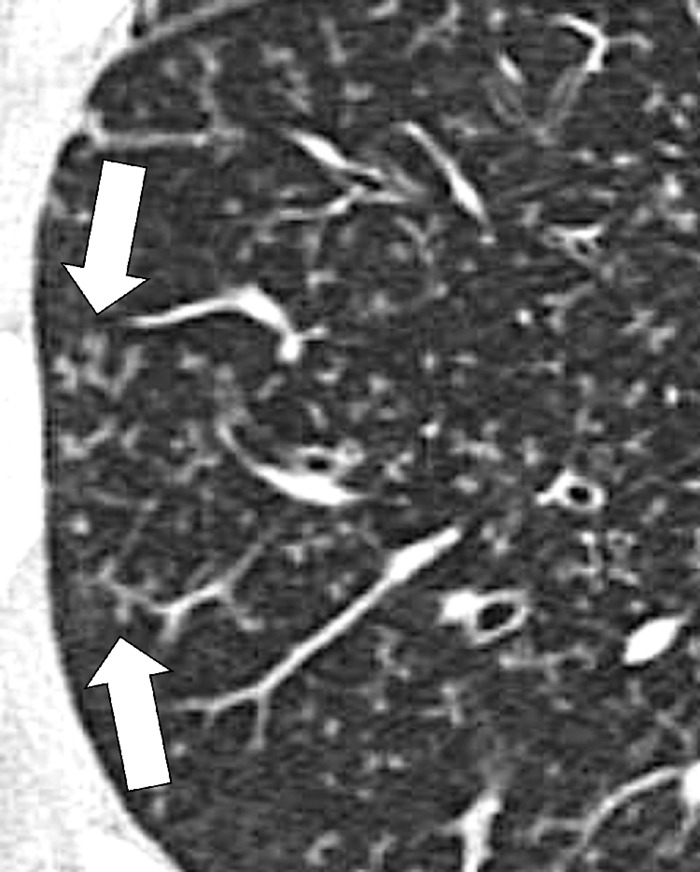
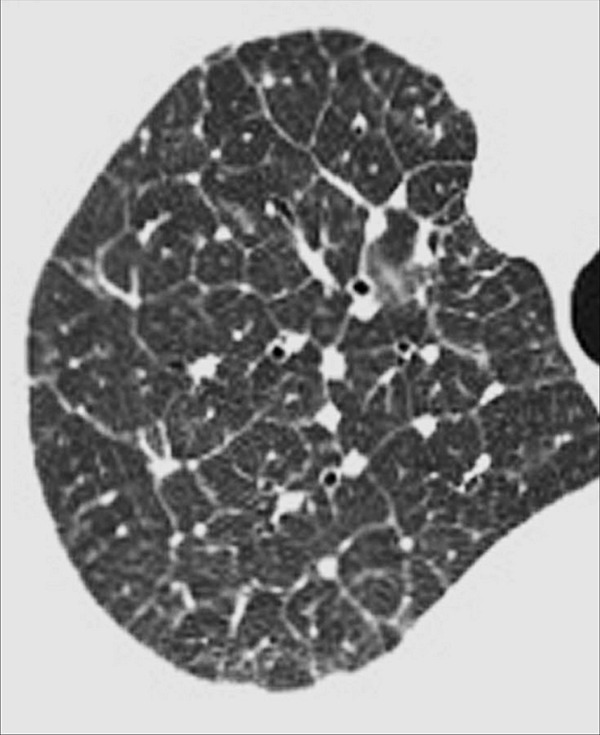
Honeycombing (Pathology) (Figs 76–78)
Figure 76:
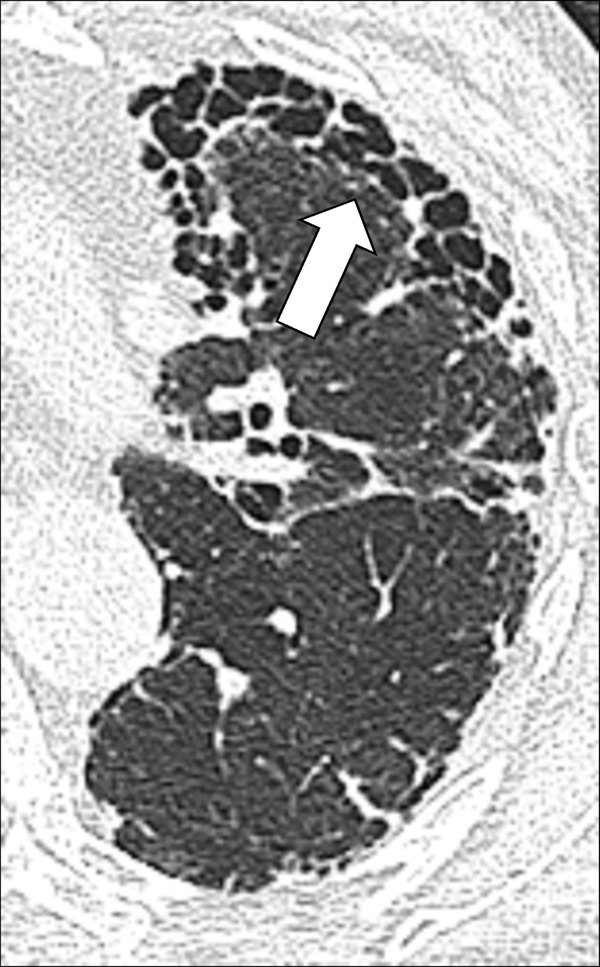
Honeycombing: Transverse CT image of the left lung shows honeycombing (arrow).
Figure 78:
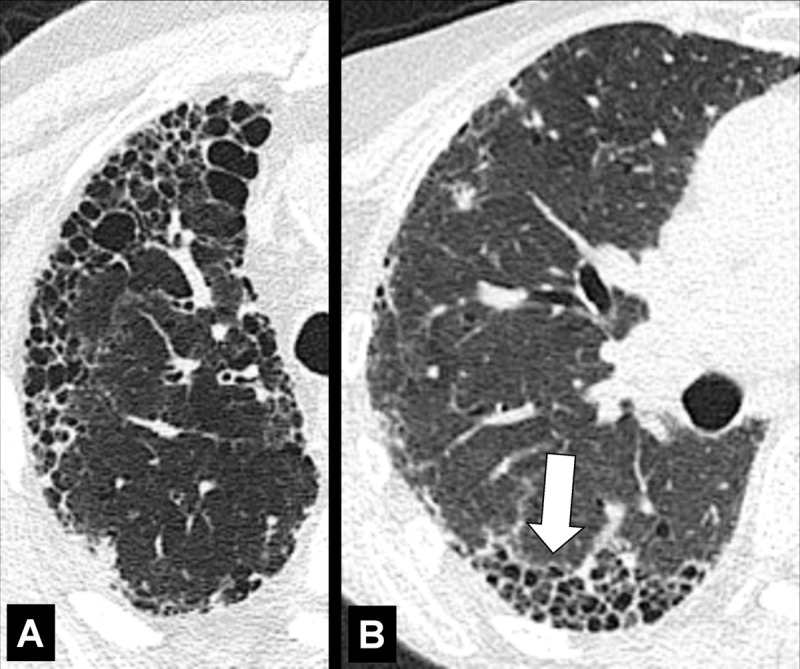
Honeycombing: (A, B) Transverse CT image of the right lung in two different patients shows honeycombing (arrow).
Honeycombing represents the destruction of lung parenchyma* with loss of architecture and well-defined adjacent cystic* structures, typically clustered in the subpleural region. The traditional definition requires several layers of cysts (cyst*), but in current practice, this threshold has been reduced to a single layer of cysts, provided other signs of fibrosis are present (30,80). The diameter and wall thickness of the cysts are variable but their presence is inevitably accompanied by the complete effacement of normal lung architecture and usually occurs with other signs of pulmonary fibrosis*, including traction bronchiolectasis*. Of note, honeycombing can also exist at the microscopic level and does not necessarily reflect the CT appearance of honeycombing (81). Care should be exercised when using the term honeycombing, as it implies substantial fibrosis (30,82), and the term should only be used if other signs of fibrosis are present.
Figure 77:
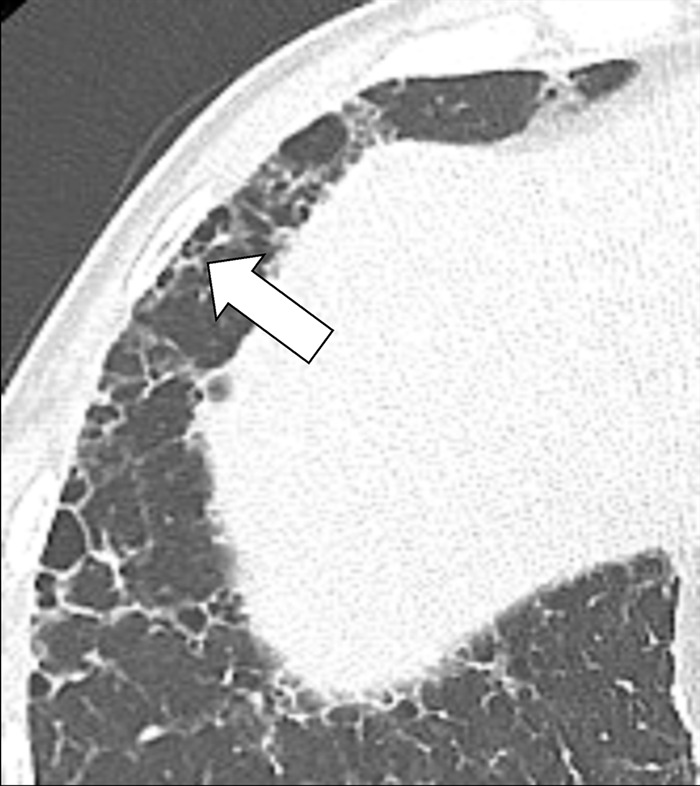
Honeycombing: Transverse CT image of the right lung shows mild honeycombing (arrow).
Infarction (Pathology) (Fig 56)
Infarction is the result of parenchymal damage from vascular obstruction or occlusion, caused by either emboli or pathologic changes of the vessel wall. At imaging, a pulmonary infarct is typically a triangular, dome-, or wedge-shaped opacity*, with the base abutting the pleura* and the apex directed toward the hilum*. The opacity reflects local edema, hemorrhage, necrosis, late organization and/or scarring, or a combination of these, depending on the timing of imaging during the natural history of the vascular occlusion (embolus*). However, many “infarcts” seen in acute pulmonary embolism* are due to edema and hemorrhage without necrosis and hence are not true infarcts.
Interlobular Septum (Anatomy)
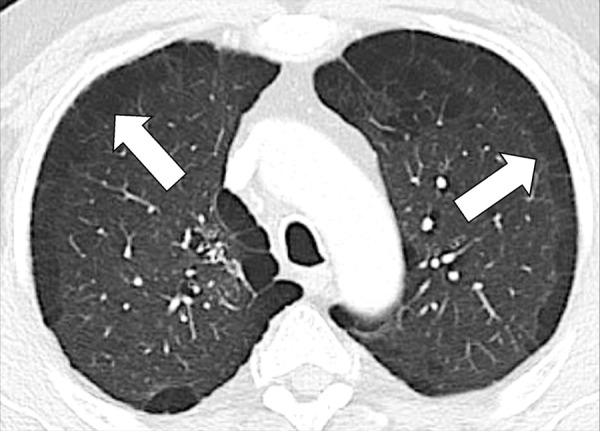
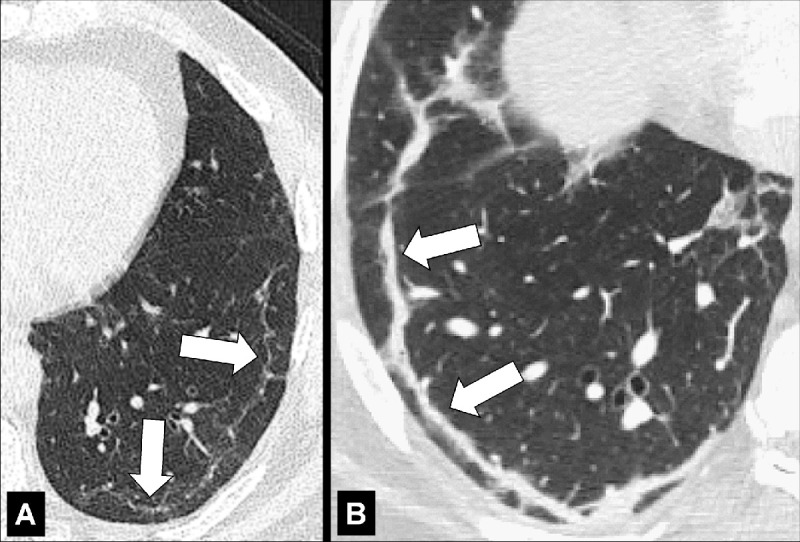
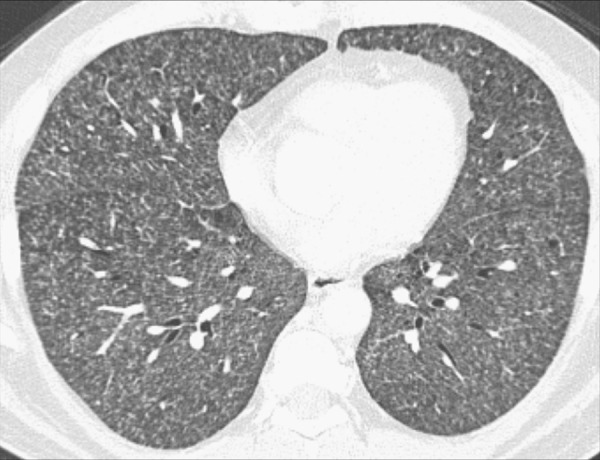
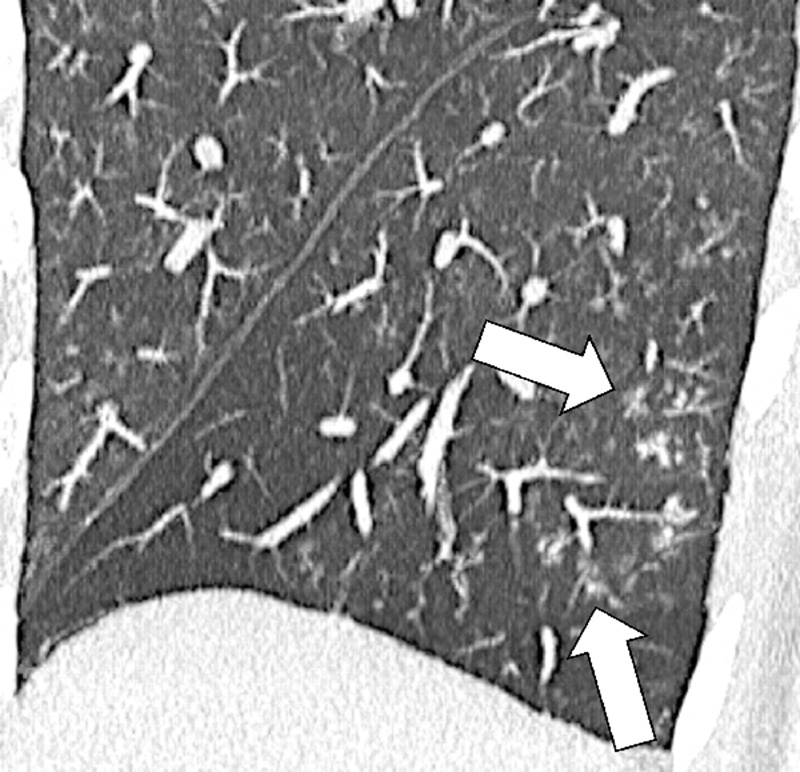
Interstitial Lung Abnormalities (Pathology)
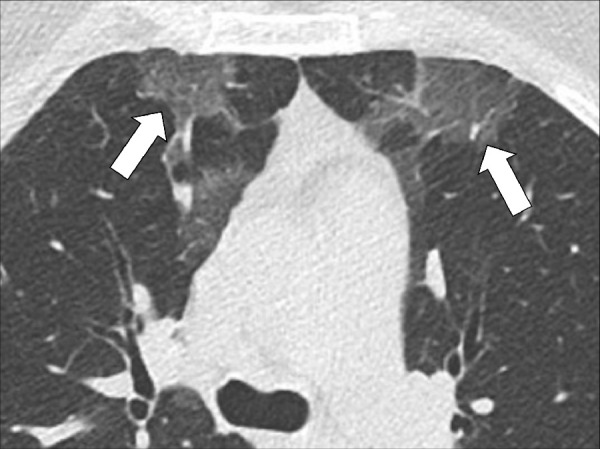
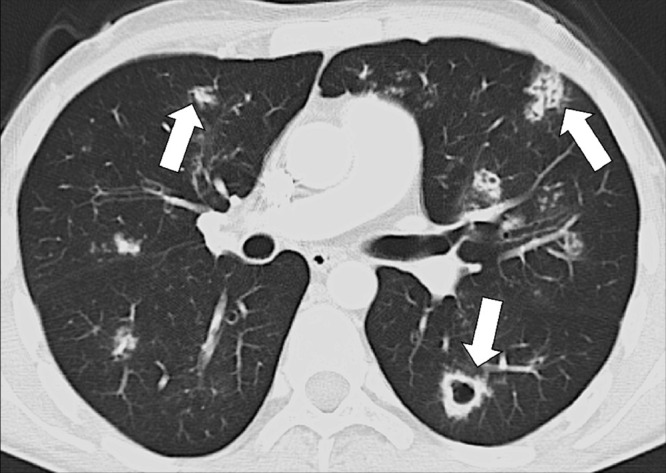
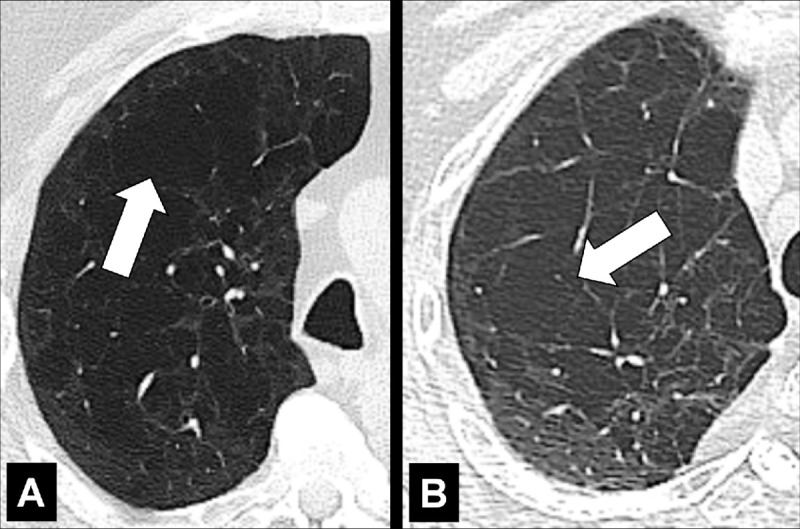
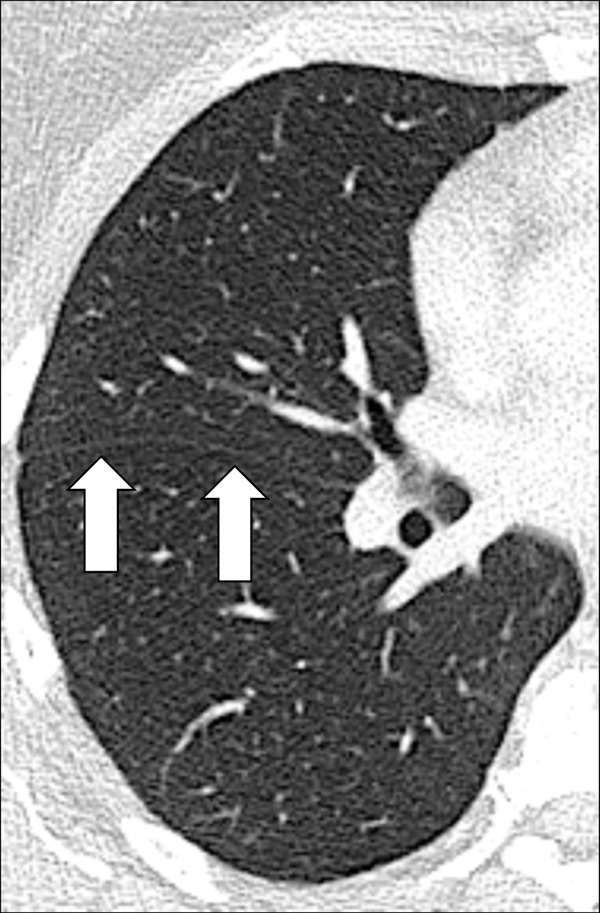
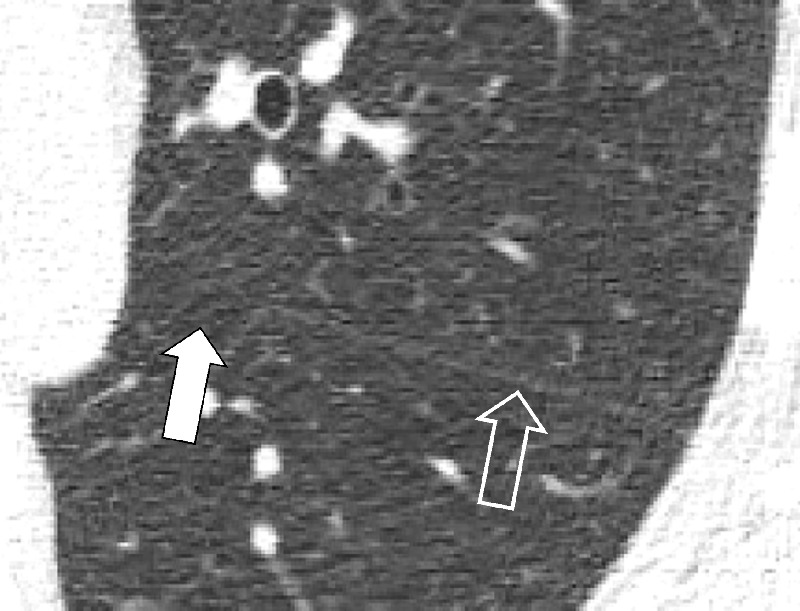
Interstitial lung abnormalities, or ILAs, is an umbrella term used for often subtle interstitial CT abnormalities in nondependent parts of the lungs, detected incidentally. They often manifest as variable combinations of peripheral ground-glass*, and reticular opacities, which should affect more than 5% of the upper, middle, or lower lung zone, as demarcated by the levels of the inferior part of the aortic arch and the right inferior pulmonary vein, respectively. The term is not necessarily associated with the presence of respiratory symptoms (84,85).
Interstitial Lung Disease (Pathology)
Interstitial lung disease is the umbrella term used for a large group of lung diseases that involve the interstitium and are typically associated with restrictive pulmonary impairment. These conditions are in fact very often multicompartmental and may then also involve the pulmonary airspaces (airspace*), airways*, and vasculature to varying degrees, and some may result in pulmonary fibrosis* (86–88).
Interstitium (Anatomy)
The interstitium consists of a continuum of connective tissue, extending from the most central to the most peripheral components of the lung parenchyma*, which mechanically supports airways*, vascular structures, and alveoli. Anatomically, it forms a single interconnected space encompassing the entire lung. For didactic reasons, it is divided into three compartments (10).
Axial: Portion of the interstitium that envelops airways*, vascular structures, and lymphatic vessels, the combination of which are sometimes referred to as “bronchovascular bundle.”
Interlobular (peripheral): Portion of the interstitium that extends from the visceral pleura* and forms the envelope of the secondary pulmonary lobule* and is visible as interlobular septa (septum*) on CT examinations.
Intralobular (septal): Portion of the interstitium within the secondary pulmonary lobule* that serves as the support structure for the alveolar walls.
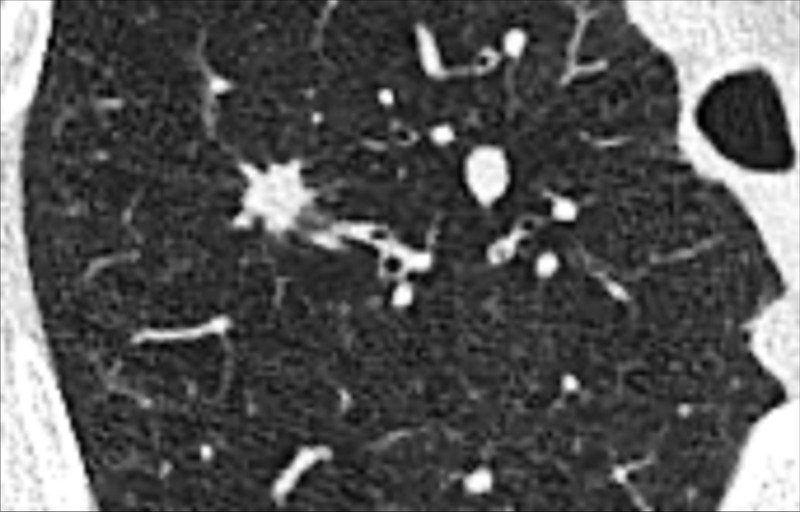
Irregular (Anatomy/Pathology) [Descriptor] (Fig 79)
Figure 79:
Irregular margination of pulmonary nodule: Transverse CT image of the right lower lobe shows an irregular nodule with spiculations and pleural tags (arrow).
Irregular is a general term describing the margination of a structure (eg, a pulmonary nodule* or its components) as not smooth and/or uneven. More precise descriptors falling under this general term include lobulation* and spiculation*.
Juxtaphrenic Peak (Anatomy) (Fig 80)
Figure 80:
Juxtaphrenic peak: Frontal chest radiograph of the left lung shows juxtaphrenic peak (arrow).
A juxtaphrenic peak is a small triangular opacity* based on either the right or the left hemidiaphragm, with its tip pointing toward the lung apex, caused by upward retraction of an inferior accessory fissure* or an intrapulmonary septum* associated with the pulmonary ligament (pleura*). The retraction reflects volume loss in the ipsilateral upper lobe, for example after radiation or surgery. The peak is best visualized on frontal radiographs and coronal CT reconstructions (89–91).
Lobe (Anatomy)
The lobes are the principal divisions of the lungs. The right lung has three lobes and the left lung has two lobes. Each lobe is enveloped by visceral pleura*, except at the hilum* or when an interlobar fissure* is incomplete (92).
Lobulation (Anatomy/Pathology) [Descriptor] (Fig 81)
Figure 81:
Lobulation: Transverse CT images of the left (A) upper and (B) lower lobes show lobulated nodules (arrow).
Lobulation is the descriptive term referring to a lobule-like and often asymmetric protrusion at the margins of a structure (eg, a pulmonary nodule* or its components). Pathologically, lobulations often reflect different rates of tissue growth or the presence of different tissues within the same structure, and typically have smooth margins. Although lobulation is often seen in malignant nodules (nodule*) or masses (mass*), it can also occur in benign lesions.
Lobule (Anatomy)
See secondary pulmonary lobule*.
Lymph Node (Anatomy) (Figs 82–84)
Figure 82:
Lymph node: Transverse CT image of the mediastinum shows mediastinal lymph node (arrow) with fatty hilum.
Figure 84:
Lymph node: Transverse CT images in (A) soft tissue and (B) lung window show calcified mediastinal lymph node (arrow).
Lymph nodes are organs of the lymphatic system surrounded by a fibrous capsule and divided into an outer cortex and inner medulla. The hilum* is an indentation on the concave surface of the lymph node where lymphatic vessels exit, and blood vessels both enter and exit. Normal lymph nodes are best seen on CT examinations where they appear as rounded, oval, or bean-shaped structures, sometimes with a visible fatty hilum. For purposes of cancer staging, mediastinal, hilar, and intrapulmonary nodes are classified according to anatomic location (“stations”). Lymph nodes present in the lung parenchyma* are called pulmonary or intrapulmonary lymph nodes; they are typically lobular or triangular in outline and occur along pleural surfaces, interlobular septa (interlobular septum*), and at vascular branch points. Aggregates of lymphatic tissue without a capsule, as commonly seen along pleural fissures (fissure*), are, strictly speaking, not lymph nodes (93).
Figure 83:
Lymph node: Transverse CT image of the mediastinum shows mediastinal lymph node (arrow) with fatty hilum.
Lymphadenopathy (Pathology) (Fig 85)
Figure 85:

Lymphadenopathy: (A–C) Transverse CT images of the mediastinum show mediastinal lymph node enlargement (arrows).
Lymphadenopathy refers to any pathologic transformation of lymph nodes (lymph node*) with regard to size, shape, and morphology. In more common usage, the term refers to the abnormal enlargement of lymph nodes. Therefore, the synonym “lymph node enlargement” is more precise and thus preferable. On CT examinations, and depending on the clinical scenario, the somewhat arbitrary threshold of either 10 mm or 15 mm short-axis diameter is often regarded as the upper limit of normal. Because lymph nodes commonly show a wide range of sizes according to location, differentiation between normal and diseased lymph nodes based on size alone is unreliable and should be complemented by consideration of location and morphologic features, or with the assessment of metabolic activity by 18F fluorodeoxyglucose PET/CT (94,95).
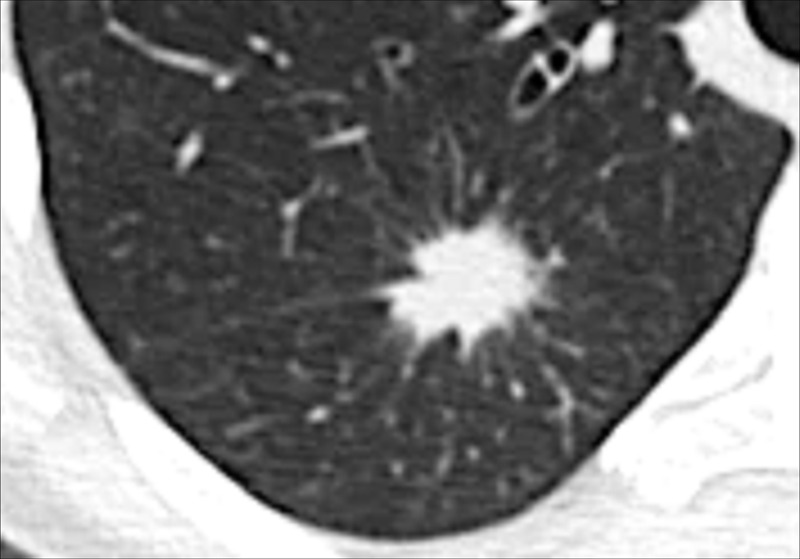
Mass (Pathology) (Fig 86)
Figure 86:
Mass: Transverse CT image of the right upper lobe shows mass with spiculations (open arrow) and pleural tags (solid arrow).
A mass is any circumscribed lesion greater than 30 mm in diameter. The term usually refers to a predominantly solid soft tissue structure but cavitary, cystic*, or calcified components may be present to various degrees. Shape and margin descriptors are similar to those used for pulmonary nodules (nodule*). In addition, distortion or invasion of adjacent structures may be present. The adjectival term “mass-like,” for example, used in “mass-like consolidation*,” may be used to describe the appearance of a given lesion, without implying a neoplastic etiology (also see consolidation*).
Mediastinum (Anatomy)
The mediastinum is the anatomic space located between the lungs and extending from the thoracic inlet to the diaphragm. The current definition of mediastinal compartments is based on CT criteria and includes the prevascular (anterior), visceral (middle), and paravertebral (posterior) compartments.
Boundaries of the prevascular (anterior) compartment are superiorly, the thoracic inlet; inferiorly, the diaphragm; anteriorly, the sternum; laterally, the parietal mediastinal pleura*; and posteriorly, the anterior aspect of the pericardium as it wraps around in a curvilinear fashion. Thus, any vessels contained within the pericardium are located in the visceral (middle) mediastinum. The major contents of the prevascular compartment are the thymus, fat, lymph nodes (lymph node*), and the left brachiocephalic vein.
Boundaries of the visceral (middle) mediastinum are superiorly, the thoracic inlet; inferiorly, the diaphragm; anteriorly, the anterior aspect of the pericardium (which envelops the distal aspect of the superior vena cava, the proximal aspect of the ascending aorta and lateral rim of the aortic arch, and the intrapericardial pulmonary arteries); posteriorly, a vertical line connecting a point on the thoracic vertebral bodies 1 cm posterior to the anterior margin of the spine. The major contents of this compartment fall into two main categories: first, a vascular category (ie, heart, superior vena cava, ascending thoracic aorta, aortic arch, descending thoracic aorta, intrapericardial pulmonary arteries, thoracic duct), and second, the trachea, carina, and esophagus, which share an embryological origin (the endoderm), as well as lymph nodes.
Boundaries of the paravertebral (posterior) compartment are superiorly, the thoracic inlet; inferiorly, the diaphragm; anteriorly, the visceral compartment; and posterolaterally, a vertical line along the posterior margin of the chest wall at the lateral aspect of the transverse processes. The major contents of this compartment are the thoracic spine and paravertebral soft tissues (96,97).
Micronodule (Pathology) (Figs 21, 22, 87)
Figure 87:
Micronodule: Transverse CT image of the right upper lobe shows multiple micronodules (arrows).
A micronodule is a circumscribed and typically round opacity*, previously defined as less than 3 mm, but currently defined as less than 6 mm in average diameter. This size threshold serves to distinguish micronodules, if found incidentally, from larger potentially actionable nodules, consistent with current management guidelines (98). In patients with a high risk for cancer or with an underlying history of cancer, micronodules can become actionable, notably if newly appeared. Micronodules can show the same shape and margin, as well as structure and location characteristics as nodules (nodule*). However, in the case of micronodules, these characteristics can be difficult or impossible to assess accurately because of their small size (98,99). Of note, the concept of individual micronodules is different from the concept of a micronodular pattern*, described elsewhere in the text.
Mosaic Attenuation (Pathology) (Fig 88)
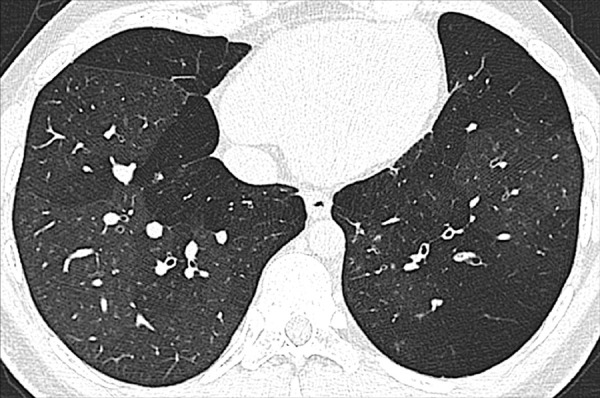
Figure 88:
Mosaic attenuation: Transverse CT image of the left lung shows geographic regions of normal and abnormally increased attenuation.
For the description, see pattern, mosaic*. The mosaic attenuation CT pattern* can be caused by obliterative small airways disease*, occlusive vascular disease, multifocal interstitial lung disease*, or by a combination of the above. In obliterative small airways disease and in occlusive vascular disease, the lower attenuation areas are abnormally hypodense and the higher attenuation abnormally hyperdense, reflecting differences in vascular perfusion, whereas in multifocal interstitial lung disease* the lower attenuation areas are normal and the higher attenuation areas abnormal. Mosaic attenuation should only be described on CT examinations performed in full inspiration. “Mosaic perfusion” refers to the mosaic pattern caused by local variations in lung perfusion (14,16,100,101).
Mucoid Impaction (Pathology) (Fig 89)
Figure 89:
Mucoid impaction: Transverse CT image of the left upper lobe shows bronchus impacted by mucus (arrow).
Also referred to as “mucus plugging,” mucoid impaction represents airway filling by mucoid secretions and can be obstructive or nonobstructive. It is often combined with signs of chronic airways* disease (102,103).
Mycetoma (Syn. Fungus Ball) (Pathology) (Figs 90, 91)
Figure 90:
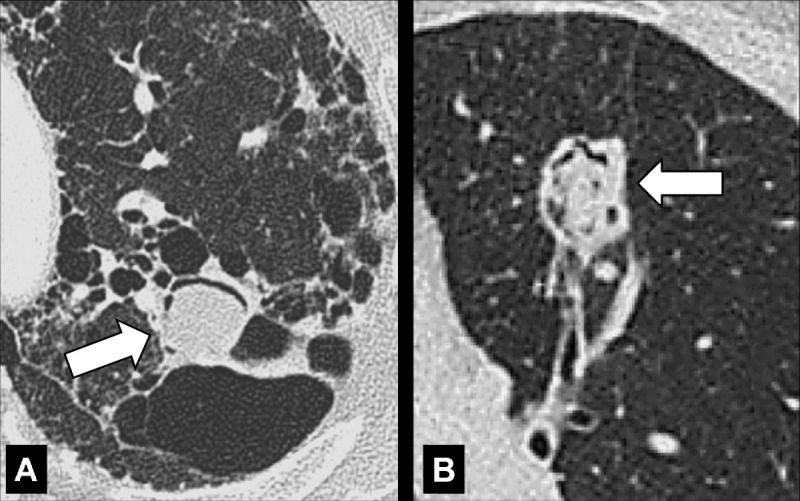
Mycetoma: Transverse CT images of the left upper lobe in two different patients show mycetomas (arrow) in preexisting cavities with air crescent surrounded by (A) abnormal and (B) normal lung parenchyma. The mycetoma in B shows sponge-like appearance.
Figure 91:
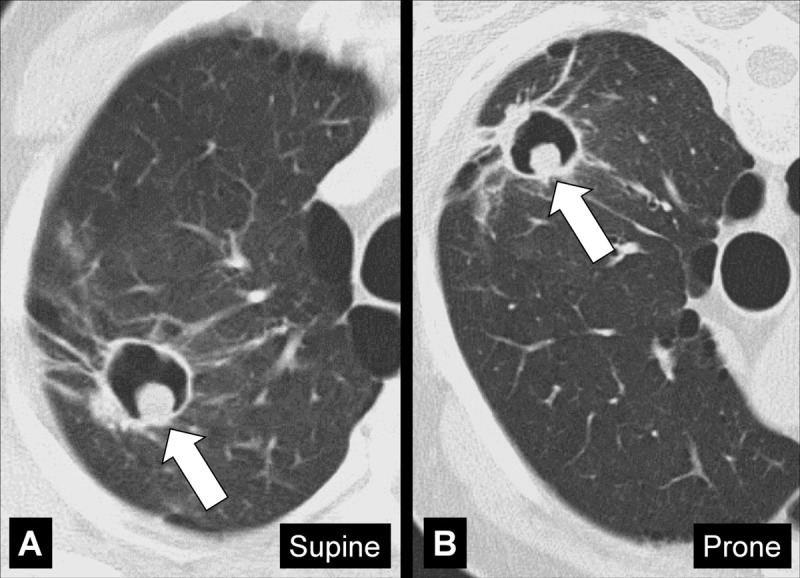
Mycetoma: Transverse CT images of the right upper lobe in (A) supine and (B) prone position show mycetoma (arrow) within a preexisting cavity surrounded by abnormal lung parenchyma, changing position with gravity.
A mycetoma is a mass* of intertwined hyphae, usually of an Aspergillus species, matted together by mucous, fibrin, and cellular debris, colonizing a preexisting cavity*. At imaging, the mycetoma appears as a rounded structure within the cavity, often showing an air crescent* between the mass and the inner wall of the cavity. On CT examinations, mycetoma can have a sponge-like structure and calcifications may be present. Mycetomas are often mobile and changes in position within the cavity can be confirmed by imaging the patient in different body positions (eg, supine, prone) (104,105).
Nodule (Pathology) (Figs 92–114)
Figure 92:
Nodule: Transverse CT image of the right upper lobe shows a round, well-defined, solid soft tissue nodule.
Figure 114:

Nodule: Transverse CT images of the left lung show pulmonary nodule that evolves from (A) a complex to (B) a simple morphology. The complex morphology in A consists of a ground-glass (open arrow) and a solid (solid arrow) component.
A nodule is a circumscribed, typically round opacity*, less than or equal to 30 mm in average diameter. A rounded lesion larger than 30 mm is referred to as a mass*. A rounded lesion less than 6 mm in diameter should be called micronodule*, a term which serves to distinguish it from larger potentially actionable nodules, consistent with current management guidelines (98,99). The terminology described below is intended to standardize the description and reporting of nodules, while acknowledging that nodules represent a morphologic spectrum, encompassing both benign and malignant features (106,107).
Shape and margin: Nodules can be described as round (Fig 92), ovoid (Fig 93), or polygonal in shape, and as spherical, flat, or elongated in configuration, based on their appearance in various imaging planes. The margin of a nodule can be well-defined (Fig 94) or ill-defined (Fig 95), depending on the appearance of the interface with the surrounding lung. A smooth nodule border is even and free of substantial protrusions or indentations, as opposed to an irregular* nodule border. Irregular* borders can be lobulated (Fig 81), with lobule-like protrusions (lobulation*), and/or spiculated (Figs 86–89), with multiple radiating small sharp projections (spiculation*). Linear components extending from the nodule to a pleural surface are called “pleural tags” (pleural tag*) (Fig 99). Combinations of the above shapes and margins may occur (Figs 100, 101).
Attenuation and structure: Based on attenuation, nodules with pure ground-glass* attenuation are referred to as “ground-glass” nodules (Fig 95). Nodules with pure soft tissue attenuation are referred to as “solid” nodules (Figs 92, 94). Nodules with both ground-glass and soft tissue attenuation components are referred to as “part-solid” nodules (107). In the context of lung adenocarcinoma, the ground-glass components generally correspond to a lepidic growth pattern and solid components generally correspond to invasive growth patterns. The terms ground-glass, solid, and part-solid nodule do not necessarily encompass the entire complex morphology of pulmonary nodules and are also limited by low inter- and intra-observer reproducibility among radiologists (108,109). Nonetheless, these terms are established in the literature and it is likely that they will continue to be used despite their limitations, notably for purposes of management and big data categorization. Note that thin-section CT is essential for the accurate characterization of small nodules. Based on structure, nodules are either “simple” or “complex.” Simple nodules show a single structural component (soft tissue, ground-glass*, calcium, fat) (Figs 93, 95, 102). Complex nodules have two or more structural components (soft tissue, ground-glass, calcium, fat, air) (Figs 103–110). Of note, simple nodules can develop into complex nodules (Figs 111–113), and vice versa (Fig 114).
Location: Nodules can be described as peribronchovascular or centrilobular, depending on their location in relation to other structures (see anatomical distribution*). Nodules arising from a fissure* should be called “fissural.” Nodules with direct contact to a fissure*, but not arising from it, should be called “perifissural.” Nodules arising from the pleura* should be called “pleural.” Nodules with direct contact to the pleura*, but not arising from it, should be called “pleura-based.” The term “subpleural” should only be used for nodules in proximity to the pleura, but without direct contact to it. Because this term has been attributed variable meanings in the literature, the term “peripheral” is preferred to describe such nodules.
Figure 93:

Nodule: Transverse CT images in (A) lung and (B) soft tissue windows of the right lung show an ovoid soft tissue nodule (arrow).
Figure 94:

Nodule: Transverse CT images in (A) soft issue and (B) lung windows of the right lung show a well-defined, solid soft tissue nodule (arrow). Note the small pleural effusion.
Figure 95:

Nodule: Transverse CT image of the (A) left upper and (B) left lower lobes of two different patients show ground-glass nodules with irregular margins.
Figure 99:

Nodule, pleural tag: Transverse CT images of the left lung show complex nodule with single pleural tag (arrow), (A) thin at first appearance, and (B) thickening over time.
Figure 100:

Nodule: Transverse CT images of the (A) left upper and (B) right lower lobes show spiculated nodules with pleural tags (solid arrow) and fissural involvement (open arrow).
Figure 101:
Nodule, spiculation, pleural tag: Transverse CT image of the left upper lobe shows a spiculated nodule with pleural tags (arrows).
Figure 102:
Nodule: Transverse CT images in (A) lung and (B) soft tissue window of the left upper lobe show calcified nodule (arrow).
Figure 103:
Nodule, complex morphology: Transverse CT image of the left lower lobe shows a complex nodule with cystic (open arrow) and ground-glass (solid arrow) components.
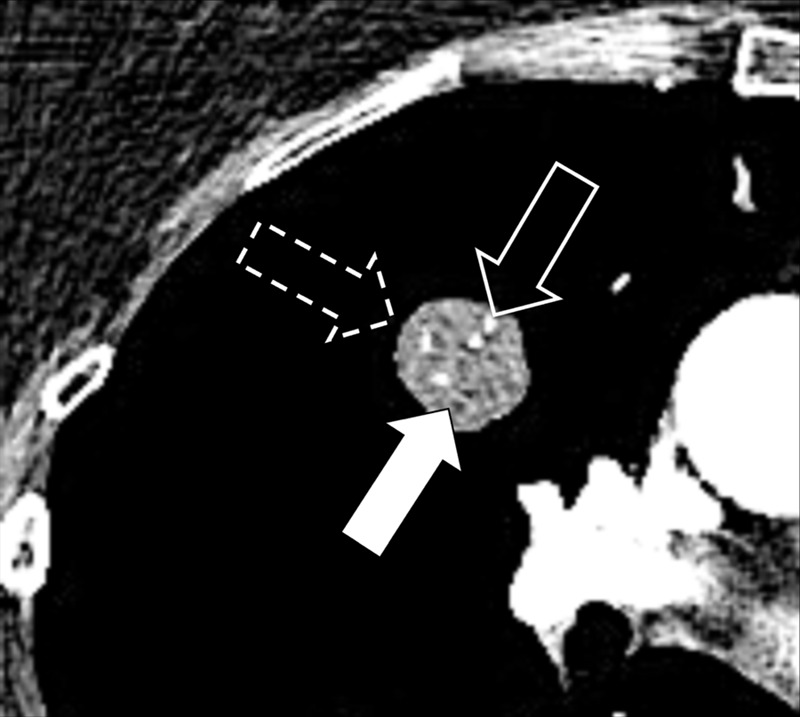
Figure 110:
Nodule: Transverse CT image of the left upper lobe shows a complex nodule with cystic (open arrow), ground-glass (dashed arrow) and soft tissue (solid arrow) components.
Figure 111:

Nodule: Transverse CT images of the right upper lobe show the evolution of a nodule from (A) soft tissue (arrow) to (B) a nodule with cystic (open arrow) and soft tissue (solid arrow) components.
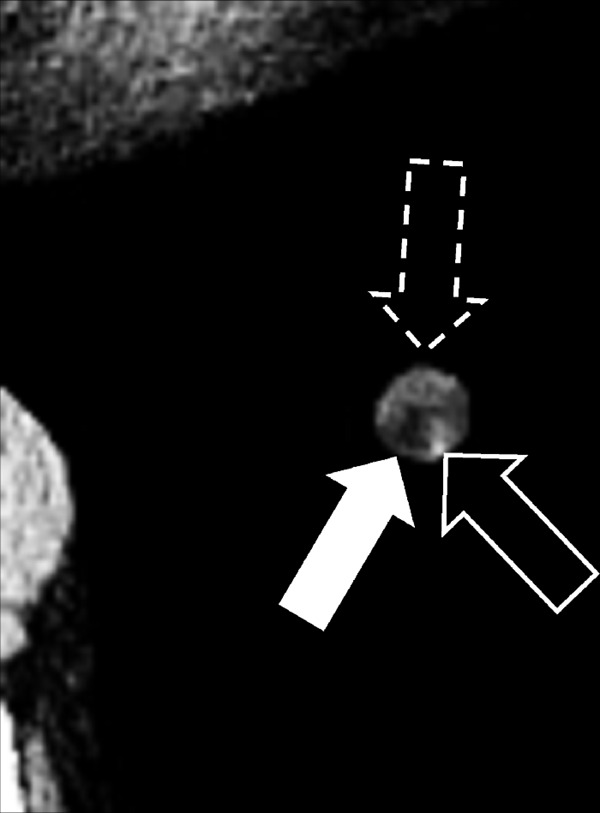
Figure 113:

Nodule: Transverse CT images of the right upper lobe show the evolution of a nodule with (A) cystic (open arrow) and ground-glass (dashed arrow) components to (B) a nodule with cystic (open arrow) and soft tissue (solid arrow) components.
Figure 96:
Nodule: Transverse CT image of the right lung shows a mildly spiculated nodule (arrow).
Figure 97:
Nodule: Transverse CT image of the right upper lobe shows an irregular nodule with mild spiculation.
Figure 98:
Nodule: Transverse CT image shows a markedly spiculated nodule in the right lower lobe.
Figure 104:
Nodule, complex morphology: Transverse CT image of the right lower lobe shows a ground-glass nodule with a cystic component (arrow).
Figure 105:
Nodule: Transverse CT image of the left lower lobe shows a complex nodule with fat (open arrow) and soft tissue (solid arrow) components.
Figure 106:

Nodule: Transverse CT images in (A) soft tissue and (B) lung windows of the right lower lobe show a complex nodule with a calcified (solid arrow) and soft tissue (open arrow) component.
Figure 107:

Nodule: (A–C) Transverse CT images of the right lung of three different patients show a complex nodule with solid and ground-glass components (part-solid nodules). While the ground-glass component is predominantly present in A, the solid component is larger in B and becomes the dominant component in C.
Figure 108:
Nodule: Transverse CT image of the right upper lobe shows a complex nodule with fat (solid arrow), calcium (open arrow) and soft tissue (dashed arrow) components.
Figure 109:
Nodule: Transverse CT image of the left lower lobe shows a complex nodule with fat (solid arrow), calcium (open arrow) and soft tissue (dashed arrow) components.
Figure 112:

Nodule: Transverse CT images of the right lung show the evolution of a nodule from (A) a ground-glass nodule (arrow) to (B) a nodule with ground-glass (solid arrow) and soft tissue and cystic (open arrow) components.
The prefix juxta- has been used inconsistently to describe nodules that are variously in proximity or in contact with the pleura* or a fissure* (juxtafissural, juxtapleural) (24). We recommend instead using the more stringent terminology described above.
Oligemia (Anatomy/Physiology/Pathology) (Figs 115, 116)
Figure 115:
Oligemia: Transverse CT image shows areas of oligemia caused by small airways disease. Note the reduced number of vessels and thickened bronchial walls.
Figure 116:
Oligemia: Transverse contrast-enhanced CT image shows oligemia caused by vascular arterial disease. Note the substantially dilated central pulmonary arteries (asterisk).
Oligemia is a focal or diffuse reduction in blood flow and/or blood volume. At imaging, pulmonary oligemia appears as a decrease in attenuation, and/or as a decrease in dimension and number of pulmonary vessels. Imaging signs of oligemia can be subtle and may require comparison with normally perfused lung for accurate detection (110).
Opacity (Anatomy/Pathology) [Descriptor] (Fig 74)
Opacity refers to any focal or diffuse nonspecific area of increased attenuation. The term is a general descriptor that does not indicate the nature of the condition causing the opacity. The term has sometimes been used synonymously with the now obsolete and nonrecommended term “infiltrate” (111).
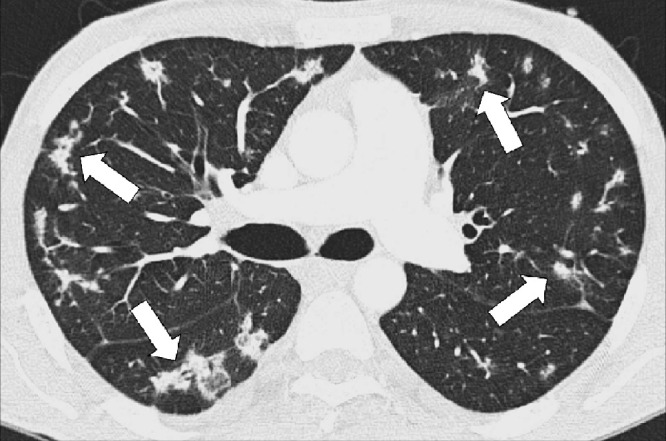
Organizing Pneumonia (Pathology) (Figs 117, 118)
Figure 117:
Organizing pneumonia: Transverse CT image of the left lower lobe shows consolidation with perilobular and peribronchovascular distribution.
Figure 118:
Organizing pneumonia: Transverse CT image of the lower lobes shows groundglass opacities and peribronchial consolidation.
Organizing pneumonia is a histologic, clinical, and radiographic entity, reflecting a repair mechanism of the lung parenchyma* after exogenous or endogenous injury. Histologically, organizing pneumonia is characterized by loose plugs of organizing connective tissue in distal airways* and alveoli. The imaging presentation is variable, with sharply defined peripheral or bronchocentric consolidation* with or without ground-glass*, air bronchograms*, curvilinear perilobular opacities (opacity*), nodular opacities, and the atoll sign* being common manifestations. However, numerous additional manifestations and patterns (pattern*) have been described, including peripheral sparing (112).
Paratracheal Stripe (Anatomy) (Fig 119)
Figure 119:
Paratracheal stripe: Frontal chest radiograph shows right paratracheal stripe (arrows).
Right paratracheal stripe: The interface between the right tracheal wall, the adjacent pleura*, and the mediastinal fat between them, as seen on frontal chest radiographs. It begins superiorly at the level of the clavicles and extends inferiorly to the right tracheobronchial angle at the level of the azygos arch.
Left paratracheal stripe: The interface between the left upper lobe* and either the mediastinal fat adjacent to the left tracheal wall or the left tracheal wall itself. It extends superiorly from the aortic arch to join with the reflection from the left subclavian artery.
Thickening of the stripe on either side may reflect enlarged lymph nodes (lymph node*), hematoma, or another mediastinal pathology (113,114).
Parenchyma (Anatomy)
Parenchyma refers to the part of the lung tissue involved in gas transfer. The lung parenchyma includes the alveoli, alveolar ducts, and respiratory bronchioles (bronchiole*).
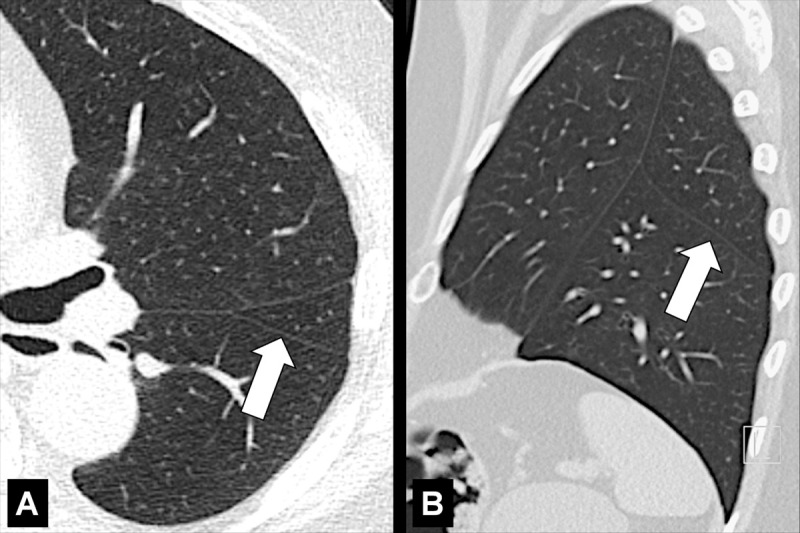
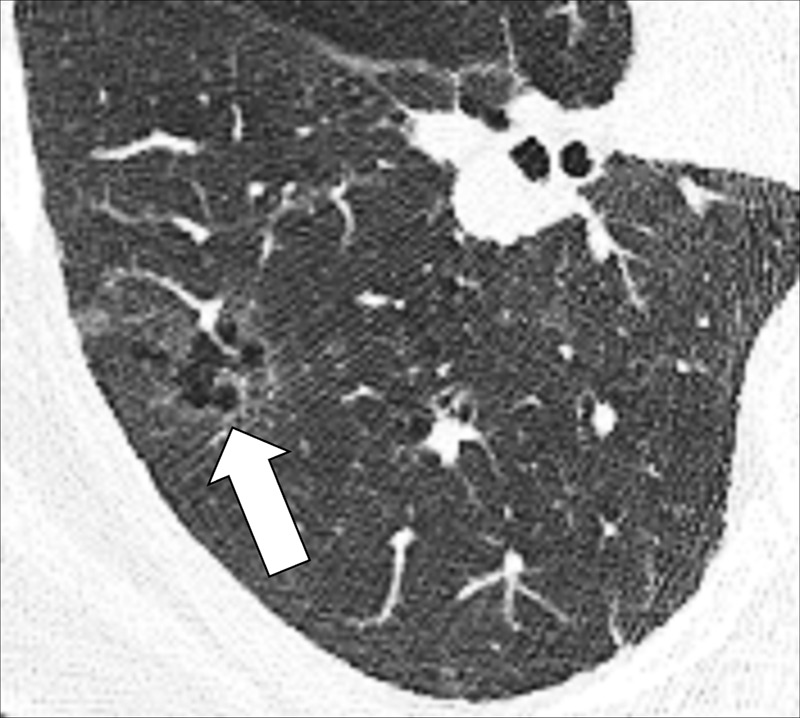
Parenchymal Band (Pathology) (Fig 120)
Figure 120:
Parenchymal band: Transverse CT images of the (A) left and (B) right lung of two different patients show linear parenchymal bands paralleling the pleura (arrows). Pattern.
A parenchymal band is a thin linear opacity paralleling the pleura*, occasionally described as extending to the pleural surface. It can be associated with architectural distortion* and is commonly seen in the context of asbestos exposure (115). More recently, it has been described as a sequela of COVID-19–related pneumonia* (116) and organizing pneumonia* (117).
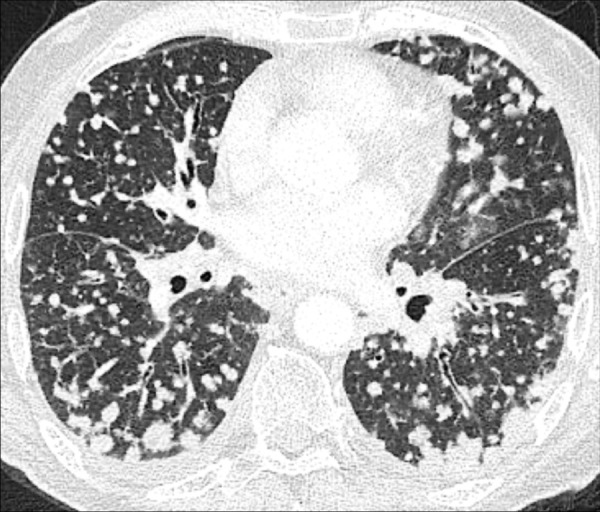
Pattern (Anatomy/Pathology) (Figs 121–136)
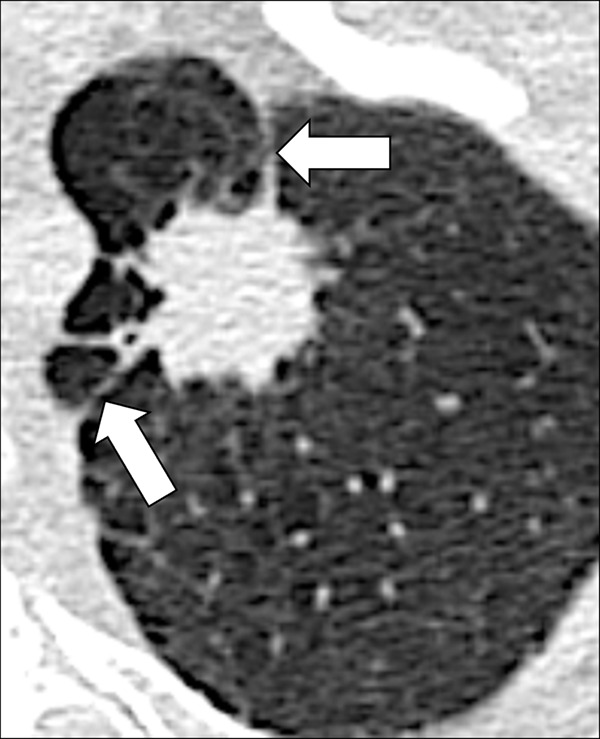
Figure 121:
Crazy paving: (A, B) Transverse CT images of the left lung of two different patients show crazy-paving pattern.
Figure 136:
Tree-in-bud: Transverse CT image of right lung shows focal tree-in-bud opacities (arrows).
Crazy paving: Focal areas of ground-glass opacities (opacity*) with well-defined margins within which septal thickening and intralobular reticular lines can be identified, in a pattern similar to crazy paving stonework (118) (Figs 121, 122).
Interstitial: Descriptor referring to the underlying connective tissue framework of the lung (119) (Fig 123).
Miliary: Subcategory of nodular pattern, designating profuse, diffuse, and randomly distributed well-defined micronodules (micronodule*) of uniform size, with diameters of 1 to 2mm resembling millet seeds (119) (Figs 124, 125).
Mosaic: Patchwork of regions with normal and abnormally increased attenuation (mosaic attenuation*) (Fig 126).
Nodular: Pattern including nodules (nodule*) (119) (Figs 127, 128).
Reticular: Collection of intersecting linear opacities that produce an appearance resembling a net, sometimes referred to as “reticulation” (119) (Fig 129).
Reticulonodular: Combination of a reticular and a nodular pattern.
Three-attenuation (three-density): Combination of sharply demarcated zones with normal, increased, and decreased attenuation on CT images acquired in inspiration (14) (Fig 130).
Tree-in-bud: Micronodules connected to linear opacities with one or more branching sites, thus resembling a budding tree (120) (Figs 131–136).
Figure 122:
Crazy paving: Transverse CT image of the right lung shows areas of crazy paving with reticular lines.
Figure 123:
Interstitial: Transverse CT image of the right upper lobe shows interstitial pattern caused by thickened interlobular septa.
Figure 124:
Miliary: Transverse CT image of the right lung shows miliary micronodules.
Figure 125:
Miliary: Transverse CT image of the lungs show diffuse distribution of micronodules.
Figure 126:
Mosaic: Transverse CT image of the right lung shows mosaic pattern.
Figure 127:

Nodular: Transverse CT images of the right lung of two different patients show (A) moderate and (B) extensive nodular pattern.
Figure 128:
Nodular: Transverse contrast-enhanced CT image of the lungs shows diffuse nodular pattern.
Figure 129:

Reticular: Transverse CT images in three different patients show (A) subtle, (B) moderate, and (C) severe reticular opacities, with ground-glass opacities.
Figure 130:
Three Attenuation: Transverse CT images in two different patients through the (A) right and (B) left lung show lobules with normal, increased, and decreased attenuation.
Figure 131:

Tree-in-bud: Transverse CT images of the middle lobe. (A) While the standard reconstruction shows several micronodules only, (B) the maximum intensity projection reveals the tree-in-bud appearance of these micronodules (arrow).
Figure 132:
Tree-in-bud: Sagittal CT image reconstruction of the left lower lobes shows focal tree-in-bud opacities (arrows).
Figure 133:
Tree-in-bud: Transverse CT image of the right lower lobe shows multifocal tree-in-bud with branching opacities.
Figure 134:
Tree-in-bud: Transverse CT image of the right lung in (A) thin-section and (B) maximum intensity projection reconstructions show focal tree-in-bud opacities (arrow).
Figure 135:

Tree-in-bud: (A, B) Transverse CT images of the right lung in two different patients show focal tree-in-bud opacities.
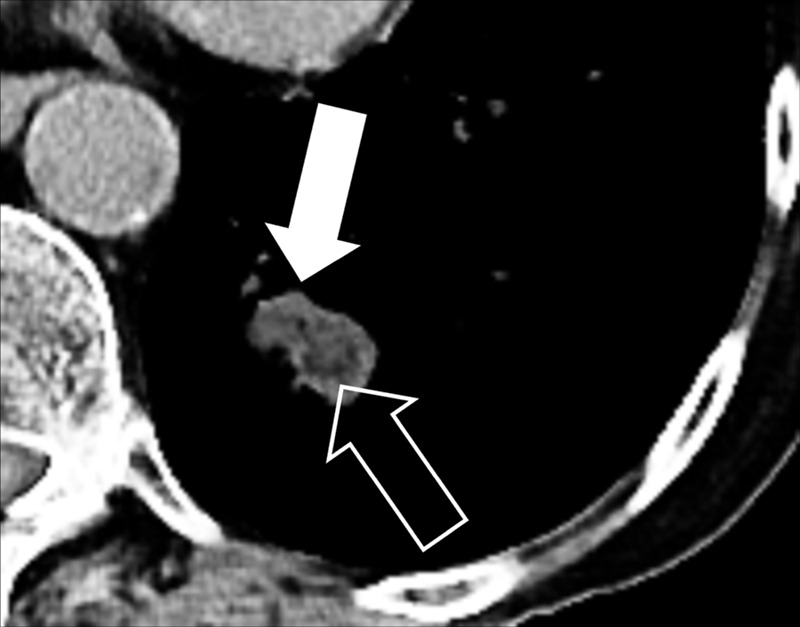
Pleura (Anatomy) (Figs 137–139)
Figure 137:
Effusion: Frontal chest radiograph shows left pleural effusion (arrow).
Figure 139:
Plaque: (A, B) Transverse CT images of the lower thorax show partially calcified pleural plaques (arrows).
The pleura is a two-layered serous membrane folding back on itself at the hilum* that covers both lungs. The two layers of the membrane are separated by a small amount of viscous lubricant called pleural fluid, which causes surface tension and, together with negative pressure, pulls the parietal and visceral pleura adjacent to each other. Each pleural layer consists of a monolayer of mesothelial cells and a layer of underlying mesenchymal tissue. Both layers form the virtual “pleural space.” At imaging, the normal pleura is best seen where it forms the interlobar fissures (fissure*) or in the presence of extrapleural fat (see anatomic distribution*).
The parietal pleura is the pleural layer that lines the inner surfaces of the thorax on each side of the mediastinum*, and can be subdivided into mediastinal (covering the lateral surfaces of the fibrous pericardium, esophagus, and thoracic aorta), diaphragmatic (covering the upper surface of the diaphragm), and costal (covering the inside of the rib cage). The visceral pleura is the pleural layer that covers the surface of each lung and inserts between the lobes (lobe*) of the lung, forming the interlobar fissures (121,122).
The adjectival form “pleural” is often associated with the following terms:
Effusion (pathology): Excessive pleural fluid caused by mechanical factors, edema, infection, inflammation, or malignancy (Fig 137).
On radiographs, small pleural effusions manifest as blunting of the costophrenic angles, often meniscus-shaped, and larger effusions as homogeneous opacities (opacity*) in dependent regions. On CT examinations, effusions are of variable attenuation and widen the pleural space. CT can depict loculations, as well as pleural thickening and hyperemia when performed with contrast enhancement.
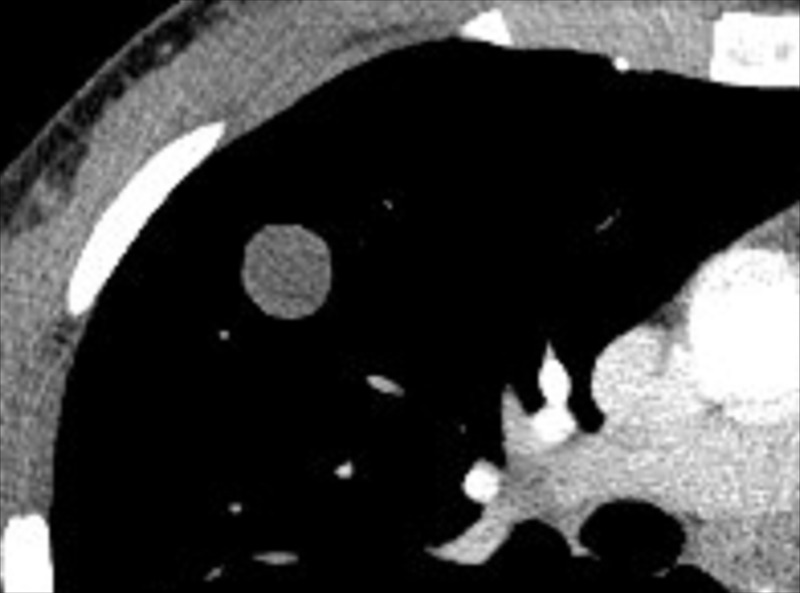
Plaque (pathology): Fibrohyaline focal lesions arising in the parietal pleura.
Pleural plaques are usually associated with previous exposure to natural fibrous silicates, usually asbestos. At imaging, pleural plaques are well-defined elevated flat or plateau-like areas of pleural thickening that often contain calcifications (Figs 138, 139).
Figure 138:
Plaque: Transverse CT image of the left upper lobe shows calcified pleural plaque (arrow).
Tag (pathology): One or more coarse linear or band-like strands extending from a structure (eg, a nodule or its components) and having direct contact with the pleura or a fissure* (Figs 79, 89, 100, 101). Pathologically, pleural tags are often associated with thickened interlobular septa (interlobular septum*) connecting a structure to the pleura. While usually non-specific, pleural tags have also been described as a potential indicator for visceral pleural invasion (123).
Thickening (pathology): Focal or diffuse increase in thickness of the pleura, commonly caused by fibrosis following chronic* or recurrent mechanical irritation (eg, by rib fractures) and by pleural effusion or pneumothoraces (pneumothorax*) (Figs 23, 40, 65, 66).
Pleural thickening can also be caused by asbestos exposure or infection, as well as by neoplasms such as metastases, lymphoma, or mesothelioma. Pleural thickening is visible at CT as a soft tissue curvilinear stripe, passing internally to the ribs and innermost intercostal muscles. Thickened pleura often enhances and is best seen after intravenous contrast administration.
Pneumatocele (Pathology) (Fig 140)
Figure 140:
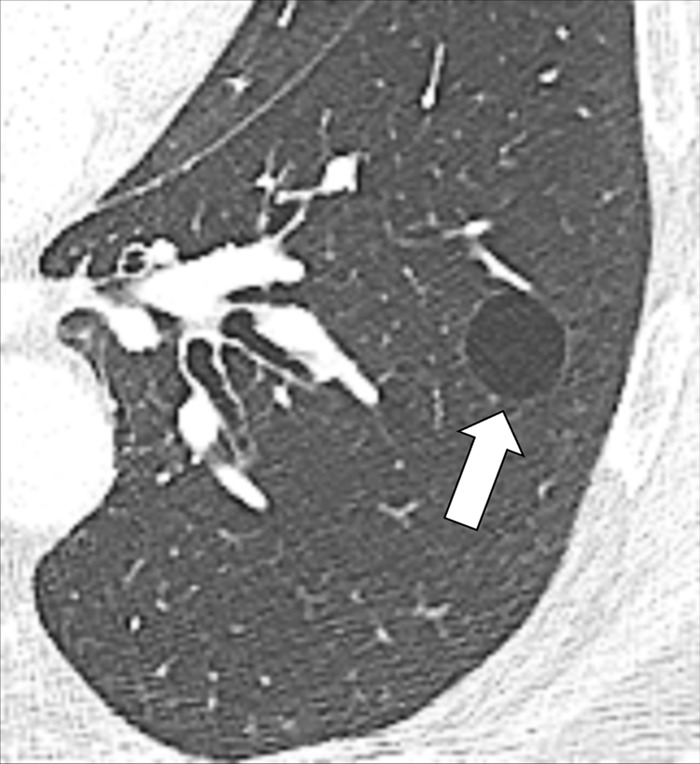
Pneumatocele: Transverse CT image through the left lung shows well-defined pneumatocele (arrow).
A pneumatocele is a thin-walled, gas-filled cystic* structure in the lung parenchyma*. Pneumatoceles can be caused by pneumonia*, trauma (including barotrauma), or aspiration* of hydrocarbon fluid (eg, in “fire eating”). Pneumatoceles can be transient and are likely caused by a combination of parenchymal necrosis and a check-valve airway obstruction. At imaging, pneumatoceles appear as rounded, thin-walled cystic lesions (cyst*) in the lung parenchyma, sometimes with an air-fluid level (124).
Pneumomediastinum (Pathology) (Figs 141, 142)
Figure 141:

Pneumomediastinum: (A) Frontal and (B) lateral chest radiographs show mediastinal air collection (arrows).
Figure 142:

Pneumomediastinum: (A, B) Transverse CT images in two patients show mediastinal (solid arrow) and extrapleural (open arrow) air collections.
Pneumomediastinum is the abnormal collection of air or gas in the mediastinum*, outside of the esophagus and the tracheobronchial tree. It can be caused by spontaneous rupture of alveoli, by trauma, or by esophageal rupture with a subsequent incursion of air along the axial interstitium* into the mediastinum*. It is most often associated with surgical trauma, barotrauma, or conditions related to prolonged cough, such as asthma or interstitial lung disease*. At imaging, pneumomediastinum appears as one or more low-attenuation areas of linear or band-like air collections outlining mediastinal structures (125,126).
Pneumonia (Pathology)
Commonly used diagnostic term that typically designates infection of lung parenchyma*. Pneumonia can be caused by bacteria, viruses, fungi, parasites, or other microorganisms, and can be focal* or multifocal*. Pneumonia can manifest as opacity*, potentially accompanied by air bronchograms (air bronchogram*), tree-in-bud* opacities, or pleural effusions (pleural effusion*) (127,128).
Pneumonitis (Pathology)
Pneumonitis is a diagnostic term that designates inflammation of lung parenchyma*, both infectious and noninfectious. Infectious pneumonitis is generally referred to as pneumonia*. Noninfectious pneumonitis can be caused by a wide range of conditions, including aspiration*, hypersensitivity, radiation, autoimmune diseases, and drugs.
The terms “pneumonia” and “pneumonitis” are sometimes used interchangeably but the above definitions are preferred (129,130).
Pneumopericardium (Pathology) (Figs 143, 144)
Figure 143:

Pneumopericardium: (A, B) Frontal chest radiographs in two patients show air in the pericardial cavity (arrows).
Figure 144:
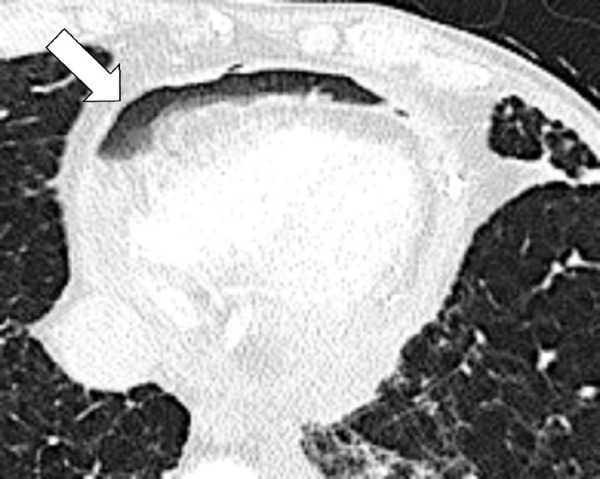
Pneumopericardium: Transverse contrast-enhanced CT image shows ventral pericardial air collection (arrow).
Pneumopericardium is the accumulation of air in the pericardial cavity. Pneumopericardium has been described in preterm neonates or in the context of mechanical ventilation in infants. In adults, it is usually due to trauma, or cardiac surgery. It can be associated with other pathologic air collections, such as pneumomediastinum* or pneumothorax*. At imaging, pneumopericardium manifests as air or gas attenuation in the structureless space separating the two layers of the pericardium (131).
Pneumothorax (Pathology) (Figs 145, 146)
Figure 145:

Pneumothorax: (A) Frontal chest radiograph and (B) transverse CT image reconstruction of the left lung show air in the pleural space (arrows).
Figure 146:

Pneumothorax: (A) Frontal chest radiograph, and (B) coronal and (C) transverse CT image reconstructions of the lung show air in the left pleural space loculated due to pleural adhesions.
Pneumothorax refers to the presence of air or gas in the pleural* space that separates the parietal and the visceral pleura*. Therefore, parts of the lung can partially or completely collapse. Pneumothorax can be caused by spontaneous rupture of blebs*, or by mechanical trauma, including iatrogenic damage. The diagnosis of tension pneumothorax is determined by clinical and physiologic criteria that typically correlate radiographically with contralateral mediastinal shift and depression of the ipsilateral hemidiaphragm, most often based on a check-valve mechanism. Ultimately, a definitive diagnosis of tension pneumothorax is determined by clinical and/or physiologic criteria. Pneumothorax is typically identified on upright chest radiographs by the presence of a curvilinear visceral pleural line indicating the demarcation between pleural air and aerated lung. However, on radiographs acquired in the supine position, when the separated pleural surfaces are not tangential to the x-ray beam, pneumothorax may be difficult to detect. In these cases, ancillary findings, such as unusually sharp interfaces between lung and mediastinal or cardiac structures can be helpful. The “deep sulcus sign” refers to an abnormally deepened costophrenic angle, which has low attenuation and is abnormally sharply defined (132,133).
Saber-sheath Trachea (Pathology) (Fig 147)
Figure 147:
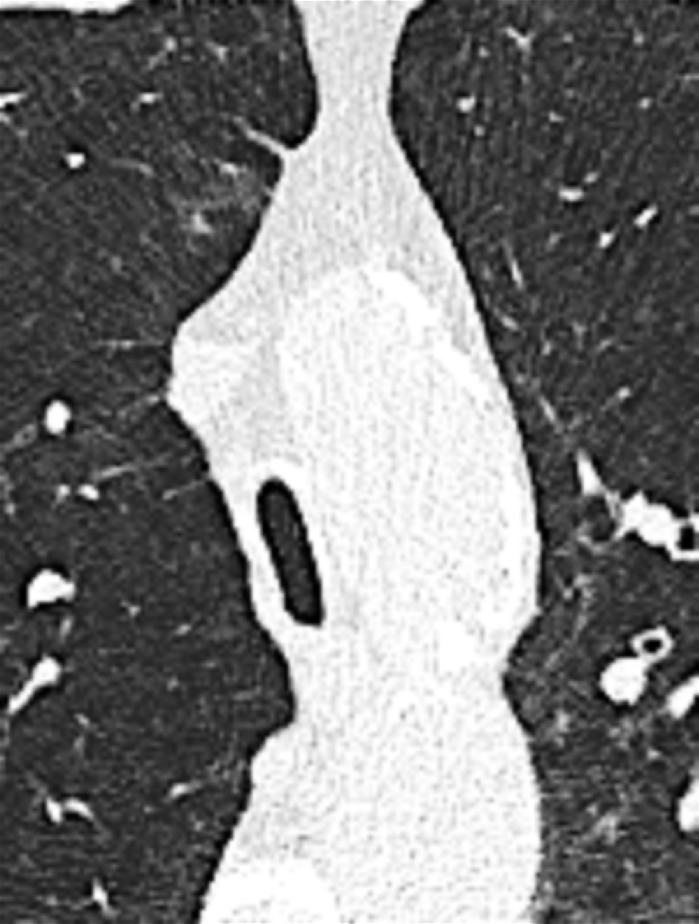
Saber-sheath trachea: Transverse CT image of the mid trachea shows saber-sheath configuration.
Saber-sheath trachea refers to the abnormal shape of the trachea, with an increased sagittal (anteroposterior) and a decreased coronal (left-to-right) diameter, which resembles the sheath of a saber. To meet the definition, the internal coronal diameter of the trachea must be two-thirds or less than the sagittal diameter at the same anatomic level, without any extrinsic cause of compression. Saber-sheath trachea is most commonly seen in patients with chronic obstructive pulmonary disease and is assumed to be the result of chronic inflammation and subsequent remodeling of the tracheal wall (65,134,135).
Secondary Pulmonary Lobule (Anatomy) (Fig 148)
Figure 148:
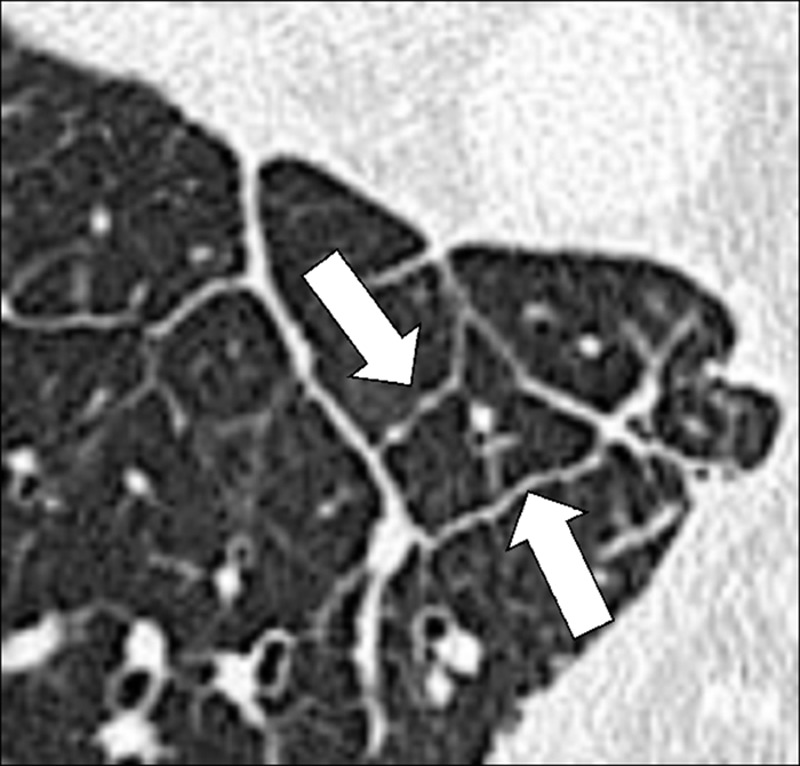
Secondary pulmonary lobule: Transverse CT image of the right lower lobe shows secondary pulmonary lobule surrounded by thickened interlobular septa (arrows).
A secondary pulmonary lobule is the smallest structural unit of the lung parenchyma* surrounded by a connective tissue sheath. It is irregularly polyhedral or pyramidal in shape, with borders ranging from 5 mm to 25 mm in length. It contains three to 25 acini (acinus*). The structures in the center of the secondary pulmonary lobule (“core structures,” “centrilobular structures”) include bronchioles (bronchiole*) and their accompanying pulmonary arterioles and lymphatic vessels. The connective tissue envelope of the secondary pulmonary lobule contains veins and lymphatic vessels. The secondary pulmonary lobule also has an internal support structure, the intralobular interstitium*. CT can help visualize the three basic components of the normal secondary pulmonary lobule, namely the central structures, the region where acini are located, and the connective tissue sheath that forms the interlobular septa (interlobular septum*) (9,136).
Segment (Anatomy)
A segment is a structural unit of a lobe* ventilated by a segmental bronchus, perfused by a segmental pulmonary artery, and drained by intersegmental pulmonary veins. The right lung has 10 segments, with three in the upper lobes (lobe*), two in the middle lobe, and five in the lower lobes. The left lung has either eight or 10 segments, depending on whether the apicoposterior upper lobe segment and the anteromedial segment in the lower lobe are considered to represent one or two segments. At imaging, individual segments are identified inferentially based on the position of the supplying segmental bronchus and artery. Occasionally, segments can be separated by accessory fissures (accessory fissure*) (137).
Septum (Pl. Septa) (Anatomy) (Figs 149–155)
Figure 149:

Septum: (A, B) Transverse CT images of the right upper lobe in two different patients show thickened interlobular septa (arrow).
Figure 155:
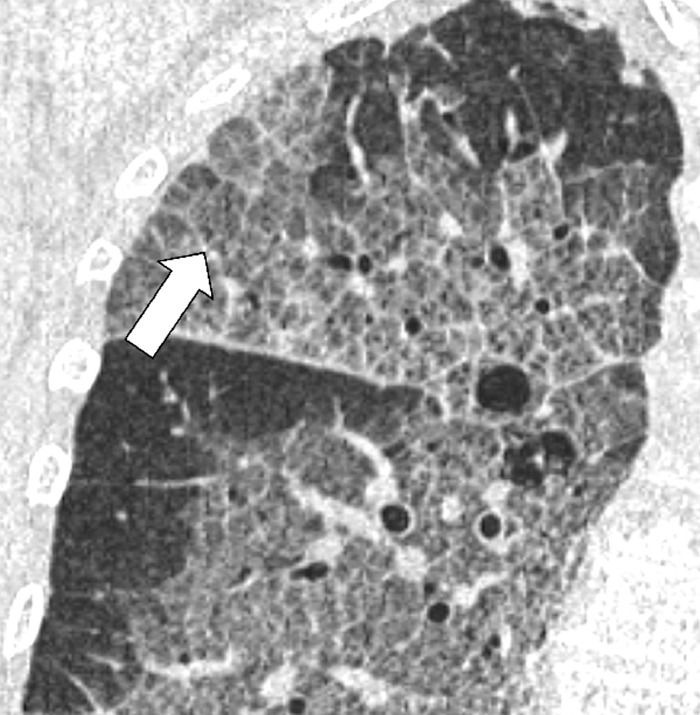
Septal thickening: Coronal CT image of the right lung shows septal thickening and intralobular lines (arrow) in an area of crazy paving.
A septum is a sheath-like connective tissue structure surrounding secondary pulmonary lobules (secondary pulmonary lobule*). Because they separate lobules (lobule*), they are also referred to as “interlobular septa” (interlobular septum*). They contain veins and lymphatic vessels. Being oriented perpendicularly to the pleura*, isolated septal lines can be occasionally seen on CT examinations in otherwise healthy patients in the lung apices and the bases as thin linear structures separating secondary pulmonary lobules. They are more conspicuous when thickened (eg, in interstitial pulmonary edema) (9,10).
Figure 150:
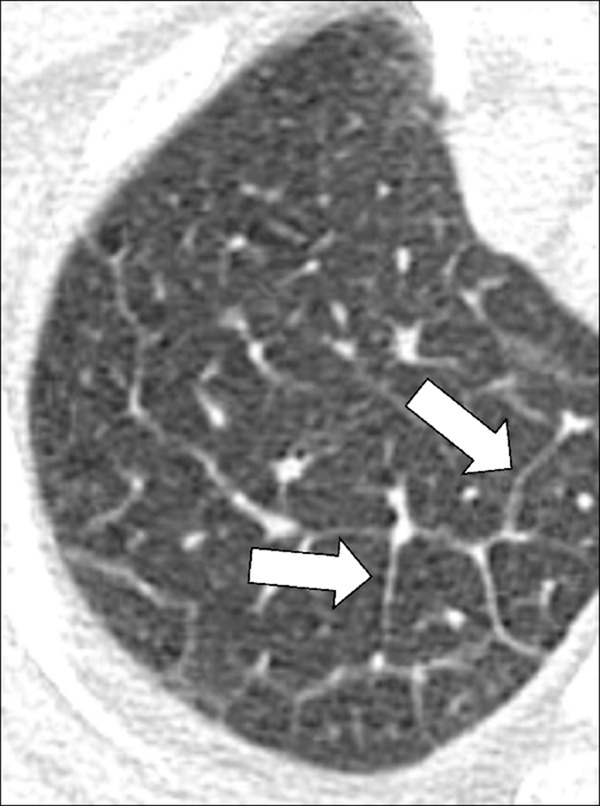
Septum: Transverse CT image of the right upper lobe shows thickened interlobular septa (arrows).
Figure 153:
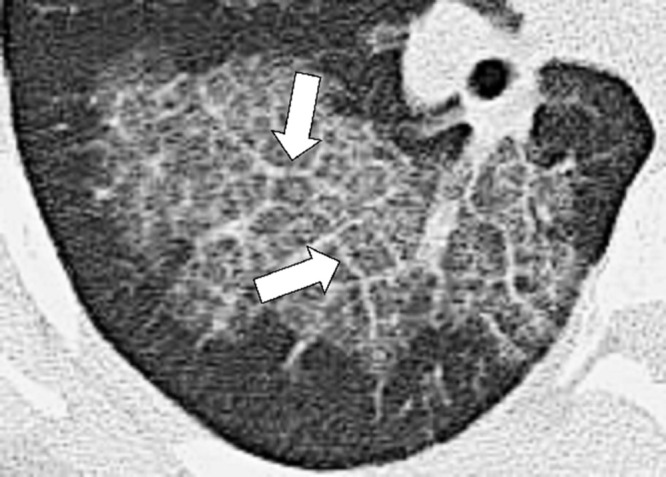
Septal thickening: Transverse CT image of the right lower lobe shows septal thickening and intralobular lines (arrows) in an area of crazy paving.
Figure 154:
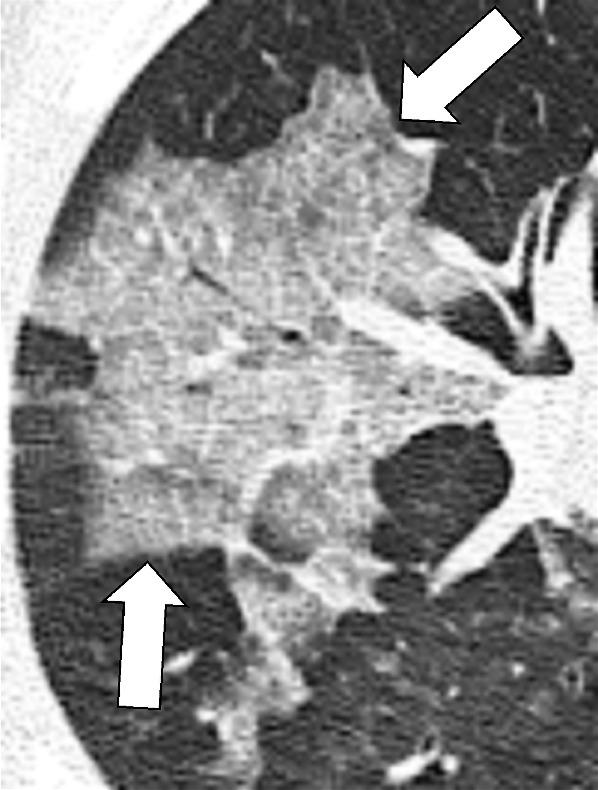
Septal thickening: Transverse CT image of the right upper lobe shows irregular ground-glass opacities (arrows) with interlobular septal thickening and intralobular lines in an area of crazy paving.
The adjectival form “septal” is commonly used with the following terms:
Line (anatomy): Linear structure representing an interlobular septum (Fig 151).
Thickening (pathology): Seen on chest radiographs and CT examinations as thin linear structures at right angles to and in contact with the lateral pleural surfaces (Figs 152–155).
Figure 151:

Septal lines: (A) Frontal chest radiograph and (B) coronal CT image reconstruction show septal lines (arrows), formerly called Kerley B lines.
Figure 152:
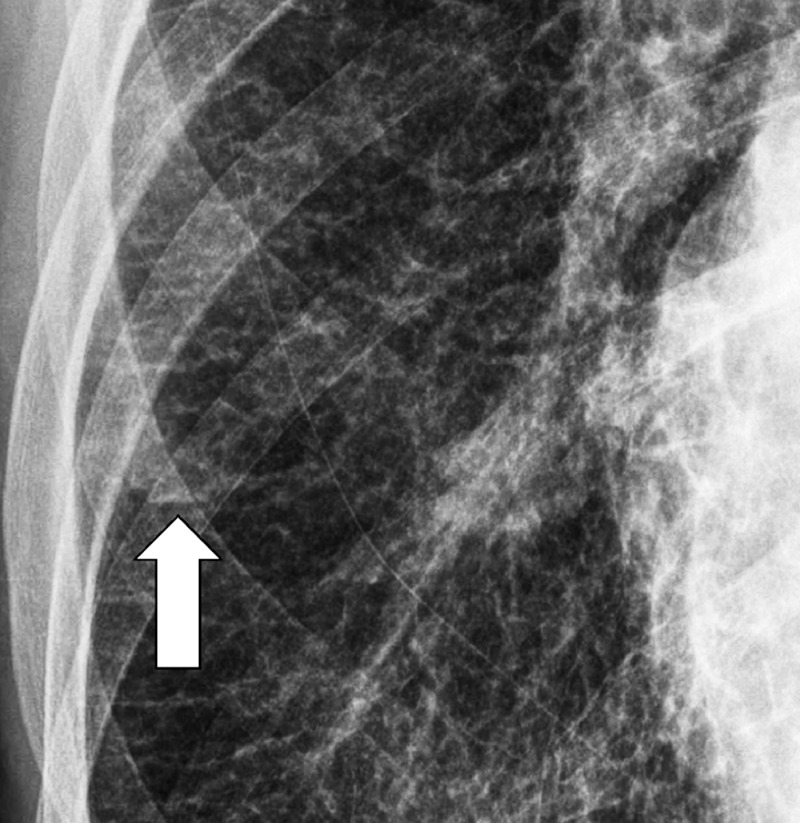
Septal thickening: Frontal chest radiograph shows septal lines (arrow).
Formerly referred to as “Kerley lines” on radiographs, an obsolete and nonrecommended term, they reflect the accumulation of fluid or tumor in the interstitium* (eg, in pulmonary edema, lymphangitic carcinomatosis, and/or mechanical lymphatic obstruction). On CT examinations, septal thickening can be smooth or nodular, which may help to differentiate edema from lymphatic infiltration or obstruction.
Signet Ring Sign (Pathology) (Fig 156)
Figure 156:

Signet ring sign: Transverse CT images of the (A) left and (B) right lower lobe in two different patients show dilated bronchi accompanied by smaller pulmonary arteries (arrow).
The signet ring sign refers to the ring-shaped structure representing a dilated bronchus imaged perpendicularly, accompanied by a smaller adjacent rounded and dense structure representing the accompanying pulmonary artery. The combination of both resembles a signet or pearl ring. It is considered typical of bronchiectasis* but can also be seen in diseases with abnormally decreased pulmonary arterial flow (eg, chronic thromboembolic disease or proximal interruption of the pulmonary artery) (138–141).
Silhouette Sign (Pathology) (Fig 157)
Figure 157:

Silhouette sign: (A, B) Frontal chest radiographs of two different patients show obscuration of right-sided heart border by adjacent consolidation in the middle lobe.
The silhouette sign refers to the obscuration of a normal silhouette or interface (often incorrectly described as “silhouetting”) and results from the juxtaposition of structures with similar radiographic attenuation that obliterate normal anatomic borders or interfaces. However, it is not always indicative of pulmonary disease; for example, obscuration of the heart border can sometimes be caused by anatomic variants such as pectus excavatum (6,142,143).
Small Airways Disease (Pathology)
This umbrella term summarizes diseases of the peripheral airways*. The definitions of the term vary. Some radiologists consider small airways as those with an internal diameter of less than or equal to 2 mm and a wall thickness of less than 0.5 mm. Others place the demarcation between central and peripheral airways at the level of the bronchiole*. Although the two definitions are not consistent, the first one appears more practical and is more commonly used in the literature. On CT examinations, these diseases can manifest as peribronchiolar and/or bronchiolar abnormalities, including tree-in-bud opacities* (opacity*), centrilobular micronodules (micronodule*), air trapping*, bronchiolectasis*, oligemia*, or a combination of these findings (101,144,145).
Spiculation (Pathology) [Descriptor] (Fig 158)
Figure 158:
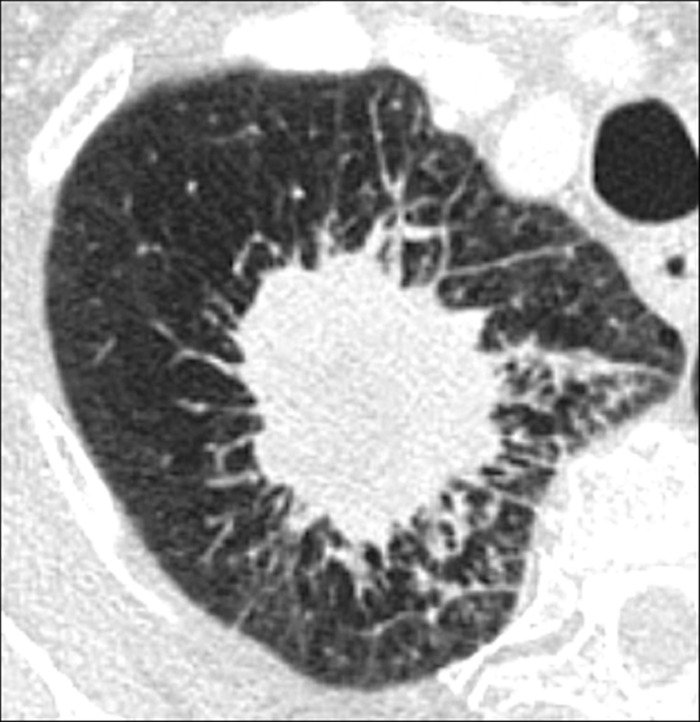
Spiculation: Transverse CT image of the right upper lobe shows a spiculated mass.
Spiculation is a descriptive term referring to multiple fine linear strands extending from a structure (eg, a nodule* or its components) into the surrounding lung parenchyma* in a stellate manner. Pathologically, spiculations are often associated with a desmoplastic process (eg, an invasive malignancy) within the nodule, resulting in fibrotic strands radiating into the surrounding lung. Spiculations can also be associated with direct infiltration into adjacent bronchial or vascular structures or focal lymphangitic extension. Spiculation in a nodule increases the likelihood of cancer, although it is not specific (146).
Tracheomalacia, Tracheobronchomalacia (Pathology) (Figs 159, 160)
Figure 159:
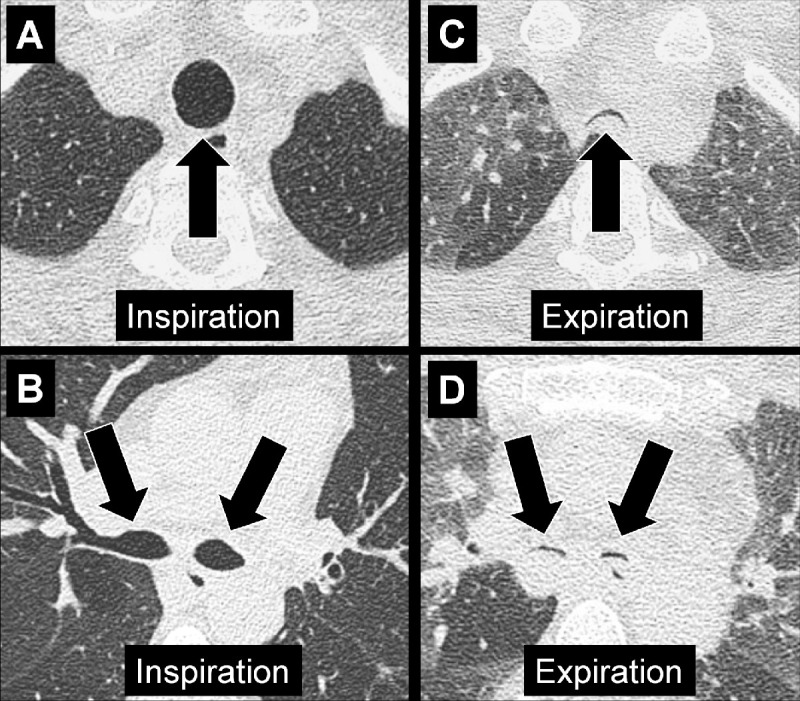
Tracheobronchomalacia: Transverse CT images at the level of the (A, C) trachea and (B, D) the main bronchi in (A, B) inspiration and (C, D) expiration. Expiration causes near-complete collapse of both trachea and main bronchi (arrows).
Figure 160:

Tracheomalacia: Transverse CT images of the upper thorax. (A) In inspiration, the shape of the trachea (arrow) is abnormal, with an increased transverse diameter. (B) Expiration shows near-complete tracheal collapse (arrow).
The terms tracheomalacia and tracheobronchomalacia are used when there is excessive inward movement of the trachea and/or main bronchi during expiration, due to pathologic weakness of the cartilaginous airway wall (147). The closely related term “excessive dynamic airway collapse” (Fig 161) is used when tracheobronchial collapse is due to excessive invagination of the posterior muscular tracheal or main bronchial walls during expiration. Both entities can be diagnosed with dynamic expiratory CT. However, it is important to be aware that in healthy individuals the trachea may collapse by 70% or more during a forced expiration (53,148).
Figure 161:
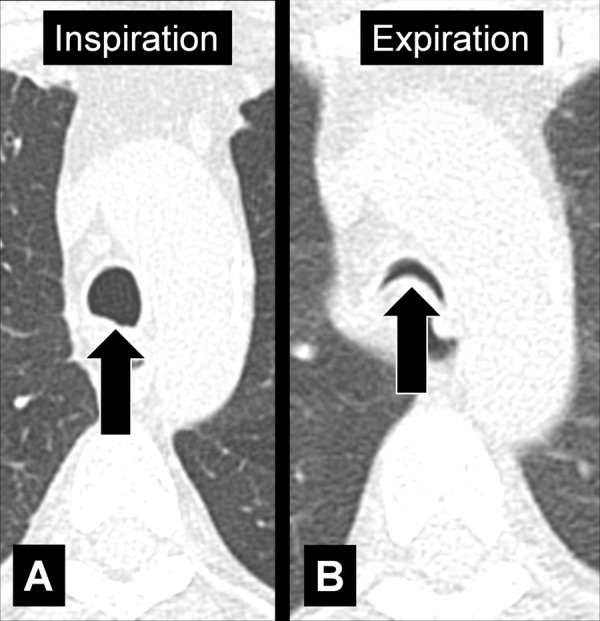
Excessive dynamic airway collapse: Transverse CT images at the level of the aortic arch in (A) inspiration and (B) expiration. Expiration causes an excessive invagination of the posterior tracheal wall (arrow).
Acknowledgments
Acknowledgments
The writing committee of the glossary would like to thank postdoctoral research associate, Daria Kifjak, for her invaluable effort and support along the evolution of this glossary project. Without her relentless, sustained, and deeply dedicated commitment, this project would not have seen the light in its current shape. The writing committee also acknowledges the following Fleischner Society members who reviewed this document and provided valuable feedback: Jeffrey R. Galvin, Sujal R. Desai, Geoffrey D. Rubin, David R. Baldwin, Mary Beth Beasley, Linda B. Haramati, Vincent Cottin, Takeshi Johkoh, Gregoire LeGal, Matthias Ochs, Grace Parraga, Charles A. Powell, Jay H. Ryu, and Lynette Sholl.
Footnotes
Disclosures of conflicts of interest: A.A.B. Consulting fees from AstraZeneca, Daiichi, Esai, and Olympus. H.M. No relevant relationships. T.C. No relevant relationships. P.A.G. No relevant relationships. J.M.G. Research grants from Coreline Soft and Taejoon Pharm. A.N.C.L. Grants to institution from National Institutes of Health; payment or honoraria for lectures from CME Science and Radiology International; Executive Committee, Fleischner Society. D.A.L. Grant support from Boehringer Ingelheim; consultant for Boehringer Ingelheim, Daiichi Sankyo, AstraZeneca, and Calyx; payment or honoraria for lectures, presentations, speakers bureaus, manuscript writing or educational events from Clinical Care Options; patents planned, issued, or pending for US Patent# 10,706,533 (July 7, 2020), 11,468,564 (Oct 11, 2022), 11,494,902 (Nov 8, 2022) “Systems and method for automatic detection and quantification of pathology using dynamic feature classification” (2879-198) (with Stephen Humphries, PhD). C.M.S.P. Royalties or licenses from Elsevier, Springer, and Thieme; consulting fees from Siemens and Philips; payment or honoraria for lectures, presentations, speakers bureaus, manuscript writing or educational events from Boehringer and Canon; support for attending meetings and/or travel from Canon. N.T. No relevant relationships. W.T.D. No relevant relationships. J.A.V. No relevant relationships. C.S.W. No relevant relationships. D.P.N. No relevant relationships.
References
- 1. Tuddenham WJ . Glossary of terms for thoracic radiology: recommendations of the Nomenclature Committee of the Fleischner Society . AJR Am J Roentgenol 1984. ; 143 ( 3 ): 509 – 517 . [DOI] [PubMed] [Google Scholar]
- 2. Austin JH , Müller NL , Friedman PJ , et al . Glossary of terms for CT of the lungs: recommendations of the Nomenclature Committee of the Fleischner Society . Radiology 1996. ; 200 ( 2 ): 327 – 331 . [DOI] [PubMed] [Google Scholar]
- 3. Hansell DM , Bankier AA , MacMahon H , McLoud TC , Müller NL , Remy J . Fleischner Society: glossary of terms for thoracic imaging . Radiology 2008. ; 246 ( 3 ): 697 – 722 . [DOI] [PubMed] [Google Scholar]
- 4. Leivada E , D’Alessandro R , Grohmann KK . Eliciting Big Data From Small, Young, or Non-standard Languages: 10 Experimental Challenges . Front Psychol 2019. ; 10 : 313 . [DOI] [PMC free article] [PubMed] [Google Scholar]
- 5. Brady AP . Radiology reporting-from Hemingway to HAL? Insights Imaging 2018. ; 9 ( 2 ): 237 – 246 . [DOI] [PMC free article] [PubMed] [Google Scholar]
- 6. Marshall GB , Farnquist BA , MacGregor JH , Burrowes PW . Signs in thoracic imaging . J Thorac Imaging 2006. ; 21 ( 1 ): 76 – 90 . [DOI] [PubMed] [Google Scholar]
- 7. George PP , Irodi A , Nidugala Keshava S , Lamont AC . ‘Felson Signs’ revisited . J Med Imaging Radiat Oncol 2014. ; 58 ( 1 ): 64 – 74 . [DOI] [PubMed] [Google Scholar]
- 8. Algın O , Gökalp G , Topal U . Signs in chest imaging . Diagn Interv Radiol 2011. ; 17 ( 1 ): 18 – 29 . [DOI] [PubMed] [Google Scholar]
- 9. Webb WR . Thin-section CT of the secondary pulmonary lobule: anatomy and the image--the 2004 Fleischner lecture . Radiology 2006. ; 239 ( 2 ): 322 – 338 . [DOI] [PubMed] [Google Scholar]
- 10. Weibel ER . Fleischner Lecture. Looking into the lung: what can it tell us? AJR Am J Roentgenol 1979. ; 133 ( 6 ): 1021 – 1031 . [DOI] [PubMed] [Google Scholar]
- 11. Reed JC , Madewell JE . The air bronchogram in interstitial disease of the lungs. A radiological-pathological correlation . Radiology 1975. ; 116 ( 1 ): 1 – 9 . [DOI] [PubMed] [Google Scholar]
- 12. Buckingham SJ , Hansell DM . Aspergillus in the lung: diverse and coincident forms . Eur Radiol 2003. ; 13 ( 8 ): 1786 – 1800 . [DOI] [PubMed] [Google Scholar]
- 13. Abramson S . The air crescent sign . Radiology 2001. ; 218 ( 1 ): 230 – 232 . [DOI] [PubMed] [Google Scholar]
- 14. Raghu G , Remy-Jardin M , Ryerson CJ , et al . Diagnosis of Hypersensitivity Pneumonitis in Adults. An Official ATS/JRS/ALAT Clinical Practice Guideline . Am J Respir Crit Care Med 2020. ; 202 ( 3 ): e36 – e69 . [Published corrections appear in Am J Respir Crit Care Med 2021;203(1):150-151 and Am J Respir Crit Care Med 2022;206(4):518.] [DOI] [PMC free article] [PubMed] [Google Scholar]
- 15. Arakawa H , Stern EJ , Nakamoto T , Fujioka M , Kaneko N , Harasawa H . Chronic pulmonary thromboembolism. Air trapping on computed tomography and correlation with pulmonary function tests . J Comput Assist Tomogr 2003. ; 27 ( 5 ): 735 – 742 . [DOI] [PubMed] [Google Scholar]
- 16. Kligerman SJ , Henry T , Lin CT , Franks TJ , Galvin JR . Mosaic Attenuation: Etiology, Methods of Differentiation, and Pitfalls . RadioGraphics 2015. ; 35 ( 5 ): 1360 – 1380 . [DOI] [PubMed] [Google Scholar]
- 17. Arakawa H , Webb WR . Air trapping on expiratory high-resolution CT scans in the absence of inspiratory scan abnormalities: correlation with pulmonary function tests and differential diagnosis . AJR Am J Roentgenol 1998. ; 170 ( 5 ): 1349 – 1353 . [DOI] [PubMed] [Google Scholar]
- 18. Bankier AA , Estenne M , Kienzl D , Müller-Mang C , Van Muylem A , Gevenois PA . Gravitational gradients in expiratory computed tomography examinations of patients with small airways disease: effect of body position on extent of air trapping . J Thorac Imaging 2010. ; 25 ( 4 ): 311 – 319 . [DOI] [PubMed] [Google Scholar]
- 19. Arakawa H , Kurihara Y , Sasaka K , Nakajima Y , Webb WR . Air trapping on CT of patients with pulmonary embolism . AJR Am J Roentgenol 2002. ; 178 ( 5 ): 1201 – 1207 . [DOI] [PubMed] [Google Scholar]
- 20. Murata K , Khan A , Herman PG . Pulmonary parenchymal disease: evaluation with high-resolution CT . Radiology 1989. ; 170 ( 3 Pt 1 ): 629 – 635 . [DOI] [PubMed] [Google Scholar]
- 21. Boiselle PM , Ernst A . State-of-the-art imaging of the central airways . Respiration 2003. ; 70 ( 4 ): 383 – 394 . [DOI] [PubMed] [Google Scholar]
- 22. Pu J , Gu S , Liu S , et al . CT based computerized identification and analysis of human airways: a review . Med Phys 2012. ; 39 ( 5 ): 2603 – 2616 . [DOI] [PMC free article] [PubMed] [Google Scholar]
- 23. Lawrence DA , Branson B , Oliva I , Rubinowitz A . The wonderful world of the windpipe: a review of central airway anatomy and pathology . Can Assoc Radiol J 2015. ; 66 ( 1 ): 30 – 43 . [DOI] [PubMed] [Google Scholar]
- 24. Schreuder A , van Ginneken B , Scholten ET , et al . Classification of CT Pulmonary Opacities as Perifissural Nodules: Reader Variability . Radiology 2018. ; 288 ( 3 ): 867 – 875 . [DOI] [PubMed] [Google Scholar]
- 25. Heitzman ER . The Infra-aortic Area . The Mediastinum: Radiologic Correlations with Anatomy and Pathology . Springer; , 1988. ; 151 – 214 . [Google Scholar]
- 26. Im JG , Webb WR , Han MC , Park JH . Apical opacity associated with pulmonary tuberculosis: high-resolution CT findings . Radiology 1991. ; 178 ( 3 ): 727 – 731 . [DOI] [PubMed] [Google Scholar]
- 27. Yousem SA . Pulmonary apical cap: a distinctive but poorly recognized lesion in pulmonary surgical pathology . Am J Surg Pathol 2001. ; 25 ( 5 ): 679 – 683 . [DOI] [PubMed] [Google Scholar]
- 28. Dail DH . Pulmonary apical cap . Am J Surg Pathol 2001. ; 25 ( 10 ): 1344 . [DOI] [PubMed] [Google Scholar]
- 29. Frankel SK , Cool CD , Lynch DA , Brown KK . Idiopathic pleuroparenchymal fibroelastosis: description of a novel clinicopathologic entity . Chest 2004. ; 126 ( 6 ): 2007 – 2013 . [DOI] [PubMed] [Google Scholar]
- 30. Lynch DA , Sverzellati N , Travis WD , et al . Diagnostic criteria for idiopathic pulmonary fibrosis: a Fleischner Society White Paper . Lancet Respir Med 2018. ; 6 ( 2 ): 138 – 153 . [DOI] [PubMed] [Google Scholar]
- 31. Travis WD , Costabel U , Hansell DM , et al . An official American Thoracic Society/European Respiratory Society statement: Update of the international multidisciplinary classification of the idiopathic interstitial pneumonias . Am J Respir Crit Care Med 2013. ; 188 ( 6 ): 733 – 748 . [DOI] [PMC free article] [PubMed] [Google Scholar]
- 32. Kamp DW . Asbestos-induced lung diseases: an update . Transl Res 2009. ; 153 ( 4 ): 143 – 152 . [DOI] [PMC free article] [PubMed] [Google Scholar]
- 33. Mossman BT , Gee JB . Asbestos-related diseases . N Engl J Med 1989. ; 320 ( 26 ): 1721 – 1730 . [DOI] [PubMed] [Google Scholar]
- 34. Lee AS , Ryu JH . Aspiration Pneumonia and Related Syndromes . Mayo Clin Proc 2018. ; 93 ( 6 ): 752 – 762 . [DOI] [PubMed] [Google Scholar]
- 35. Marik PE . Aspiration pneumonitis and aspiration pneumonia . N Engl J Med 2001. ; 344 ( 9 ): 665 – 671 . [DOI] [PubMed] [Google Scholar]
- 36. Woodring JH , Reed JC . Types and mechanisms of pulmonary atelectasis . J Thorac Imaging 1996. ; 11 ( 2 ): 92 – 108 . [DOI] [PubMed] [Google Scholar]
- 37. Woodring JH , Reed JC . Radiographic manifestations of lobar atelectasis . J Thorac Imaging 1996. ; 11 ( 2 ): 109 – 144 . [DOI] [PubMed] [Google Scholar]
- 38. Godoy MC , Viswanathan C , Marchiori E , et al . The reversed halo sign: update and differential diagnosis . Br J Radiol 2012. ; 85 ( 1017 ): 1226 – 1235 . [DOI] [PMC free article] [PubMed] [Google Scholar]
- 39. Heitzman ER . The Infra-azygos Area . The Mediastinum: Radiologic Correlations with Anatomy and Pathology . Springer; , 1988. ; 271 – 310 . [Google Scholar]
- 40. Grundy S , Bentley A , Tschopp JM . Primary spontaneous pneumothorax: a diffuse disease of the pleura . Respiration 2012. ; 83 ( 3 ): 185 – 189 . [DOI] [PubMed] [Google Scholar]
- 41. Milne EN , Pistolesi M , Miniati M , Giuntini C . The radiologic distinction of cardiogenic and noncardiogenic edema . AJR Am J Roentgenol 1985. ; 144 ( 5 ): 879 – 894 . [DOI] [PubMed] [Google Scholar]
- 42. Colby TV , Swensen SJ . Anatomic distribution and histopathologic patterns in diffuse lung disease: correlation with HRCT . J Thorac Imaging 1996. ; 11 ( 1 ): 1 – 26 . [DOI] [PubMed] [Google Scholar]
- 43. Aliberti S , Goeminne PC , O’Donnell AE , et al . Criteria and definitions for the radiological and clinical diagnosis of bronchiectasis in adults for use in clinical trials: international consensus recommendations . Lancet Respir Med 2022. ; 10 ( 3 ): 298 – 306 . [DOI] [PubMed] [Google Scholar]
- 44. Polverino E , Goeminne PC , McDonnell MJ , et al . European Respiratory Society guidelines for the management of adult bronchiectasis . Eur Respir J 2017. ; 50 ( 3 ): 1700629 . [DOI] [PubMed] [Google Scholar]
- 45. Piciucchi S , Tomassetti S , Ravaglia C , et al . From “traction bronchiectasis” to honeycombing in idiopathic pulmonary fibrosis: A spectrum of bronchiolar remodeling also in radiology? BMC Pulm Med 2016. ; 16 ( 1 ): 87 . [DOI] [PMC free article] [PubMed] [Google Scholar]
- 46. Staats P , Kligerman S , Todd N , Tavora F , Xu L , Burke A . A comparative study of honeycombing on high resolution computed tomography with histologic lung remodeling in explants with usual interstitial pneumonia . Pathol Res Pract 2015. ; 211 ( 1 ): 55 – 61 . [DOI] [PubMed] [Google Scholar]
- 47. Woodring JH . Unusual radiographic manifestations of lung cancer . Radiol Clin North Am 1990. ; 28 ( 3 ): 599 – 618 . [PubMed] [Google Scholar]
- 48. Suut S , Al-Ani Z , Allen C , et al . Pictorial essay of radiological features of benign intrathoracic masses . Ann Thorac Med 2015. ; 10 ( 4 ): 231 – 242 . [DOI] [PMC free article] [PubMed] [Google Scholar]
- 49. Lim SY , Lee KJ , Jeon K , et al . Classification of broncholiths and clinical outcomes . Respirology 2013. ; 18 ( 4 ): 637 – 642 . [DOI] [PubMed] [Google Scholar]
- 50. Seo JB , Song KS , Lee JS , et al . Broncholithiasis: review of the causes with radiologic-pathologic correlation . RadioGraphics 2002. ; 22 ( Spec No ): S199 – S213 . [DOI] [PubMed] [Google Scholar]
- 51. Alshabani K , Ghosh S , Arrossi AV , Mehta AC . Broncholithiasis: A Review . Chest 2019. ; 156 ( 3 ): 445 – 455 . [DOI] [PubMed] [Google Scholar]
- 52. Boiselle PM , Litmanovich DE , Michaud G , et al . Dynamic expiratory tracheal collapse in morbidly obese COPD patients . COPD 2013. ; 10 ( 5 ): 604 – 610 . [DOI] [PubMed] [Google Scholar]
- 53. Boiselle PM , O’Donnell CR , Bankier AA , et al . Tracheal collapsibility in healthy volunteers during forced expiration: assessment with multidetector CT . Radiology 2009. ; 252 ( 1 ): 255 – 262 . [DOI] [PMC free article] [PubMed] [Google Scholar]
- 54. Ryu JH , Swensen SJ . Cystic and cavitary lung diseases: focal and diffuse . Mayo Clin Proc 2003. ; 78 ( 6 ): 744 – 752 . [DOI] [PubMed] [Google Scholar]
- 55. Gadkowski LB , Stout JE . Cavitary pulmonary disease . Clin Microbiol Rev 2008. ; 21 ( 2 ): 305 – 333 . [DOI] [PMC free article] [PubMed] [Google Scholar]
- 56. Lee KS , Kim Y , Han J , Ko EJ , Park CK , Primack SL . Bronchioloalveolar carcinoma: clinical, histopathologic, and radiologic findings . RadioGraphics 1997. ; 17 ( 6 ): 1345 – 1357 . [DOI] [PubMed] [Google Scholar]
- 57. Araki T , Nishino M , Gao W , et al . Pulmonary cysts identified on chest CT: are they part of aging change or of clinical significance? Thorax 2015. ; 70 ( 12 ): 1156 – 1162 . [DOI] [PMC free article] [PubMed] [Google Scholar]
- 58. Raoof S , Bondalapati P , Vydyula R , et al . Cystic Lung Diseases: Algorithmic Approach . Chest 2016. ; 150 ( 4 ): 945 – 965 . [DOI] [PMC free article] [PubMed] [Google Scholar]
- 59. Koyama M , Johkoh T , Honda O , et al . Chronic cystic lung disease: diagnostic accuracy of high-resolution CT in 92 patients . AJR Am J Roentgenol 2003. ; 180 ( 3 ): 827 – 835 . [DOI] [PubMed] [Google Scholar]
- 60. Dalen JE , Haffajee CI , Alpert JS 3rd , Howe JP , Ockene IS , Paraskos JA . Pulmonary embolism, pulmonary hemorrhage and pulmonary infarction . N Engl J Med 1977. ; 296 ( 25 ): 1431 – 1435 . [DOI] [PubMed] [Google Scholar]
- 61. Bray TJP , Mortensen KH , Gopalan D . Multimodality imaging of pulmonary infarction . Eur J Radiol 2014. ; 83 ( 12 ): 2240 – 2254 . [DOI] [PubMed] [Google Scholar]
- 62. Wagenvoort CA . Pathology of pulmonary thromboembolism . Chest 1995. ; 107 ( 1 Suppl ): 10S – 17S . [DOI] [PubMed] [Google Scholar]
- 63. Remy-Jardin M , Pistolesi M , Goodman LR , et al . Management of suspected acute pulmonary embolism in the era of CT angiography: a statement from the Fleischner Society . Radiology 2007. ; 245 ( 2 ): 315 – 329 . [DOI] [PubMed] [Google Scholar]
- 64. McDonough JE , Yuan R , Suzuki M , et al . Small-airway obstruction and emphysema in chronic obstructive pulmonary disease . N Engl J Med 2011. ; 365 ( 17 ): 1567 – 1575 . [DOI] [PMC free article] [PubMed] [Google Scholar]
- 65. Lynch DA , Austin JH , Hogg JC , et al . CT-Definable Subtypes of Chronic Obstructive Pulmonary Disease: A Statement of the Fleischner Society . Radiology 2015. ; 277 ( 1 ): 192 – 205 . [DOI] [PMC free article] [PubMed] [Google Scholar]
- 66. Gevenois PA , de Maertelaer V , De Vuyst P , Zanen J , Yernault JC . Comparison of computed density and macroscopic morphometry in pulmonary emphysema . Am J Respir Crit Care Med 1995. ; 152 ( 2 ): 653 – 657 . [DOI] [PubMed] [Google Scholar]
- 67. Stark DD , Federle MP , Goodman PC , Podrasky AE , Webb WR . Differentiating lung abscess and empyema: radiography and computed tomography . AJR Am J Roentgenol 1983. ; 141 ( 1 ): 163 – 167 . [DOI] [PubMed] [Google Scholar]
- 68. Bryant RE , Salmon CJ . Pleural empyema . Clin Infect Dis 1996. ; 22 ( 5 ): 747 – 762 ; quiz 763–764 . [DOI] [PubMed] [Google Scholar]
- 69. Tsujimoto N , Saraya T , Light RW , et al . A Simple Method for Differentiating Complicated Parapneumonic Effusion/Empyema from Parapneumonic Effusion Using the Split Pleura Sign and the Amount of Pleural Effusion on Thoracic CT . PLoS One 2015. ; 10 ( 6 ): e0130141 . [DOI] [PMC free article] [PubMed] [Google Scholar]
- 70. Aziz A , Ashizawa K , Nagaoki K , Hayashi K . High resolution CT anatomy of the pulmonary fissures . J Thorac Imaging 2004. ; 19 ( 3 ): 186 – 191 . [DOI] [PubMed] [Google Scholar]
- 71. Godwin JD , Tarver RD . Accessory fissures of the lung . AJR Am J Roentgenol 1985. ; 144 ( 1 ): 39 – 47 . [DOI] [PubMed] [Google Scholar]
- 72. Hayashi K , Aziz A , Ashizawa K , Hayashi H , Nagaoki K , Otsuji H . Radiographic and CT appearances of the major fissures . RadioGraphics 2001. ; 21 ( 4 ): 861 – 874 . [DOI] [PubMed] [Google Scholar]
- 73. FIPAT . Terminologia Anatomica . 2nd ed. Federative International Programme for Anatomical Terminology , 2019. ; 142 / 143 . https://fipat.library.dal.ca/TA2/. Accessed October 2023 . [Google Scholar]
- 74. Gruden JF , Huang L , Turner J , et al . High-resolution CT in the evaluation of clinically suspected Pneumocystis carinii pneumonia in AIDS patients with normal, equivocal, or nonspecific radiographic findings . AJR Am J Roentgenol 1997. ; 169 ( 4 ): 967 – 975 . [DOI] [PubMed] [Google Scholar]
- 75. Remy-Jardin M , Remy J , Giraud F , Wattinne L , Gosselin B . Computed tomography assessment of ground-glass opacity: semiology and significance . J Thorac Imaging 1993. ; 8 ( 4 ): 249 – 264 . [DOI] [PubMed] [Google Scholar]
- 76. Lee YR , Choi YW , Lee KJ , Jeon SC , Park CK , Heo JN . CT halo sign: the spectrum of pulmonary diseases . Br J Radiol 2005. ; 78 ( 933 ): 862 – 865 . [DOI] [PubMed] [Google Scholar]
- 77. Won HJ , Lee KS , Cheon JE , et al . Invasive pulmonary aspergillosis: prediction at thin-section CT in patients with neutropenia--a prospective study . Radiology 1998. ; 208 ( 3 ): 777 – 782 . [DOI] [PubMed] [Google Scholar]
- 78. Heitzman ER . The Pulmonary Hilum . The Mediastinum: Radiologic Correlations with Anatomy and Pathology . Springer; , 1988. ; 311 – 351 . [Google Scholar]
- 79. Benjamin F . The Hila and Pulmonary Vessels . Chest Roentgenology . 1 . Saunders: , 1973. ; 185 – 200 . [Google Scholar]
- 80. Watadani T , Sakai F , Johkoh T , et al . Interobserver variability in the CT assessment of honeycombing in the lungs . Radiology 2013. ; 266 ( 3 ): 936 – 944 . [DOI] [PubMed] [Google Scholar]
- 81. Leslie KO , Wick MR . Chronic Diffuse Lung Diseases . Practical Pulmonary Pathology: A Diagnostic Approach . 3rd ed. Elsevier Health Sciences; , 2018. ; 231 – 233 . [Google Scholar]
- 82. Galvin JR , Frazier AA , Franks TJ . Collaborative radiologic and histopathologic assessment of fibrotic lung disease . Radiology 2010. ; 255 ( 3 ): 692 – 706 . [DOI] [PubMed] [Google Scholar]
- 83. Nishino M , Itoh H , Hatabu H . A practical approach to high-resolution CT of diffuse lung disease . Eur J Radiol 2014. ; 83 ( 1 ): 6 – 19 . [DOI] [PMC free article] [PubMed] [Google Scholar]
- 84. Hata A , Schiebler ML , Lynch DA , Hatabu H . Interstitial Lung Abnormalities: State of the Art . Radiology 2021. ; 301 ( 1 ): 19 – 34 . [DOI] [PMC free article] [PubMed] [Google Scholar]
- 85. Hatabu H , Hunninghake GM , Richeldi L , et al . Interstitial lung abnormalities detected incidentally on CT: a Position Paper from the Fleischner Society . Lancet Respir Med 2020. ; 8 ( 7 ): 726 – 737 . [DOI] [PMC free article] [PubMed] [Google Scholar]
- 86. King TE Jr . Clinical advances in the diagnosis and therapy of the interstitial lung diseases . Am J Respir Crit Care Med 2005. ; 172 ( 3 ): 268 – 279 . [DOI] [PubMed] [Google Scholar]
- 87. Schwarz MI , King TE . Interstitial lung disease: PMPH-USA, 2003 . https://pmphusa.com/book/interstitial-lung-disease-5e/. Accessed October 2023 .
- 88. Antoniou KM , Margaritopoulos GA , Tomassetti S , Bonella F , Costabel U , Poletti V . Interstitial lung disease . Eur Respir Rev 2014. ; 23 ( 131 ): 40 – 54 . [DOI] [PMC free article] [PubMed] [Google Scholar]
- 89. Kattan KR , Eyler WR , Felson B . The juxtaphrenic peak in upper lobe collapse . Radiology 1980. ; 134 ( 3 ): 763 – 765 . [DOI] [PubMed] [Google Scholar]
- 90. Davis SD , Yankelevitz DF , Wand A , Chiarella DA . Juxtaphrenic peak in upper and middle lobe volume loss: assessment with CT . Radiology 1996. ; 198 ( 1 ): 143 – 149 . [DOI] [PubMed] [Google Scholar]
- 91. Cameron DC . The juxtaphrenic peak (Katten’s sign) is produced by rotation of an inferior accessory fissure . Australas Radiol 1993. ; 37 ( 4 ): 332 – 335 . [DOI] [PubMed] [Google Scholar]
- 92. Felson B . The Lobes . Chest Roentgenology . 1 . Philadelphia: : Saunders; , 1973. ; 71 – 142 . [Google Scholar]
- 93. Kradin RL , Spirn PW , Mark EJ . Intrapulmonary lymph nodes . Clinical, radiologic, and pathologic features . Chest 1985. ; 87 ( 5 ): 662 – 667 . [DOI] [PubMed] [Google Scholar]
- 94. Sharma A , Fidias P , Hayman LA , Loomis SL , Taber KH , Aquino SL . Patterns of lymphadenopathy in thoracic malignancies . RadioGraphics 2004. ; 24 ( 2 ): 419 – 434 . [DOI] [PubMed] [Google Scholar]
- 95. Munden RF , Carter BW , Chiles C , et al . Managing Incidental Findings on Thoracic CT: Mediastinal and Cardiovascular Findings. A White Paper of the ACR Incidental Findings Committee . J Am Coll Radiol 2018. ; 15 ( 8 ): 1087 – 1096 . [DOI] [PubMed] [Google Scholar]
- 96. Carter BW , Benveniste MF , Madan R , et al . ITMIG Classification of Mediastinal Compartments and Multidisciplinary Approach to Mediastinal Masses . RadioGraphics 2017. ; 37 ( 2 ): 413 – 436 . [DOI] [PubMed] [Google Scholar]
- 97. Carter BW . Preface: Modern Imaging of the Mediastinum . Radiol Clin North Am 2021. ; 59 ( 2 ): xiii . [DOI] [PubMed] [Google Scholar]
- 98. MacMahon H , Naidich DP , Goo JM , et al . Guidelines for Management of Incidental Pulmonary Nodules Detected on CT Images: From the Fleischner Society 2017 . Radiology 2017. ; 284 ( 1 ): 228 – 243 . [DOI] [PubMed] [Google Scholar]
- 99. Bankier AA , MacMahon H , Goo JM , Rubin GD , Schaefer-Prokop CM , Naidich DP . Recommendations for Measuring Pulmonary Nodules at CT: A Statement from the Fleischner Society . Radiology 2017. ; 285 ( 2 ): 584 – 600 . [DOI] [PubMed] [Google Scholar]
- 100. Webb WR , Stein MG , Finkbeiner WE , Im JG , Lynch D , Gamsu G . Normal and diseased isolated lungs: high-resolution CT . Radiology 1988. ; 166 ( 1 Pt 1 ): 81 – 87 . [DOI] [PubMed] [Google Scholar]
- 101. Hansell DM . Small airways diseases: detection and insights with computed tomography . Eur Respir J 2001. ; 17 ( 6 ): 1294 – 1313 . [DOI] [PubMed] [Google Scholar]
- 102. Martinez S , Heyneman LE , McAdams HP , Rossi SE , Restrepo CS , Eraso A . Mucoid impactions: finger-in-glove sign and other CT and radiographic features . RadioGraphics 2008. ; 28 ( 5 ): 1369 – 1382 . [DOI] [PubMed] [Google Scholar]
- 103. Shaw RR . Mucoid impaction of the bronchi . J Thorac Surg 1951. ; 22 ( 2 ): 149 – 163 . [PubMed] [Google Scholar]
- 104. Roberts CM , Citron KM , Strickland B . Intrathoracic aspergilloma: role of CT in diagnosis and treatment . Radiology 1987. ; 165 ( 1 ): 123 – 128 . [DOI] [PubMed] [Google Scholar]
- 105. Franquet T , Müller NL , Giménez A , Guembe P , de La Torre J , Bagué S . Spectrum of pulmonary aspergillosis: histologic, clinical, and radiologic findings . RadioGraphics 2001. ; 21 ( 4 ): 825 – 837 . [DOI] [PubMed] [Google Scholar]
- 106. Azour L , Ko JP , Naidich DP , Moore WH . Shades of Gray: Subsolid Nodule Considerations and Management . Chest 2021. ; 159 ( 5 ): 2072 – 2089 . [DOI] [PMC free article] [PubMed] [Google Scholar]
- 107. de Margerie-Mellon C , Bankier AA . To Be or Not to Be … a Pulmonary Nodule . Radiol Cardiothorac Imaging 2019. ; 1 ( 5 ): e190201 . [DOI] [PMC free article] [PubMed] [Google Scholar]
- 108. van Riel SJ , Sánchez CI , Bankier AA , et al . Observer Variability for Classification of Pulmonary Nodules on Low-Dose CT Images and Its Effect on Nodule Management . Radiology 2015. ; 277 ( 3 ): 863 – 871 . [DOI] [PubMed] [Google Scholar]
- 109. Ridge CA , Yildirim A , Boiselle PM , et al . Differentiating between Subsolid and Solid Pulmonary Nodules at CT: Inter- and Intraobserver Agreement between Experienced Thoracic Radiologists . Radiology 2016. ; 278 ( 3 ): 888 – 896 . [DOI] [PubMed] [Google Scholar]
- 110. Bruno MA , Milne EN , Stanford W , Smith CW . Pulmonary oligemia in aortic valve disease . Radiology 1999. ; 210 ( 1 ): 37 – 45 . [DOI] [PubMed] [Google Scholar]
- 111. Patterson HS , Sponaugle DN . Is infiltrate a useful term in the interpretation of chest radiographs? Physician survey results . Radiology 2005. ; 235 ( 1 ): 5 – 8 . [DOI] [PubMed] [Google Scholar]
- 112. Oikonomou A , Hansell DM . Organizing pneumonia: the many morphological faces . Eur Radiol 2002. ; 12 ( 6 ): 1486 – 1496 . [DOI] [PubMed] [Google Scholar]
- 113. Heitzman ER . The Supra-azygos Area . The Mediastinum: Radiologic Correlations with Anatomy and Pathology . Springer; , 1988. ; 215 – 269 . [Google Scholar]
- 114. Gibbs JM , Chandrasekhar CA , Ferguson EC , Oldham SA . Lines and stripes: where did they go?--From conventional radiography to CT . RadioGraphics 2007. ; 27 ( 1 ): 33 – 48 . [DOI] [PubMed] [Google Scholar]
- 115. Prazakova S , Thomas PS , Sandrini A , Yates DH . Asbestos and the lung in the 21st century: an update . Clin Respir J 2014. ; 8 ( 1 ): 1 – 10 . [DOI] [PubMed] [Google Scholar]
- 116. Han X , Fan Y , Alwalid O , et al . Six-month Follow-up Chest CT Findings after Severe COVID-19 Pneumonia . Radiology 2021. ; 299 ( 1 ): E177 – E186 . [DOI] [PMC free article] [PubMed] [Google Scholar]
- 117. Cherian SV , Patel D , Machnicki S , et al . Algorithmic Approach to the Diagnosis of Organizing Pneumonia: A Correlation of Clinical, Radiologic, and Pathologic Features . Chest 2022. ; 162 ( 1 ): 156 – 178 . [DOI] [PMC free article] [PubMed] [Google Scholar]
- 118. Rossi SE , Erasmus JJ , Volpacchio M , Franquet T , Castiglioni T , McAdams HP . “Crazy-paving” pattern at thin-section CT of the lungs: radiologic-pathologic overview . RadioGraphics 2003. ; 23 ( 6 ): 1509 – 1519 . [DOI] [PubMed] [Google Scholar]
- 119. Collins J . CT signs and patterns of lung disease . Radiol Clin North Am 2001. ; 39 ( 6 ): 1115 – 1135 . [DOI] [PubMed] [Google Scholar]
- 120. Collins J , Blankenbaker D , Stern EJ . CT patterns of bronchiolar disease: what is “tree-in-bud”? AJR Am J Roentgenol 1998. ; 171 ( 2 ): 365 – 370 . [DOI] [PubMed] [Google Scholar]
- 121. Charalampidis C , Youroukou A , Lazaridis G , et al . Pleura space anatomy . J Thorac Dis 2015. ; 7 ( Suppl 1 ): S27 – S32 . [DOI] [PMC free article] [PubMed] [Google Scholar]
- 122. Wang NS . Anatomy of the pleura . Clin Chest Med 1998. ; 19 ( 2 ): 229 – 240 . [DOI] [PubMed] [Google Scholar]
- 123. Heidinger BH , Schwarz-Nemec U , Anderson KR , et al . Visceral Pleural Invasion in Pulmonary Adenocarcinoma: Differences in CT Patterns between Solid and Subsolid Cancers . Radiol Cardiothorac Imaging 2019. ; 1 ( 3 ): e190071 . [DOI] [PMC free article] [PubMed] [Google Scholar]
- 124. Quigley MJ , Fraser RS . Pulmonary pneumatocele: pathology and pathogenesis . AJR Am J Roentgenol 1988. ; 150 ( 6 ): 1275 – 1277 . [DOI] [PubMed] [Google Scholar]
- 125. Kouritas VK , Papagiannopoulos K , Lazaridis G , et al . Pneumomediastinum . J Thorac Dis 2015. ; 7 ( Suppl 1 ): S44 – S49 . [DOI] [PMC free article] [PubMed] [Google Scholar]
- 126. Bejvan SM , Godwin JD . Pneumomediastinum: old signs and new signs . AJR Am J Roentgenol 1996. ; 166 ( 5 ): 1041 – 1048 . [DOI] [PubMed] [Google Scholar]
- 127. Sharma S , Maycher B , Eschun G . Radiological imaging in pneumonia: recent innovations . Curr Opin Pulm Med 2007. ; 13 ( 3 ): 159 – 169 . [DOI] [PubMed] [Google Scholar]
- 128. Alcón A , Fàbregas N , Torres A . Pathophysiology of pneumonia . Clin Chest Med 2005. ; 26 ( 1 ): 39 – 46 . [DOI] [PubMed] [Google Scholar]
- 129. Maxwell J . Pneumonitis . Lancet 1938. ; 232 ( 5996 ): 239 – 241 . [Google Scholar]
- 130. Maxwell J . Primary Atypical Pneumonia or Pneumonitis? BMJ 1943. ; 2 ( 4325 ): 689 . [Google Scholar]
- 131. Zylak CM , Standen JR , Barnes GR , Zylak CJ . Pneumomediastinum revisited . RadioGraphics 2000. ; 20 ( 4 ): 1043 – 1057 . [DOI] [PubMed] [Google Scholar]
- 132. Sahn SA , Heffner JE . Spontaneous pneumothorax . N Engl J Med 2000. ; 342 ( 12 ): 868 – 874 . [DOI] [PubMed] [Google Scholar]
- 133. Noppen M , De Keukeleire T . Pneumothorax . Respiration 2008. ; 76 ( 2 ): 121 – 127 . [DOI] [PubMed] [Google Scholar]
- 134. Greene R . "Saber-sheath” trachea: relation to chronic obstructive pulmonary disease . AJR Am J Roentgenol 1978. ; 130 ( 3 ): 441 – 445 . [DOI] [PubMed] [Google Scholar]
- 135. Greene R , Lechner GL . "Saber-Sheath” Trachea: A Clinical and Functional Study of Marked Coronal Narrowing of the Intrathoracic Trachea . Radiology 1975. ; 115 ( 2 ): 265 – 268 . [DOI] [PubMed] [Google Scholar]
- 136. Groskin SA . Subsegmental anatomy of the lung . Heitzman’s The Lung: Radiologic Pathologic Correlations . 3. Mosby-Year Book; , 1993. ; 42 – 69 . [Google Scholar]
- 137. Felson B . The Segments . Chest Roentgenology . 1 . Saunders: , 1973. ; 143 – 184 . [Google Scholar]
- 138. Ouellette H . The signet ring sign . Radiology 1999. ; 212 ( 1 ): 67 – 68 . [DOI] [PubMed] [Google Scholar]
- 139. McGuinness G , Naidich DP , Leitman BS , McCauley DI . Bronchiectasis: CT evaluation . AJR Am J Roentgenol 1993. ; 160 ( 2 ): 253 – 259 . [DOI] [PubMed] [Google Scholar]
- 140. Ryu DS , Spirn PW , Trotman-Dickenson B , et al . HRCT findings of proximal interruption of the right pulmonary artery . J Thorac Imaging 2004. ; 19 ( 3 ): 171 – 175 . [DOI] [PubMed] [Google Scholar]
- 141. Remy-Jardin M , Remy J , Louvegny S , Artaud D , Deschildre F , Duhamel A . Airway changes in chronic pulmonary embolism: CT findings in 33 patients . Radiology 1997. ; 203 ( 2 ): 355 – 360 . [DOI] [PubMed] [Google Scholar]
- 142. Felson B , Felson H . Localization of intrathoracic lesions by means of the postero-anterior roentgenogram; the silhouette sign . Radiology 1950. ; 55 ( 3 ): 363 – 374 . [DOI] [PubMed] [Google Scholar]
- 143. Walker CM , Abbott GF , Greene RE , Shepard JA , Vummidi D , Digumarthy SR . Imaging pulmonary infection: classic signs and patterns . AJR Am J Roentgenol 2014. ; 202 ( 3 ): 479 – 492 . [DOI] [PubMed] [Google Scholar]
- 144. Abbott GF , Rosado-de-Christenson ML , Rossi SE , Suster S . Imaging of small airways disease . J Thorac Imaging 2009. ; 24 ( 4 ): 285 – 298 . [DOI] [PubMed] [Google Scholar]
- 145. Allen TC . Pathology of small airways disease . Arch Pathol Lab Med 2010. ; 134 ( 5 ): 702 – 718 . [DOI] [PubMed] [Google Scholar]
- 146. Zwirewich CV , Vedal S , Miller RR , Müller NL . Solitary pulmonary nodule: high-resolution CT and radiologic-pathologic correlation . Radiology 1991. ; 179 ( 2 ): 469 – 476 . [DOI] [PubMed] [Google Scholar]
- 147. Mitropoulos A , Song W-J , Almaghlouth F , Kemp S , Polkey M , Hull JH . Detection and diagnosis of large airway collapse: a systematic review . ERJ Open Res 2021. ; 7 ( 3 ): 00055 – 2021 . [DOI] [PMC free article] [PubMed] [Google Scholar]
- 148. Aslam A , De Luis Cardenas J , Morrison RJ , et al . Tracheobronchomalacia and Excessive Dynamic Airway Collapse: Current Concepts and Future Directions . RadioGraphics 2022. ; 42 ( 4 ): 1012 – 1027 . [DOI] [PubMed] [Google Scholar]