

SUMMARY
Individuals with Williams syndrome (WS), a neurodevelopmental disorder caused by hemizygous loss of 26–28 genes at 7q11.23, characteristically portray a hypersocial phenotype. Copy-number variations and mutations in one of these genes, GTF2I, are associated with altered sociality and are proposed to underlie hypersociality in WS. However, the contribution of GTF2I to human neurodevelopment remains poorly understood. Here, human cellular models of neurodevelopment, including neural progenitors, neurons, and three-dimensional cortical organoids, are differentiated from CRISPR-Cas9-edited GTF2I-knockout (GTF2I-KO) pluripotent stem cells to investigate the role of GTF2I in human neurodevelopment. GTF2I-KO progenitors exhibit increased proliferation and cell-cycle alterations. Cortical organoids and neurons demonstrate increased cell death and synaptic dysregulation, including synaptic structural dysfunction and decreased electrophysiological activity on a multielectrode array. Our findings suggest that changes in synaptic circuit integrity may be a prominent mediator of the link between alterations in GTF2I and variation in the phenotypic expression of human sociality.
Graphical Abstract

In brief
GTF2I is thought to influence the phenotypic expression of human sociality and is implicated in neurodevelopmental disease. Adams et al. use hiPSC-derived cell platforms to investigate the role of GTF2I in human neurodevelopment. Loss of GTF2I promotes increased cell death, reduced synaptic integrity, and decreased electrical activity of cortical organoids.
INTRODUCTION
Deletion or duplication of 26–28 genes in the 7q11.23 chromosomal region results in Williams syndrome (WS) or 7q11.23 microduplication syndrome (7dup), respectively.1,2 Individuals with these multisystemic disorders exhibit a constellation of symptoms with frequently opposing phenotypic expression. This phenotypic contrast reflects the dose-dependent effects of copy-number alterations of the underlying genes, consequently rendering these disorders tractable portraits of genotype-phenotype correlation.3–5 Notable among these contrasting symptoms are opposing neurocognitive phenotypes, in particular, differences in social expressivity.1,2 Whereas individuals with 7dup customarily portray hyposocial symptoms of autism spectrum disorder (ASD),1,6 individuals with WS feature the unique behavioral trait of pronounced hypersociality.7,8
In distinction from individuals with classical or “typical” WS, in whom haploinsufficiency affects the full set of 26–28 genes, some individuals—who are said to have “atypical” WS—have smaller deletions that spare select genes near the deletion breakpoints and consequently present with partial WS clinical profiles that spare particular phenotypes.5 On this basis, previous studies have indicated that the altered social phenotype exhibited by individuals with WS may be attributable to the haploinsufficiency of GTF2I,9,10 a gene located in the WS chromosomal region.2,5,11,12 Most notable was the observation of a patient who near-selectively preserved both copies of GTF2I and, in association, retained a normal social phenotype.13 Similarly, a separate study reported two SNPs in GTF2I in a cohort of individuals with ASD,14 a further argument for the role of this gene as a mediator of social expression. More intriguingly, some evidence indicates that the 7q11.23 locus,15,16 and GTF2I in particular,17,18 has undergone extensive modification in the human evolutionary lineage, suggesting this gene may contribute more broadly to variation in human sociality.19
GTF2I encodes the general transcription factor 2I (GTF2I), a protein with multiple functions in both the cytoplasm and nucleus of the cell.20,21 GTF2I is primarily thought to be a prominent regulator of signal-induced gene transcription, a process in which stimulation via extracellular signals activates GTF2I, inducing its translocation to the nucleus.20,22,23 To date, most studies that have investigated the effects of GTF2I on neurodevelopment have been conducted in animal models,24,25 which have tended to affirm the association of heterozygous GTF2I deletion with hypersociality and demonstrated the essentiality of GTF2I for viability.26–28 Barak and colleagues additionally showed that GTF2I deletion selectively in excitatory neurons resulted in impaired myelination in the brains of mice.29 Despite this progress, however, recapitulation of aspects of human cortical development by animal models may be suboptimal,30 a subtle yet perhaps salient difference given the prominent association between humans and social expression. As a different method, the use of human induced pluripotent stem cells (hiPSCs) has facilitated the study of mechanisms of neurodevelopmental disease in a human context.31 Prior studies that have investigated this spectrum of disorders using hiPSCs have been limited mainly to WS and 7dup.32,33 In consequence, the role of GTF2I in human neurodevelopment has yet to be comprehensively defined.
Here, we used neural cellular models, including neural progenitor cells (NPCs), human neurons, and three-dimensional cortical organoids, from isogenic GTF2I-knockout (GTF2I-KO) hiPSCs to investigate the contribution of GTF2I to human neurodevelopment. Loss of GTF2I resulted in progenitors with altered cell cycles and proliferation and promoted the development of neurons and cortical organoids with synaptic defects, increased cell death, and decreased electrophysiological activity. Overall, our findings support a model in which alterations in NPCs induced by the loss of GTF2I give rise to neurons and networks with synaptic reduction, reduced electrical activity, and impaired neuronal health.
RESULTS
Loss of GTF2I induces transcriptomic alterations in cortical organoids
To investigate the role of GTF2I in human neurodevelopment, two hiPSC lines (CVB and WT83) were CRISPR edited into isogenic GTF2I-KO pairs (Figures 1A, S1, and S2)34 and subsequently differentiated into neural cell types. Control and GTF2IKO hiPSCs were initially differentiated into cortical organoids (Figure 1B),35 a cytoarchitecturally complex human cellular model of neurodevelopment that develops in close alignment with the human fetal developing brain.36–38 Concordantly, immunostaining of cortical organoids portrayed a characteristic neurodevelopmental spatiotemporal pattern in which Ki67+ progenitor regions give rise to NeuN+ and MAP2+ neurons (Figure 1C),35 and initially predominant Ki67+ progenitors diminished with the temporal emergence of neurons (NeuN+, CTIP2+) and, subsequently, glial fibrillary acidic protein-positive glia (Figure S3A). We further sought to evaluate the expression of GTF2I in the cortical organoid model via analysis of single-cell transcriptomic data previously generated by our group (Figures S3B–S3E).35 Single-cell transcriptomic data from 1-, 3-, 6-, and 10-month cortical organoids were analyzed; cells distinctly clustered by organoid age (Figure S3B) and cell type (Figure S3C). GTF2I was robustly expressed in organoids (Figure S3D); however, expression was notably most pronounced in progenitors and glutamatergic neurons (Figure S3E). Immunostaining likewise portrayed GTF2I expression in control cortical organoids that was absent in organoids differentiated from GTF2I-KO hiPSCs (Figure 1D).
Figure 1. Transcriptomic alterations in GTF2I-KO cortical organoids.
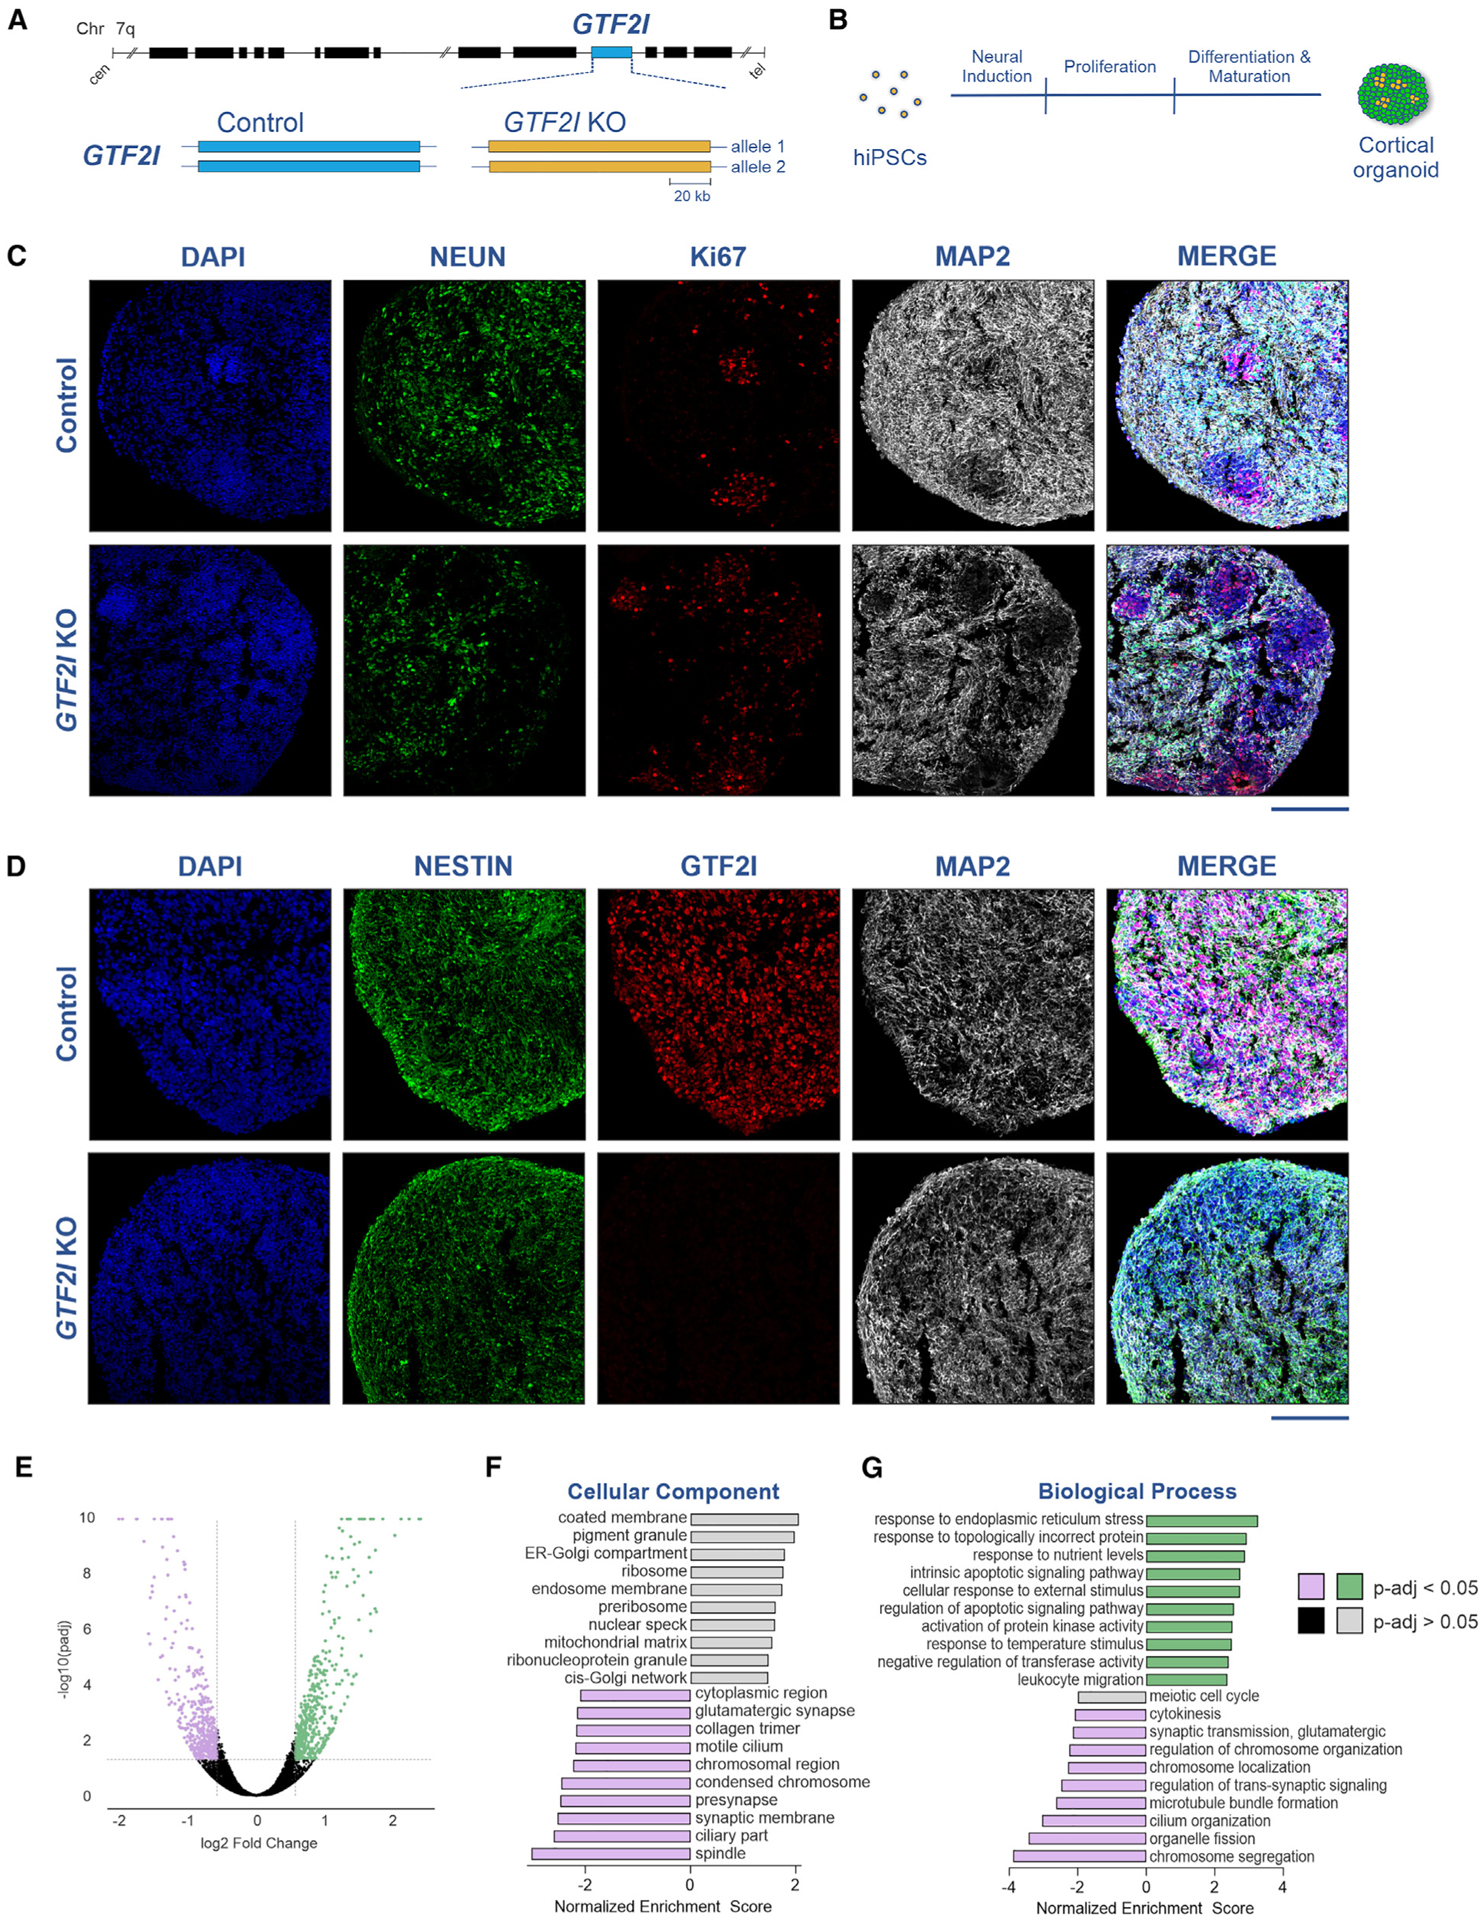
(A) Depiction of the GTF2I locus on chromosome 7 (top) and representation of its alleles in the control and GTF2I-KO conditions (bottom).
(B) Schematic showing the differentiation protocol of cortical organoids from hiPSCs.
(C) Immunostaining of 2-month-old organoids showed progenitor regions of Ki67 positivity that give rise to mature neurons immunopositive for NeuN and MAP2; scale bar, 200 μm.
(D) GTF2I is robustly expressed in 2-month-old control organoids and absent in GTF2I-KO organoids; scale bar, 200 μm.
(E) Volcano plot showing differentially expressed genes detected by RNA sequencing of 2-month-old control and GTF2I-KO organoids.
(F and G) Gene Ontology analysis of top 10 and bottom 10 altered gene expression pathways within the categories “cellular component” (F) and “ biological process” (G).
A prior investigation of transcriptomic variation in 7q11.23 cell lines strategically estimated that 10%–20% of the differential expression could be attributed to GTF2I, with that variance particularly enriched in biological categories most relevant to disease-specific phenotypes.33 Similarly, we predicted that the removal of GTF2I would be associated with transcriptomic changes in cortical organoids and that dysregulation would be particularly enriched in pathways critical for neurodevelopment. Comparison of the transcriptomic profiles of 2-month-old organoids showed markedly altered expression, with the upregulation (≥1.5-fold) of 456 genes and downregulation (≤‒ 1.5-fold) of 404 genes in GTF2I-KO cortical organoids compared to controls (Figure 1E). Summary Gene Ontology analysis of top differentially expressed pathways for the “cellular component” and “biological process” showed the downregulation of synaptic processes and synaptic signaling, particularly of glutamatergic transmission, and the upregulation of pathways relevant to apoptotic signaling (Figures 1F and 1G).
GTF2I-KO alters cell cycle, proliferation, and survival
Consistent with increased expression of apoptotic signaling pathways, neuronal deletion of GTF2I is associated with decreased brain weight and cortical thickness in mice.29 We likewise observed that 2-month-old GTF2I-KO organoids were decreased in diameter compared to controls (p < 0.0001; Figure 2A), yet exhibited similar proportions of Ki67+ proliferative cells (Figure S4A). To further evaluate their apoptotic phenotype, 2- and 3-month-old organoids were dissociated and assessed via an annexin assay. GTF2I-KO organoids at 2 months (p = 0.004) and 3 months of age (p = 0.019) exhibited a higher frequency of apoptotic cells compared to controls (Figures 2B and S4B).
Figure 2. Loss of GTF2I alters proliferation dynamics and survival in human cell models.
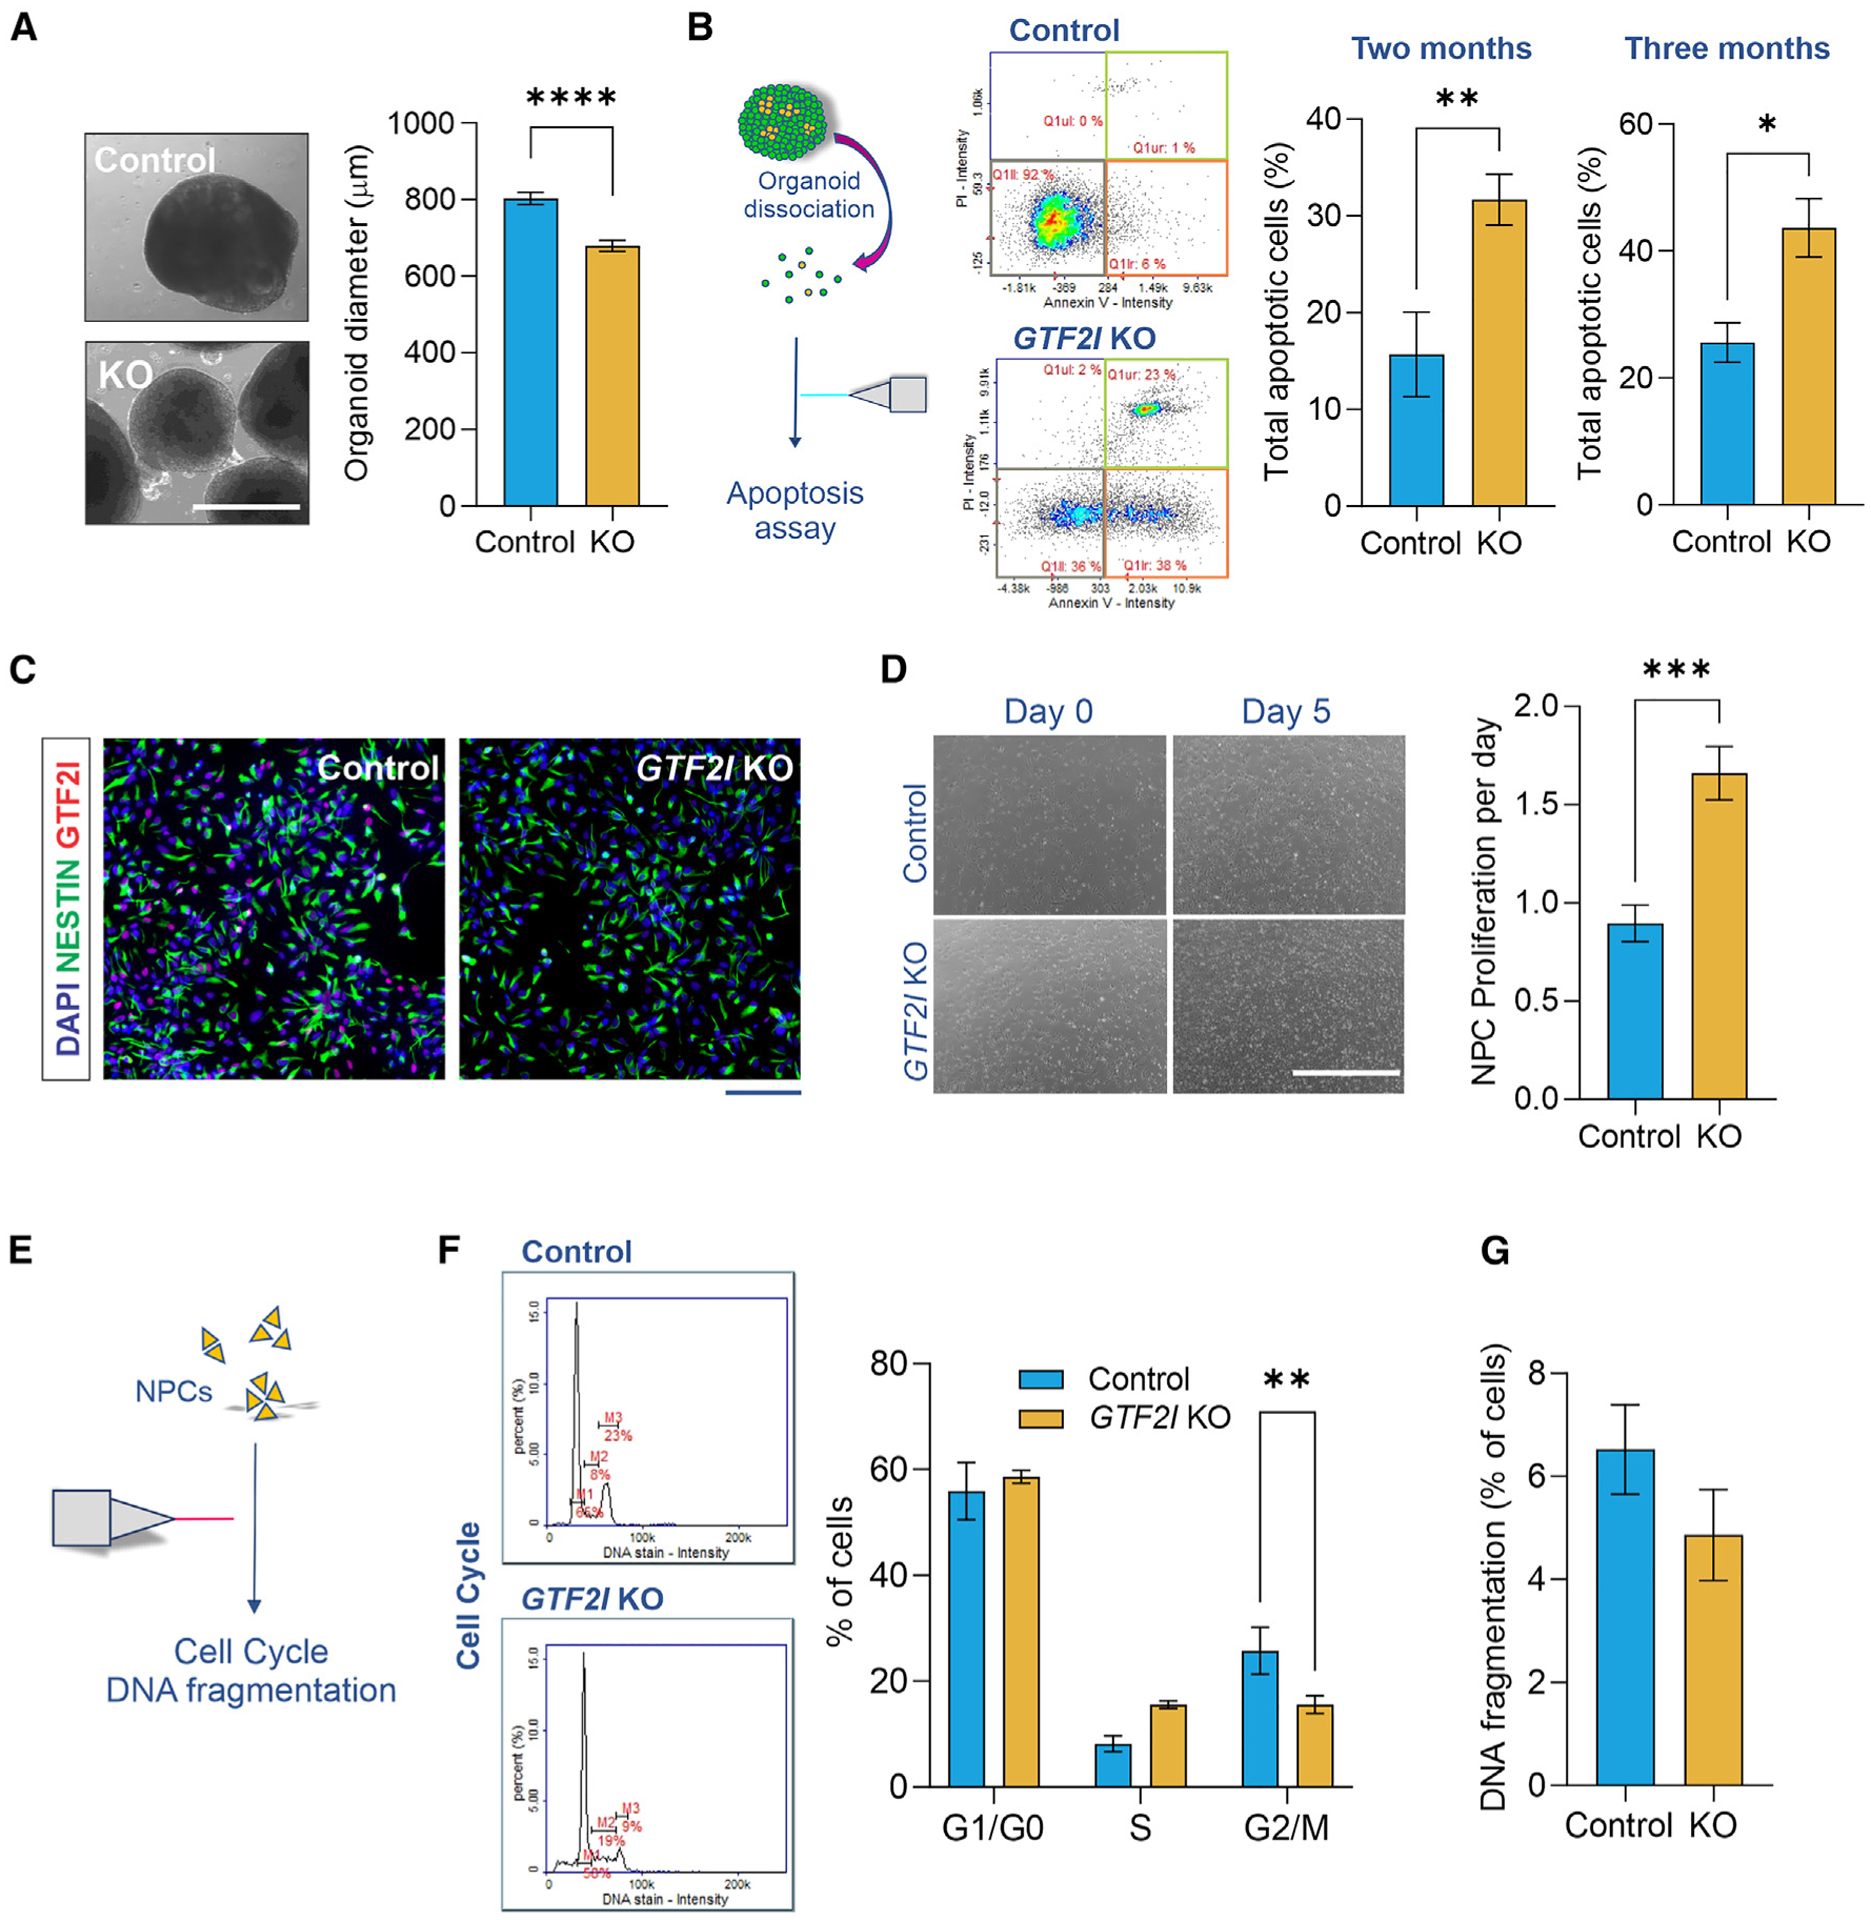
(A) Reduced diameter of GTF2I-KO cortical organoids compared to controls (Student’s t test, t96 = 5.73, p < 0.0001; n = 43 control and 55 GTF2I-KO organoids); scale bar, 1,000 μm.
(B) Left, organoid dissociation into single-cell suspension to analyze apoptotic cell frequency. Right, compared to controls, GTF2I-KO organoids have a higher frequency of apoptotic cells at 2 months (Student’s t test, t17 = 3.35, p = 0.004; n = 7 replicates of ~5–10 control organoids and 12 replicates of ~5–10 GTF2I-KO organoids) and 3 months (Student’s t test, t12 = 2.71, p = 0.019; n = 5 replicates of ~5–10 control organoids and 9 replicates of ~5–10 GTF2I-KO organoids) of age. See also Figure S4B.
(C) Immunostaining portrays Nestin+ NPCs; scale bar, 100 mm. See also Figure S4C.
(D) GTF2I-KO NPCs exhibited a higher proliferation rate per day (Student’s t test, t14 = 4.37, p = 0.001; n = 7 wells of control NPCs and 9 wells of GTF2I-KO NPCs); scale bar, 1,000 μm. See also Figure S4D.
(E) NPCs evaluated with cell-cycle and DNA fragmentation assays.
(F) GTF2I-KO NPCs show an altered cell-cycle profile compared to controls (2-way ANOVA, F2,54 = 7.829, p = 0.001; n = 6 10-cm plates of control NPCs and 14 10-cm plates of GTF2I-KO NPCs).
(G) GTF2I-KO and control NPCs showed a similar frequency of cells with fragmented DNA (Student’s t test, t11 = 1.26, p = 0.23; n = 5 10-cm plates of control NPCs and 8 10-cm plates of GTF2I-KO NPCs). Data are presented as mean ± SEM.
Previous work in other experimental systems has documented the involvement of GTF2I in proliferation and cell-cycle regulation,23,39,40 suggesting that it may likewise affect these processes during neurodevelopment. To study these properties in neural cells, control and GTF2I-KO hiPSCs were differentiated into NPCs (Figures 2C and S4C). To compare their proliferative propensities, NPCs were plated in a 6-well plate and allowed to proliferate for a set number of days, after which total cells per well were collected. Although control and GTF2I-KO organoids exhibited similar proportions of Ki67+ proliferative cells, quantification revealed a higher rate of proliferation per day of GTF2I-KO NPCs compared to controls (p = 0.001; Figures 2D and S4D). In pursuit of an explanation for the increased proliferation rate, the cell-cycle profiles and frequencies of cells with DNA fragmentation were compared between control and GTF2I-KO NPCs (Figure 2E). GTF2I-KO and control NPCs showed distinct cell-cycle profiles (p = 0.001; Figure 2F), but rates of DNA fragmentation were similar between genotypes (p = 0.23; Figure 2G), suggesting impairment from GTF2I-KO in NPCs is concentrated in cell-cycle dysregulation and altered proliferation rather than cell death.
GTF2I-KO is associated with decreased synaptic proteins and reduced electrophysiological activity
Neural progenitor cells were subsequently differentiated into neurons that immunostained positive for the neuronal markers β-tubulin (Tuj1), synapsin, and MAP2 (Figures 3A and S4E). To corroborate our observation of increased apoptosis in GTF2I-KO organoids, we first compared the frequencies of apoptosis in control and GTF2I-KO neurons. In contrast to our results in NPCs but in agreement with our findings in 2- and 3-month-old organoids, 8-week GTF2I-KO neurons exhibited a higher frequency of apoptotic cells compared to controls (p = 0.016; Figure 3B).
Figure 3. Loss of GTF2I is associated with synaptic dysfunction and decreased electrical activity in human neurons and cortical organoids.
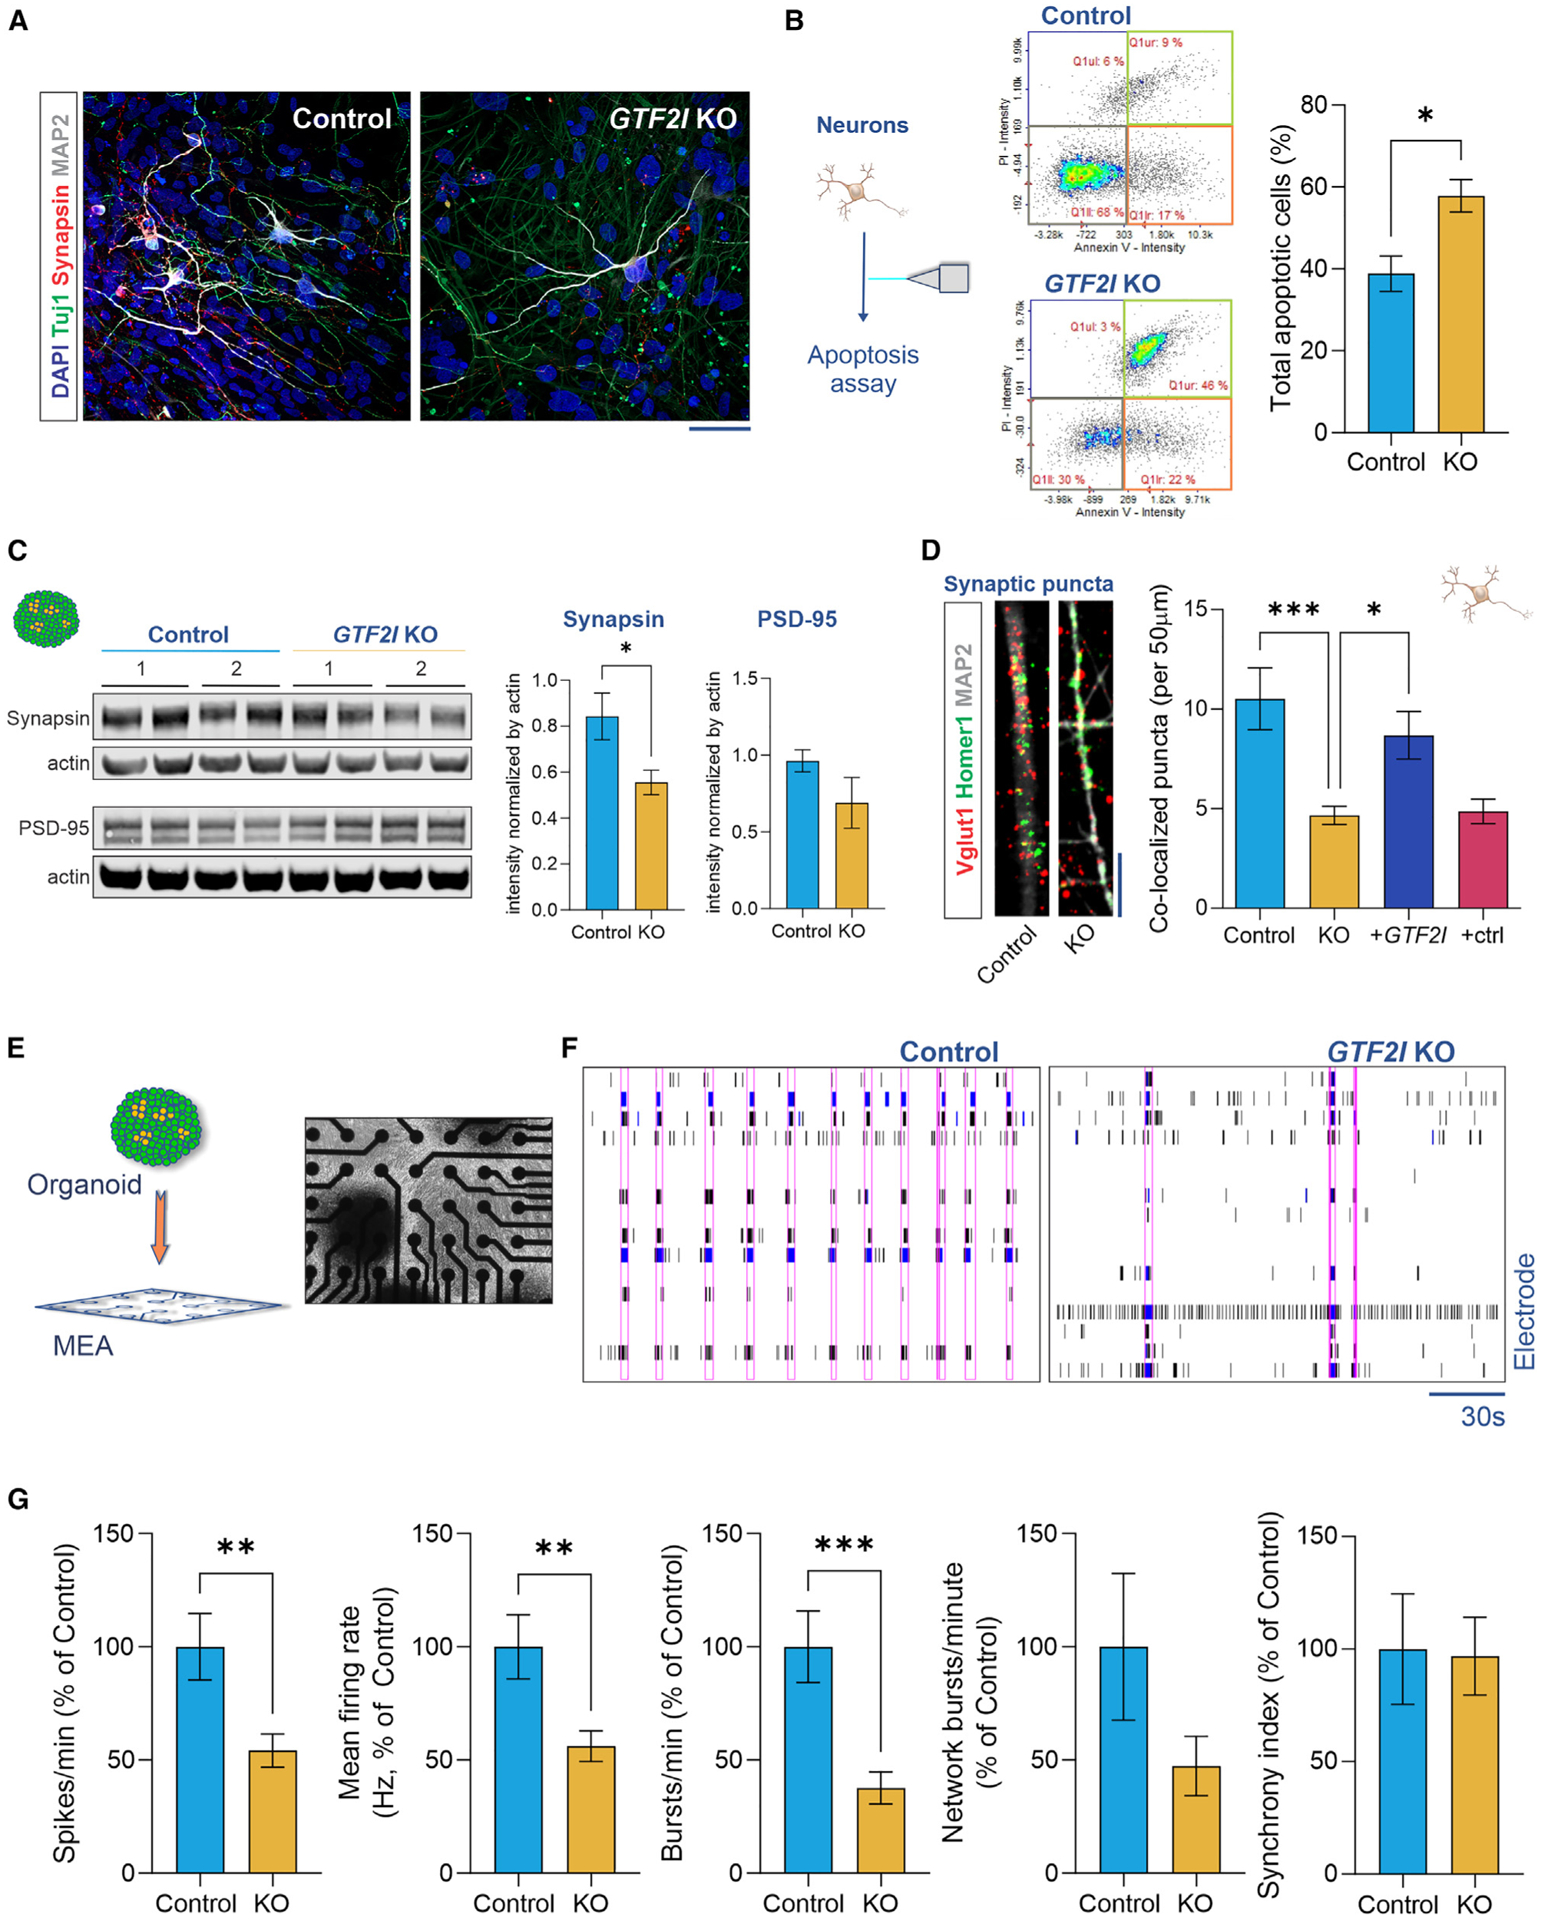
(A) Representative images of neurons differentiated from NPCs immunostained positive for the mature neuronal markers b-tubulin (Tuj1), synapsin, and MAP2; scale bar, 100 μm. See also Figure S4E.
(B) Compared to controls, GTF2I-KO neurons exhibited a higher frequency of apoptotic cells (Student’s t test, t7 = 3.16, p = 0.016; n = 5 10-cm plates of CVB control neurons and n = 4 10-cm plates of CVB GTF2I-KO neurons).
(C) Representative western blots (left) and quantification (right) of the presynaptic protein synapsin (Mann-Whitney U test, p = 0.026; n = 6 control samples and n = 6 GTF2I-KO samples from CVB and WT83 hiPSC lines) and the postsynaptic protein PSD-95 (Mann-Whitney U test, p = 0.69; n = 4 control samples and n = 4 GTF2I-KO samples from CVB and WT83 hiPSC lines); samples are independent protein extractions of ~10 organoids, with intensity normalized by actin and averaged from duplicate lanes.
(D) Co-localized synaptic puncta density was reduced in GTF2I-KO neurons and reversible by GTF2I re-expression (1-way ANOVA, F3,90 = 7.703, p = 0.0001, with Dunnett’s multiple comparison’s test; control vs. KO: p = 0.0001, KO vs. +GTF2I: p = 0.026, KO vs. +ctrl: p = 0.99; n = 16–33 neurons from CVB and WT83 hiPSC lines); scale bar, 10 μm. See also Figure S4F.
(E) Representation and top-down image of organoid plated for MEA electrophysiology.
(F) Representative MEA raster plots for control and GTF2I-KO organoids. Pink rectangles generated by Axion NeuralMetric software denote network bursts.
(G) Compared to controls, GTF2I-KO organoids show fewer spikes per minute (Student’s t test, Welch corrected, t71.5 = 2.80, p = 0.007; n = 50 control and n = 44 GTF2I-KO MEA-plate wells), a decreased firing rate (Student’s t test, Welch corrected, t56.9 = 2.80, p = 0.007; n = 41 control and n = 37 GTF2I-KO MEA-plate wells), and fewer bursts per minute (Student’s t test, Welch corrected, t49.7 = 3.61, p = 0.001; n = 37 control and n = 33 GTF2I-KO MEA-plate wells), with less difference in the network burst rate (Student’s t test, Welch corrected, t15.3 = 1.51, p = 0.15; n = 13 control and n = 6 GTF2I-KO MEA-plate wells) or the synchrony index (Student’s t test, t63 = 0.11, p = 0.92; n = 31 control and n = 34 GTF2I-KO MEA-plate wells); samples include organoids from CVB and WT83 hiPSC lines, pooled from multiple experiments. Data are presented as mean ± SEM.
Considering the increased cell death in GTF2I-KO neurons and organoids and the results of our RNA sequencing analyses showing the downregulated expression of synaptic pathways in GTF2I-KO cortical organoids, we sought to further evaluate how the loss of GTF2I influences synaptic phenotypes. Given the robust neurocircuitry expected in cortical organoids35 and the decrease in synaptic gene expression we observed in GTF2I-KO organoids, we used organoids as the initial model to investigate synaptic proteins. Western blot analyses showed a decrease in the presynaptic protein synapsin (p = 0.026), although not of the postsynaptic protein PSD-95 (p = 0.69), in 2-month-old GTF2I-KO cortical organoids compared to controls (Figure 3C). Having identified decreased protein quantity, monolayer neurons were subsequently used as a more tractable model to assess synaptic structural integrity. Immunostaining of presynaptic VGlut1 and postsynaptic Homer1 showed a reduction of co-localized synaptic puncta in GTF2I-KO 8-week neurons compared to controls (p = 0.0001; Figure 3D); concordant with the pattern of decreased synaptic proteins in organoids, the decrease was more pronounced for presynaptic VGlut1 (p = 0.04) than for postsynaptic Homer1 (p = 0.48; Figure S4F). To determine whether synaptic puncta co-localization could be rescued by the reintroduction of GTF2I, GTF2I-KO NPCs were transfected with either a GTF2I-expressing plasmid or a control plasmid (see STAR Methods), differentiated into neurons, and synaptic puncta quantified. GTF2I-KO neurons re-expressing GTF2I showed increased co-localized synaptic puncta compared to GTF2I-KO neurons (p = 0.026; Figure 3D).
Given the structural synaptic defects identified in GTF2I-KO neurons and organoids and proposed neurophysiological alteration in WS models,32,41 we sought to interrogate the functional connectivity of GTF2I-KO neuronal circuitry by plating organoids for evaluation on multielectrode array (MEA) electrophysiology (Figures 3E and 3F). Compared to controls, GTF2I-KO organoids exhibited fewer spikes per minute (p = 0.007), a decreased mean firing rate (p = 0.007), and fewer bursts per minute (p = 0.001). However, the difference in the synchronous network burst rate between control and GTF2I-KO organoids did not reach statistical significance (p = 0.15), and no statistical difference in the synchrony index was detected (p = 0.92; Figure 3G).
DISCUSSION
GTF2I is included among the 26–28 genes at the Williams-Beuren chromosomal locus at 7q11.23.2,11,12 Mutations of GTF2I are associated with variation in the phenotypic expression of human sociality and may explain some of the social variation observed in individuals with WS.9,10,42 Although our group previously used patient-derived hiPSCs differentiated into neural cell types to investigate WS,32 little is understood about the specific effects of GTF2I on human neurodevelopment. Hence, rather than investigating WS, the present study was undertaken to isolate and identify the contribution of GTF2I to human neurodevelopment. To that end, we used two pairs of isogenic GTF2I-KO hiPSC lines differentiated into an array of neural cell platforms, including NPCs, neurons, and cortical organoids. Transcriptomic analyses showed that compared to control cortical organoids, GTF2I-KO cortical organoids had decreased expression of pathways relevant to synaptic signaling, particularly glutamatergic transmission, and increased expression of apoptotic pathways. In concordance, GTF2I-KO organoids and neurons exhibited higher frequencies of apoptotic cells and synaptic impairment, the functional consequences of which were further reflected by the decreased electrophysiological activity of GTF2I-KO organoids on MEA. Compared to control NPCs, GTF2I-KO NPCs portrayed an altered cell-cycle profile and an increased proliferation rate. Together, these results suggest a summary model of the function of GTF2I during neurodevelopment in which GTF2I helps regulate the growth and proliferation of neural progenitors, but subsequently, at the mature neuronal stage, becomes critical for neuronal health and the maintenance of neuronal function (Figure 4).
Figure 4. Summary of human cellular neurodevelopmental changes resulting from the loss of GTF2I.
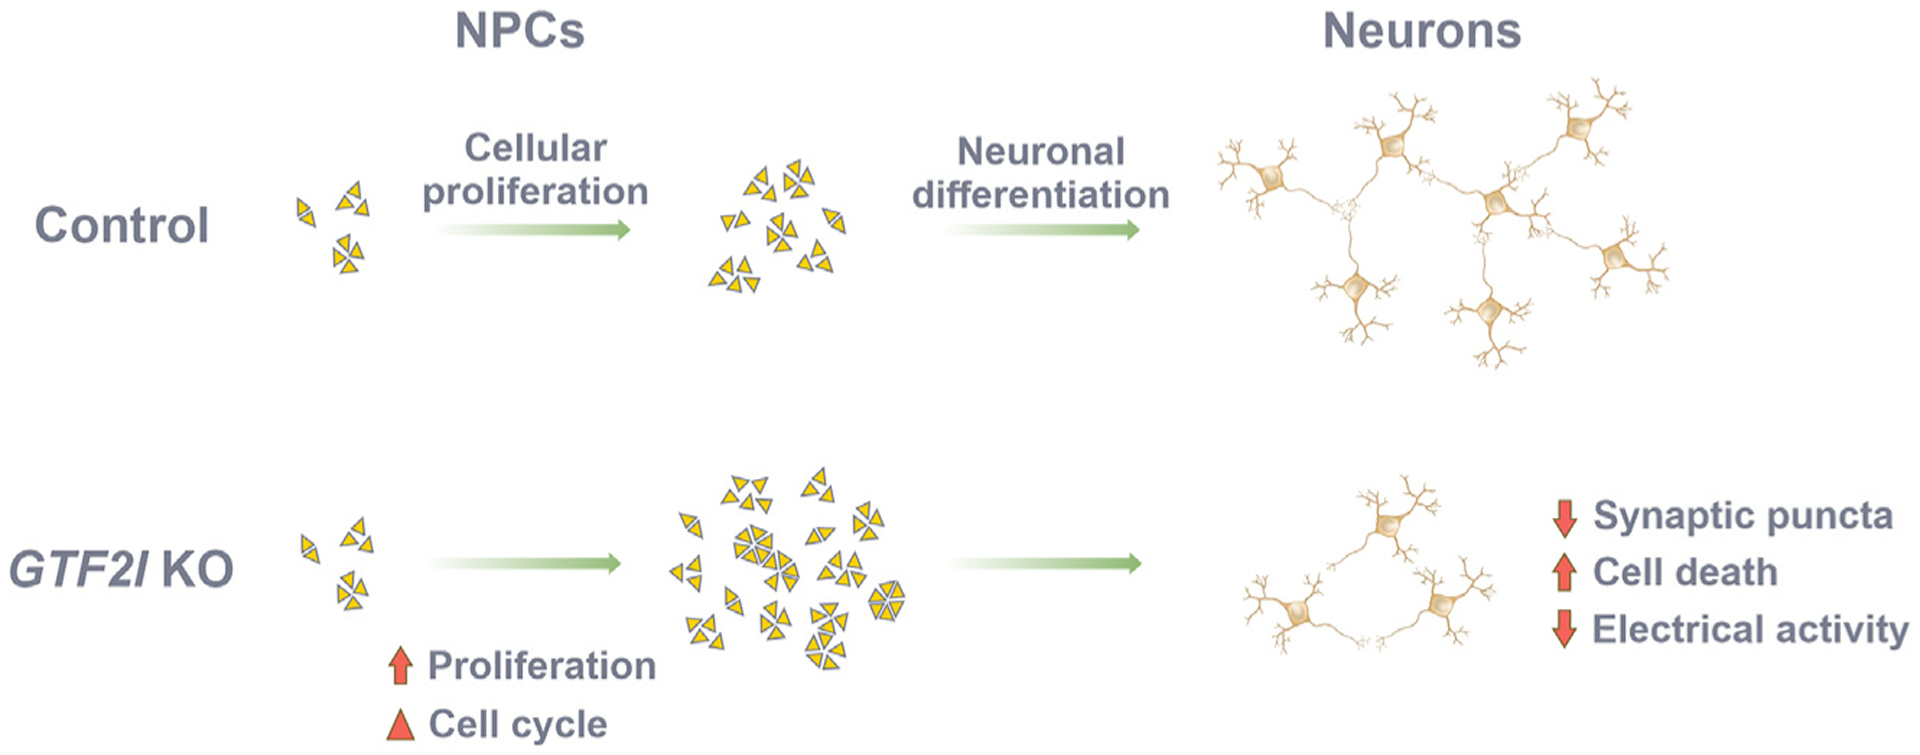
Loss of GTF2I results in cell-cycle alterations and increased proliferation of NPCs compared to controls. GTF2I-KO NPCs differentiate into neural networks that have less synaptic structural integrity, decreased electrical activity, and increased cell death.
Cortical organoids offer an invaluable platform to study neurodevelopmental disease31,43,44 and may offer insight into molecular mechanisms that contribute to aberrant phenotypic expression in individuals with WS, such as hypersociality.9 We found transcriptomic dysregulation in GTF2I-KO cortical organoids compared to controls, including decreased expression of genes involved in synaptic structure and function, particularly glutamatergic function, and enriched expression of genes in pathways involved in cell death. This observation was matched by further findings showing decreased organoid size and, via subsequent assays, increased apoptosis, decreased synaptic proteins, and decreased electrophysiological function. Notably, although we observed decreased synaptic gene expression and decreased synaptic proteins in GTF2I-KO cortical organoids, decreased synaptic structural integrity in GTF2I-KO neurons, and decreased electrophysiological activity in GTF2I-KO cortical organoids, the mechanisms by which synapses are lost and electrophysiological activity is reduced remain unclear. One explanation may be that synaptic reduction is principally a consequence of increased cell death. Support for this proposition is offered by the observation of similar synchrony of electrical activity in GTF2I-KO organoids despite the reduction in activity. Indeed, the lack of difference in synchrony between control and GTF21-KO organoids argues against a hypothesis that decreased electrophysiological activity is due to an intrinsic synaptic defect but rather suggests instead an extrasynaptic process, the end result of which is detected as reduced electrophysiological activity. Another explanation may be that GTF2I, a highly multifunctional protein,20 contributes to synaptic maintenance via a mechanism independent from its role supporting neuronal health. This proposition is conferred some support both by the intriguing observations herein that the presynaptic compartment in GTF2I-KO neurons and organoids appears to be slightly more affected than the postsynaptic compartment and by the observation that mice with GTF2I deleted in glutamatergic neurons—a prominent overlap with the present study—exhibit defects in neuronal conduction that are distinct from any effects on cell survival.29 Neither of these explanations necessarily excludes the other, of course, but it is apparent that further efforts to precisely define the electrophysiological changes that emerge secondary to the loss of GTF2I will be a valuable direction for future research. In particular, patch-clamp experiments will be required to precisely define whether or how the electrochemical synapse itself is affected by the loss of GTF2I.
Notably, our findings herein of synaptic reduction in GTF2I-KO organoids and neurons contrast with our group’s previous observations of synaptic hyperactivity in neurons generated from individuals with WS.32 Direct comparison of the results of these studies may be improper, however, given that the hiPSC lines used here are isogenic, whereas those used in the previous study were derived from individuals with WS and hence hemizygously deficient in the whole complement of WS genes. Nevertheless, although the present study sought to identify the neurodevelopmental effects of GTF2I in isolation and these findings will inform future studies that focus on GTF2I in the broader context of neurodevelopmental disease, seeking to understand the effects of altering GTF2I along with combinations of neighboring genes—as occurs in individuals with WS and 7dup—will certainly be a valuable endeavor for future research.
Although preliminary analysis indicated that 2-month-old GTF2I-KO organoids have similar proportions of proliferative cells, the proliferation rate of GTF2I-KO NPCs was notably increased. This discrepancy in findings is likely a floor effect in consequence of the fact that the organoids attained an age at which mature neurons are the predominant cell type (Figure S3A), lessening the ability to detect variation in proportions of progenitors. Interestingly, in contrast to the increased frequency of apoptotic cells in GTF2I-KO organoids and neurons, GTF2I-KO NPCs demonstrated an equivalent frequency of DNA fragmentation—the sub-G1 proportion of the cell population—to that observed for controls. One explanation for this difference may be that the cellular functions of GTF2I in neural progenitors and in mature neurons are distinct,23 or that changes in less differentiated cell types (e.g., hiPSCs, NPCs) “gate” or “prime”phenotypic changes upon further differentiation.33 Although the findings of increased NPC proliferation and unchanged or decreased cell death are expected,45 it has likewise previously been demonstrated that increased proliferation of human NPCs increases stress and promotes genomic instability.46 Replication stress-affected progenitors with GTF2I haploinsufficiency that are differentiated into neurons with GTF2I dysfunction may be incapable of coping with the DNA damage,23,40 a plausibility that should be investigated further in future studies. Separately, although the present study did not formally investigate changes in hiPSCs, a previous study documented GTF2I dosage-related transcriptomic dysregulation in hiPSCs in disease-relevant domains that were channeled and amplified upon differentiation to NPCs,33 supporting the suggestion that changes in less differentiated cells can affect cell functions as they undergo further differentiation.
Limitations of the study
Our study has several intrinsic limitations. The differentiation protocols used here principally guide cells toward an excitatory forebrain neuronal fate,35,47 limiting the diversity of cell types and cellular interactions under investigation in the present study. Previous studies in animal models have argued that the loss of GTF2I may indirectly affect GABAergic cells48,49 and neuronal interactions with oligodendrocytes,29 suggesting that including a wider array of human neural cell types will be an important objective for future studies. Nevertheless, we have sought to minimize this limitation by including several human cell models of neurodevelopment, the convergent results of which increase our confidence in our phenotypic findings. Moreover, our analysis of single-cell transcriptomic data from cortical organoids affirmed the pronounced expression of GTF2I in glutamatergic neurons, indicating the central importance of GTF2I to their healthy function and underscoring the value of the models used in the present study for elucidating the consequences of loss of GTF2I. In addition to restricted cellular diversity, our cellular models capture a narrow window of early neurodevelopment35–38 that may inadequately portray the full involvement of GTF2I across the spectrum of human neurodevelopment. However, our concern regarding how severely this shortcoming limits our findings is lessened by the observation that GTF2I expression in the brain is concentrated during the prenatal period of neurodevelopment (Figure S4G),50,51 supporting a prediction that the effects of its absence would be most pronounced during this period. An additional limitation of the present study is that both hiPSC lines were generated from biologically male individuals, a shortcoming that may hinder broader generalizability of our findings.
Conclusions
In summary, compared to control organoids, GTF2I-KO cortical organoids showed decreased synaptic gene expression and decreased synaptic proteins, reduced electrophysiological activity, and increased cell death. GTF2I-KO neurons likewise exhibited decreased synaptic integrity and increased apoptosis, differentiated from GTF2I-KO neural progenitors that have a higher rate of proliferation and altered cell cycle. Overall, our findings suggest that the loss of GTF2I induces alterations in neural progenitors that give rise to neurons and networks characterized by impaired neuronal health and synaptic reduction.
STAR★METHODS
RESOURCE AVAILABILITY
Lead contact
Further information and requests for resources and reagents should be directed to and will be fulfilled by the lead contact, Alysson Muotri (muotri@ucsd.edu).
Materials availability
Materials newly generated for this paper, including engineered cell lines, are available under appropriate agreement (MTA). Inquiries should be directed to the lead contact, Alysson Muotri (muotri@ucsd.edu).
Data and code availability
Bulk RNA-sequencing data generated for this study are publicly available; files were deposited at Gene Expression Omnibus GSE252761.
This paper does not report original code.
Any additional information required to reanalyze the data reported in this work paper is available from the lead contact upon request.
EXPERIMENTAL MODEL AND STUDY PARTICIPANT DETAILS
Cell lines
Two human iPSC lines derived from individuals with XY sex chromosomes were included in the present study. These iPSC lines were previously generated, prior to formulation of the present study. Informed consent was obtained from all human subjects, and experiments conformed to the principles set forth in the WMA Declaration of Helsinki and the Department of Health and Human Services Belmont Report. The study was approved by the UCSD IRB/ESCRO committee (protocol 141223ZF). hiPSC colonies were maintained on 6-cm dishes coated with Matrigel (BD-Biosciences, San Jose, CA, USA) and fed daily with mTeSR1 (StemCell Technologies, Vancouver, Canada); only mycoplasma-negative cell cultures were used.
METHOD DETAILS
hiPS cell lines and cell culture
Control CVB and WT83 hiPS cell lines were used in the study.35,52,53 CRISPR-Cas9 editing was performed34 with guide RNAs delivered using a U6-guide-scaffold cassette to introduce frameshift mutations and knockout GTF2I function (Figures S1B–S1E). hiPSC colonies were maintained on 6-cm dishes coated with Matrigel (BD-Biosciences, San Jose, CA, USA) and fed daily with mTeSR1 (StemCell Technologies, Vancouver, Canada)32; only mycoplasma-negative cell cultures were used.
Generation of cortical organoids
To generate cortical organoids,35 hiPSCs were cultured for approximately six days and then dissociated with 1:1 Accutase (Life Technologies):PBS, and cells were subsequently plated into a 6-well plate (4×10⁶ cells/well) in mTeSR1 supplemented with 10 μM SB431542 (SB; Stemgent, Cambridge, MA, USA), 1 μM Dorsomorphin (Dorso; R&D Systems, Minneapolis, MN, USA), and 5 μM Y-27632 (EMD-Millipore, Burlington, MA, USA) and subsequently cultured in shaker suspension (95 rpm at 37°C). Emergent spheres were fed mTeSR1 (supplemented with 10 μM SB and 1 μM Dorso) for three days, after which medium was changed to Media1 [Neurobasal (Life Technologies), 1x Glutamax (Life Technologies), 2% Gem21-NeuroPlex (Gem21; Gemini Bio-Products, Sacramento, CA, USA), 1% N2-NeuroPlex (N2; Gemini Bio-Products), 1% non-essential amino acids (NEAA; Life Technologies), 1% penicillin/streptomycin (P/S; Life Technologies), 10 μM SB, and 1 μM Dorso] for six days, every other day; then Media2 (Neurobasal, 1x Glutamax, 2% Gem21, 1% NEAA, and 1% P/S) supplemented with 20 ng/mL FGF-2 (Life Technologies) for seven days, daily; followed by Media2 supplemented with 20 ng/mL each of FGF-2 and EGF (PeproTech, Rocky Hill, NJ, USA) for six days, every other day; and then Media2 with 10 ng/mL each of BDNF, GDNF, and NT-3 (all PeproTech), 200 μM L-ascorbic acid (Sigma-Aldrich, St. Louis, MO, USA), and 1 mM dibutyryl-cAMP (Sigma-Aldrich) for six days, every other day. Cortical organoids were subsequently maintained indefinitely in Media2 without supplementation.
Progenitor and neuronal differentiation of hiPSCs
Colonies of hiPSCs cultured for approximately six days were dissociated in 1:1 Accutase (Life Technologies):PBS, and ~4×10⁶ hiPSCs were plated per well of a 6-well plate in suspension in 3 mL mTeSR1 supplemented with 5 μM Y-27632 (EMD-Millipore) and cultured in shaker suspension (95 rpm at 37°C) to form embryoid bodies (EBs). Medium was replaced the following day with Neural Induction Medium (NIM; StemCell Technologies) and fed with NIM daily or every other day. After seven days, EBs were plated on Matrigel-coated 6-cm plates and fed with NIM for another week. Emergent rosettes were picked manually with a P1000 tip and transferred to a new Matrigel-coated 6-cm dish. After 2–3 days, rosettes with neurite outgrowth were manually picked again, transferred to a 15 mL conical tube, and dissociated by incubating them in 1–2 mL Accutase (Life Technologies) at 37°C for ~5–10 min followed by manual dissociation with a P1000 pipette to single-cell suspension. Cells (NPCs) were centrifuged for 4 min at 1.1 rpm, resuspended in NGF medium [DMEM/F12 (Life Technologies), 1x N2 (Gemini), 1x Gem21 (Gemini), 1% P/S (Life Technologies), and supplemented with 20 ng/mL FGF-2], and seeded on poly-L-ornithine/laminin plates. NPCs were expanded and maintained in NGF medium with feeding on alternate days. Neuronal differentiation was induced by withdrawing FGF-2 supplementation.
Western blotting
To perform Western blotting,43 total protein was extracted and quantified (Pierce BCA Protein Assay Kit, ThermoScientific) after cell lysis in RIPA buffer (ThermoScientific) with cOmplete ULTRA mini protease inhibitor (Roche, Mannheim, Germany) and PhosSTOP phosphatase inhibitor (Roche). Total protein (20 μg) was separated on a Bolt 4–12% Bis-Tris Plus Gel (Life Technologies) and subsequently transferred to a nitrocellulose membrane using an iBlot2 dry blotting system (ThermoScientific). Membranes were blocked at room temperature for 1–4 h (Rockland Immunochemicals, VWR International, Arlington Heights, IL, USA); primary antibodies (rabbit anti-Synapsin1, EMD-Millipore AB1543P, 1:1500; mouse anti-PSD-95, Neuromab, 1:1500; rabbit anti-GTF2I, Abcam (Cambridge, UK) ab129025, 1:250; mouse anti-β-actin, Abcam ab8226, 1:10,000) in blocking buffer incubated, shaking, overnight at 4°C. Membranes underwent three 5-min washes with PBS +0.1% Tween 20, followed by the application of secondary antibodies (IRDye 680RD and IRDye 800CW, 1:5000 in blocking buffer) incubated at room temperature, shaking and protected from light, for 1 h. Membranes underwent three more washes, after which an Odyssey CLx infrared imaging system (LiCOR Biosciences, Lincoln, NE, USA) was used to detect proteins; signal intensity was normalized relative to intensity quantification of β-actin.
Immunofluorescence staining of monolayer cells and cortical organoids
To perform immunofluorescence,32,35,43 cells were fixed in 4% paraformaldehyde, washed three times with PBS (5 min each), and then permeabilized and blocked (0.1% Triton X-100 and 3% BSA in PBS). Cortical organoids were fixed overnight in 4% paraformaldehyde and subsequently transferred to, and sunken in, 30% sucrose, embedded in O.C.T. (Sakura, Tokyo, Japan), and sectioned at 20 μm on a cryostat. Slides with organoid sections were air-dried and then permeabilized and blocked (0.1% Triton X-100 and 3% BSA in PBS). Primary antibodies (goat anti-Nanog, Abcam ab77095, 1:500; rabbit anti-Oct4, Abcam ab19857, 1:500; mouse anti-Nestin, Abcam ab22035, 1:200 (organoid: 1:250); rat anti-CTIP2, Abcam ab18465, 1:250 (organoid: 1:500); chicken anti-MAP2, Abcam ab5392, 1:1000 (organoid: 1:2000); rabbit anti-Synapsin1, EMD-Millipore AB1543P, 1:500; mouse anti-Vglut1, Synaptic Systems (Goettingen, Germany) 135311, 1:500; rabbit anti-Homer1, Synaptic Systems 160003, 1:500; mouse anti-NeuN, EMD-Millipore MAB377, 1:500; rabbit anti-Ki67, Abcam ab15580, 1:1000; rabbit anti-SOX2, Cell Signaling Technology (Danvers, MA, USA) 2748, 1:500) in blocking buffer incubated overnight at 4°C. Slides were washed three times with PBS (5 min each) and then incubated with secondary antibodies (Alexa Fluor 488, 555, and 647, Life Technologies, 1:1000 in blocking buffer). Nuclei were stained with DAPI for 10 min (1:10,000 in PBS). Slides were mounted with ProLong Gold anti-fade mountant (Life Technologies) and imaged and analyzed with a Z1 Axio Observer Apotome fluorescence microscope (Zeiss, Oberkochen, Germany). Specific cell types in cortical organoids were either quantified manually or using ImageJ; DAPI was quantified using ImageJ.
RNA sequencing analyses
RNA was isolated via an RNeasy Mini kit (Qiagen) for library preparation (Illumina TruSeq RNA Sample Preparation Kit; San Diego, CA, USA) and sequencing (Illumina HiSeq2000, 50bp paired-end reads, 50 million high-quality sequencing fragments per sample, on average). Data was analyzed by ROSALIND (https://rosalind.onramp.bio/), with a HyperScale architecture developed by ROSALIND, Inc. (San Diego, CA). Reads were trimmed using cutadapt.54 Quality scores were assessed using FastQC.55 Reads were aligned to the Homo sapiens genome build hg19 using STAR.56 Individual sample reads were quantified using HTseq57 and normalized via Relative Log Expression using DESeq2 R library.58 Read Distribution percentages, violin plots, identity heatmaps, and sample MDS plots were generated as part of the QC step using RSeQC.59 DEseq2 was also used to calculate fold changes and p values and perform optional covariate correction. Clustering of genes for the final heatmap of differentially expressed genes was done using the PAM (Partitioning Around Medoids) method using the fpc R library.60 Hypergeometric distribution was used to analyze the enrichment of pathways, gene ontology, domain structure, and other ontologies. Enrichment was calculated relative to a set of background genes relevant for the experiment. Gene ontology analysis was performed using WebGestalt.61,62
Single-cell RNA sequencing analysis
Single-cell reads from organoids in four time points (1, 3, 6, 10 months) were reanalyzed using the same protocol described in the original paper by Trujillo and collaborators.35 The raw reads were preprocessed with Cell Ranger software (version 2.1.1, 10x Genomics, Pleasanton, CA), aligned to hg38 human reference genome. For eachtimepoint, genes not detected by at least five cells and cells with less than 200 genes detected were discarded using Seurat package. The subsequent filtered matrix was log-normalizedand scaled to 10,000 transcripts per cell. For the merge of the four datasets the Merge Seurat function was used to generate a single matrix to be used as an input to Seurat v3 anchoring procedure. Default parameters were selected for the FindIntegrationAnchors and Integrate Data functions. Subsequent graph analysis was performed to identify the same clusters as the main paper, and seven main clusters based on the expression of marker genes. Dot plots and UMAP for the expression of GTF2I were performed using ggplot2 package.
Cell cycle assay
To perform cell cycle assays,63–65 NPCs were dissociated and quantified using a Via1-Cassette with the NucleoCounter NC-3000 (Chemometec, Allerod, Denmark). Dissociated cells were fixed on ice or at 4°C with 70% ethanol for at least 2 h. Cells were subsequently resuspended in a solution of 0.5 μg/mL DAPI and 0.1% Triton X-100 in PBS and incubated at 37°C for 5 min. Cells were then distributed onto an NC-Slide A2 chamber (Chemometec), and fluorescence was quantified with the NucleoCounter NC-3000 according to the manufacturer’s protocol.
Annexin V assay
Annexin V assay was performed64,65 by first dissociating cortical organoids and monolayer neurons, which were subsequently resuspended in Annexin V binding buffer (Invitrogen) with Annexin V-CF488A conjugate (Biotium, Inc., Hayward, CA, USA) and Hoechst 33342 (Chemometec) and incubated for 15 min at 37°C. After a PBS wash, the cells were resuspended in Annexin V binding buffer (Invitrogen) supplemented by 10 μg/mL propidium iodide (Chemometec). Cells were loaded into NC-Slide A2 chambers and assessed with a Chemometec NucleoCounter NC-3000 cytometer using the preoptimized Annexin V assay.
DNA fragmentation assay
To perform the DNA fragmentation assay,64 single-cell NPCs were collected and suspended in PBS and fixed with 70% ethanol for 24 h at 4°C. Cells subsequently were washed with PBS, resuspended in DAPI staining solution (0.1% (v/v) Triton X-100, 1 μg/mL DAPI in PBS), and incubated for 5 min at 37°C. Samples were analyzed with a Chemometec NC-3000 cytometer using the preoptimized DNA Fragmentation Assay.
Synaptic puncta quantification
Co-localized VGlut1 (presynaptic) and Homer1 (postsynaptic) immunostained puncta along MAP2-positive processes were quantified via immunofluorescence staining.32,43,47 Primary antibodies incubated overnight at 4°C, secondary antibodies incubated at room temperature for 1 h, and coverslips were mounted; see above for complete immunofluorescence methodology. GTF2I rescue experiments were performed by transfecting 3×10⁶ NPCs with a Nucleofector 2b (Lonza Bioscience, Morristown, NJ, USA) with 1 μg of the commercially obtained plasmid eGFP-CAG>hGTF2I (VectorBuilder, Chicago, IL, USA) or a GFP-expressing control plasmid (Lonza Bioscience) according to the Neural Stem Cell Nucleofection kit protocol using the preoptimized A-033 program. Cells were resuspended in NGF medium (see above) and subsequently seeded and allowed to undergo neuronal differentiation on poly-L-ornithine/laminin-coated chamber slides (ThermoFisher). The slides were imaged using a Z1 Axio Observer Apotome fluorescence microscope (Zeiss), and a blinded investigator manually quantified co-localized synaptic puncta along 50 μm segments of randomly selected MAP2-positive processes.
Multi-electrode array (MEA) recording
To obtain MEA recordings,35,43,64,66 six-week-old cortical organoids were plated in 6-, 12-, or 48-well (each well with an 8×8 grid of electrodes) MEA plates (Axion Biosystems, Atlanta, GA, USA) pre-coated with 100 μg/mL poly-L-ornithine and 10 μg/mL laminin. Cellular cultures were fed twice per week with Medium 2 (see above) and, 7–14 days after plating, were incrementally switched to BrainPhys medium (StemCell Technologies67) supplemented with 10 ng/mL of BDNF (PeproTech) and 200 μM L-ascorbic acid (Sigma-Aldrich). Recordings were conducted in a Maestro MEA system with AxIS Software Spontaneous Neural Configuration (Axion Biosystems). Using Axion Biosystems’ Neural Metrics Tool, active electrodes required at least five spikes/min. Bursts/electrode used an inter-spike interval (ISI) threshold requiring minimally five spikes with a maximum ISI of 100 ms. Network bursts required at least 10 spikes under the same ISI with >25% active electrodes in the well. The synchrony index utilized a cross-correlogram window of 20 ms.
QUANTIFICATION AND STATISTICAL ANALYSIS
Statistical analyses were performed using GraphPad Prism v9 (GraphPad Software, La Jolla, CA). Sample sizes were determined based on previous publications from this lab and others. Experiment-specific information for samples and cell lines is detailed in the figure legends. Samples were allocated and evaluated according to genotype; no randomization was applied. Analyses of synaptic puncta were performed by blinded investigators. Data exclusion in MEA datasets (outliers) was carried out automatically using pre-established criteria as described above. Outliers in other experiments were determined using GraphPad criteria and excluded. Results for continuous variables were expressed as mean ± standard error of the mean and 95% confidence intervals were normal-based. Normality was assessed visually or via analysis in GraphPad, and variance was accounted for in all analyses. Means for continuous variables were compared between groups using, where appropriate, unpaired Student’s t-test, one-way, or two-way analyses of variance, and nonparametric distributions were compared using Mann Whitney U test. Tests were performed two-sided with α throughout set as 0.05.
Supplementary Material
KEY RESOURCES TABLE
| REAGENT or RESOURCE | SOURCE | IDENTIFIER |
|---|---|---|
| Antibodies | ||
| rabbit anti-Synapsin1 | EMD-Millipore | Cat# AB1543P; RRID:AB_90757 |
| mouse anti-PSD-95 | Neuromab | Cat# 75–028; RRID:AB_2292909 |
| rabbit anti-GTF2I | Abcam | Cat# ab129025; RRID:AB_11156750 |
| mouse anti-β-actin | Abcam | Cat# ab8226: RRID:AB_306371 |
| goat anti-Nanog | Abcam | Cat# ab77095: RRID:AB_1524004 |
| rabbit anti-Oct4 | Abcam | Cat# ab19857: RRID:AB_445175 |
| mouse anti-Nestin | Abcam | Cat# ab22035; RRID:AB_446723 |
| rat anti-CTIP2 | Abcam | Cat# ab18465; RRID:AB_2064130 |
| chicken anti-MAP2 | Abcam | Cat# ab5392; RRID:AB_2138153 |
| mouse anti-Vglut1 | Synaptic Systems | Cat# 135311; RRID:AB_887880 |
| rabbit anti-Homer1 | Synaptic Systems | Cat# 160003; RRID:AB_887730 |
| mouse anti-NeuN | EMD-Millipore | Cat# MAB377; RRID:AB_2298772 |
| rabbit anti-Ki67 | Abcam | Cat# ab15580; RRID:AB_443209 |
| rabbit anti-SOX2 | Cell Signaling Technology | Cat# 2748; RRID:AB_823640 |
| Biological samples | ||
| eGFP-CAG>hGTF2I | VectorBuilder | This manuscript |
| Chemicals, peptides, and recombinant proteins | ||
| SB431542 | Stemgent | Code: 04–0010-base |
| Dorsomorphin | R&D Systems | Cat# 3093 |
| Y-27632 | EMD-Millipore | Cat# 688000 |
| FGF-2 | Life Technologies | Cat# 13256–029 |
| EGF | PeproTech | Cat# AF-100-15 |
| BDNF | PeproTech | Cat# 450–02 |
| GDNF | PeproTech | Cat# 450–10 |
| NT-3 | PeproTech | Cat# 450–03 |
| L-ascorbic acid | Sigma-Aldrich | Cat# A92902 |
| dibutyryl-cAMP | Sigma-Aldrich | Cat# D0627 |
| mTeSR1 | StemCell Technologies | Cat# 85850 |
| Matrigel | BD-Biosciences | Cat# 356234 |
| Neurobasal | Life Technologies | Cat# 21103049 |
| Glutamax | Life Technologies | Cat# 35050061 |
| Gem21-NeuroPlex | Gemini Bio-Products | Cat# 400-160-010 |
| N2-NeuroPlex | Gemini Bio-Products | Cat# 17502048 |
| Non-essential amino acids | Life Technologies | Cat# 11140050 |
| Penicillin/streptomycin | Life Technologies | Cat# 15140122 |
| Neural Induction Medium | StemCell Technologies | Cat# 05835 |
| Accutase | Life Technologies | Cat# A1110501 |
| DMEM/F12 | Life Technologies | Cat# 11320033 |
| RIPA buffer | ThermoScientific | Cat# 89900 |
| Complete ultra mini protease inhibitor | Roche | Cat# 05892970001 |
| PhosSTOP phosphatase inhibitor | Roche | Cat# 4906845001 |
| Annexin V binding buffer | Invitrogen | Cat# V13246 |
| Annexin V-CF488A conjugate | Biotium, Inc. | Cat# A13201 |
| Propidium iodide | Chemometec | Cat# 910–3016 |
| BrainPhys | StemCell | Cat# 05790 |
| Critical commercial assays | ||
| Pierce BCA protein assay kit | ThermoScientific | Cat# 23225 |
| RNeasy Mini kit | Qiagen | Cat# 74104 |
| Deposited data | ||
| Bulk RNA sequencing | This paper | Gene Expression Omnibus GSE252761 |
| Experimental models: Cell lines | ||
| CVB control hiPSC line | Coriell Institute | RRID: CVCL_1N86 |
| WT83 control hiPSC line | Muotri lab | N/A |
| CVB GTF2I-KO hiPSC line | This manuscript | N/A |
| WT83 GTF2I-KO hiPSC line | This manuscript | N/A |
| Oligonucleotides | ||
| GTF2I_ex2SeqF: TCATCGAGCAGAAATGATGC IDT | N/A | |
| GTF2I_ex3SeqR: AAGCCAAGCAAGGAACACCGTACAACA | IDT | N/A |
| CVB gRNA: CCCAAGTTGCAATGTCCACCCTC | IDT | N/A |
| WT83 gRNAs: GGAGGGTGGACATTGCAACT, GGCCAAGTCCAAAGCCGAAG | IDT | N/A |
| Software and algorithms | ||
| GraphPad Prism v9 | GraphPad Software | https://www.graphpad.com/ |
| Rosalind | Rosalind | https://rosalind.onramp.bio/ |
| Cell Ranger v2.1.1 10X genomics | https://www.10xgenomics.com/support/software/cell-ranger | |
| AxIS Software Spontaneous Neural Configuration | Axion Biosystems | https://www.axionbiosystems.com/products/mea/mea-software/neural-module |
| Axion Biosystems’ Neural Metrics Tool | Axion Biosystems | https://www.axionbiosystems.com/products/mea/mea-software/neural-module |
| ImageJ | National Institute of Health | https://imagej.net/ij/ |
| Other | ||
| Multi-electrode array plates | Axion Biosystems | Cat# M384-tMEA-6B |
Highlights.
GTF2I-KO organoids show transcriptomic changes in synaptic function and apoptosis
GTF2I-KO neural progenitors exhibit higher rates of proliferation
GTF2I-KO neurons have decreased synaptic integrity and increased apoptosis
GTF2I-KO organoids have fewer synaptic proteins and decreased electrical activity
ACKNOWLEDGMENTS
The authors thank Cleber Trujillo, Priscilla Negraes, Angels Almenar-Queralt, and Fabio Papes for their invaluable tutelage and insight. We additionally acknowledge Dr. Kristen Jepsen at the University of California, San Diego Institute of Genomic Medicine, funded by NIH grant S10 OD026929. This work was supported by NIH R01MH100175, R01NS105969, P01 NICHD033113, MH123828, R01NS123642, R01MH127077, R01ES033636, R21MH128827, R01AG078959, R01DA056908, R01HD107788, R01HG012351, R21HD109616, R01MH107367, and 5T32GM007198; NIH Director’s New Innovator Award Program 1-DP2-OD006495-01; Department of Defense W81XWH2110306; and a CARTA Fellowship to J.W.A.
Footnotes
DECLARATION OF INTERESTS
A.R.M. is a cofounder and has equity interest in TISMOO, a company dedicated to genetic analysis and brain organoid modeling focusing on therapeutic applications customized for ASD and other neurological disorders with genetic origins. The terms of this arrangement have been reviewed and approved by the University of California, San Diego in accordance with its conflict-of-interest policies.
SUPPLEMENTAL INFORMATION
Supplemental information can be found online at https://doi.org/10.1016/j.celrep.2024.113867.
REFERENCES
- 1.Somerville MJ, Mervis CB, Young EJ, Seo E-J, del Campo M, Bamforth S, Peregrine E, Loo W, Lilley M, Pérez-Jurado LA, et al. (2005). Severe Expressive-Language Delay Related to Duplication of the Williams–Beuren Locus. N. Engl. J. Med 353, 1694–1701. 10.1056/nejmoa051962. [DOI] [PMC free article] [PubMed] [Google Scholar]
- 2.Pober BR (2010). Williams–Beuren Syndrome. N. Engl. J. Med 362, 239–252. 10.1056/NEJMra0903074. [DOI] [PubMed] [Google Scholar]
- 3.Preus M (1984). The Williams syndrome: objective definition and diagnosis. Clin. Genet 25, 422–428. 10.1111/j.1399-0004.1984.tb02011.x. [DOI] [PubMed] [Google Scholar]
- 4.Morris CA, Mervis CB, Paciorkowski AP, Abdul-Rahman O, Dugan SL, Rope AF, Bader P, Hendon LG, Velleman SL, Klein-Tasman BP, and Osborne LR (2015). 7q11.23 Duplication syndrome: Physical characteristics and natural history. Am. J. Med. Genet 167A, 2916–2935. 10.1002/ajmg.a.37340. [DOI] [PMC free article] [PubMed] [Google Scholar]
- 5.Kozel BA, Barak B, Kim CA, Mervis CB, Osborne LR, Porter M, and Pober BR (2021). Williams syndrome. Nat. Rev. Dis. Prim 7, 42. 10.1038/s41572-021-00276-z. [DOI] [PMC free article] [PubMed] [Google Scholar]
- 6.Depienne C, Heron D, Betancur C, Benyahia B, Trouillard O, Bouteiller D, Verloes A, LeGuern E, Leboyer M, and Brice A (2007). Autism, language delay and mental retardation in a patient with 7q11 duplication. J. Med. Genet 44, 452–458. 10.1136/jmg.2006.047092. [DOI] [PMC free article] [PubMed] [Google Scholar]
- 7.Doyle TF, Bellugi U, Korenberg JR, and Graham J (2004). “Everybody in the World Is My Friend” Hypersociability in Young Children with Williams Syndrome. Am. J. Med. Genet 124A, 263–273. 10.1002/ajmg.a.20416. [DOI] [PubMed] [Google Scholar]
- 8.Bellugi U, Lichtenberger L, Jones W, Lai Z, and St. George M (2000). I. The neurocognitive profile of Williams syndrome: A complex pattern of strengths and weaknesses. J. Cognit. Neurosci 12, 7–29. 10.1162/089892900561959. [DOI] [PubMed] [Google Scholar]
- 9.Chailangkarn T, Noree C, and Muotri AR (2018). The contribution of GTF2I haploinsufficiency to Williams syndrome. Mol. Cell. Probes 40, 45–51. 10.1016/j.mcp.2017.12.005. [DOI] [PMC free article] [PubMed] [Google Scholar]
- 10.Karmiloff-Smith A, Broadbent H, Farran EK, Longhi E, D’Souza D, Metcalfe K, Tassabehji M, Wu R, Senju A, Happé F, et al. (2012). Social cognition in Williams syndrome: Genotype/phenotype insights from partial deletion patients. Front. Psychol 3, 168—8. 10.3389/fpsyg.2012.00168. [DOI] [PMC free article] [PubMed] [Google Scholar]
- 11.Scherer SW, Cheung J, MacDonald JR, Osborne LR, Nakabayashi K, Herbrick JA, Carson AR, Parker-Katiraee L, Skaug J, Khaja R, et al. (2003). Human chromosome 7: DNA sequence and biology. Science 84 300, 767–772. 10.1126/science.1083423. [DOI] [PMC free article] [PubMed] [Google Scholar]
- 12.Osborne LR, Li M, Pober B, Chitayat D, Bodurtha J, Mandel A, Costa T, Grebe T, Cox S, Tsui LC, and Scherer SW (2001). A 1.5 million-base pair inversion polymorphism in families with Williams-Beuren syndrome. Nat. Genet 29, 321–325. 10.1038/ng753. [DOI] [PMC free article] [PubMed] [Google Scholar]
- 13.Dai L, Bellugi U, Chen XN, Pulst-Korenberg AM, Järvinen-Pasley A, Tirosh-Wagner T, Eis PS, Graham J, Mills D, Searcy Y, and Korenberg JR (2009). Is it williams syndrome? GTF2IRD1 implicated in visual-spatial construction and GTF2I in sociability revealed by high resolution arrays. Am. J. Med. Genet 149A, 302–314. 10.1002/ajmg.a.32652. [DOI] [PMC free article] [PubMed] [Google Scholar]
- 14.Malenfant P, Liu X, Hudson ML, Qiao Y, Hrynchak M, Riendeau N, Hildebrand MJ, Cohen IL, Chudley AE, Forster-Gibson C, et al. (2012). Association of GTF2i in the Williams-Beuren Syndrome critical region with autism spectrum disorders. J. Autism Dev. Disord 42, 1459– 1469. 10.1007/s10803-011-1389-4. [DOI] [PubMed] [Google Scholar]
- 15.Antonell A, De Luis O, Domingo-Roura X, and Pérez-Jurado LA (2005). Evolutionary mechanisms shaping the genomic structure of the Williams-Beuren syndrome chromosomal region at human 7q11.23. Genome Res. 15, 1179–1188. 10.1101/gr.3944605. [DOI] [PMC free article] [PubMed] [Google Scholar]
- 16.Niego A, and Benítez-Burraco A (2019). Williams syndrome, human self-domestication, and language evolution. Front. Psychol 10, 521–526. 10.3389/fpsyg.2019.00521. [DOI] [PMC free article] [PubMed] [Google Scholar]
- 17.Cáceres M, Lachuer J, Zapala MA, Redmond JC, Kudo L, Gesch-wind DH, Lockhart DJ, Preuss TM, and Barlow C (2003). Elevated gene expression levels distinguish human from non-human primate brains. Proc. Natl. Acad. Sci. USA 100, 13030–13035. 10.1073/pnas.2135499100. [DOI] [PMC free article] [PubMed] [Google Scholar]
- 18.Gunbin KV, and Ruvinsky A (2013). Evolution of general transcription factors. J. Mol. Evol 76, 28–47. 10.1007/s00239-012-9535-y. [DOI] [PubMed] [Google Scholar]
- 19.Crespi BJ, and Hurd PL (2014). Cognitive-behavioral phenotypes of Williams syndrome are associated with genetic variation in the GTF2I gene, in a healthy population. BMC Neurosci. 15, 127–218. 10.1186/s12868-014-0127-1. [DOI] [PMC free article] [PubMed] [Google Scholar]
- 20.Roy AL (2001). Biochemistry and biology of the inducible multifunctional transcription factor TFII-I. Gene 274, 1–13. 10.1016/s0378-1119(01)00625-4. [DOI] [PubMed] [Google Scholar]
- 21.Parker R, Phan T, Baumeister P, Roy B, Cheriyath V, Roy AL, and Lee AS (2001). Identification of TFII-I as the Endoplasmic Reticulum Stress Response Element Binding Factor ERSF: Its Autoregulation by Stress and Interaction with ATF6. Mol. Cell Biol 21, 3220–3233. 10.1128/mcb.21.9.3220-3233.2001. [DOI] [PMC free article] [PubMed] [Google Scholar]
- 22.Roy AL (2007). Signal-induced functions of the transcription factor TFII-I. Biochim. Biophys. Acta 1769, 613–621. 10.1016/j.bbaexp.2007.10.002. [DOI] [PMC free article] [PubMed] [Google Scholar]
- 23.Desgranges ZP, and Roy AL (2006). TFII-I: Connecting mitogenic signals to cell cycle regulation. Cell Cycle 5, 356–359. 10.4161/cc.5.4.2442. [DOI] [PubMed] [Google Scholar]
- 24.Danoff SK, Taylor HE, Blackshaw S, and Desiderio S (2004). TFII-I, a candidate gene for Williams syndrome cognitive profile: Parallels between regional expression in mouse brain and human phenotype. Neuroscience 123, 931–938. 10.1016/j.neuroscience.2003.08.038. [DOI] [PubMed] [Google Scholar]
- 25.Deurloo MHS, Turlova E, Chen WL, Lin YW, Tam E, Tassew NG, Wu M, Huang YC, Crawley JN, Monnier PP, et al. (2019). Transcription Factor 2I Regulates Neuronal Development via TRPC3 in 7q11.23 Disorder Models. Mol. Neurobiol 56, 3313–3325. 10.1007/s12035-018-1290-7. [DOI] [PMC free article] [PubMed] [Google Scholar]
- 26.Sakurai T, Dorr NP, Takahashi N, McInnes LA, Elder GA, and Buxbaum JD (2011). Haploinsufficiency of Gtf2i, a gene deleted in Williams Syndrome, leads to increases in social interactions. Autism Res. 4, 28–39. 10.1002/aur.169. [DOI] [PubMed] [Google Scholar]
- 27.Lucena J, Pezzi S, Aso E, Valero MC, Carreiro C, Dubus P, Sampaio A, Segura M, Barthelemy I, Zindel MY, et al. (2010). Essential role of the N-terminal region of TFII-I in viability and behavior. BMC Med. Genet 11, 61. 10.1186/1471-2350-11-61. [DOI] [PMC free article] [PubMed] [Google Scholar]
- 28.Enkhmandakh B, Makeyev AV, Erdenechimeg L, Ruddle FH, Chimge NO, Tussie-Luna MI, Roy AL, and Bayarsaihan D (2009). Essential functions of the Williams-Beuren syndrome-associated TFII-I genes in embryonic development. Proc. Natl. Acad. Sci. USA 106, 181–186. 10.1073/pnas.0811531106. [DOI] [PMC free article] [PubMed] [Google Scholar]
- 29.Barak B, Zhang Z, Liu Y, Nir A, Trangle SS, Ennis M, Levandowski KM, Wang D, Quast K, Boulting GL, et al. (2019). Neuronal deletion of Gtf2i, associated with Williams syndrome, causes behavioral and myelin alterations rescuable by a remyelinating drug. Nat. Neurosci 22, 700–708. 10.1038/s41593-019-0380-9. [DOI] [PubMed] [Google Scholar]
- 30.Hodge RD, Bakken TE, Miller JA, Smith KA, Barkan ER, Gray-buck LT, Close JL, Long B, Johansen N, Penn O, et al. (2019). Conserved cell types with divergent features in human versus mouse cortex. Nature 573, 61–68. 10.1038/s41586-019-1506-7. [DOI] [PMC free article] [PubMed] [Google Scholar]
- 31.Adams JW, Cugola FR, and Muotri AR (2019). Brain organoids as tools for modeling human neurodevelopmental disorders. Physiology 34, 365–375. 10.1152/physiol.00005.2019. [DOI] [PMC free article] [PubMed] [Google Scholar]
- 32.Chailangkarn T, Trujillo CA, Freitas BC, Hrvoj-Mihic B, Herai RH, Yu DX, Brown TT, Marchetto MC, Bardy C, McHenry L, et al. (2016). A human neurodevelopmental model for Williams syndrome. Nature 536, 338–343. 10.1038/nature19067. [DOI] [PMC free article] [PubMed] [Google Scholar]
- 33.Adamo A, Atashpaz S, Germain PL, Zanella M, D’Agostino G, Albertin V, Chenoweth J, Micale L, Fusco C, Unger C, et al. (2015). 7Q11.23 Dosage-Dependent Dysregulation in Human Pluripotent Stem Cells Affects Transcriptional Programs in Disease-Relevant Lineages. Nat. Genet 47, 132–141. 10.1038/ng.3169. [DOI] [PubMed] [Google Scholar]
- 34.Wahlin KJ, Cheng J, Jurlina SL, Jones MK, Dash NR, Ogata A, Kibria N, Ray S, Eldred KC, Kim C, et al. (2021). CRISPR Generated SIX6 and POU4F2 Reporters Allow Identification of Brain and Optic Transcriptional Differences in Human PSC-Derived Organoids. Front. Cell Dev. Biol 9, 764725. 10.3389/fcell.2021.764725. [DOI] [PMC free article] [PubMed] [Google Scholar]
- 35.Trujillo CA, Gao R, Negraes PD, Gu J, Buchanan J, Preissl S, Wang A, Wu W, Haddad GG, Chaim IA, et al. (2019). Complex Oscillatory Waves Emerging from Cortical Organoids Model Early Human Brain Network Development. Cell Stem Cell 25, 558–569.e7. 10.1016/j.stem.2019.08.002. [DOI] [PMC free article] [PubMed] [Google Scholar]
- 36.Camp JG, Badsha F, Florio M, Kanton S, Gerber T, Wilsch-Braüninger M, Lewitus E, Sykes A, Hevers W, Lancaster M, et al. (2015). Human cerebral organoids recapitulate gene expression programs of fetal neocortex development. Proc. Natl. Acad. Sci. USA 112, 15672–15677. 10.1073/pnas.1520760112. [DOI] [PMC free article] [PubMed] [Google Scholar]
- 37.Luo C, Lancaster MA, Castanon R, Nery JR, Knoblich JA, and Ecker JR (2016). Cerebral Organoids Recapitulate Epigenomic Signatures of the Human Fetal Brain. Cell Rep. 17, 3369–3384. 10.1016/j.celrep.2016.12.001. [DOI] [PMC free article] [PubMed] [Google Scholar]
- 38.Urresti J, Zhang P, Moran-Losada P, Yu NK, Negraes PD, Trujillo CA, Antaki D, Amar M, Chau K, Pramod AB, et al. (2021). Cortical organoids model early brain development disrupted by 16p11.2 copy number variants in autism. Mol. Psychiatr 26, 7560–7580. 10.1038/s41380-021-01243-6. [DOI] [PMC free article] [PubMed] [Google Scholar]
- 39.Shen Y, Nar R, Fan AX, Aryan M, Hossain MA, Gurumurthy A, Wassel PC, Tang M, Lu J, Strouboulis J, and Bungert J (2018). Functional interrelationship between TFII-I and E2F transcription factors at specific cell cycle gene loci. J. Cell. Biochem 119, 712–722. 10.1002/jcb.26235. [DOI] [PMC free article] [PubMed] [Google Scholar]
- 40.Desgranges ZP, Ahn J, Lazebnik MB, Ashworth T, Lee C, Pestell RC, Rosenberg N, Prives C, and Roy AL (2005). Inhibition of TFII-I-Dependent Cell Cycle Regulation by p53. Mol. Cell Biol 25, 10940– 10952. 10.1128/mcb.25.24.10940-10952.2005. [DOI] [PMC free article] [PubMed] [Google Scholar]
- 41.Dasilva M, Navarro-Guzman A, Ortiz-Romero P, Camassa A, Muñoz-Cespedes A, Campuzano V, and Sanchez-Vives MV (2020). Altered Neocortical Dynamics in a Mouse Model of Williams–Beuren Syndrome. Mol. Neurobiol 57, 765–777. 10.1007/s12035-019-01732-4. [DOI] [PMC free article] [PubMed] [Google Scholar]
- 42.Roy AL (2017). Pathophysiology of TFII-I: Old Guard Wearing New Hats. Trends Mol. Med 23, 501–511. 10.1016/j.molmed.2017.04.002. [DOI] [PMC free article] [PubMed] [Google Scholar]
- 43.Trujillo CA, Adams JW, Negraes PD, Carromeu C, Tejwani L, Acab A, Tsuda B, Thomas CA, Sodhi N, Fichter KM, et al. (2021). Pharmacological reversal of synaptic and network pathology in human MECP2 -KO neurons and cortical organoids. EMBO Mol. Med 13, e12523. 10.15252/emmm.202012523. [DOI] [PMC free article] [PubMed] [Google Scholar]
- 44.Avansini SH, Puppo F, Adams JW, Vieira AS, Coan AC, Rogerio F, Torres FR, Araújo PAOR, Martin M, Montenegro MA, et al. (2022). Junctional instability in neuroepithelium and network hyperexcit-ability in a focal cortical dysplasia human model. Brain 145, 1962–1977. 10.1093/brain/awab479. [DOI] [PMC free article] [PubMed] [Google Scholar]
- 45.Massagué J (2004). G1 cell-cycle control and cancer. Nature 432, 298–306. 10.1038/nature03094. [DOI] [PubMed] [Google Scholar]
- 46.Wang M, Wei PC, Lim CK, Gallina IS, Marshall S, Marchetto MC, Alt FW, and Gage FH (2020). Increased Neural Progenitor Proliferation in a hiPSC Model of Autism Induces Replication Stress-Associated Genome Instability. Cell Stem Cell 26, 221–233.e6. 10.1016/j.stem.2019.12.013. [DOI] [PMC free article] [PubMed] [Google Scholar]
- 47.Nageshappa S, Carromeu C, Trujillo CA, Mesci P, Espuny-Camacho I, Pasciuto E, Vanderhaeghen P, Verfaillie CM, Raitano S, Kumar A, et al. (2016). Altered neuronal network and rescue in a human MECP2 duplication model. Mol. Psychiatr 21, 178–188. 10.1038/mp.2015.128. [DOI] [PMC free article] [PubMed] [Google Scholar]
- 48.Levi G, De Lombares C, Giuliani C, Iannuzzi V, Aouci R, Garagnani P, Franceschi C, Grimaud-Hervé D, and Narboux-Nême N (2021). DLX5/6 GABAergic Expression Affects Social Vocalization: Implications for Human Evolution. Mol. Biol. Evol 38, 4748–4764. 10.1093/molbev/msab181. [DOI] [PMC free article] [PubMed] [Google Scholar]
- 49.Barak B, and Feng G (2016). Neurobiology of social behavior abnormalities in autism and Williams syndrome. Nat. Neurosci 19, 647–655. 10.1038/nn.4276. [DOI] [PMC free article] [PubMed] [Google Scholar]
- 50.Tebbenkamp ATN, Varela L, Choi J, Paredes MI, Giani AM, Song JE, Sestan-Pesa M, Franjic D, Sousa AMM, Liu ZW, et al. (2018). The 7q11.23 Protein DNAJC30 Interacts with ATP Synthase and Links Mitochondria to Brain Development. Cell 175, 1088–1104.e23. 10.1016/j.cell.2018.09.014. [DOI] [PMC free article] [PubMed] [Google Scholar]
- 51.Kang HJ, Kawasawa YI, Cheng F, Zhu Y, Xu X, Li M, Sousa AMM, Pletikos M, Meyer KA, Sedmak G, et al. (2011). Spatio-temporal transcriptome of the human brain. Nature 478, 483–489. 10.1038/nature10523. [DOI] [PMC free article] [PubMed] [Google Scholar]
- 52.Chaves RS, Tran M, Holder AR, Balcer AM, Dickey AM, Roberts EA, Bober BG, Gutierrez E, Head BP, Groisman A, et al. (2021). Amyloidogenic Processing of Amyloid Precursor Protein Drives Stretch-Induced Disruption of Axonal Transport in hiPSC-Derived Neurons. J. Neurosci 41, 10034–10053. 10.1523/JNEUROSCI.2553-20.2021. [DOI] [PMC free article] [PubMed] [Google Scholar]
- 53.Gore A, Li Z, Fung HL, Young JE, Agarwal S, Antosiewicz-Bourget J, Canto I, Giorgetti A, Israel MA, Kiskinis E, et al. (2011). Somatic coding mutations in human induced pluripotent stem cells. Nature 471, 63–67. 10.1038/nature09805. [DOI] [PMC free article] [PubMed] [Google Scholar]
- 54.Martin M (2011). Cutadapt removes adapter sequences from high-throughput sequencing reads. EMBnet. J 17, 10–12. [Google Scholar]
- 55.Andrews S (2010). FastQC: A Quality Control Tool for High Throughput Sequence Data. https://www.bioinformatics.babraham.ac.uk/projects/fastqc/.
- 56.Dobin A, Davis CA, Schlesinger F, Drenkow J, Zaleski C, Jha S, Batut P, Chaisson M, and Gingeras TR (2013). STAR: Ultrafast universal RNA-seq aligner. Bioinformatics 29, 15–21. 10.1093/bioinformatics/bts635. [DOI] [PMC free article] [PubMed] [Google Scholar]
- 57.Anders S, Pyl PT, and Huber W (2015). HTSeq-A Python framework to work with high-throughput sequencing data. Bioinformatics 31, 166–169. 10.1093/bioinformatics/btu638. [DOI] [PMC free article] [PubMed] [Google Scholar]
- 58.Love MI, Huber W, and Anders S (2014). Moderated estimation of fold change and dispersion for RNA-seq data with DESeq2. Genome Biol. 15, 550–621. 10.1186/s13059-014-0550-8. [DOI] [PMC free article] [PubMed] [Google Scholar]
- 59.Wang L, Wang S, and Li W (2012). RSeQC: Quality control of RNA-seq experiments. Bio-informatics 28, 2184–2185. 10.1093/bioinformatics/bts356. [DOI] [PubMed] [Google Scholar]
- 60.Hennig C (2020). Fpc: Flexible Procedures for Clustering. https://cran.r-project.org/web/packages/fpc/index.html.
- 61.Liao Y, Wang J, Jaehnig EJ, Shi Z, and Zhang B (2019). WebGestalt 2019: gene set analysis toolkit with revamped UIs and APIs. Nucleic Acids Res. 47, W199–W205. 10.1093/nar/gkz401. [DOI] [PMC free article] [PubMed] [Google Scholar]
- 62.Zhang B, Kirov S, and Snoddy J (2005). WebGestalt: An integrated system for exploring gene sets in various biological contexts. Nucleic Acids Res. 33, 741–748. 10.1093/nar/gki475. [DOI] [PMC free article] [PubMed] [Google Scholar]
- 63.Griesi-Oliveira K, Acab A, Gupta AR, Sunaga DY, Chailangkarn T, Nicol X, Nunez Y, Walker MF, Murdoch JD, Sanders SJ, et al. (2015). Modeling non-syndromic autism and the impact of TRPC6 disruption in human neurons. Mol. Psychiatr 20, 1350–1365. 10.1038/mp.2014.141. [DOI] [PMC free article] [PubMed] [Google Scholar]
- 64.Negraes PD, Trujillo CA, Yu NK, Wu W, Yao H, Liang N, Lautz JD, Kwok E, McClatchy D, Diedrich J, et al. (2021). Altered network and rescue of human neurons derived from individuals with early-onset genetic epilepsy. Mol. Psychiatr 26, 7047–7068. 10.1038/s41380-021-01104-2. [DOI] [PMC free article] [PubMed] [Google Scholar]
- 65.Trujillo CA, Rice ES, Schaefer NK, Chaim IA, Wheeler EC, Madrigal AA, Buchanan J, Preissl S, Wang A, Negraes PD, et al. (2021). Reintroduction of the archaic variant of NOVA1 in cortical organoids alters neurodevelopment. Science 371, eaax2537. 10.1126/science.aax2537. [DOI] [PMC free article] [PubMed] [Google Scholar]
- 66.Sirenko O, Parham F, Dea S, Sodhi N, Biesmans S, Mora-Castilla S, Ryan K, Behl M, Chandy G, Crittenden C, et al. (2019). Functional and mechanistic neurotoxicity profiling using human iPSC-Derived neural 3D cultures. Toxicol. Sci 167, 58–76. 10.1093/toxsci/kfy218. [DOI] [PMC free article] [PubMed] [Google Scholar]
- 67.Bardy C, Van Den Hurk M, Eames T, Marchand C, Hernandez RV, Kellogg M, Gorris M, Galet B, Palomares V, Brown J, et al. (2015). Neuronal medium that supports basic synaptic functions and activity of human neurons in vitro. Proc. Natl. Acad. Sci. USA 112, E2725–E2734. 10.1073/pnas.1504393112. [DOI] [PMC free article] [PubMed] [Google Scholar]
Associated Data
This section collects any data citations, data availability statements, or supplementary materials included in this article.
Supplementary Materials
Data Availability Statement
Bulk RNA-sequencing data generated for this study are publicly available; files were deposited at Gene Expression Omnibus GSE252761.
This paper does not report original code.
Any additional information required to reanalyze the data reported in this work paper is available from the lead contact upon request.