

Abstract

The streamlined water-leaching preconcentration method is introduced as a novel preconcentration method in this study. The approach has many benefits including low consumption of organic solvent and deionized water and operation time, energy-saving, no need for dispersion or evaporation, and implementation of more efficient preconcentration. Also, a methodological study was done on the synthesis of (Fe/Co) bimetallic-organic framework that eased the synthesis procedure, decreased its time, and enhanced its analytical performance by increasing its surface area, total pore volume, and average pore diameter parameters. To perform the extraction, bi-MOF particles were added into the solution of interest enriched with sodium sulfate. After vortexing to adsorb the analytes, centrifugation isolated the sorbent particles. A microliter-volume of acetonitrile and 1,2-dibromoethane mixture was used for desorption aim via vortexing. After the separation of the organic phase and transferring it into a conical bottom glass test tube, a milliliter volume of sodium chloride solution was applied to leach the organic phase. A gas chromatograph equipped with a flame ionization detector was applied for the injection of the extracted phase. The method was applied for the extraction and preconcentration of some pesticides from juice samples. Wide linear ranges (5.44–1600 μg L–1), low relative standard deviations (3.1–4.5% for intra- (n = 6) and 3.5–5.2% for interday (n = 4) precisions), high extraction recoveries (61–95%), enrichment factors (305–475), and low limits of detection (0.67–1.65 μg L–1) and quantification (2.21–5.44 μg L–1) were obtained for the developed method.
1. Introduction
Analytical method development is inevitably important since detecting and quantifying low concentrations of various analytes in real samples depends on their successful extraction and preconcentration.1 Different extraction methods such as solid phase extraction,2 solid-phase microextraction,3 rotating disk sorptive extraction,4 membrane-assisted solvent extraction,5 liquid–liquid extraction,6 supercritical CO2-assisted extraction,7 hollow fiber-liquid phase microextraction,8 and dispersive micro solid phase extraction9 have been successfully exploited for the extraction of various analytes including pesticides from different matrices. In addition to extraction, there is a fundamental term in sample preparation called preconcentration. Performing preconcentration after the extraction leads to low limits of detection (LODs) and quantification (LOQs), extends linear ranges (LRs), and increases enrichment factors (EFs). Therefore, preconcentration is a precious and beneficial action for improving analytical figures of merit. Up until now, some preconcentration approaches such as evaporation10 and dispersive liquid–liquid microextraction (DLLME)11 have been coupled to extraction procedures to reach the mentioned goals. Also, different analytical apparatuses including high-performance liquid chromatography,12 gas chromatography (GC),13 and capillary electrophoresis14 have been adopted for the detection and quantification of pesticides. This study tries to introduce a new preconcentration method called streamlined water-leaching preconcentration (SWLP) that has many advantages over customary preconcentration approaches.
Metal–organic frameworks (MOFs), being synthesized using organic linker(s) and cationic center(s) through strong bonds, have played a noticeable role in different fields such as hydrogen storage,15 water treatment,16 fuel cells,17 and catalysis18 due to their stability, porosity, and adsorptive capacity.19 In chromatography and sample preparation techniques, they have been applied as stationary phases,20 in matrix solid phase dispersion extraction,21 and solid phase microextraction.22 Up to now, MOF-199,23 Zn-MOF-1,24 MIL-101,25 melamine-modified MIL-88B(Fe),26 ZIF-67,27 and UMCM-128 have been exploited in the field of sample preparation. The advent of heterometallic organic frameworks and especially bimetallic-organic frameworks (Bi-MOFs) has been a new approach for boosting catalytic activities.29 Since the presence of more than one type cation in the structure of an MOF results in different pore sizes and intramolecular interactions and also affects the porosity, ligand-to-cation bond lengths and angels in the produced coordination polymer, the application of Bi-MOFs in the field of sample preparation seems interesting.
Pesticides have been beneficial to mankind and the environment from different points of view. They increase the crop yield, reduce fungal toxins and the drudgery of weeding, and also help the agricultural economy.30 On the other hand, their presence in foodstuffs leads to health-threatening problems such as Alzheimer’s and Parkinson’s diseases,31,32 diabetes,33 cancer,34 energy metabolic disorders,35 and leukemia and cognitive effects.36 Therefore, monitoring the presence of different pesticides using efficient and concise methods seems noticeable.
A new preconcentration method called SWLP was developed in this study to further enrich the extracted analytes to lower the LOD and LOQ values and enable inherently less sensitive analytical apparatuses to detect and quantify different target compounds precisely. There are various advantages for SWLP over DLLME such as having a much easier operation (imposing no pressure for dispersion and also washing and rinsing the dispersion glass syringe in batch-to-batch analyses), time-saving function (by decreasing the operation time from approximately 7 min to 30 s.), and being electrically independent by the elimination of centrifugation which is energy-saving. Also, there is no need for a dispersion glass syringe and a glass vial for mixing disperser and extraction solvents before being dispersed into deionized water. A more efficient desorption is performed in the presence of both desorption and preconcentration solvents during the desorption step, whereas in DLLME, only the desorption solvent propels the desorption function. This can also prohibit the evaporation of the desorption solvent during vortexing which can finally increase the efficiency of the desorption process. The dispersion process and cloudy solution creation are eliminated and the analyte loss consequence is decreased which occurs through the adverse effect of back-extraction in DLLME. This can increase the extraction recoveries (ERs) in SWLP. Significant lower volume utilization of organic desorption (from mL to μL level) and preconcentration (from approximately 30 to 10 μL) solvents and also deionized water (from approximately 5 to 2 mL)37 and improving the greenness of the approach in comparison to DLLME are the advantages of the method. The highlighted point is that only by applying 410 μL of organic solvents, the extraction and preconcentration processes are propelled in this study. On the other hand, in comparison to evaporation-based preconcentration approaches, SWLP benefits from shorter operation time (from approximately 13 min to 30 s.), easier operation, no need for applying nitrogen gas and a gas splitter, avoiding the analyte loss which can happen during the evaporation process, especially for low boiling point analytes, and avoiding the spread of organic solvent vapors in the laboratory.10 The other novelty aspect of the research is the performed modification in the synthesis procedure of (Fe/Co) Bi-MOF which eased the synthesis step, shortened its process time, and improved the adsorptive characteristics of the Bi-MOF by enhancing its surface area, and porosity (total pore volume), and decreasing its density and agglomeration. This acted as a blessing for the analytical method and added to the novelty of the work. Also, needing no high temperature for the Bi-MOF provision and short-time synthesis procedure are the highlights of the research.
2. Materials and Methods
2.1. Chemicals and Solutions
Bi-MOF synthesis reagents including analytical-grade cobalt nitrate hexahydrate (Co(NO3)2.6H2O), ferric nitrate nonahydrate (Fe(NO3)3.9H2O), and 1,4-benzene dicarboxylic acid (1,4-BDCA) were provided from Merck (Darmstadt, Germany). The needed solvents and solutions for the provision of (Fe/Co) Bi-MOF including N,N-dimethylformamide (DMF), chloroform, and triethylamine (TEA) (analytical grade) were also supplied by Merck. Sodium chloride and sodium sulfate (analytical grade) used as antiback-extraction and salting-out agents in SWLP and dispersive micro solid phase extraction (DμSPE) steps, respectively, were bought from Merck. The desorption solvents including acetonitrile (ACN), 2-propanol, and methanol (analytical grade) were from Merck. The applied preconcentration solvents named 1,2-dibromoethane (1,2-DBE), carbon tetrachloride, and 1,1,1-trichloroethane (1,1,1-TCE) (analytical grade) were purchased from Janssen (Beerse, Belgium). Ghazi Co. (Tabriz, Iran) provided the applied deionized water used in the preparation of aqueous working solutions of the analytes and the leaching solvent in the SWLP step. pH adjustment agents in DμSPE and SWLP steps including sodium hydroxide and hydrochloric acid (37%, w/w) were provided by Merck. The studied analytes including fenitrothion, acetochlor, haloxyfop-R-methyl, malathion, oxadiazon, diniconazole, and hexaconazole were provided by Dr. Ehrenstorfer (Augsburg, Germany). A stock solution with a concentration of 1000 mg L–1 of each pesticide was prepared in methanol and the working solutions were provided by dilution of the stock solution with deionized water.
2.2. Samples
Apple, orange, and peach juice samples (three of each) were bought from different supermarkets in Tabriz (East Azerbaijan Province, Iran) and subjected to the developed microextraction procedure to assess the efficiency of the developed process for the extraction of the surveyed target compounds. The provided samples were stored in a refrigerator set at 4 °C before being subjected to the developed method. The surveyed samples were diluted with deionized water at a ratio of 1:4 (v/v) before extraction.
2.3. Apparatus
Analysis of the seven surveyed target compounds was done using a Shimadzu gas chromatograph (2014, Kyoto, Japan) equipped with a flame ionization detector (FID) and a splitless/split injection port. The column oven temperature was fixed at 60 °C for 1 min and then increased at the rate of 10 °C min–1 to 300 °C. The temperature was finally fixed at 300 °C for 1. Zebron capillary column (95% dimethyl, 5% diphenyl polysiloxane; Phenomenex, Torrance, CA, the USA), (30 m × 0.25 mm i.d., with a film thickness of 0.25 μm) was used in the study. Helium (99.999%; Gulf Cryo, Dubai, United Arab Emirates) was used as the makeup (flow rate: 30 mL min–1) and carrier gases (linear velocity: 30 cm s–1). 300 °C temperature was fixed for the FID and injection port. The sampling time and the split ratio of the injection port were 1 min and 1:10, respectively. The air inlet of FID was set at 300 mL min–1 flow rate and hydrogen, at the flow rate of 30 mL min–1, was generated by a Shimadzu hydrogen generator (OPGU-1500S). A Metrohm pH meter (Herisau, Switzerland), model 654, was used in the preparation of the samples. A Hettich centrifuge (D-7200, Kirchlengern, Germany) was used in the approach. For the dispersion of (Fe/Co) Bi-MOF particles in the solutions of interest to facilitate the adsorption process, an L46 vortex (Labinco, Breda, The Netherlands) was used. A UT 12 Heraeus oven (Hanau, Germany) was applied to propel the provision steps of the Bi-MOF. Some characterization analyses including energy dispersive X-ray (EDX) and scanning electron microscopy (SEM) (Mira 3 microscope, Tescan, Czech Republic), Brunauer–Emmett–Teller (BET, BELSORP-mini II, Japan), Fourier transform infrared (FTIR) spectrophotometry (Bruker, Billerica, USA), and X-ray diffraction (XRD) (Siemens D500 diffractometer, and Siemens AG, Karlsruhe, Germany) were conducted to provide comprehensive information about the synthesized Bi-MOF.
2.4. Synthesis of (Fe/Co) Bi-MOF
Initially, 10 mmol (1.66 g) of 1,4-BDCA was dissolved in 40 mL DMF in a beaker by stirring and the addition of 4.4 mL of TEA. Then, 5 mmol of each of the salts including Co(NO3)2.6H2O (1.45 g) and Fe(NO3)3.9H2O (2.02 g) were separately dissolved in 10 mL of DMF in two separate beakers. After stirring and completely dissolving, the contents of the two salt-containing beakers were consolidated and the resulting solution containing Co and Fe cations was swiftly added into the prepared ligand solution under vigorous stirring. Quickly, a voluminous agglomerate of the composed Bi-MOF was formed in the beaker that underwent vigorous stirring for 2 h. Then, the content of the beaker was transferred into a Teflon-lined stainless steel autoclave and located in the oven set at 120 °C for 4 h. After heating, the precipitate was filtered through a filter paper and subsequently was added into chloroform and stirred for 6 h. The Bi-MOF-containing solution was filtered again using filter paper and left to dry overnight at room temperature. The resulting powder was transferred into a beaker and located in the oven with a temperature of 60 °C for 6 h to be activated. The final product was light brown and its weight was 2.65 g. Throughout the manuscript, the synthesized Bi-MOF according to the method described in this paper is called (Fe/Co) Bi-MOF*.
Alshorifi et al.38 have introduced another approach for the provision of (Fe/Co) Bi-MOF which was based on the dropwise addition of 2.2 mL of TEA into the mixture of Co(NO3)2.6H2O, Fe(NO3)3.9H2O, and 1,4-BDCA (with the same weights as mentioned above) in 40 mL of DMF under vigorous stirring. The resulting powder was dark brown and its weight was 2.8 g. This approach was also adopted for the synthesis of the Bi-MOF and the resulting sorbent was assigned (Fe/Co) Bi-MOF throughout the paper. XRD, FTIR, BET, EDX, and SEM analyses and also the developed microextraction method were carried out with both of the synthesized Bi-MOFs to illustrate their characteristic and analytical performances.
2.5. Extraction Procedure
2.5.1. DμSPE Procedure
Initially, 5 mL of deionized water or the real samples (see Section 2.2) was located in a 10 mL conical bottom glass test tube and 1 mol L–1 (0.71 g) sodium sulfate was dissolved in it. The aqueous phase was spiked with 500 μg L–1 of each target compound. Twenty milligrams of (Fe/Co) Bi-MOF* were then added into the solution and vortexed for 5 min to facilitate the adsorption process. Centrifugation was done at 7000 rpm for 5 min to isolate the Bi-MOF from the solution. The aqueous phase was discarded. A mixture of 400 μL ACN and 10 μL 1,2-DBE, as the desorption and preconcentration solvents, respectively, was added onto the obtained Bi-MOF particles and vortexed for 5 min to desorb the pesticides. Centrifugation at 7000 rpm for 5 min isolated the organic phase which was transferred into another 10 mL conical bottom glass test tube to perform the preconcentration method described below.
2.5.2. SWLP Procedure
Two milliliters of 10% (w/v) sodium chloride aqueous solution was added into the obtained organic phase from the accomplished DμSPE step using a 2 mL pipet from the perimeter of the conical bottom glass test tube. The content of the tube was shaken slowly by hand for a few seconds in which the formation and sedimentation of the preconcentration solvent droplets were observable. Therefore, the extracted phase (10 ± 0.5 μL) was sedimented at the bottom of the tube. One microliter of the extracted phase was injected into the separation system.
2.6. EF and ER Calculations
The performed preconcentration on the analytes through the method is shown by EF. This term illustrates the ratio of the organic phase analyte concentration (Corg) to the same term in the aqueous phase (C0). Eq 1 shows EF calculation.
| 1 |
The ratio of the migrated analytes into the extracted phase is shown by ER. Based on eq 2, it is understood that the percentage of the migrated analyte number into the organic phase (nfin) to its number in the aqueous solution (n0) is called ER.
| 2 |
In this equation, Vaq is the volume of the initial aqueous phase and Vfin is the volume of the organic phase.
3. Results and Discussion
3.1. Bi-MOF Characterization
To assess the correctness of the obtained phases using the adopted synthesis methodologies, XRD analysis was carried out for both of the obtained Bi-MOFs. The XRD patterns were documented at the 2θ region of 4–74° for both of the synthesized Bi-MOFs. Figure 1a demonstrates the obtained XRD pattern for the (Fe/Co) Bi-MOFs. As can be observed in this pattern, there are some explicit peaks at the approximate 2θ values of 7, 9, 10, 11, 13, 15, 19, 20, 21, 25, 27, 29, and 30°. The presence of the mentioned peaks at the XRD pattern of the Bi-MOF illustrates the crystalline feature of the synthetic product. Due to the high overlapping and similarity of the XRD patterns of the two Bi-MOFs, just one pattern was illustrated to avoid redundancy. Also, the overlapping between the demonstrated XRD pattern in Figure 1a and the published one in the previous article shows the successful synthesis of the Bi-MOFs.38 Moreover, the presence of the peak at the 2θ value of 9° corresponds to the presence of Fe and the peak at the 2θ value of 29° represents the existence of Co in the synthesized Bi-MOFs that illustrate the successful formation of the desired phase.38
Figure 1.

XRD pattern (a), FTIR spectrum (b), SEM images of (Fe/Co) Bi-MOF* (c and d), SEM images of (Fe/Co) Bi-MOF (e and f), EDX spectrum of (Fe/Co) Bi-MOF* (g), EDX spectrum of (Fe/Co) Bi-MOF (h), BET plot of (Fe/Co) Bi-MOF* (i), BET plot of (Fe/Co) Bi-MOF (j), image of (Fe/Co) Bi-MOF* (k), image of (Fe/Co) Bi-MOF (l), and the volume comparison of 100 mg of (Fe/Co) Bi-MOF* and (Fe/Co) Bi-MOF (m).
The other analysis that was accomplished to evaluate the successful synthesis of the Bi-MOFs through the formation of its functional groups is FTIR. FTIR analysis was carried out in the region of 400–4000 cm–1 for both of the synthetic products. Figure 1b demonstrates the FTIR spectrum of the Bi-MOFs. The high similarity and overlapping between the FTIR spectra of (Fe/Co) Bi-MOF* and its homologue led to skipping showing the two spectra. The absorption peaks at 1594.39, 1549.48, and 1381.02 cm–1 are related to asymmetric and symmetric stretching of carboxylate groups. 1505.56 cm–1 absorption peak is related to C–H bending vibrations constructing the organic section of the Bi-MOFs. The absence of absorption peaks at 1710 and 1714 cm–1 proves the deprotonation of the hydroxyl groups in 1,4-BDCA. This promises the correct propelling of the reaction route. The absorption bonds at 1153.14 and 1100.87 cm–1 are linked to C–O stretching which is the basis of the Bi-MOF formation through the created bonds among the oxygen atoms of the ligand and Fe and Co cations. 1019.36, 885.16, and 817.36 cm–1 absorption bonds represent C=C bending vibrations originating from the cyclic section of the Bi-MOF. The absorption bonds at 690.70 and 544.01 cm–1 stand for Co–O and Fe–O bonds, respectively, which led to the creation of the Bi-MOF.38−40 Also, the excellent agreement between the FTIR spectrum documented in this study and the one presented previously proves the formation of the target Bi-MOF successfully.38
Since the methodological study aims to distinguish the results of the performed variation in the synthesis process on the obtained Bi-MOFs, SEM and BET analyses were carried out to reveal the outcome differences. SEM analysis was performed to illustrate the morphological, distributional, size, and shape differences between the two synthesized (Fe/Co) Bi-MOFs. In this study, SEM images were recorded under a 5000 V electron beam and work distances of 9.42 and 9.44 mm. Figure 1c,d demonstrate the SEM images for (Fe/Co) Bi-MOF*. It can be seen that there are individual particles of the Bi-MOF lying on each other and providing proper surface area which can be helpful for the adsorption aim. The particles are rod-like with an approximate longitudinal dimension of 755–805 nm and a transverse dimension of 172–176 nm. Distinct particles of the Bi-MOF are clearly observed in Figure 1c,d. No agglomeration of the particles is seen in the mentioned figures. This feature enhances the surface-to-volume ratio and also the accessible provided adsorption surface of the Bi-MOF. Due to the enhanced surface-to-volume ratio, more efficient intramolecular bonds can be created among the Bi-MOF and the analytes. Moreover, this feature facilitates the well-dispersion of the Bi-MOF particles in the solution of interest that can enhance the ER values. On the other hand, Figure 1e,f illustrate the SEM images of (Fe/Co) Bi-MOF. It is seen that the particles are agglomerated and piled up on each other. No individual or distinct Bi-MOF particles can be seen in the obtained image. The distribution of the formed agglomerates is seen to be in the size range of 388–981 nm. It is understood that applying the previously documented approach for the synthesis of the desired Bi-MOF results in an agglomerated framework that dwindles the surface-to-volume ratio and the adsorption surface area. This can negatively impact the adsorptive performance of the Bi-MOF. Also, the effect of the agglomerated particles on the dispersion of the adsorbent will be negative and this can decrease the obtained ER values.
EDX analysis was also performed on the synthesized Bi-MOFs to illustrate their composing elements. Figure 1g demonstrates the EDX analysis results of (Fe/Co) Bi-MOF*. It is seen that the Bi-MOF is composed of 49.31% carbon, 35.34% oxygen, 9.44% iron, and 5.91% cobalt. The same analysis results for (Fe/Co) Bi-MOF are shown in Figure 1h. It is seen that the Bi-MOF composing elements are 53.40% carbon, 34.20% oxygen, 6.51% iron, and 5.89% cobalt. The adopted synthesis in this research led to more engagement of the Fe element in the composed Bi-MOF.
The significant difference between the provided Bi-MOF in this study and the one reported previously can be explicitly revealed by BET analysis data. Therefore, BET analysis was applied to both of the Bi-MOFs synthesized differently. Figure 1i demonstrates the BET plot obtained for (Fe/Co) Bi-MOF*. According to the analysis, the surface area was found to be 9.82 m2 g–1. The total pore volume was found to be 0.052 cm3 g–1 and the average pore diameter was 21.04 nm. On the other hand, Figure 1j shows the BET plot of (Fe/Co) Bi-MOF. According to the performed analysis, the surface area was found to be 1.57 m2 g–1. The total pore volume was found to be 0.0060 cm3 g–1 and the average pore diameter was 15.36 nm. Vividly, the predominance of (Fe/Co) Bi-MOF* over the previously documented similar Bi-MOF is proved by enhancing its surface area by more than 6 times, total pore volume by more than 8 times, and the average pore diameter by 1.3 times. The obtained BET analysis data are precious and promise the betterment of the analytical performance of (Fe/Co) Bi-MOF* over its homologue for the extraction of the analytes.
In addition to the results obtained by the accomplishment of BET analysis which proved that (Fe/Co) Bi-MOF* is more porous, visual observation can also be helpful. Figure 1k illustrates (Fe/Co) Bi-MOF* and Figure 1l demonstrates (Fe/Co) Bi-MOF. Apparently, it is shown that the first one is light brown and the second one is dark brown. Also, Figure 1m shows the filling of 100 mg of the two synthesized homologues into the same size test tubes for comparison. It is visually observed that the height of (Fe/Co) Bi-MOF* (the left one) is more than (Fe/Co) Bi-MOF height (the right one) whereas their weights are the same. This fact also proves the low density and high porosity of (Fe/Co) Bi-MOF* in comparison to its homologue which provides more surface area for the same weight. In a categorized discussion, there are four reasons that the performance of (Fe/Co) Bi-MOF* supersedes (Fe/Co) Bi-MOF. (1) In the provision of (Fe/Co) Bi-MOF*, TEA was added into the DMF solution of 1,4-BDCA and stirred well to completely dissolve the ligand and convert it into the ionic form to become ready for the accomplishment of the reaction with iron and cobalt ions. In this condition, the ligand totally transforms to its anionic form and is ready for the reaction with the desired cations. Suddenly addition of the cationic solution into the ligand-containing solution leads to the swift agglomeration of the solution and the creation of (Fe/Co) Bi-MOF*. The fast formation of the MOF caused by the sudden addition of the cationic solution into the ligand-containing solution results in significantly higher porosity and surface area in (Fe/Co) Bi-MOF* in comparison to (Fe/Co) Bi-MOF. However, in the case of (Fe/Co) Bi-MOF, the cationic solution and 1,4-BDCA-containing solution (not ionized) were mixed together, and the TEA solution was subsequently added dropwise to the mentioned solution. In this case, the reaction is propelled slowly and according to the amount of TEA that is added into the solution and leads to the trace ionization of the ligand through each drop. Therefore, the cations of the solution are not in contact with the ionized ligand, except for the dripping spot. (2) In the synthesis of (Fe/Co) Bi-MOF*, TEA is only in contact with the ligand and converts it into the anionic form so the cations are not affected by the base. However, in the case of (Fe/Co) Bi-MOF synthesis, TEA is in contact with both cations and 1,4-BDCA which can lead to the consumption of TEA for the unwanted complexation of the cations that leads to deficient ionization of the ligand and dwindling the accessible cations for MOF formation. This issue can also be obtained by paying attention to the percentage of iron (as given in EDX results) in (Fe/Co) Bi-MOF* (9.44%) in comparison to (Fe/Co) Bi-MOF (6.51%) which shows the increased participation of the iron cations in the structure of (Fe/Co) Bi-MOF* due to the mentioned reason. (3) Suddenly addition of the cationic solution into the ionized ligand solution paves the way for the reaction of both cations with an equal chance at the same time in an instance that takes place in the case of (Fe/Co) Bi-MOF*. However, the dropwise addition of TEA into the solution of interest only provides the reaction in the dripping spot and during a longer period of time in the case of (Fe/Co) Bi-MOF. And (4) in the case of the synthesis of (Fe/Co) Bi-MOF*, due to the addition of TEA into the ligand solution, 1,4-BDCA is completely dissolved in the DMF solution and the mixture of this solution with the cation-containing solution propels the reaction well whereas the absence of TEA in the solution of the ligand for the provision of (Fe/Co) Bi-MOF leads to the deficient solubility of the ligand which is deprived of the presence of TEA. Based on the four-mentioned reasons, (Fe/Co) Bi-MOF* supersedes (Fe/Co) Bi-MOF by resulting in higher ERs, distinct adsorbent particles (according to the SEM images), enhanced surface area by more than 6 times, total pore volume by more than 8 times, and the average pore diameter by 1.3 times.
3.2. Optimization of the Parameters
Since the developed method is made up of two steps including DμSPE and SWLP (for extraction and preconcentration aims, respectively), the parameters of the extraction section are optimized followed by the parameters of the preconcentration section.
Initially, the weight of (Fe/Co) Bi-MOF underwent evaluation since it determines the efficiency of the Bi-MOF toward the pesticides and also the economic aspect of the method. For this aim, 5, 10, 15, 20, 25, and 30 mg of (Fe/Co) Bi-MOF were comparatively subjected to the extraction procedure while the other parameters were kept constant. The outcome of the experiments (Figure 2) reveals the preference for 20 mg Bi-MOF utilization over the evaluated weights in the case of all the target compounds. Lower than 20 mg Bi-MOF use results in low ERs which is due to the lack of sufficient sorbent presence in the solution of interest. Also, higher than 20 mg Bi-MOF utilization reduces the ER values which can stem from vortexing deficiency in the case of high-weight Bi-MOF uses in which the particles pile up and agglomerate in the solution. The sufficiency of 20 mg of (Fe/Co) Bi-MOF in the developed approach seems interesting and economical. Therefore, 20 mg was chosen as the optimum weight of the Bi-MOF and used in the next experiments.
Figure 2.

Optimization of the weight of (Fe/Co) Bi-MOF. Extraction conditions: DμSPE procedure: aqueous solution, 5 mL of deionized water spiked with 500 μg L–1 of each analyte having 1.0 mol L–1 dissolved Na2SO4; vortexing time in adsorption step, 5 min; desorption solvent (volume), ACN (200 μL); vortexing time in desorption step, 5 min; and centrifugation speed and time, 7000 rpm and 5 min, respectively. SWLP procedure: preconcentration solvent (volume), 1,2-DBE (13 μL); leaching solution (volume), deionized water (2 mL); MOF synthesis process, (Fe/Co) Bi-MOF. The error bars show the minimum and maximum of three repeated determinations.
Since the salting-out effect is a probable consequence of microextraction procedures, its effectiveness was assessed by testing the presence of dissolved Na2SO4 and NaCl (1 mol L–1 of each, separately) in the solutions and their comparison with the saltless one. The salting-out effect decreases the solubility of the target compounds and increases their tendency to be adsorbed onto the adsorbent. Figure 3 demonstrates the consequence of saltless, Na2SO4, and NaCl-containing solutions on the obtained ERs. It is obvious that in the case of most of the analytes, the presence of Na2SO4 and NaCl positively affects the extraction of the pesticides onto the Bi-MOF particles. In a precise look, it is found that Na2SO4 supersedes NaCl in heightening the ER values through the salting-out effect. Therefore, Na2SO4 was selected. The other optimization step was the concentration of Na2SO4 in the solution of interest. For this goal, 0.5, 1.0, 1.5, and 2.0 mol L–1 concentrations of Na2SO4 were prepared and subjected to extraction. Figure 4 shows the predominance of 1.0 mol L–1 Na2SO4 concentration over the experimented concentrations. This observation stems from the fact that higher than 1.0 mol L–1 concentrations increase the viscosity of the solution and restrict the migration of the analytes from the aqueous phase onto the Bi-MOF surface. Therefore, the ERs dwindle. Also, 0.5 mol L–1 concentration of Na2SO4 performs the salting-out effect deficiently in comparison to 1.0 mol L–1 concentration. Therefore, 1.0 mol L–1 Na2SO4 concentration was chosen as the optimum salt concentration in the DμSPE step.
Figure 3.

Influence of ionic strength on ERs of the analytes. Extraction conditions: the same as those used in Figure 2, except 20 mg of (Fe/Co) Bi-MOF was applied.
Figure 4.

Influence of Na2SO4 concentration on ERs of the analytes. Extraction conditions: the same as those used in Figure 3, except Na2SO4 was selected as the salting-out agent.
Changing the pH of the solution can affect the obtained ERs. pH alteration for the extraction of pesticides can result in diverse consequences. It can impress the structure of the analytes as well as the structure of the Bi-MOF. Also, it can be a potential agent for the deprotonation, ionization, or decomposition of the pesticides by adjusting the pH at severe acidic or basic conditions. These pH values can also decompose the Bi-MOF structure. Considering the facts, pH values of 4, 5, 6, 7, 8, 9, and 10 were tested. The outcome of the experiments (Figure 5) proves the preference of pHs 7 and 8 among the tested ones. The value of 7 stands for the pH of deionized water and 8 is the obtained pH value after dissolving Na2SO4. Because the presence of Na2SO4 positively affects the extraction efficiency, the autogenerated pH of 8 was chosen to be applied in the developed method.
Figure 5.

Influence of solution pH on ERs of the analytes. Extraction conditions are the same as those used in Figure 4, except 1 mol L–1 concentration of Na2SO4 was selected.
Vortexing as a facilitator agent helps decrease the extraction time by increasing the efficient contacts among the analytes and the Bi-MOF. Vortexing decreases the equilibrium time for the pesticide adsorption on the adsorbent. To assess this variable, 1, 3, 5, 7, and 9 min vortexing were tested to observe their effect on the ER values. It was obtained that (data not shown here) 5 min vortexing was sufficient to disperse the Bi-MOF particles well in the solution to adsorb the pesticides. Therefore, 5 min vortexing was adopted to be applied in the next experiments.
Following the adsorption of the analytes onto the (Fe/Co) Bi-MOF particles, the use of a desorption solvent is inevitable to convey the analytes into an organic phase. To accomplish this goal, methanol, 2-propanol, and ACN were used (200 μL of each, separately). To get 10 ± 0.5 μL of the sedimented phase, 14, 14, and 15 μL of 1,2-DBE were used for the cases of ACN, methanol, and 2-propanol, respectively. The desorption process was propelled via vortexing the pesticide-loaded Bi-MOF particles in the desorption solvent medium. Figure 6 shows the efficiency of the three tested desorption solvents. It is seen that in the case of most of the analytes, ACN shows a relatively better performance in the desorption of the target compounds from the applied Bi-MOF. Therefore, ACN was used as the desorption solvent in this method. After the selection of the desorption solvent type, its volume was investigated using different ACN volumes including 100, 200, 300, 400, 500, and 600 μL. To obtain 10 ± 0.5 μL of the sedimented phase 14, 14, 14, 15, 16, and 17 μL of 1,2-DBE were utilized, respectively. Figure 7 demonstrates that 400 μL ACN utilization results in the highest ERs in most of the surveyed pesticides. This is because the use of lower than 400 μL desorption solvent results in deficient desorption of the analytes from the applied Bi-MOF. Also, higher than 400 μL ACN decreases the ERs which can be due to analyte loss through analyte partitioning between the ACN phase and the leaching aqueous phase during the implementation of the SWLP step. Applying only μL level of the desorption solvent supports the greenness of the method. Therefore, 400 μL of ACN was applied.
Figure 6.

Selection of desorption solvent type. Extraction conditions are the same as those used in Figure 5, except no pH variation was done.
Figure 7.

Optimization of ACN volume. Extraction conditions are the same as those used in Figure 6, except ACN was selected as the desorption solvent.
In the next step, the preconcentration solvent type was evaluated by testing 1,2-DBE, carbon tetrachloride, and 1,1,1-TCE with the volumes of 15, 18, and 19 μL, respectively, to obtain 10 ± 0.5 μL of the sedimented phase. Figure 8 illustrates that the ER values precede when using 1,2-DBE as the preconcentration solvent. Therefore, the volume of 1,2-DBE was altered in the range of 15, 17, 20, and 23 μL. The outcome of the analyses (data not shown here) revealed the preference for 15 μL 1,2-DBE over the other tested volumes. This observation stems from the dilution effect which happens for the sedimented phase by increasing its volume. Therefore, 15 μL of 1,2-DBE was applied as the preconcentration solvent.
Figure 8.

Selection of preconcentration solvent. Extraction conditions are the same as those used in Figure 7, except 400 μL of ACN was chosen as the desorption solvent volume.
Vortexing is also inevitable in the desorption of the analytes from the Bi-MOF surface. After the addition of the mixture of 400 μL of ACN and 15 μL of 1,2-DBE onto the pesticide-loaded Bi-MOF particles, 1, 3, 5, 7, and 9 min vortexing were tested to observe their consequence on the obtained ERs. The evaluation revealed that (data not shown here) 5 min vortexing was enough to desorb the previously adsorbed analytes from the adsorbent. Therefore, 5 min vortexing was adopted to propel the rest of the optimization steps.
For appraising the efficiency of the SWLP step, the absence and presence of NaCl or Na2SO4 in the leaching solution were investigated to see if their presence acts as antiback-extraction agents. For this purpose, the ERs of the analytes in the case of using deionized water as a leaching solvent were compared with the obtained ERs when NaCl or Na2SO4 solution was used in leaching the extracted phase containing ACN and 1,2-DBE. Figure 9 illustrates the ERs of the analytes when leaching the extracted phase using 2 mL of saltless, NaCl, and Na2SO4 solutions (5%, w/v, of each, separately). For obtaining 10 ± 0.5 μL of the sedimented phase, 15, 11, and 11 μL of 1,2-DBE were used, respectively. It is observed that NaCl solution enhances the ER values of the analytes. This observation denotes that the presence of NaCl in the leaching solution successfully acts as an antiback-extraction agent which prohibits the analytes from migrating from the organic into the aqueous phase during the leaching process. Therefore, NaCl solution was chosen to be applied as the leaching solution of the method. The following important parameter to be evaluated was NaCl concentration in the leaching solution. To appraise this parameter, 1, 5, 10, and 15% (w/v) NaCl solutions were prepared and the extracted phases containing the pesticides were leached by them. For obtaining 10 ± 0.5 μL of the sedimented phase, 13, 11, 10, and 8 μL of 1,2-DBE were applied, respectively. Figure 10 demonstrates the predominance of 10% (w/v) NaCl solution over the other tested ones. It is understood that lower than 10% (w/v) NaCl solutions result in low ER values based on deficient performing the antiback-extraction effect. Also, 15% (w/v) NaCl solution decreases the ER values which is due to changing the composing solvents ratio of the sedimented phase. In the case of applying 15% (w/v) NaCl solution as the leaching solvent, the ACN content of the sedimented phase increases, and this phenomenon decreases the extraction of the analytes due to the deficiency of the extraction by ACN in comparison to 1,2-DBE. It is noted that as mentioned above, in the case of using 15% (w/v) NaCl solution, only 8 μL of 1,2-DBE was used to obtain 10 μL of the sedimented phase. Therefore, at high concentrations of NaCl, the solubility of ACN decreases in the aqueous phase and a portion of the sedimented phase belongs to ACN. Therefore, 2 mL of 10% (w/v) NaCl solution was used as the leaching aqueous solution.
Figure 9.

Selection of leaching solution. Extraction conditions are the same as those used in Figure 8, except 1,2-DBE was used as the preconcentration solvent.
Figure 10.

Optimization of NaCl concentration in the leaching solution. Extraction conditions are the same as those used in Figure 9, except NaCl was used as the antiback-extraction agent in the SWLP step.
The other parameter related to the SWLP section of the developed method is the volume of the leaching solution. To appraise this parameter, 2, 3, and 4 mL of 10% (w/v) NaCl solution were evaluated. For obtaining 10 ± 0.5 μL of the sedimented phase, 10, 13, and 14 μL of 1,2-DBE were used, respectively. It is noted that, in the case of 1 mL leaching solution, the organic phase was collected on top of the aqueous solution, and shaking did not sediment the extracted phase. Therefore, 1 mL was not applicable to perform the preconcentration method. Figure 11 shows that the ER values are approximately the same during changing the leaching solution volume. This phenomenon shows that increasing the leaching solution has no positive impact on the ER values. On the other hand, it requires more preconcentration solvent, deionized water, and NaCl which is not economical. Therefore, only 2 mL of the leaching solution was selected.
Figure 11.

Optimization of leaching solution volume. Extraction conditions are the same as those used in Figure 10 except, 10%, w/w of NaCl solution was used in the SWLP step.
The pH of the leaching solvent can also play a role in altering the obtained ERs. In this step, pH variation can affect the analyte stability. Different pH values were set for the applied leaching solution in the range of 3, 5, 7, 9, and 11. It was observed (data not shown here) that acidic or basic pH values led the analytes to ionization or deprotonation which enhanced their solubility in the leaching solution. This resulted in decreasing the ER values. Therefore, the leaching solution was applied with no pH alterations.
The prominent parameter which is based on the methodological aspect of the research is the evaluation of the analytical performance of (Fe/Co) Bi-MOF* which was developed in this study and also (Fe/Co) Bi-MOF which had been reported previously. To appraise their analytical efficiency, 20 mg of each of the Bi-MOF samples was subjected to the developed extraction procedure. Figure 12 shows the differences in the obtained ER values by applying the two Bi-MOFs. It is seen that (Fe/Co) Bi-MOF* results in higher ER values in comparison to its previously introduced homologue. This valuable observation stems from the increased surface area, total pore volume, and average pore diameter, and also distinctness and not agglomerated Bi-MOF particles that have been thoroughly discussed in sec. 3.1. Therefore, (Fe/Co) Bi-MOF* was selected in the developed method due to the enhanced ERs it results in.
Figure 12.

Comparison of the extraction efficiency between the synthesized Bi-MOFs. Extraction conditions are the same as those used in Figure 11, except 2 mL of 10%, w/v NaCl solution was used in the SWLP step.
The other parameter for optimization can be the content of the desorption solvent. This variable can be appraised by desorbing the pesticides from the Bi-MOF using the mixture of 400 μL ACN and 10 μL 1,2-DBE, and also just 400 μL ACN in which 10 μL 1,2-DBE was added into it after the desorption and before the implementation of the SWLP step. The mentioned procedures were performed and compared to observe their effects on the ER values of the analytes. Figure 13 demonstrates that in the cases of fenitrothion, malathion, and hexaconazole a light betterment is seen in the obtained ERs. In the cases of the rest of the target compounds, the resulting ER values for the adopted two approaches are almost the same. Moreover, there was another practical difference between the two implemented approaches. In the case of using the mixture of the two solvents (ACN and 1,2-DBE) in the desorption step, the Bi-MOF particles that were stuck to the bottom perimeter of the conical glass test tube after the centrifugation of the DμSPE step were completely separated from the tube and vortexed during the desorption vortexing step. In the case of ACN use during the desorption, although the desorption aim is done, the stuck Bi-MOF particles to the test tube are not separated during vortexing. This can be the origin of deficient desorption in the case of some target compounds. Therefore, the mixture of 400 μL ACN and 10 μL 1,2-DBE was applied in the desorption section.
Figure 13.

Choosing the desorption solvent composition. Extraction conditions are the same as those used in Figure 12, except (Fe/Co) Bi-MOF* was chosen as the adsorbent.
3.3. Validation of the Approach
After reaching the optimum conditions of the developed method, the figures of merit including relative standard deviation (RSD), LR, coefficient of determination (r2), EF, ER, LOD, and LOQ were calculated and presented in Table 1. According to the consolidated data in the table, The RSDs, calculated by the extraction of 30 μg L–1 concentration of each analyte, were in the ranges of 3.1–4.5% for intra- (n = 6) and 3.5–5.2% for interday (n = 4) precisions. The LRs were found to be 5.44–1600 μg L–1 which covers a considerably wide range of concentrations. The LOD values were in the range of 0.67–1.65 μg L–1. The LOQs were in the range of 2.21–5.44 μg L–1. The obtained LOD and LOQ data promise the implementation of low-concentration detection and determination by the developed method. The r2 values ranged from 0.991 to 0.999. High EFs thanks to the SWLP approach were in the range of 305–475. Also, appreciable ERs were found to be in the range of 61–95% demonstrating the migration of the majority of the target compounds from the aqueous into the extracted phase.
Table 1. Figures of Merit Obtained for the Developed Analytical Method.
| analyte | LODa | LOQb | LRc | r2d | RSD %e | calibration curve equation | EF ± SDf | ER ± SDg | |
|---|---|---|---|---|---|---|---|---|---|
| intraday interday | |||||||||
| acetochlor | 0.70 | 2.31 | 2.31–1600 | 0.993 | 3.7 | 4.3 | y = 52919x + 234.45h | 460 ± 10 | 92 ± 2 |
| fenitrothion | 1.45 | 4.78 | 4.78–1600 | 0.997 | 4.5 | 5.2 | y = 23571x – 9000 | 305 ± 15 | 61 ± 3 |
| malathion | 1.65 | 5.44 | 5.44–1600 | 0.993 | 4.2 | 4.8 | y = 24823x – 419.14 | 370 ± 10 | 74 ± 2 |
| haloxyfop-R-methyl | 0.67 | 2.21 | 2.21–1600 | 0.994 | 3.1 | 3.5 | y = 73469x – 4057.4 | 475 ± 5 | 95 ± 1 |
| hexaconazole | 1.15 | 3.79 | 3.79–1600 | 0.999 | 4.4 | 5.0 | y = 41062x – 6164.4 | 385 ± 15 | 77 ± 3 |
| oxadiazon | 0.92 | 3.03 | 3.03–1600 | 0.995 | 4.1 | 4.7 | y = 36722x + 1564.6 | 470 ± 5 | 94 ± 1 |
| diniconazole | 0.80 | 2.64 | 2.64–1600 | 0.991 | 3.6 | 4.1 | y = 52257x – 4484.9 | 405 ± 10 | 81 ± 2 |
Limit of detection (S/N = 3) (μg L–1).
Limit of quantification (S/N = 10) (μg L–1).
Linear range (μg L–1).
Coefficient of determination.
Relative standard deviation at a concentration of 30 μg L–1 of each analyte for intra- (n = 6) and interday (n = 4) precisions.
Enrichment factor ± standard deviation (n = 3).
Extraction recovery ± standard deviation (n = 3).
y = peak area and x = concentration (μg L–1).
3.4. Analysis of Real Samples
After the development of the DμSPE-SWLP method for the extraction of different pesticides and performing the related optimization procedures in the aqueous medium, the extraction process was performed in three real samples including apple, orange, and peach juices. The relative recovery data obtained via the extraction of the target compounds from aqueous solution and juice samples spiked at the concentrations of 50 and 100 μg L–1 are presented in Table 2. 1:4 (v/v, juice: deionized water) dilution was implemented on the surveyed real samples to reduce their matrix effect. As can be seen, satisfactory relative recovery data were obtained for the extraction of the pesticides from the juice samples. Also in Figure 14, there are three chromatograms representing the direct injection of 500 mg L–1 concentration of the analytes with respect to each of them, extraction of the analytes from the aqueous solution at the concentration of 500 μg L–1 of each, and the orange juice sample subjected to the extraction procedure. None of the surveyed pesticides were detected in the extracted real samples. For the properness of the developed method, three points can be explained. (1) This section discusses the usability of the developed method in different real samples. Actually, different chemicals such as vitamins and various phytochemical compounds exist in such juice samples that can have effects on the properness of the extraction procedure which were reduced by dilution. According to Table 2, the dilution paves the way for the successful adsorption and extraction of the target compounds from the matrix of real samples. (2) Moreover, the developed extraction and preconcentration method in this study is raised by optimization of the influencing parameters to enhance the extraction efficiency of the analytes from the aqueous phase. Therefore, in performing each of the optimization steps the method was getting more sensitive and selective toward the extraction of the target compounds since the variables that led to the highest ERs of the analytes were selected for the further steps. Thus, it can be concluded that the method has become more selective and specific for the extraction of the analytes during the optimization procedures. (3) Furthermore, the detection system applied after the developed extraction procedure in this study was a gas chromatograph equipped with a flame ionization detector. As you know, gas chromatography is capable of separating the target compounds from the coextractive chemicals extracted from the real sample based on the applied chromatographic column. Therefore, even if any impurities are extracted alongside the analytes by applying the process, the chromatographic system can successfully separate the analytes from the interfering compounds to detect and determine the analyte precisely.
Table 2. Study of the Matrix Effect in Juice Samples Spiked at Two Concentrations.
| analyte | mean relative
recovery ± standard deviation (n = 3) |
||
|---|---|---|---|
| apple juice | orange juice | peach juice | |
| all samples were spiked with each analyte at a concentration of 50 μg L–1. | |||
| acetochlor | 94 ± 3 | 93 ± 3 | 103 ± 4 |
| fenitrothion | 93 ± 3 | 95 ± 3 | 100 ± 2 |
| malathion | 86 ± 2 | 89 ± 2 | 95 ± 2 |
| haloxyfop-R-methyl | 94 ± 3 | 96 ± 2 | 94 ± 3 |
| hexaconazole | 96 ± 2 | 92 ± 3 | 94 ± 1 |
| oxadiazon | 100 ± 1 | 97 ± 3 | 107 ± 2 |
| diniconazole | 98 ± 3 | 99 ± 2 | 93 ± 3 |
| all samples were spiked with each analyte at a concentration of 100 μg L–1. | |||
| acetochlor | 96 ± 4 | 95 ± 2 | 98 ± 3 |
| fenitrothion | 95 ± 2 | 90 ± 3 | 97 ± 3 |
| malathion | 87 ± 2 | 90 ± 3 | 96 ± 1 |
| haloxyfop-R-methyl | 100 ± 1 | 101 ± 2 | 93 ± 2 |
| hexaconazole | 90 ± 2 | 97 ± 3 | 98 ± 3 |
| oxadiazon | 97 ± 3 | 104 ± 2 | 104 ± 4 |
| diniconazole | 93 ± 3 | 94 ± 4 | 100 ± 3 |
Figure 14.
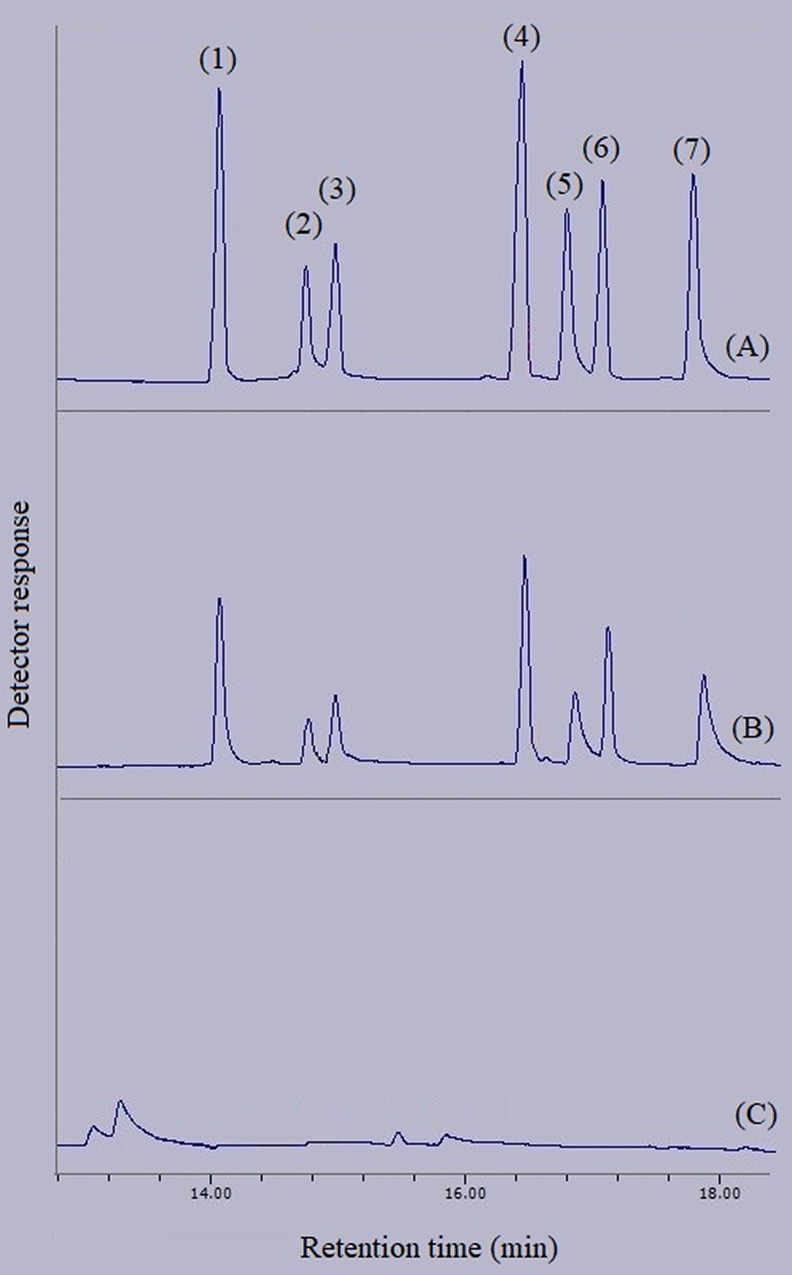
GC-FID chromatograms of: (A) standard solution (500 mg L–1 of each pesticide in methanol), (B) deionized water spiked with 500 μg L–1 of each pesticide, and (C) orange juice. Except chromatogram A in which direct injection without preconcentration was done, in the other chromatograms, the final extracted phase was injected into the separation system. Peaks identification: (1) acetochlor, (2) fenitrothion, (3) malathion, (4) haloxyfop-R-methyl, (5) hexaconazole, (6) oxadiazon, and (7) diniconazole.
3.5. Comparison of the DμSPE-SWLP Method with Some Other Methods
To provide comprehensive comparative data among the resulting figures of merit in the present study and the similar approaches documented previously, Table 3 was consolidated. As can be observed the obtained ERs exceed the previously reported ones. Inevitably, the EFs, demonstrating the accomplished preconcentration by applying SWLP, are higher than most of the compared EF values. The RSD values that are important data to show the repeatability of the obtained signals by applying the method are seen to be comparable or lower than the compared RSDs. The r2 values, showing the linearity of the calibration curves for the surveyed analytes, are favorable and comparable with the approaches. LRs are comparable with or wider than the ones presented in the table. Also, low LODs and LOQs demonstrate the efficiency of the method for the detection and quantification of the target compounds. The adaptability of the approach in different juice matrices is also an asset. Using the low weight of the Bi-MOF to propel the method helps to increase the greenness of the approach. One of the most considerable facets of the approach is significantly low-level organic solvent utilization. It is observable in the table that the volume of the organic solvents used in this method is lower than all of the compared methods which means that only by applying 410 μL of organic solvents, the method can be done.
Table 3. Comparison of the Newly Developed Method with Some Similar Approaches Developed Previously.
| method | analytes | sample | LODa | LOQb | LRc | r2d | RSDe | EFf | ERg | organic solvents (volume-mL) | ref. |
|---|---|---|---|---|---|---|---|---|---|---|---|
| SDLLME-HPLC-UVh | haloxyfop-R-methyl | water | 4.35 | 4.35–300 | 0.999 | 3.12 | 171 | 78.4 | lithium bis [(trifluoromethane)sulfonyl] imide (0.415) Chlorobenzene (0.030) | (41) | |
| SPE-HPLC-MS-MSi | haloxyfop-R-methyl | tomato juice | 10–500 | 0.990 | 11 | methanol (70.0) | (42) | ||||
| MCNT-modified QuChERS-GC-MSj | difenoconazole | cowpea | 2.0 | 6.0 | 0.998 | 4.7 | ACN (10.0) | (43) | |||
| DμSPE-DLLME-GC-FIDk | haloxyfop-R-methyl | fruit juices | 038 | 1.27 | 1.27–2000 | 0.996 | 4.7 | 295 | 59 | ACN (1.0) 1,1,1-TCE (0.031) | (9) |
| oxadiazon | 0.48 | 1.58 | 1.58–2000 | 0.993 | 6.1 | 310 | 62 | ||||
| diniconazole | 0.76 | 2.47 | 2.47–2000 | 0.991 | 6.8 | 175 | 35 | ||||
| HILME-HPLC-UVl | oxadiazon | soil | 20 | 66 | 66–2000 | 0.999 | 4.7 | 90 | ACN (50.0) | (44) | |
| PD-SPME-GC-MSm | diniconazole | water | 0.008 | 0.01–200 | 0.994 | 5.1 | (45) | ||||
| DLLME-GC-ECDn | hexaconazole | pear | 0.03 | 0.5–20 | 0.999 | 785 | ACN (0.8) 1,1,2,2-tetrachloroethane (0.014) | (46) | |||
| diniconazole | 0.04 | 0.5–20 | 0.998 | 750 | |||||||
| VA-IL-DLLME-HPLC-DADo | diniconazole | fruit juices | 5 | 10–15,000 | 0.997 | ACN (0.25) 1-hexyl-3-ethylimidazolium hexafluorophosphate (0.070) | (47) | ||||
| ASPE-GC-MSp | fenitrothion | surface water samples | 0.002 | 0.006–50 | 0.999 | 2.7 | methanol (5.0) | (48) | |||
| DI-SPME-GC-MSq | malathion | water samples | 0.058 | 0.17 | 0.17–200 | 0.991 | 7.4 | solvent-free | (49) | ||
| haloxyfop-R-methyl | 0.062 | 0.19 | 0.19–200 | 0.996 | 1.7 | ||||||
| DμSPE-SWLP-GC-FIDr | acetochlor | fruit juices | 0.70 | 2.31 | 2.31–1600 | 0.993 | 3.7 | 460 | 92 | ACN (0.4) 1,2-DBE (0.010) | this method |
| fenitrothion | 1.45 | 4.78 | 4.78–1600 | 0.997 | 4.5 | 305 | 61 | ||||
| malathion | 1.65 | 5.44 | 5.44–1600 | 0.993 | 4.2 | 370 | 74 | ||||
| haloxyfop-R-methyl | 0.67 | 2.21 | 2.21–1600 | 0.994 | 3.1 | 475 | 95 | ||||
| 1.15 | 3.79 | 3.79–1600 | 0.999 | 4.4 | 385 | 77 | |||||
| hexaconazole | 0.92 | 3.03 | 3.03–1600 | 0.995 | 4.1 | 470 | 94 | ||||
| oxadiazon | 0.80 | 2.64 | 2.64–1600 | 0.991 | 3.6 | 405 | 81 | ||||
| diniconazole |
Limit of detection (μg L–1).
Limit of quantification (μg L–1).
Linear range (μg L–1).
Coefficient of determination.
Relative standard deviation (%).
Enrichment factor.
Extraction recovery (%).
Sequential dispersive liquid–liquid microextraction–high-performance liquid chromatography-ultraviolet detector.
Solid phase extraction-high performance liquid chromatography-tandem mass spectrometry.
Multiwall carbon nanotubes-based quick easy cheap effective rugged and safe extraction-gas chromatography–mass spectrometry.
Dispersive micro solid phase extraction-dispersive liquid–liquid microextraction-gas chromatography-flame ionization detection.
Homogeneous ionic liquid-based microextraction coupled with high-performance liquid chromatography-ultraviolet detection.
Polythiophene dendrimer coated solid phase microextraction-gas chromatography–mass spectrometry.
Dispersive liquid–liquid microextraction-gas chromatography-electron capture detection.
Vortex-assisted ionic liquid-based dispersive liquid–liquid microextraction-high-performance liquid chromatography–diode array detection.
Automated solid phase extraction-gas chromatography–mass spectrometry.
Direct immersion solid phase microextraction-gas chromatography–mass spectrometry.
Dispersive micro solid phase extraction-streamlined water-leaching preconcentration–gas chromatography–flame ionization detection.
3.6. Interaction Mechanism of the MOF and the Target Compounds
After performing the optimization steps of the developed MOF-based DμSPE-SWLP method for the extraction and preconcentration of seven pesticides including acetochlor, fenitrothion, malathion, haloxyfop-R-methyl, hexaconazole, oxadiazon, and diniconazole it was observed that high ER values were recorded for the target compounds which were in the range of 61–95%. This observation stems from efficient intermolecular interactions that have been created between the analytes and the MOF. In a precise look, it can be obtained that π–π stacking occurs between the π system in the cyclic section of the MOF ligand and the cyclic sections of all the above-mentioned target compounds, except for malathion. In the case of malathion, π–π stacking can take place between the conjugated section of the MOF ligand with carbon to oxygen and phosphorus to sulfur double bonds. Also, hydrogen bonds can be created among the oxygen atoms of the organic section of (Fe/Co) Bi-MOF* and oxygen-attached hydrogen in hexaconazole and diniconazole. The unreacted carboxylate section of the MOF ligand can generate hydrogen bonds with the analytes through the ligand’s acidic hydrogen with nitrogen and oxygen atoms of all the analytes, except for malathion in which just the oxygen atoms are correlated with hydrogen bonds. Halogen bonds are also generated in the case of the presence of a halogen atom and π system, Lewis base, or anions. In this study, halogen bonds have been created among the π system and oxygen atoms of the MOF ligand and chlorine atoms in acetochlor, hexaconazole, oxadiazon, and diniconazole, and chlorine and fluorine atoms of haloxyfop-R-methyl. In the case of malathion, π–π stacking between cyclic sections has no role in the creation of intermolecular bonds between the analyte and the MOF. The experimental proof for this observation can be the relatively lower ER values obtained for malathion in comparison to most of the surveyed analytes. Therefore, it can be seen that the positive effect of π–π stacking has improved the extraction of the target compounds from the aqueous medium, except for malathion. So, it can be concluded that there are efficient intermolecular interactions between the surveyed analytes and the MOF for their successful extraction from real samples.
4. Conclusions
This study benefits from two main novel aspects. The first one is the development of a new preconcentration method called SWLP. It was shown to have many advantages over gas-assisted evaporation and DLLME by decreasing analyte loss, the volume of organic solvents and deionized water, operation time, apparatus, and energy for the accomplishment of the method. The second aspect is the methodological study for the synthesis of (Fe/Co) Bi-MOF in which the amendments in the Bi-MOF provision led to the betterment of the analytical performance by enhancing the surface area, total pore volume, average pore diameter, and distinctiveness of the produced Bi-MOF particles that enhanced the surface-to-volume ratio. Different analyses including XRD, FTIR, BET, SEM, and EDX were done to bring the methodology under scrutiny. Bi-MOF-based DμSPE-SWLP-GC-FID was evolved to monitor the presence and concentration of pesticides in different juice matrices. High ERs (61–95%) and EFs (305–475), low RSDs (3.1–4.5% for intra- (n = 6) and 3.5–5.2% for interday (n = 4) precisions), LODs (0.67–1.65 μg L–1) and LOQs (2.21–5.44 μg L–1), and wide LRs (5.44–1600 μg L–1) were documented for the developed method. Further research can focus on the coupling of SWLP to different extraction procedures and for different analytes in analytical and bioanalytical applications to increase the method’s efficiency. Also, the prepared (Fe/Co) Bi-MOF* can be applied as an enhanced Bi-MOF for various catalytic and adsorptive applications.
Acknowledgments
The authors are thankful to the University of Tabriz for financial support.
Glossary
Abbreviations
- DLLME
Dispersive liquid–liquid microextraction
- DSPE
Dispersive solid phase extraction
- DμSPE
Dispersive micro solid phase extraction
- EF
Enrichment factor
- (Fe/Co) Bi-MOF
Iron/cobalt bimetallic-organic framework
- FID
Flame ionization detector
- GC
Gas chromatography
- LOD
Limit of detection
- LOQ
Limit of quantification
- LR
Linear range
- RSD
Relative standard deviation
- SWLP
Streamlined water-leaching preconcentration
The authors declare no competing financial interest.
References
- Nasiri M.; Ahmadzadeh H.; Amiri A. Sample preparation and extraction methods for pesticides in aquatic environments: A review. Trends Anal. Chem. 2020, 123, 115772 10.1016/j.trac.2019.115772. [DOI] [Google Scholar]
- Economou A.; Botitsi H.; Antoniou S.; Tsipi D. Determination of multi-class pesticides in wines by solid-phase extraction and liquid chromatography-tandem mass spectrometry. J. Chromatogr. A 2009, 1216, 5856–5867. 10.1016/j.chroma.2009.06.031. [DOI] [PubMed] [Google Scholar]
- Liang D.; Liu W.; Raza R.; Bai Y.; Liu H. Applications of solid-phase micro-extraction with mass spectrometry in pesticide analysis. J. Sep. Sci. 2019, 42, 330–341. 10.1002/jssc.201800804. [DOI] [PubMed] [Google Scholar]
- Velasco E.; Ríos-Acevedo J.; Sarria-Villa R.; Rosero-Moreano M. Green method to determine triazine pesticides in water using rotating disk sorptive extraction (RDSE). Heliyon 2021, 7, e07878 10.1016/j.heliyon.2021.e07878. [DOI] [PMC free article] [PubMed] [Google Scholar]
- Schellin M.; Hauser B.; Popp P. Determination of organophosphorus pesticides using membrane-assisted solvent extraction combined with large volume injection-gas chromatography-mass spectrometric detection. J. Chromatogr. A 2004, 1040, 251–258. 10.1016/j.chroma.2004.04.006. [DOI] [PubMed] [Google Scholar]
- Wu J.; Lu J.; Wilson Ch.; Lin Y.; Lu H. Effective liquid-liquid extraction method for analysis of pyrethroid and phenylpyrazole pesticides in emulsion-prone surface water samples. J. Chromatogr. A 2010, 1217, 6327–6333. 10.1016/j.chroma.2010.08.004. [DOI] [PubMed] [Google Scholar]
- Song G.; Wang X.; Romero C.; Chen H.; Yao Zh.; Kaziunas A.; Schlake R.; Anand M.; Lowe T.; Driscoll G.; Kreglow B.; Schobert H.; Baltrusaitis J. Extraction of selected rare earth elements from anthracite acid mine drainage using supercritical CO2 via coagulation and complexation. J. Rare Earth 2021, 39, 83–89. 10.1016/j.jre.2020.02.007. [DOI] [Google Scholar]
- Esrafili A.; Baharfar M.; Tajik M.; Yamini Y.; Ghambarian M. Two-phase hollow fiber liquid-phase microextraction. Trends Anal. Chem. 2018, 108, 314–322. 10.1016/j.trac.2018.09.015. [DOI] [Google Scholar]
- Pezhhanfar S.; Farajzadeh M.-A.; Hosseini-Yazdi S.-A.; Afshar Moghaddam M.-R. Synthesis of MOF-70 based on diffusion method; microgram amount application as a highly efficient sorbent in dispersive micro solid phase extraction prior to dispersive liquid-liquid microextraction for the preconcentration and extraction of pesticides from fruit juices. J. Iran Chem. Soc. 2022, 19, 2407–2419. 10.1007/s13738-021-02456-w. [DOI] [Google Scholar]
- Pezhhanfar S.; Farajzadeh M.-A.; Hosseini-Yazdi S.-A.; Afshar Moghaddam M.-R. AlFu nano MOF-based dispersive micro solid phase extraction of pesticides; the comparison of preconcentration via evaporation and dispersive liquid-liquid microextraction. Int. J. Environ. Anal. Chem. 2023, 1–20. 10.1080/03067319.2023.2201447. [DOI] [Google Scholar]
- Pezhhanfar S.; Farajzadeh M.-A.; Mohsen Daraei N.; Taghipour BaghaliNobar N.; Hosseini-Yazdi S.-A.; Afshar Mogaddam M.-R. The application of CuGA MOF in a food safety monitoring procedure specialized for parsley juice with no dilution via extraction and preconcentration of its pesticides. Microchem. J. 2023, 191, 108819 10.1016/j.microc.2023.108819. [DOI] [Google Scholar]
- Seebunrueng K.; Santaladchaiyakit Y.; Srijaranai S. Vortex-assisted low density solvent liquid-liquid microextraction and salt-induced demulsification coupled to high performance liquid chromatography for the determination of five organophosphorus pesticide residues in fruits. Talanta 2015, 132, 769–774. 10.1016/j.talanta.2014.10.020. [DOI] [PubMed] [Google Scholar]
- Hernández F.; Cervera M.-I.; Portolés T.; Beltrána J.; Pitarch E. The role of GC-MS/MS with triple quadrupole in pesticide residue analysis in food and the environment. Anal. Methods 2013, 5, 5875–5894. 10.1039/C3AY41104D. [DOI] [Google Scholar]
- Hernandez-Borges J.; Frias-Garcia S.; Cifuentes A.; Rodriguez-Delgado M.-A. Pesticide analysis by capillary electrophoresis. J. Sep. Sci. 2004, 27, 947–963. 10.1002/jssc.200401820. [DOI] [PubMed] [Google Scholar]
- Hu Y.-H.; Zhang L. Hydrogen storage in metal-organic framework. Adv. Mater. 2010, 22, E117–E130. 10.1002/adma.200902096. [DOI] [PubMed] [Google Scholar]
- Haldar D.; Duarah P.; Kumar Purkait M. MOFs for the treatment of arsenic, fluoride and iron contaminated drinking water: A review. Chemosphere 2020, 251, 126388 10.1016/j.chemosphere.2020.126388. [DOI] [PubMed] [Google Scholar]
- Ren Y.; Chia G.-H.; Gao Zh. Metal-organic frameworks in fuel cell technologies. Nanotoday 2013, 8, 577–597. 10.1016/j.nantod.2013.11.004. [DOI] [Google Scholar]
- Xamena F.-X.-L.; Abad A.; Corma A.; Garcia H. MOFs as catalysts: Activity, reusability and shape-selectivity of a Pd-containing MOF. J. Catal. 2007, 250, 294–298. 10.1016/j.jcat.2007.06.004. [DOI] [Google Scholar]
- Furukawa H.; Cordova K.-E.; O’Keeffe M.; Yaghi O.-M. The chemistry and applications of metal-organic frameworks. Science 2013, 341, 1230444 10.1126/science.1230444. [DOI] [PubMed] [Google Scholar]
- Yang C.-X.; Liu S.-S.; Wang H.-F.; Wang S.-W.; Yan X.-P. High-performance liquid chromatographic separation of position isomers using metal-organic framework MIL-53(Al) as the stationary phase. Analyst 2012, 137, 133–139. 10.1039/C1AN15600D. [DOI] [PubMed] [Google Scholar]
- Aquino A.; Wanderley K.-A.; Paiva-Santos C.-D.-O.-G.; de Sa F.; Alexandre M.-D.-R.-S.; Junior A.; Navickiene S. Coordination polymer adsorbent for matrix solid-phase dispersion extraction of pesticides during analysis of dehydrated Hyptis pectinata medicinal plant by GC/MS. Talanta 2010, 83, 631–636. 10.1016/j.talanta.2010.10.014. [DOI] [PubMed] [Google Scholar]
- Alizadeh R.; Arbandi F.; Kashefolgheta S.; Seidi Sh. A new generation of solid-phase microextraction based on breathing of metal organic framework nanorods MOF-508 for the determination of diazinon and chlorpyrifos in wheat samples. Microchem. J. 2021, 171, 106876 10.1016/j.microc.2021.106876. [DOI] [Google Scholar]
- Liu G.; Li L.; Huang X.; Zheng Sh.; Xu D.; Xu X.; Zhang Y.; Lin H. Determination of triazole pesticides in aqueous solution based on magnetic graphene oxide functionalized MOF-199 as solid phase extraction sorbents. Microporous Mesoporous Mater. 2018, 270, 258–264. 10.1016/j.micromeso.2018.05.023. [DOI] [Google Scholar]
- Guo X.-Y.; Dong Z.-P.; Zhao F.; Liu Z.-L.; Wang Y.-Q. Zinc(II) organic framework as a multi-responsive photoluminescence sensor for efficient and recyclable detection of pesticide 2,6- dichloro-4-nitroaniline, Fe(III) and Cr(VI). New J. Chem. 2019, 43, 2353–2361. 10.1039/C8NJ05647A. [DOI] [Google Scholar]
- Huang Zh.; Lee H.-K. Micro-solid-phase extraction of organochlorine pesticides using porous metal-organic framework MIL-101 as sorbent. J. Chromatogr. A 2015, 1401, 9–16. 10.1016/j.chroma.2015.04.052. [DOI] [PubMed] [Google Scholar]
- Ghorbani Y.-A.; Ghoreishi S.-M.; Ghani M. Micro-solid phase extraction of volatile organic compounds in water samples using porous membrane-protected melamine-modified MIL-88 followed by gas chromatography-mass spectrometry. Polycyc. Aromat. Comp. 2022, 42, 5496–5507. 10.1080/10406638.2021.1954038. [DOI] [Google Scholar]
- Amareh N.; Yamini Y.; Saeidi M.; Ghaemmaghami M. Zeolitic imidazole framework-67 coated stainless steel fiber for solid-phase microextraction of some alcohols in alcoholic beverage samples. Chem. Pap. 2023, 77, 4923. 10.1007/s11696-023-02829-w. [DOI] [Google Scholar]
- Mirzajani R.; Kardani F.; Ramezani Z. Fabrication of UMCM-1 based monolithic and hollow fiber-metal-organic framework deep eutectic solvents/molecularly imprinted polymers and their use in solid phase microextraction of phthalate esters in yogurt, water and edible oil by GC-FID. Food Chem. 2020, 314, 126179–126191. 10.1016/j.foodchem.2020.126179. [DOI] [PubMed] [Google Scholar]
- Corma A.; García H.; Llabrés I.; Xamena F.-X. Engineering metal organic frameworks for heterogeneous catalysis. Chem. Rev. 2010, 110, 4606–4655. 10.1021/cr9003924. [DOI] [PubMed] [Google Scholar]
- Cooper J.; Dobson H. The benefits of pesticides to mankind and the environment. Crop Protect. 2007, 26, 1337–1348. 10.1016/j.cropro.2007.03.022. [DOI] [Google Scholar]
- Li Y.; Fang R.; Liu Z.; Jiang L.; Zhang J.; Li H.; Liu Ch.; Li F. The association between toxic pesticide environmental exposure and Alzheimer’s disease: A scientometric and visualization analysis. Chemosphere 2021, 263, 128238 10.1016/j.chemosphere.2020.128238. [DOI] [PubMed] [Google Scholar]
- Allen M. T.; Levy L.-S. Parkinson’s disease and pesticide exposure-a new assessment. Critic. Rev. Toxicol. 2013, 43, 515–534. 10.3109/10408444.2013.798719. [DOI] [PubMed] [Google Scholar]
- Everett C.; Matheson E. Biomarkers of pesticide exposure and diabetes in the 1999–2004 national health and nutrition examination survey. Environ. Int. 2010, 36, 398–401. 10.1016/j.envint.2010.02.010. [DOI] [PubMed] [Google Scholar]
- Lynch S.; Mahajan R.; Beane L.; Hoppin J.; Alavanja M. Cancer incidence among pesticide applicators exposed to butylate in the agricultural health study (AHS). Environ. Res. 2009, 109, 860–868. 10.1016/j.envres.2009.06.006. [DOI] [PMC free article] [PubMed] [Google Scholar]
- He B.; Ni Y.; Jin Y.; Fu Zh. Pesticides-induced energy metabolic disorders. Sci. Total Environ. 2020, 729, 139033 10.1016/j.scitotenv.2020.139033. [DOI] [PubMed] [Google Scholar]
- Kim K.; Kabir E.; Jahan S. A. Exposure to pesticides and the associated human health effects. Sci. Total Environ. 2017, 575, 525–535. 10.1016/j.scitotenv.2016.09.009. [DOI] [PubMed] [Google Scholar]
- Pezhhanfar S.; Farajzadeh M.-A.; Mirzaahmadi A.; Hosseini-Yazdi S.-A.; Afshar Mogaddam M.-R. Self-effervescence-assisted dispersive micro-solid-phase extraction combined with dispersive liquid-liquid micro-extraction for the extraction and preconcentration of some phthalate and adipate esters in sparkling water. Chem. Pap. 2023, 77, 4041–4055. 10.1007/s11696-023-02766-8. [DOI] [Google Scholar]
- Alshorifi F.-T.; El Dafrawy Sh.-M.; Ahmed A.-I. Fe/Co-MOF nanocatalysts: Greener chemistry approach for the removal of toxic metals and catalytic applications. ACS Omega 2022, 7, 23421–23444. 10.1021/acsomega.2c01770. [DOI] [PMC free article] [PubMed] [Google Scholar]
- Ahangaran F.; Hassanzadeh A.; Nouri S. Surface modification of Fe3O4 @SiO2 microsphere by silane coupling agent. Int. Nano Lett. 2013, 3, 23. 10.1186/2228-5326-3-23. [DOI] [Google Scholar]
- Aboelazm E.-A.-A.; Ali G.-A.-M.; Chong K.-F. Cobalt oxide supercapacitor electrode recovered from spent lithium-ion battery. Chem. Adv. Mater. 2018, 3, 67–74. [Google Scholar]
- Li S.; Gao P.; Zhang J.; Li Y.; Peng B.; Gao H.; Zhou W. Sequential dispersive liquid-liquid microextraction for the determination of aryloxyphenoxy-propionate herbicides in water. J. Sep. Sci. 2012, 35, 3389–3395. 10.1002/jssc.201200640. [DOI] [PubMed] [Google Scholar]
- Hernandez F.; Pozo O.-J.; Sancho J.-V.; Bijlsma L.; Barreda M.; Pitarch E. Multiresidue liquid chromatography tandem mass spectrometry determination of 52 non gas chromatography-amenable pesticides and metabolites in different food commodities. J. Chromatogr. A 2006, 1109, 242–252. 10.1016/j.chroma.2006.01.032. [DOI] [PubMed] [Google Scholar]
- Han Y.; Song L.; Zou N.; Chen R.; Qin Y.; Pan C. Multi-residue determination of 171 pesticides in cowpea using modified QuEChERS method with multi-walled carbon nanotubes as reversed-dispersive solid-phase extraction materials. J. Chromatogr. B 2016, 1031, 99–108. 10.1016/j.jchromb.2016.07.043. [DOI] [PubMed] [Google Scholar]
- Rui Y.; Ming-yuan S. H.; Zhen-fen L.; Han-qi Z. H.; Ai-min Y. Determination of four pesticides in soil by homogeneous ionic liquid-based microextraction coupled with high-performance liquid chromatography. Chem. Res. Chin. Univ. 2013, 29, 218. 10.1007/s40242-013-2388-0. [DOI] [Google Scholar]
- Abolghasemi M.-M.; Habibiyan R.; Jaymand M.; Piryaei M. A star-shaped polythiophene dendrimer coating for solid-phase microextraction of triazole agrochemicals. Microchim. Acta 2018, 185, 179. 10.1007/s00604-017-2639-8. [DOI] [PubMed] [Google Scholar]
- Huo X.; Li Q.; Lin X.; Chen X.; Bi K. Application of dispersive liquid-liquid microextraction for the analysis of six fungicides in fruit samples by GC-ECD. Chromatographia 2011, 73, 313–319. 10.1007/s10337-010-1875-4. [DOI] [Google Scholar]
- Zhang Y.; Zhang Y.; Zhao Q.; Chen W.; Jiao B. Vortex-assisted ionic liquid dispersive Liquid-liquid microextraction coupled with high-performance liquid chromatography for the determination of triazole fungicides in fruit juices. Food Anal. Methods 2016, 9, 596–604. 10.1007/s12161-015-0223-6. [DOI] [Google Scholar]
- Planas C.; Puig A.; Rivera J.; Caixach J. Analysis of pesticides and metabolites in Spanish surface waters by isotope dilution gas chromatography/mass spectrometry with previous automated solid-phase extraction estimation of the uncertainty of the analytical results. J. Chromatogr. A 2006, 1131, 242–252. 10.1016/j.chroma.2006.07.091. [DOI] [PubMed] [Google Scholar]
- Tankiewicz M.; Morrison C.; Biziuk M. Multi-residue method for the determination of 16 recently used pesticides from various chemical groups in aqueous samples by using DI-SPME coupled with GC-MS. Talanta 2013, 107, 1–1. 10.1016/j.talanta.2012.12.052. [DOI] [PubMed] [Google Scholar]