

SUMMARY
Monocytes can develop an exhausted memory state characterized by reduced differentiation, pathogenic inflammation, and immune suppression that drives immune dysregulation during sepsis. Chromatin alterations, notably via histone modifications, underlie innate immune memory, but the contribution of DNA methylation remains poorly understood. Using an ex vivo sepsis model, we show altered DNA methylation throughout the genome of exhausted monocytes, including genes implicated in immune dysregulation during sepsis and COVID-19 infection (e.g., Plac8). These changes are recapitulated in septic mice induced by cecal slurry injection. Methylation profiles developed in septic mice are maintained during ex vivo culture, supporting the involvement of DNA methylation in stable monocyte exhaustion memory. Methylome reprogramming is driven in part by Wnt signaling inhibition in exhausted monocytes and can be reversed with DNA methyltransferase inhibitors, Wnt agonists, or immune training molecules. Our study demonstrates the significance of altered DNA methylation in the maintenance of stable monocyte exhaustion memory.
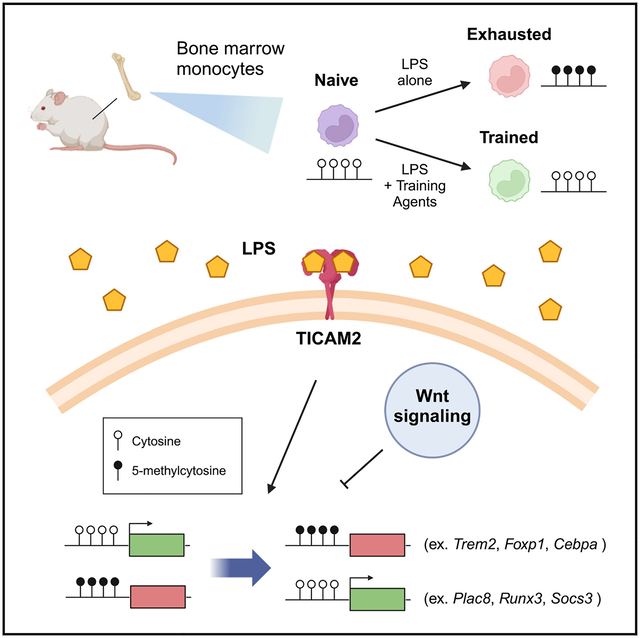
Graphical Abstract
In brief
Caldwell et al. demonstrate that DNA methylation reprogramming contributes to monocyte exhaustion during sepsis. Altered DNA methylation is driven in part by TICAM2 signaling and Wnt suppression and can be reversed with immune training compounds. These results highlight an underexplored facet of chromatin regulation in innate immune memory.
INTRODUCTION
In the innate immune system, monocytes carry the essential role of immune sentinels, migrating through the bloodstream to sites of tissue damage or infection and orchestrating the initial immune response through cytokine release and phagocytosis of infectious cells and molecules.1–3 Dynamic control of this process is achieved through innate immune memory (IM), in which monocyte exposure to injury or pathogen-associated molecular patterns (PAMPs) results in the functional reprogramming of these cells to alter their response to future stimulation.4 IM pathways are broadly classified into two functionally opposed mechanisms: training and tolerance.5 In immune training, PAMP exposure elicits a heightened immune state of improved pathogen recognition and enhanced inflammatory activity in response to subsequent immune challenges.6 By contrast, in immune tolerance, PAMP exposure dampens a cell’s inflammatory response to future immune challenges through the silencing of pro-inflammatory genes. This IM mode has been exemplified by the lipopolysaccharide (LPS)-tolerance model, in which repeated exposure to the bacterial endotoxin LPS inhibits the expression of inflammatory cytokines through NF-κB signaling.7–10
Monocyte exhaustion represents a pathogenic form of IM in which prolonged PAMP exposure elicits a paradoxical state defined by both pro-inflammatory and immunosuppressive gene expression in concert with emergency hematopoiesis through cellular de-differentiation.11 This memory state, suggestive of a failure of emergency feedback mechanisms, is characteristic of the “cytokine storm” phenomenon commonly observed in sepsis patients and severe COVID-19 infection.12–14 However, despite the tremendous burden of these disorders on global health care at the levels of both patient mortality and treatment cost, the molecular underpinnings of monocyte exhaustion, as well as the sustained immunoparalysis of its survivors, remain poorly understood.15–17
Increasing evidence suggests that epigenetics, or changes to chromatin above the level of DNA sequence, function as the major driver of transcriptional reprogramming in IM.5,18,19 In a land-mark study conducted through the BLUEPRINT Consortium, it was demonstrated that genome-wide changes in active histone marks H3K27ac and H3K4me underlie many of the gene expression changes observed during monocyte-to-macrophage differentiation under immune tolerance and training conditions, corroborating the results of earlier studies focusing on individual genes.8,20–24 However, epigenetic regulation is a complex interplay of numerous chromatin features, including nucleosomal remodeling, long non-coding RNA interactions, and DNA methylation in the form of 5-methylcytosine (5mC).25 Despite evidence that epigenetic regulation through DNA methylation may play a role in immune tolerance during macrophage differentiation and inflammatory signaling of peripheral blood monocytes in septic patients, the contribution of 5mC to IM is critically underexplored.26,27
In this study, we utilized our lab’s recently published ex vivo mouse sepsis model to identify DNA methylation changes in exhausted monocytes and evaluate their regulatory significance as drivers of the exhaustion phenotype. We identified thousands of differentially methylated regions (DMRs) in exhausted monocytes and linked their alteration to transcriptional changes at critical immune genes. Utilizing predictive modeling, we were next able to implicate the Toll-like receptor 4 (TLR4) signaling component TICAM2 and Wnt signaling as upstream regulators of DNA methylation changes observed in exhausted monocytes. Furthermore, we demonstrate the therapeutic benefits of DNA methyltransferase (DNMT) inhibition and innate immune training in limiting DNA methylation changes in exhausted monocytes and restoring immune function. Finally, we validated DNA methylome reprogramming in bone marrow monocytes of septic mice following cecal slurry injections, demonstrating long-term 5mC changes at key immune genes. Taken together, these findings highlight the underappreciated role DNA methylation plays in regulating pathogenic monocyte behavior as well as implicating DNA methylation as a potential therapeutic target for disorders characterized by monocyte dysregulation.
RESULTS
DNA methylation is reprogrammed at gene-regulatory elements in exhausted monocytes
DNA methylation in the form of 5mC at gene promoters and enhancers is a critical regulator of cell state-specific gene expression profiles, most commonly through transcriptional silencing.28,29 To test the involvement of 5mC in monocyte exhaustion, we utilized an ex vivo sepsis model in which mouse bone marrow monocytes (BMMCs) are maintained under continuous LPS exposure for 5 days in the presence of macrophage colony-stimulating factor (M-CSF) (Figure 1A).11 After 5 days of culture, LPS-treated monocytes were sorted into classical (C; CD11b+; Ly6Chigh), non-classical (NC; CD11b+; Ly6Clow), and intermediate (Int; CD11b+; Ly6Cint) populations; by contrast, PBS-control conditions largely result in a monoculture of Ly6Clow NC cells, which were sorted and used as a reference control. Following bisulfite conversion, DNA harvested from each subtype population was analyzed on Infinium Mouse Methylation BeadChip arrays.30
Figure 1. Exhausted monocytes undergo extensive DNA methylation reprogramming in response to repetitive LPS stimulation.

(A) Monocyte exhaustion experimental paradigm. BMMCs are cultured under control PBS or repetitive LPS stimulation for 5 days in the presence of M-CSF. Cells are then sorted into non-classical (purple), intermediate (yellow), or classical (red) pools and analyzed for changes in DNA methylation.
(B) Heatmap of average DNA methylation at differentially methylated CpG probes (≥5% difference in percentage 5mC versus PBS control; false discovery rate [FDR] < 10%; n = 3 for each monocyte subtype, which was used as an analysis covariate). Rows represent individual probe CpG sites.
(C) HOMER transcription factor (TF) binding motif analysis for hyper and hypo DMRs (±250 bp non-overlapping windows; bubbles colored by TF family).
(D) Heatmaps of H3K27ac (GEO: GSE168190), H3K4me1, and H3K4me3 enrichment at DMRs. Metaplots above each heatmap indicated average signal at hyper (blue) and hypo (green) DMRs in each condition (±2.5 kb non-overlapping windows; normalized to IgG control).
(E) Correlation plot of change in DNA methylation versus H3K27ac for DMRs with overlapping differential H3K27ac peaks. Simple linear regression was performed, with the line of best fit (blue) and 95% confidence interval (gray highlighted region) indicated.
(F) UCSC browser track views of MiSeq-validated DMRs at the Plac8 promoter (chr5: 100,570,157–100,573,097), Erg promoter (chr16: 95,457,684–95,460,943), and Cebpa/g enhancer (chr7: 35,063,623–35,066,630). DNA methylation values represent the average of three biological replicates; values in classical monocytes were selected as representative of the LPS condition. ENCODE annotated promoters (red) and enhancers (orange) are depicted in the bottom track.
Global 5mC levels were unaffected by LPS stimulation or monocyte subtype (Figure S1A). Surprisingly, despite their functionally distinct roles in regulating inflammatory activity, all three LPS-stimulated monocyte subtypes exhibited near-identical 5mC changes relative to PBS control, suggesting a common suite of DMRs in exhausted monocytes (Figure S1B). Differential modeling was reperformed using subtype as a covariate, resulting in the identification of 4,527 hypermethylated (hyper) and 1,390 hypomethylated (hypo) CpG sites (Figure 1B; Table S1). Based on sesame’s KnowYourCG (KYCG) probe annotation function, DMRs were heavily enriched at enhancer sites (Table S2).31 Gene ontology (GO) enrichment of nearest linked genes identified several terms associated with sepsis progression, including “TNF signaling pathway” among hypo DMRs and “regulation of actin cytoskeleton” and “IL-3 signaling pathway” among hyper DMRs (Table S3). Interestingly, DMR-linked genes were enriched for terms affiliated with G-protein signaling, including “GTPase regulator activity,” “CDC42 GTPase cycle,” “RHO GTPase cycle,” and “Ras signaling pathway,” consistent with the role of these pathways in sepsis-associated dysfunction.32,33
Next, we performed HOMER motif analysis to identify transcription factors that may be affected by the altered DNA methylome in exhausted monocytes (Figure 1C). Enriched transcription factors within a ±250 bp window of hyper CpG sites included members of the ETS, IRF, and CEBP families, which play critical roles in monocyte development and have been implicated in monocyte dysregulation in sepsis and severe COVID-19 infection.34–37 Interestingly, the PU.1:IRF8 dimer was the most enriched binding motif among hyper CpG sites; PU.1 modulates DNA methylation levels by recruiting either DNMT3B or the DNA demethylation-promoting enzyme TET2, while IRF8 regulates H3K4me1 levels at enhancers.37–39 In addition to ETS family members, hypo DMRs were enriched for RUNX and NF-κB signaling factors. Whereas NF-κB contributes to monocyte tolerogenesis, RUNX proteins are distinguished by their involvement in hematopoiesis.7,40 Similar results were obtained using sesame’s KYCG function, which also identified histone reader and Wnt signaling factor MLLT3 enrichment among hyper CpG sites (Figure S1C).40–42
In agreement with the KYCG probe annotations, chromatin state discovery and characterization (chromHMM) identified enhancers as heavily enriched at DMR CpG sites (Figure S1D). To experimentally validate these findings, we performed CUT&RUN sequencing for enhancer (H3K4me1) and promoter (H3K4me3) histone marks in PBS control and LPS-stimulated BMMCs (Figure 1D). Consistent with chromHMM, 52% of DMRs overlapped H3K4me1 enhancer peaks in PBS- or LPS-treated BMMCs. However, only 3% of differential H3K4me1 peaks overlapped DMRs, suggesting H3K4me1 levels are largely unaffected by 5mC reprogramming (Table S4). In contrast to H3K4me1, little H3K4me3 enrichment was observed at DMRs, consistent with the known antagonistic effect of H3K4me3 on DNMT activity.43–45 To understand how altered DNA methylation at enhancers and promoters might affect their regulatory function, we utilized our lab’s previously published chromatin immunoprecipitation sequencing (ChIP-seq) data for active histone mark H3K27ac in PBS control and LPS-exhausted BMMCs (Figure 1E).46 Among hyper DMRs, H3K27ac levels were decreased in LPS-treated cells, consistent with their inactivation in exhausted monocytes. By contrast, H3K27ac levels at hypo DMRs were unaffected by LPS stimulation, a pattern more consistent with epigenetic priming whereby reduced 5mC levels poise gene enhancers and promoters for future activation in a cell state- or monocyte subtype-dependent manner.39,47–49 Notably, for differential H3K27ac peaks overlapping DMRs, we observed a strong negative correlation between H3K27ac and 5mC, further supporting a role for altered DNA methylation in regulating enhancer activity in exhausted monocytes (Figure 1E).
Finally, we performed BisPCR2 MiSeq to validate 5mC changes at immunologically significant sites. Excepting the Cd80 promoter, altered DNA methylation was observed for all tested regions (Figure S1E). These sites include promoters and enhancers for transcription factors known to regulate monocyte behavior (Foxp1, Klf4, Runx3, Erg, Cebpa/g), cytokines (Ltb, Spn), and immunomodulatory cell-surface receptors (Pag1, Treml2, Trem2). Remarkably, the strongest DMR observed in exhausted monocytes was hypomethylation in the promoter and intronic enhancer regions of Plac8 (Figure 1F). Plac8 expression has been identified as a top marker for monocyte dysregulation in both sepsis and severe COVID-19 patients, and its role as an autophagy-linked plasma and lysosomal membrane protein is believed to be essential for SARS-CoV-2 infection.35,36,50,51 Taken together, the extent of differential methylation at sites of immune significance highlights the critical role of 5mC as a regulator of monocyte exhaustion.
DNA methylation changes are correlated with broad transcriptomic alterations in exhausted monocytes
To test the effect of altered DNA methylation on gene expression, we reanalyzed our lab’s previously published single-cell RNA-sequencing (scRNA-seq) dataset collected from BMMCs under PBS control or repetitive LPS stimulation.11 In agreement with previous scRNA-seq studies, we identified four major monocyte subtypes: Ly6Chigh C, Ly6Clow NC, Ly6Cint Int, and neutrophil-like (Neu) (Figures 2A, 2B, and S2A).52–54 Clusters were further subdivided based on the expression of major proliferation markers (Prolif) as well as on their enrichment in exhausted BMMC samples over PBS control (Exh), resulting in four exhausted monocyte clusters (ExhC Prolif, ExhC, ExhNC, and ExhNeu) and five control clusters (NC, Int Prolif, Int, Neu Prolif, and Neu). As expected, the LPS-stimulated condition was dominated by Ly6Chigh ExhC cells, while the PBS control condition consisted largely of Ly6Clow NC cells.11 Given the poorly characterized role of Neu monocytes in sepsis progression, we elected to focus on clusters ExhC Prolif, ExhC, and ExhNC for further analysis.
Figure 2. DNA methylation changes correlate with altered gene expression in exhausted monocytes.

(A) UMAP visualization of scRNA-seq profiles of WT and Ticam2−/− BMMCs following PBS control or repetitive LPS stimulation (GEO: GSE182355). Cells are colored according to monocyte subtype, phenotype, and treatment.
(B) Heatmap of intersectional gene expression for the top eight markers of each cell cluster.
(C) DMRs for select immunologically significant genes with affiliate UMAP feature plots demonstrating expression levels across cell clusters. Illumina BeadChip probe IDs are indicated for each DMR.
(D) Correlation plot of change in DNA methylation versus expression for the nearest matched gene between WT PBS control and Ly6Chigh LPS-treated BMMCs. Simple linear regression was performed, with the line of best fit (blue) and 95% confidence interval (gray highlighted region) indicated.
(E) PCA of differentially methylated CpG probes. Ovals indicate the normal distribution for each treatment.
(F) Correlation heatmap for average DNA methylation at DMR CpG probes in WT and Ticam2−/− BMMCs (≥5% difference in percentage 5mC versus WT or Ticam2−/− PBS control; FDR < 5%; n = 4 for each treatment).
(G) Volcano plot for altered DNA methylation at DMRs in Ticam2−/− versus WT LPS-treated BMMCs. Probes are colored based on observed differential methylation patterns in WT LPS-treated cells relative to WT PBS control (red, hypermethylated; blue, hypomethylated) or if differentially methylated only in Ticam2−/− LPS cells (green). Dotted lines indicate the change in DNA methylation (±5%) and adjusted p value (<0.05) cutoffs for DMRs.
First, differentially methylated CpG sites were matched to their nearest gene neighbor, and the difference in DNA methylation observed in exhausted monocytes was correlated with altered gene expression relative to expression in PBS-control NC cells (Figures 2C and 2D). We observed a weak negative correlation between increasing DNA methylation levels and decreased expression, consistent with 5mC-mediated silencing of gene promoters and enhancers. This effect was typified by Plac8 and Socs3, which exhibit strong hypomethylation of their affiliate regulatory elements concomitant with increased expression in ExhC cells, while the inverse was observed for Trem2 and Cd36.
Previous research from our group implicated the TLR4 signaling component TICAM2 as a major upstream regulator of myeloid exhaustion.11,55 To clarify the role of TICAM2 in this process, we integrated data from Ticam2−/− BMMCs under PBS control or repetitive LPS stimulation into our single-cell analysis. Whereas control Ticam2−/− BMMCs clustered with their wild-type (WT) counterparts, Ticam2−/− BMMCs cultured under repetitive LPS stimulation exhibited distinct clustering relative to WT cells (Figure 2A). Notably, Ticam2−/− samples were depleted of ExhC cells, instead forming two unique Ly6Clow populations (rescue 1 and 2) that more closely resembled PBS control NC cells.
To determine whether TICAM2 ablation rescues DNA methylation changes observed in exhausted monocytes, we performed Illumina BeadChip analysis on Ticam2−/− BMMCs cultured under PBS control or repetitive LPS stimulation. Because DNA methylation changes are preserved among monocyte subtypes, we analyzed total WT and Ticam2−/− BMMCs after 5 days of culture. In this manner, we identified 14,033 DMR CpG sites (3,512 hypo and 10,521 hyper) in WT exhausted BMMCs and 1,700 sites (1,087 hypo and 613 hyper) in Ticam2−/− LPS-treated BMMCs (Table S1). Principal component analysis (PCA) and hierarchical clustering analysis of DMR CpGs revealed a partial rescue of the exhaustion 5mC phenotype (Figures 2E and 2F). To evaluate the degree of rescue, we reperformed DMR modeling of LPS-treated Ticam2−/− cells versus LPS-treated WT BMMCs (Figure 2G). In total, 4,122 hyper and 1,206 hypo exhaustion CpGs were significantly rescued in Ticam2−/− BMMCs (>5% Δ5mC; adjusted p < 0.05). BisPCR2 sequencing of representative exhaustion DMRs confirmed a rescue of DNA methylation levels in 19/23 tested regions (Figure S2B). Taken together, these data implicate TICAM2 as a major upstream regulator of transcription and 5mC memory in exhausted monocytes.
Finally, to assess the influence of altered DNA methylation on transcriptional changes in exhausted monocytes, we cultured BMMCs in the presence of the DNMT inhibitor 5-azacytidine (5-aza) under PBS control or repetitive LPS stimulation. Successful DNMT inhibition was confirmed by BisPCR2 sequencing (Figure 3A). Whereas 5-aza treatment minimally affected gene expression in PBS control cells, transcriptional suppression of numerous exhaustion genes was noted in LPS-treated BMMCs, including Plac8, Socs3, Runx3, and Cd38 (Figure 3B). Importantly, expression of the tolerance gene Acod1 was unaffected by 5-aza, indicating the IM tolerance apparatus remained largely intact in 5-aza-treated cells.56 We also evaluated 5-aza rescue by flow cytometry for known exhaustion markers. In agreement with the limited differences in DNA methylation among exhausted monocyte subtypes, 5-aza treatment had a negligible impact on the relative levels of C, NC, and Int monocytes (Figure 3C). While the tolerance marker PD-L1 was similarly unaffected by 5-aza treatment, CD38 levels were greatly diminished, and CD86 expression was significantly restored (Figure 3D).57 Given that most DNA methylation changes in exhausted BMMCs were from hypermethylation, it is likely that DNMT inhibition limits exhaustion phenotype acquisition in LPS-treated cells, supporting the critical involvement of DNA methylation in this process.
Figure 3. DNA methyltransferase inhibition during repetitive LPS stimulation of BMMCs alleviates the exhaustion phenotype.

(A) Heatmap of average DNA methylation levels at MiSeq-validated DMRs in BMMCs following 5 days of PBS control or repetitive LPS stimulation in the presence of 250 nM 5-azacytidine (5-aza).
(B) RT-qPCR for key exhaustion gene expression relative to PBS control. Expression levels were normalized to the geometric mean of Ube2l3, Oaz1, and Nktr (mean ± SD; n = 3–6; one-way ANOVA with Sidak’s multiple comparisons test; ****p-adj < 0.0001; ***p-adj < 0.001; **p-adj < 0.01; *p-adj < 0.05; ns, not significant).
(C) Population statistics for non-classical (Ly6Clow), intermediate (Ly6Cint), and classical (Ly6Chigh) monocyte subtypes in cultured BMMCs (n = 6–7; one-way ANOVA with Sidak’s multiple comparisons test).
(D) Flow cytometry mean fluorescence intensity (MFI) for exhaustion markers relative to PBS control (n = 6–7; one-way ANOVA with Sidak’s multiple comparisons test).
Wnt signaling antagonizes DNA methylation changes and transcriptomic reprogramming in exhausted monocytes
We next performed single-cell regulatory network inference and clustering (SCENIC) analysis to identify regulatory circuits involved in the transcriptomic and 5mC reprogramming of exhausted monocytes.58 In total, we identified 63 high-confidence regulons spanning all BMMC clusters (Figure 4A). Several transcription factors implicated in monocyte dysregulation in sepsis and severe COVID-19 patients were enriched in exhausted cell clusters, including HIF1A, CEBPB, CEBPD, and NF-KB2 (Figure 4B).35,36,58,59 Consistent with RUNX3 motif enrichment at hypo CpGs, we also observed RUNX3 activity in ExhC Prolif cells, supporting its involvement in emergency hematopoiesis (Figure 1C).
Figure 4. SCENIC analysis of exhausted monocyte scRNA-seq data.

(A) Dot plot for SCENIC transcription factor motif enrichment in WT and Ticam2−/− BMMCs following PBS control or repetitive LPS stimulation. Dot sizes represent a given motif’s regulon specificity score (RSS) for the indicated cell cluster. Numbers represent different cell clusters, as outlined in Figure 2A (RSS cutoff = 0.1; Z threshold = 1.5).
(B) scRNA-seq UMAP feature plots for key exhaustion transcription factor SCENIC motif enrichment and gene expression in cultured BMMCs.
Among regulons enriched in PBS control cells, we noted several involved in anti-inflammatory, pro-resolving monocyte behavior, including FOXO3, FLI1, and ETV3 (Figure 4A).60–62 Of particular interest was TCF7L2, a downstream effector of canonical Wnt signaling most well known for its strong genetic association with type 2 diabetes risk (Figure 5A).63 Given the poorly characterized role of TCF7L2 and Wnt signaling in monocyte biology, we tested the effect of Wnt agonist treatment during LPS exhaustion. Wnt signaling activation had a profound impact on transcription in exhausted monocytes, limiting the expression of Plac8, Cd38, and Cfb in addition to Exh regulon members Hif1a and Runx3 (Figures 5B and S3A).
Figure 5. Wnt signaling activation limits innate immune exhaustion phenotype and DNA methylation alterations observed in BMMCs under repetitive LPS stimulation.

(A) scRNA-seq UMAP feature plots for transcription factor TCF7L2 motif enrichment and gene expression. Numbers indicate different cell clusters, as outlined in Figure 2A.
(B) RT-qPCR for key exhaustion genes in BMMCs under PBS control or repetitive LPS stimulation in the presence of different concentrations of Wnt agonist 1. Expression levels were normalized to the geometric mean of Ube2l3, Oaz1, and Nktr (mean expression ± SD; n = 3–6; one-way ANOVA with Sidak’s multiple comparisons test; ****p-adj < 0.0001; ***p-adj < 0.001; **p-adj < 0.01; *p-adj < 0.05; ns, not significant; differences are not significant unless otherwise specified; see Table S8 for exact p values).
(C) Flow cytometry mean fluorescence intensity (MFI) for exhaustion (CD38, MARCO, PD-L1, CXCR2) and macrophage (F4/80) markers relative to PBS control. Boxplots indicate median MFI values (n = 5–7; one-way ANOVA with Sidak’s multiple comparisons test).
(D) Gating strategy (top) and population statistics (bottom) for non-classical (Ly6Clow), intermediate (Ly6Cint), and classical (Ly6Chigh) monocyte subtypes in cultured BMMCs (n = 6–13; one-way ANOVA with Sidak’s multiple comparisons test).
(E) NAD+ levels in cultured BMMCs normalized to total protein levels (n = 3–6; one-way ANOVA with Sidak’s multiple comparisons test).
(F) Correlation heatmap for average DNA methylation levels at key exhaustion loci in cultured BMMCs (n = 3–9 for each condition).
(G) UCSC browser track views of average DNA methylation at the Plac8 promoter (chr5: 100,572,230–100,572,607), Cebpa/g distal enhancer (chr7: 35,064,805–35,065,304), and Tcf7l2 intron (chr19: 55,768,986–55,769,585). ENCODE annotated promoters (red) and enhancers (orange) are depicted in the bottom track.
We next performed flow cytometry to further characterize the effect of Wnt agonist on monocyte exhaustion. Exhaustion markers CD38 and MARCO were significantly depleted in Wnt-treated cells, while PD-L1 was unaffected (Figure 5C). We also observed increased levels of the IL-8-responsive G-protein-coupled receptor CXCR2, which is normally reduced in exhausted monocytes. Although Wnt signaling has been reported to block monocyte-to-macrophage differentiation, macrophage marker F4/80 levels were negligibly affected by low-dose Wnt intervention. However, in contrast to 5-aza treatment, we observed substantial repartitioning of monocyte subtypes upon Wnt activation (Figure 5D). The proportion of Ly6Clow NC monocytes increased to PBS control levels, while Ly6Cint and Ly6Chigh monocytes were significantly depleted. In concert with the observed gene expression changes, these results suggest that Wnt signaling promotes an anti-inflammatory, pro-resolving state in monocytes under LPS stimulation.
To test the specificity of Wnt-mediated suppression of the exhaustion phenotype, we cultured BMMCs in the presence of the Wnt antagonist monensin A (MonA).64 In contrast to Wnt agonist treatment, transcription was largely unaffected by MonA (Figure S3B), although Plac8, Mpo, and Cfb were downregulated in cells under LPS stimulation. Of note, these genes are direct targets of c-MYB, which has enriched regulatory activity in ExhC cluster cells (Figure 4A).65 Given that MonA was identified as a potent chemical inhibitor of c-MYB, it is possible that MonA-mediated repression of these genes proceeds through decreased c-MYB activity.66 Flow cytometry analysis of MonA-treated cells confirmed that CD38 and CD86 were unaffected by Wnt inhibition, although PD-L1 levels increased in LPS-treated cells (Figure S3C). Surprisingly, while the proportion of pro-inflammatory Ly6Chigh monocytes was increased in MonA-treated cells under LPS stimulation, PBS-control cells were completely depleted of Ly6Chigh and Ly6Cint cells (Figure S3D). This effect mirrors subtype repartitioning in Wnt agonist-treated BMMCs under LPS stimulation, suggesting a context-dependent role for Wnt signaling in monocyte regulation.
CD38-mediated NAD+ depletion is a feature of sustained pathogenic inflammation and monocyte exhaustion.11,67–70 While NAD+ levels remained depleted in LPS-treated cells following MonA treatment, levels in PBS-control cells were significantly diminished by MonA, consistent with the drug’s known effect as a driver of mitochondrial disruption and oxidative stress (Figure 5E).71 By contrast, Wnt agonist 1 treatment substantially increased NAD+ levels in both PBS control and LPS-treated BMMCs and rescued autophagy gene Atg7 expression in LPS-treated cells (Figures S3A and S3B). Thus, Wnt activation also relieves metabolic stress in exhausted monocytes.
To determine the effect of Wnt signaling on 5mC reprogramming, we performed BisPCR2 sequencing for select exhaustion DMRs following MonA or Wnt agonist treatment. While the effect of either treatment on DNA methylation in PBS control cells was limited, Wnt agonist treatment rescued 5mC levels at several DMRs in LPS-treated cells, including the Cebpa/g enhancer, Plac8 promoter, and Cebpa 3′ UTR (Figures 5F and 5G). Interestingly, whereas Wnt agonist 1 treatment rescued 5mC levels at the Klf4 enhancer in LPS-treated cells, MonA treatment drove hypomethylation of this element in PBS control cells to levels normally observed in exhausted monocytes. Also noteworthy is Tcf7l2 intron hypomethylation in exhausted monocytes, an effect exacerbated by Wnt agonist 1 treatment (Figure 5G). Taken together, these results demonstrate that Wnt signaling intervention not only reverses transcriptional and metabolic dysfunction in exhausted monocytes, but also impedes 5mC reprogramming at critical regulatory genes.
Finally, to understand the relationship between TICAM2 and Wnt signaling during monocyte exhaustion, we treated Ticam2−/− BMMCs with Wnt agonist or MonA during repetitive LPS stimulation. Flow cytometry analysis revealed that both forms of Wnt intervention affected CD38 and CD86 and that PD-L1 is elevated in Wnt agonist-treated cells (Figure S3E). Like WT BMMCs, Wnt agonist and MonA treatment led to a near full ablation of Ly6Cint and Ly6Chigh cells in both PBS control and LPS culture (Figure S3F). However, Wnt intervention minimally affected DNA methylation at exhaustion DMRs, although residual hypermethylation at the Foxp1 promoter and Cebpa/g enhancer was rescued in LPS-treated cells (Figure S3G). These experiments suggest that Wnt signaling operates in parallel with TICAM2, resulting in a combinatorial effect when both are targeted.
TDM-mediated immune training inhibits 5mC reprogramming in exhausted monocytes
The interplay between training and tolerance remains an active area of research. Previous work demonstrated that treatment of tolerized monocytes with immune training compound β-glucan restores H3K27ac levels at promoters and distal enhancers and rescues the expression of roughly 60% of tolerized genes.26 However, the effect of immune training on LPS-mediated 5mC reprogramming remains unexplored, particularly in the context of monocyte exhaustion.
We cultured BMMCs in the presence of trehalose 6,6′-dimycolate (TDM), an abundant glycolipid component in the mycobacterial cell wall and one of the earliest identified immune training agents.72,73 Whereas global 5mC levels were unaffected by LPS or TDM treatment, there was a substantial reduction in hypermethylated CpGs in LPS-treated cells co-stimulated with TDM (Figures 6A, 6B, and S4A; Table S1). DMRs observed in TDM-treated cells largely overlapped those observed in BMMCs treated with LPS alone, although many hypo CpGs were unique to TDM treatment. PCA of 5mC patterns supported a clear separation of LPS- and LPS + TDM-treated BMMCs, with component 2 being driven primarily by unique differences observed in TDM-treated cells (Figure 6C). To assess TDM-mediated rescue of 5mC reprogramming, we reperformed differential 5mC modeling using LPS-treated BMMCs as the reference control (Figure 6D). In total, 3,067 hyper and 47 hypo CpGs were significantly rescued by TDM treatment (>5% Δ5mC; adjusted p < 0.05). This effect was observed in sites of regulatory (Pim1, Foxp1) and immune (Il12rb1, Nfatc2, Socs3, CD83) importance, supporting improved immunogenicity in TDM-trained cells (Figure 6E).74
Figure 6. Immune training with TDM limits DNA methylation changes in BMMCs under repetitive LPS stimulation.

(A) Correlation heatmap for DNA methylation at differentially methylated CpG probes following 5 days of PBS control or repetitive LPS stimulation in the presence or absence of TDM (≥5% difference in percentage 5mC versus PBS control; FDR < 5%; n = 4 for each treatment).
(B) Venn diagrams for differentially methylated CpG probes in cells treated with LPS alone (red) or LPS + TDM (green).
(C) PCA of differentially methylated CpG probes. Ovals indicate the normal distribution for each treatment.
(D) Volcano plot for altered DNA methylation at DMRs in LPS + TDM-treated BMMCs versus treatment with LPS alone. Probes are colored based on observed differential methylation patterns in LPS-treated cells relative to PBS control (red, hypermethylated; blue, hypomethylated) or if they exhibit differential methylation only in LPS + TDM cells (green). Dotted lines indicate the change in DNA methylation (±5%) and adjusted p value (<0.05) cutoffs for DMRs.
(E) Representative DMRs linked to epigenetic modifiers (Dot1l, Ankrd11), transcriptional regulators (Pim1, Foxp1), and immunologically significant genes (Il12rb1, Nfatc2, Socs3, CD83). Illumina BeadChip probe IDs are indicated for each DMR.
(F) GO enrichment for cell signaling pathways among DMR-linked genes in LPS + TDM-treated BMMCs.
We next annotated DMR probes in LPS + TDM BMMCs using sesame’s KYCG function (Table S2). As with BMMCs under LPS stimulation alone, DMRs were heavily enriched at enhancer sites (43% of hyper probes; 34% of hypo). This effect was confirmed by chromHMM analysis, which demonstrated similar chromatin enrichment of LPS + TDM DMRs regardless of whether the site was unique to the LPS + TDM condition (Figure S4B). We also identified a similar repertoire of transcription factor binding sites overlapping DMRs in TDM + LPS-treated cells, although MLLT3 and CEBP family member enrichment was substantially diminished at hyper DMRs (Figure S4C). Given that Wnt signaling was shown to antagonize monocyte exhaustion, general loss of DNA methylation at MLLT3 binding sites may promote Wnt signaling in LPS + TDM-treated BMMCs and contribute to their improved immune function.
Finally, we tested GO enrichment of DMR-linked genes to identify molecular pathways contributing to immune training in TDM-treated cells (Table S3). As with BMMCs treated with LPS alone, we noted significant enrichment of “TNF signaling pathway” and “signaling by GPCR” among hypo DMRs (Figure 6F). However, altered immunogenicity in TDM-treated cells was evident from enrichment of “chemokine signaling” and “Notch signaling” among hypo DMRs and “MAPK signaling” and “IL-6 signaling” among hyper DMRs. In concert with NF-κB, MAPK signaling has been shown to promote HIF-1 activation during LPS stimulation, while a Notch and JAK/STAT3 positive feedback loop is thought to drive downstream IL-6 secretion and PD-L1 expression during LPS stimulation.74–76 Altered DNA methylation linked to these pathways may influence their activity during immune challenge, further highlighting the benefits of immune training on monocyte exhaustion.
In vivo evidence for DNA methylation involvement in monocyte exhaustion and immune memory
Based on our ex vivo mouse sepsis model, DNA methylation is significantly altered in bone marrow-derived monocytes under repetitive LPS stimulation. To better understand the role DNA methylation plays in regulating monocyte behavior in vivo, we performed intraperitoneal cecal slurry (CS) injections to induce sepsis in WT C57BL/6J mice. Injections were performed at day 0 and day 5 of the experimental paradigm, after which bone marrow samples were collected at days 6, 7, and 12 (Figure 7A).
Figure 7. In vivo validation of major regulatory circuit and altered DNA methylome in exhausted monocytes.

(A) Experimental paradigm and FlowSOM analysis of monocytic lineage populations in bone marrow collected from control (CTRL) or cecal slurry (CS)-injected mice at experimental day 7 (d7). Values to the right of each FlowSOM population indicate the percentage of cells for each condition clustering in that population. UMAP visualizations were prepared for the indicated markers (n = 8 CTRL and 12 CS day 7 mice).
(B) Flow cytometry mean fluorescence intensity (MFI) for exhaustion markers in Pop1. Boxplots indicate median MFI values (n = 8–12; one-way ANOVA with Sidak’s multiple comparisons test; ****p-adj < 0.0001; ***p-adj < 0.001; *p-adj < 0.05).
(C) RT-qPCR for key exhaustion gene expression in CTRL and CS day 6 or 7 monocytes. Expression levels were normalized to the geometric mean of Ube2l3, Oaz1, and Actb. Data points represent separate mice, with mean expression ± SD indicated (n = 3–12; one-way ANOVA with Sidak’s multiple comparisons test, excepting Il10, Morrbid, and Foxp1 analyzed by Kruskal-Wallis with Dunn’s multiple comparisons test; differences are not significant unless otherwise specified; see Table S8 for exact p values).
(D) Correlation heatmap for DNA methylation at differentially methylated CpG probes in CTRL or CS bone marrow monocytes (≥5% difference in percentage 5mC versus CTRL; FDR < 10%; n = 7 CTRL, 4 CS day 6, 6 CS day 7, and 4 CS day 12 mice).
(E) Venn diagrams for differentially methylated CpG probes in CS bone marrow monocytes at experimental days 6, 7, and 12.
(F) Volcano plot for altered DNA methylation at DMRs in CS day 7 bone marrow monocytes versus CTRL. Probes are colored based on observed differential methylation state in CS day 7 monocytes (red, hypermethylated; blue, hypomethylated). Dotted lines indicate the change in DNA methylation (±5%) and adjusted p value (<0.1) cutoffs for DMRs. Nearest linked genes are indicated for select DMRs.
(G) Select DMRs for immunologically significant genes in CTRL or CS monocytes. Illumina BeadChip probe IDs are indicated for each DMR.
Given myeloid lineage diversity in bone marrow-derived cells, we developed a 16-factor flow cytometry panel to better characterize the exhaustion phenotype. After gating for non-neutrophil, monocytic-lineage cells (Ly6g−;CD11b+), we performed flow self-organizing map (FlowSOM) automated cell clustering using markers for monocytes/macrophages (Ly6C, MARCO, CD68, CX3CR1, MHCII, F4/80, CD172a), proliferation (CD168), exhaustion (FAS, CD38, TREM2, CXCR2), and tolerance (PD-L1) on bone marrow collected from day 7 CS or control (CTRL) mice (Figure 7A).77 Major cellular repartitioning in CS samples was noted for nearly every cell cluster identified, with particular depletion of inflammatory populations (Pop) 2, 3, 6, 7, and 8 relative to CTRL samples, likely due to their emigration to sites of infection during sepsis (Figure S5A).78,79 While no significant difference was observed in the proportion of mature (F4/80+) Pop1 macrophages, CS Pop1 cells exhibited a marked exhaustion phenotype of heightened CD38, PD-L1, and MARCO expression (Figure 7B). We also noted a near 2-fold increase in poorly differentiated Pop10 Ly6Cint monocytes in CS bone marrow samples, which is commonly observed in both septic shock and severe COVID-19 infection (Figure S5A).80–82 Furthermore, we observed a Ly6Cint monocyte population (Pop11) unique to CS bone marrow samples with elevated CX3CR1 and CD68 in addition to high expression of pro-apoptotic TNF-receptor superfamily member FAS, a notable feature of sepsis pathogenesis.83,84
To validate the exhaustion regulatory apparatus identified ex vivo, we measured the expression of key genes in monocytes column purified from day 6 and 7 CS bone marrow samples. In agreement with ex vivo results, we noted an upregulation for all genes in CS samples relative to CTRL, with sustained elevation noted for Foxp1, Socs3, and Cfb (Figure 7C).
Next, we analyzed DNA methylation in CS day 6 and 7 column-purified bone marrow monocyte samples using Infinium BeadChip arrays. Progressive, genome-wide hypomethylation was observed in CS monocytes relative to CTRL (Figure S5B). This effect was mirrored in DMR modeling, which identified 23,297 hypo and 3,660 hyper CpGs among CS samples (Figures 7E and 7F; Table S5). While many of these changes were small, a substantial number of sites (3,279 hypo and 1,163 hyper) exhibited a change in DNA methylation greater than 10% 5mC that is expected to impact their regulatory activity.
Clustering analyses revealed discrete DNA methylation patterns for each condition (Figures 7D and S5C). There was a strong overlap in DMR CpGs between CS on days 6 and 7 (35% of hypo and 38% of hyper), although far more hypo CpGs were identified in CS day 7 monocytes, corresponding with genome-wide hypomethylation observed in these cells (Figure 7E). Focusing on select exhaustion DMRs, we noted altered methylation at regulatory sites for Socs3, Cfb, Il10, Morrbid, and Foxp1 in CS day 6 and 7 cells, consistent with their sustained transcriptional activation at these time points (Figures 7C, 7F, and 7G; Table S5). In total, of the 1,794 DMR-linked genes identified in our ex vivo BMMC sepsis model, roughly half were linked to significant DMRs in vivo, with 27% exhibiting strong (>10% Δ5mC) differential methylation in CS monocytes (Tables S1 and S5). Direct comparison of DMR CpGs identified in our two systems revealed that ex vivo exhausted BMMCs most closely resembled CS day 6 monocytes, with which a moderate correlation in altered 5mC was observed (Figure S5D), These results both support the involvement 5mC reprogramming in sepsis progression and validate our ex vivo system as a tractable model for identifying key regulators of monocyte exhaustion.
Next, we annotated DMR probes in CS samples using sesame’s KYCG function (Table S6). DMRs were heavily enriched at enhancer sites, a feature further corroborated by chromHMM analysis (Figure S5E). A survey of transcription factor binding motifs overlapping DMRs identified IRF1 and IRF8 among hyper DMRs, similar to our ex vivo system. By contrast, Wnt signaling factor MLLT3 was enriched among hypo DMRs in CS day 6 and 7 monocytes, an inverse of the pattern observed in ex vivo cells (Figure S5F; Table S6). This may reflect the undifferentiated status of bone marrow monocytes relative to ex vivo cultured samples.
GO enrichment of DMR-linked genes identified numerous regulatory pathways linked to sepsis progression, including “regulation of actin cytoskeleton,” “MAPK signaling,” “signaling by Rho GTPases,” “IL-3 signaling,” and “HIF1 signaling” (Table S7).85 Interestingly, among hyper DMRs in CS day 6 samples, we noted enrichment for “phospholipase D signaling” and “phosphatidylinositol signaling,” pathways that have been recognized for their involvement in sepsis-associated lung injury and encephalopathy.86–89 We also observed enrichment for “mitochondrial ABC transporters” among CS day 7 hyper DMRs, consistent with the metabolic stress observed in septic monocytes.90
To characterize long-term changes in DNA methylation in bone marrow monocytes, we analyzed DNA methylation in samples collected from mice after 1 week of sepsis recovery (CS day 12). In contrast to the hypomethylation observed at earlier time points, genome-wide DNA methylation in day 12 monocytes normalized to levels observed in CTRL mice (Figure S5B). The 5mC patterns in CS day 12 monocytes likewise demonstrated a high degree of similarity with CTRL cells, indicating that most of the changes observed during acute sepsis resolved during the recovery phase (Figures 7D and S5C). Despite this, we still observed 97 hypo and 203 hyper CpGs relative to CTRL (Figure 7E). Whereas most hypo CpGs were shared with CS day 6 and 7 monocytes, more than half of hyper CpGs were unique to CS day 12 cells. Again, the majority of CS day 12 DMRs were observed at enhancers, including sites linked to critical immune genes such as II10 and Socs3 (Figures 7G and S5E; Table S6). GO analysis detected numerous immune pathways among CS day 12 DMR-linked genes, including “regulation of actin cytoskeleton,” “phospholipase D signaling,” “signaling by Rho GTPases,” “MAPK signaling,” and “IL-3 signaling” (Table S7). Strikingly, there was profound enrichment for the FOSL2 binding motif among hypo DMRs, implicating the transcription factor as an important regulator of long-term epigenetic changes in immune-challenged monocytes (Figure S5F).
Finally, to test DMR conservation during monocyte differentiation, we cultured BMMCs from CS day 12 mice for 5 days in the presence of M-CSF under PBS-control conditions. Strikingly, Infinium array analysis of DNA methylation levels in CS day 12 BMMCs revealed 8,251 differentially methylated probes (4,327 hypo; 3,924 hyper) relative to control samples (Table S1), a substantial increase from levels observed in uncultured monocytes. Of note, 21% of DMR probes observed in CS day 12 monocytes were conserved in cultured BMMCs, including regulatory sites linked to II4a, II10, and miR21a (Figures 7G and S5G). Interestingly, although the primary Plac8 promoter exists in a low-level methylated state in bone marrow monocytes, differentiation of CS day 12 monocytes revealed hypomethylation similar to that observed in LPS-exhausted monocytes (Figure 7G). Roughly 40% of DMR probes observed in CS day 12 BMMCs were conserved in LPS-exhausted monocytes, suggesting that differentiation stabilizes 5mC epigenetic memory in sepsis-challenged monocytes. Taken together, these results demonstrate that altered DNA methylation contributes to long-term immune memory in monocytes well after sepsis resolution.
DISCUSSION
IM is increasingly recognized as an important process during host adaptation to immune challenge in a pathogen- and concentration-specific manner.4–6,91 These altered memory states have far-reaching effects on innate immune activity. In sepsis, IM transcriptional reprogramming results in disrupted myeloid behavior at least 3 months after recovery, challenging traditional notions of adaptive immunity as the de facto driver of long-term immune memory.92,93 IM has also been implicated in long-term sepsis-induced immunoparalysis, complications from which facilitate persistent and nosocomial infection leading to death in one-third of sepsis patients.15–17,94,95
Central to IM are alterations to the epigenome. Whereas previous research has demonstrated a critical role for histone modifications in this process, the contribution of DNA methylation is less well understood.8,20,21,26,96–98 Following Bacille Calmette-Guérin (BCG) vaccination, stable differences in DNA methylation patterns were observed in peripheral blood mononuclear cells (PBMCs) of responders versus non-responders up to 8 months later.99 By contrast, Novakovic et al.26 found no evidence for the involvement of DNA methylation in β-glucan-driven trained immunity, although significant differences were observed in LPS-tolerized macrophages.26 Most compellingly, PBMCs from septic patients exhibit altered DNA methylation correlating with inflammatory cytokine secretion and organ dysfunction, an effect attributed to JAK/STAT signaling in LPS-tolerized monocytes.27,100 However, whether DNA methylation reprogramming contributes to pathogenic features of monocyte exhaustion during sepsis, in addition to the long-term implications for sepsis-driven 5mC alterations, was unknown.
In this study, we utilized our recently validated ex vivo mouse sepsis model to characterize the involvement of DNA methylation in IM and sepsis pathogenesis.11 Our results demonstrate that changes to the 5mC landscape of exhausted monocytes influence their pathogenic behavior. Differential methylation at regulatory sites for transcription factors (e.g., Foxp1, Cebpa/g, Runx3) and immune effectors (e.g., Socs3, Trem2, Cfb) correlated with their altered transcription in exhausted monocytes, and pharmacological inhibition of DNMT restored immune function at the levels of transcription and cell surface marker expression. Most of these changes occurred at enhancers, correlating strongly with altered H3K27ac in these regions.46 Interestingly, few enhancers exhibited differential H3K4me1 enrichment in LPS-treated cells, suggesting DNA methylation operates on a cohort of enhancers distinct from those previously shown to exhibit altered H3K4me1 levels in trained or tolerized cells.20,26 Furthermore, few DMRs overlapped with H3K4me3 peaks at gene promoters. This is unsurprising given promoter CpG islands are largely protected from DNA methylation through H3K4me3-mediated antagonism of de novo DNMT activity.43–45,101 There are, however, several notable exceptions, with differential H3K4me3 peaks overlapping DMRs at the Plac8, Erg, and Ly6e promoters (Figure 1F; Table S4). It is probable that H3K4me3 retention protects these sites from DNMT activity in exhausted monocytes.
One of the most interesting hits among DMRs in exhausted monocytes was hypomethylation in the promoter region Plac8. Although Plac8 was first identified as a leukocyte inhibitory factor enriched in mouse uterus and placenta, recent studies demonstrated an important role for Plac8 during severe immune challenge.102 Plac8 was identified as the top enriched gene in pathogenic monocyte subtypes based on single-cell analyses of sepsis and COVID-19 patients.35,36 Furthermore, two recent studies demonstrated Plac8 expression as essential for coronavirus infection by regulating either viral entry or transcription in host cells.50,51 Given the dual roles of PLAC8 as both a regulator of autophagosomal-lysosomal fusion and a bona fide transcription factor through interactions with C/EBPβ, the mechanism by which PLAC8 affects immune behavior in exhausted monocytes remains an active area of investigation.103,104
Single-cell modeling of major regulons during monocyte exhaustion identified several transcription factors previously implicated in sepsis progression, including HIF1A, CEBPB, CEBPD, and NF-KB2.35,36,58,59 Motif analysis for transcription factor binding sites demonstrated an enrichment for many of these factors at DMRs, suggesting that 5mC reprogramming in exhausted monocytes helps direct and stabilize their regulatory activity. One of the more interesting observations from these analyses was evidence for Wnt signaling inhibition during monocyte exhaustion, supported by hypermethylation of MLLT3 binding sites in LPS-treated cells and TCF7L2 signaling activity specific to NC PBS control monocytes. Previous studies demonstrated that Wnt signaling promotes monocyte transendothelial migration and cellular adhesion.105,106 It was also shown that Wnt signaling inhibits PU.1-mediated gene regulation to block monocyte-macrophage differentiation, although that effect was not recapitulated in our study, likely due to the low concentration of Wnt agonist 1 tested.107 Instead, activation of Wnt signaling antagonized the exhaustion phenotype, redistributing monocyte subtypes from the pro-inflammatory Ly6Chigh to the pro-resolving Ly6Clow fate and downregulating the expression of major exhaustion genes. Furthermore, Wnt signaling activation restored DNA methylation to control levels at key regulatory features, including the Plac8 promoter, Cebpa/g enhancer, and Klf4 enhancer. Taken together, these results support Wnt signaling as a major regulatory node in monocytes during pathogenic inflammation and prospective target for therapeutic intervention.
Several studies have demonstrated the translational potential for innate immune training as both a prophylactic measure to mitigate infection risk and a regenerative feature to treat immunoparalysis.5,95,108–110 Chief among these therapeutic agents are the fungal derivative β-glucan and BCG derivatives such as TDM, which limit disease risk (most notably in SARS-CoV-2 infection) and reduce the severity of symptoms after infection.19,73,110–117 Strikingly, TDM intervention had a profound effect on DNA methylation patterns in exhausted monocytes, greatly limiting the number of hypermethylated regions and restoring 5mC levels at regulatory sites for critical immune modulators. Thus, immune training with BCG derivatives has the potential to promote healthy epigenetic profiles at the level of DNA methylation, further supporting the therapeutic potential of these agents.
To our surprise, following 5 days of culture, BMMCs derived from CS day 12 mice exhibit an expanded DMR profile similar to LPS-exhausted BMMCs. This leads us to two conclusions. First, given the 2 week absence of immune challenges, 5mC re-programming in these cells must be directed by long-term cell-autonomous IM, be it transcription factor or histone in origin. Second, our observed DMR profile is in part linked to monocyte differentiation. This observation may reconcile our results with previous literature demonstrating that IM-related 5mC remodeling in terminally differentiated cells is dominated by loss of methylation, not hypermethylation as observed in exhausted BMMCs.118–120 However, we observed no difference in the differentiation status of LPS-treated and control BMMCs, suggesting the observed 5mC changes represent true IM rather than delayed macrophage differentiation. Furthermore, conservation of 5mC patterns across Ly6C subtypes supports a common suite of exhaustion loci rather than a redistribution of cell populations. We speculate that differentiation potentiates 5mC reprogramming in exhausted monocytes to stabilize IM in the face of shifting gene regulatory networks.
In sum, our findings conclusively support a role for DNA methylation in IM and monocyte exhaustion during sepsis. We also note the translational potential for intervention in the form of Wnt agonists, DNA demethylating drugs, and BCG-derived immune training agents in the resolution of aberrant gene expression and 5mC patterning in exhausted monocytes. Given the strong association between DNA methylation and pathogenic drivers such as Plac8, DNA methylation merits consideration equal to histone modifications for the role it plays in shaping the epigenetic landscape of IM.
Limitations of the study
Genome-wide DNA methylation analyses were conducted using Infinium Mouse Methylation BeadChip arrays. In contrast to whole-genome sequencing methods, Infinium arrays survey methylation at 285,000 CpGs across the mouse genome, with an enrichment for sites of known regulatory significance. This method was chosen based on its low technical variability and high sensitivity, allowing us to survey 5mC patterns across a broad number of experimental conditions. However, as array probes represent a small subset of all CpG sites, our data likely underestimate the extent of 5mC reprogramming during monocyte exhaustion. Second, to test the correlation between altered gene expression and DNA methylation in exhausted monocytes, DMRs were linked to their nearest gene neighbors. While this is a common bioinformatic practice, enhancers operate in cis across linear distances up to 1 Mb to regulate gene expression, and thus the assumption of nearest gene contacts is imperfect. For this reason, select regions of interest were cross-referenced with 3D interactome data to confirm gene-enhancer pairs. Finally, our study makes conceptual advances toward understanding the role DNA methylation plays in innate exhaustion, thereby introducing multiple avenues for therapeutic intervention. However, optimization of drug dosages, timing, modes of delivery, and PK/PD assessments on compound-cell interactions, as well as evaluations of cross-interactions with other tissues, are needed to clearly design future in vivo studies at both the mechanistic and the therapeutic levels.
STAR★METHODS
RESOURCE AVAILABILITY
Lead contact
Further information and requests for resources and reagents should be directed to and will be fulfilled by the lead contact, Liwu Li (lwli@vt.edu).
Materials availability
All unique/stable reagents generated in this study are available from the lead contact with a completed Materials Transfer Agreement.
Data and code availability
Raw and processed DNA methylation array and CUT&RUN sequencing data produced during this study are available through the Gene Expression Omnibus under the accession number GEO: GSE253202. Source data for all figures in the paper are available at Mendeley Data: https://doi.org/10.17632/b62hnycy59.1.
This paper does not report original code.
Any additional information required to reanalyze the data reported in this paper is available from the lead contact upon request.
EXPERIMENTAL MODEL AND STUDY PARTICIPANT DETAILS
Animal husbandry
All experiments were approved by the Institutional Animal Care and Use Committee (IACUC) of Virginia Tech in accordance with the U.S. National Institutes of Health Guide for the Care and Use of Laboratory Animals. Wild-type (WT) C57BL/6 mice were purchased from The Jackson Laboratory, and Ticam2−/− mice were provided by Dr. Holger Eltzschig (University of Texas Houston) and regularly maintained in our laboratory. Mice were housed in a pathogen-free facility with 12–12 hour light-dark cycles and free access to water and standard chow. All experimental analyses were conducted on 6- to 8-week-old mice. Female mice were used for ex vivo primary BMMC culture, while male mice were used for in vivo cecal slurry injections.
Cell culture
In vitro bone marrow monocyte (BMMC) LPS exhaustion experiments were performed as previously described.11 Briefly, bone marrow cells were harvested from 6- to 8-week-old C57BL/6 WT or Ticam2−/− female mice, seeded at a density of 3×10⁵ cells/cm2, and cultured in complete RPMI 1640 media (10% fetal bovine serum, 1% penicillin-streptomycin, 1% L-glutamine) supplemented with 10 ng/mL M-CSF (PeproTech). Cells were cultured for 5 days at 37°C in a humidified 5% CO2 atmosphere under continuous high-dose 100 ng/mL lipopolysaccharide (LPS; Sigma-Aldrich) stimulation or PBS control conditions, with fresh media changes at days 2 and 4 of culture.129 For Monensin A (MonA; Sigma Aldrich) and Wnt agonist 1 (Cayman Chemical) experiments, cells were treated with low-dose MonA (50 nM) or Wnt agonist 1 (1 or 5 μM) on days 2 and 4 of cell culture. For 5-azacytidine (5-aza; Stem Cell Technologies) and trehalose 6,6’-dimycolate (TDM; invivoGen) experiments, cells were maintained in 5-aza (50 or 250 nM) or TDM (10 μg/mL) for the full 5 day LPS exhaustion time course.
METHOD DETAILS
Cecal slurry preparation and injections
Sepsis was induced by intraperitoneal injection of cecal slurry in 6- to 8-week-old C57BL/6 WT male mice as previously described.130 Briefly, whole ceca were dissected from 12-week-old C57BL/6 mice euthanized by cervical dislocation. Cecal contents were extracted and mixed with sterile water (250 μg/μL), sequentially filtered through 860 μm and 190 μm mesh strainers, mixed with an equal volume of 30% glycerol in PBS (final concentration 125 μg/μL), and placed in −80° C storage. For cecal slurry injections, frozen cecal slurry (CS) stock was rapidly thawed in 37° C water bath and injected (0.9 mg/g mouse weight) into the peritoneal cavity of recipient mice. After 5 days, mice were injected with a second 0.9 mg/g dose of CS, and then euthanized by cervical dislocation 1, 2, or 7 days later. Bone marrow cells were collected as previously described and used for flow cytometry analysis or LS column purification (Miltenyi) of bone marrow monocytes following the manufacturer’s protocol.
Flow cytometry and fluorescence activated cell sorting (FACS)
Mouse bone marrow cells or day 5 cultured BMMCs were washed with PBS, harvested, and blocked in 1:100 Fc block (BD Biosciences) for 20 minutes at 4° C. Cells were then incubated for 30 minutes at 4° C with one of three separate antibody panels. For panel 1, cells were stained with fluorochrome-conjugated antibodies against Ly6C (PE-Cy7; Biolegend #128017), CD11b (APC-Cy7; Biolegend #101226), CD86 (FITC; Biolegend #105006), PD-L1 (APC; Biolegend #124312), and CD38 (PE; Biolegend #102708). For Panel 2, cells were stained with antibodies against Ly6C (Pacific Blue; Biolegend #128014), CD11b (BV650; BD Biosciences #563402), Ly6g (PE-Cy5.5; Elabscience #E-AB-F1108I), CXCR2 (Alexa Fluor 488; R&D Systems # FAB2164G), CD68 (APC-Fire750; Biolegend #137041), CD172a (BV510; BD Biosciences #740159), CX3CR1 (PE-Cy7; Biolegend #149016), F4/80 (BV711; BD Biosciences #565612), CD38 (BV750; BD Biosciences #747103), PD-L1 (BV421; BD Biosciences #564716), MARCO (Alexa Fluor 647; R&D Systems #FAB29561R), FAS (BV605; Biolegend #152612), MHCII (PerCP; Biolegend #107624), CD168 (PE; Novus #NBP1–76538PE), and TREM2 (Alexa Fluor 700; R&D Systems #FAB17291N). For panel 3, cells were stained with only Ly6C (PE-Cy7; Biolegend #128017) and CD11b (APC-Cy7; Biolegend #101226). Cells were then washed with FACS buffer (HBSS with 2% fetal bovine serum) and resuspended in FACS buffer containing propidium iodide (PI; 1:2000; Invitrogen). Panel 1 samples were measured with a FACS Canto II (BD Biosciences), panel 2 samples were measured with an Aurora 4L 16V-14B-10YG-8R (Cytek), and panel 3 samples were sorted by FACS using an SH800S Cell Sorter (Sony).
NAD+ assay
An Amplite Fluorimetric cADPR-Ribose Assay Kit (AAT Bioquest) was used to determine NAD+ in cultured BMMCs according to the manufacturer’s protocol. NAD+ levels were quantified using a Cytation 3 Cell Imaging Multi-Mode Reader (BioTek).
Quantitative real-time PCR (qRT-PCR)
Total RNA was extracted using a RNeasy Plus Mini Kit (QIAGEN) and reverse transcribed using a High-Capacity cDNA Reverse Transcription Kit (Applied Biosystems) according to the manufacturer’s protocol. qRT-PCR was performed using Power SYBR Green Master Mix (Thermo Fisher) on a CFX96 Real-Time System C1000 Thermal Cycler (Bio-Rad). Relative expression levels were determined using the Pffafl method normalized to the geometric mean of genes Ube2l3, Oaz1, and Nktr (BMMCs) or Actb (BM monocytes), selected based on scRNA-seq data demonstrating their high, equivalent expression levels across all cell types tested.11
Infinium Mouse Methylation BeadChip array
Following 5 days of LPS or PBS control stimulation, CD11b+ BMMCs were FACS sorted into Ly6C-low, -intermediate, and -high pools. Genomic DNA from each pool was prepared using a DNeasy Blood & Tissue Kit (QIAGEN) and bisulfite (BS)-treated using an EpiTect Bisulfite Kit (QIAGEN). For Infinium Mouse Methylation BeadChip (Illumina) arrays, 500 ng of BS-treated DNA was processed and hybridized to individual array wells according to the manufacturer’s protocol. BeadChip array signal was measured using the iScan System (Illumina). All samples were processed and run at the Children’s Hospital of Philadelphia Center for Applied Genomics.
CUT&RUN sequencing
CUT&RUN sequencing libraries were prepared using a CUTANA ChIC/CUT&RUN Kit (EpiCypher) according to the manufacturer’s protocol. Briefly, after 5 days of culture, 500,000 fresh PBS control or LPS-stimulated BMMCs were collected, washed, and permeabilized in 0.01% digitonin in the presence of ConA beads. K-MetStat Panel spike-in was added to each reaction, and samples were incubated overnight at 4° C in the presence of H3K4me1 (EpiCypher #13–0057), H3K4me3 (EpiCypher #13–0041), or IgG negative control (EpiCypher #13–0042) antibodies. Following PAG-MNase digestion and chromatin release, 0.5ng of E. coli spike-in DNA were added to each reaction, and DNA samples were purified using CUTANA kit reagents. Eluted DNA was quantified using a Qubit dsDNA HS Assay Kit (Invitrogen), and 1–5 ng of purified DNA were used as input for CUTANA CUT&RUN Library Prep Kit (EpiCypher) according to the manufacturer’s protocol. Library fragment sizes were analyzed using Tapestation DNA ScreenTape analysis (Agilent) at the Fralin Life Sciences Institute at Virginia Tech Genomics Sequencing Center. Individual indexed samples were then pooled, and the final indexed library was sequenced using a NextSeq 1000 v3 P1 (300 cycles) (Illumina) at the Fralin Genomics Sequencing Center.
Bisulfite next-generation sequencing
A modified BisPCR2 workflow was used to validate differentially methylated regions of interest identified on the Infinium array.131 Genomic DNA was subjected to bisulfite conversion as described above and then used as a template for target enrichment using a PyroMark PCR Kit (QIAGEN). Amplified regions were pooled for column purification (4–7 regions per pool, for a total of 150ng), and the purified pools were barcoded with Illumina indexing primers using a Multiplex PCR Kit (QIAGEN). All indexed pools for each sample were then pooled during column purification, after which library quality was determined using Tapestation DNA ScreenTape analysis (Agilent) at the Fralin Life Sciences Institute at Virginia Tech Genomics Sequencing Center. Finally, all indexed libraries were pooled with 6% PhiX spike-in DNA and sequenced using a MiSeq Reagent Nano Kit v2 (500 cycles) (Illumina) at the Fralin Genomics Sequencing Center.
Bisulfite pyrosequencing
Bisulfite-treated genomic DNA was processed for pyrosequencing as previously described.132 Regions of interest were PCR amplified using a PyroMark PCR Kit (QIAGEN) and sequenced on a PyroMark Q48 Autoprep instrument.
QUANTIFICATION AND STATISTICAL ANALYSIS
Infinium BeadChip array analysis
Raw Infinium IDAT files were processed into corrected beta values using the openSesame pipeline (1.14.2; default parameters).31 Differentially methylated regions (DMRs) between PBS- and LPS-treated BMMCs were identified by linear modeling of the segmented genome using the sesame DML function, with Ly6C cell surface expression (low, intermediate, high) being used as a covariate. Region annotations for DMRs were obtained using the annotatePeaks function of the Rpackage ChIPSeeker (1.22.1; parameter: TxDb = TxDb.Mmusculus.UCSC.mm10.knownGene).121 Additional Infinium BeadChip probe annotations, including transcription factor motif enrichment and tissue signatures, were obtained using the sesame KYCG function.31 Chromatin state discovery and characterization (ChromHMM) was also performed using the KYCG pipeline; this computational method uses ENCODE data on consensus chromatin states across all mammalian cell types to predict the most probable chromatin state of given genomic locus, with enrichment of specific features being determined relative to that feature’s representation among Infinium BeadChip array probes.133 For HOMER motif enrichment, differentially methylated probes sites were expanded to non-overlapping 500 bp windows (+/− 250 bp from probe CpG) and analyzed using the findMotifs.pl program relative to the Infinium Methylation BeadChip array background.122 For gene ontology enrichment analysis, differentially methylated probes were matched to their nearest gene using sesameData_getGenesByProbes, and ontology enrichment was performed using the g:Profiler2 package (0.2.1) focusing specifically on KEGG, HP, REAC, and WP terms.123 Average DNA methylation signal and unsupervised clustering heatmaps were prepared using the Rpackage pheatmap (1.0.12; https://www.rdocumentation.org/packages/pheatmap; clustering_method = “average”), and average signal violin plots were prepared using the Rpackage vioplot (0.4.0; https://github.com/TomKellyGenetics/vioplot). Principal components analysis (PCA) and Moods nonparametric median tests were performed using the R stats package.
Chromatin immunoprecipitation (ChIP)-seq analysis
BMMC H3K27ac ChIP-seq data (GEO: GSE168190) quality control, normalization, and peak calling was performed as previously described.46 H3K27ac peaks overlapping DMRs in LPS-treated BMMCs were identified using BEDTools (2.30.0; function: intersect).125 Heatmaps and metaplots for H3K27ac signal at DMRs were generated using deepTools (3.5.2), and correlation plots for differential H3K27ac peaks at DMRs were generated using ggplot2 (3.4.0).124,126
CUT&RUN analysis
CUT&RUN antibody binding specificity was confirmed via K-MetStat Panel alignment of sequenced reads for each sample (EpiCypher). Paired-end CUT&RUN reads were then mapped to the mm10 and E. coli (MG1655) genomes using bowtie2 (2.5.2; parameters: –local –very-sensitive –no-mixed –no-discordant –dovetail).134 Low quality mapped reads (-q 30) and PCR duplicates were removed using samtools, and peak calling was performed using SEACR (parameters: norm, stringent).128,135 H3K4me1 and H3K4me3 peaks overlapping DMRs in LPS-treated BMMCs were identified using BEDTools (2.30.0; function: intersect).125 Heatmaps and metaplots for H3K4me1 and H3K4me3 signal at DMRs were generated using deepTools (3.5.2), with each sample normalized to E. coli spike-in control.126 Select DMR enhancers of interest with overlapping H3K4me1 peaks were ascribed to specific genes using the Shendure Lab’s Mouse sci-ATAC-seq Atlas Cicero manifest; with the exception of the Klf4 enhancer, all regions exhibit cis interactions between the enhancer site and target gene TSS (Figure S6).136 The Klf4 enhancer was identified based on overlapping H3K4me1 and H3K27ac peaks and the absence of additional genes within 1Mb sharing the enhancer’s topologically associating domain.
Bisulfite next-generation sequencing analysis
Sequenced reads were trimmed using Trim Galore (0.6.7; http://www.bioinformatics.babraham.ac.uk/projects/trim_galore) and mapped with Bismark (0.22.3; https://www.bioinformatics.babraham.ac.uk/projects/bismark) in paired-end mode. Non-deaminated reads were filtered out based on the presence of ≥ 3 consecutive instances of non-CG methylation (function: filter_non_conversion; parameters: –paired –consecutive). Bedgraph files were prepared using the Bismark Methylation Extractor to calculate percent methylation at each CpG with ≥ 100x coverage. Aligned reads were converted to Bigwig tracks for UCSC browser visualization (http://genome.ucsc.edu).137
Single-cell sequencing analysis
Single-cell sequencing data from WT and Ticam2−/− BMMCs (GenBank: GSE182355) were processed using 10x Genomics Cell Ranger (3.1.0), with reads mapped using the count pipeline and pre-built reference genome refdata-gex-mm10–2020-A and GTF from GENCODE vM23 (GRCm38).11 Downstream analyses were performed in R using Seurat (4.3.0).127 Low quality cells were filtered out based on the following criteria: > 20% mitochondrial reads, < 2.5% ribosomal reads, or < 200 unique genes for a given cell. Following the removal of doublets and a small population of Igcl1/2-positive B cells, 2483 high-quality BMMC cells remained for downstream analysis. For genes expressed in > 2 cells, expression was normalized (normalization.method = “LogNormalize”, scale.factor = 10,000), and PCA was performed using the 2000 most variable genes (selection method = “vst”). The jack-straw method (num.replicate = 100, dims = 50) was used to identify suitable dimensionality for cell clustering (42 dimensions; resolution = 0.6). Cell clusters were visualized with UMAP and annotated based on marker gene expression (FindMarkeres; min.pct = 0.25, logfc. threshold = 0.25).
SCENIC analysis
To identify BMMC single-cell cluster transcription factor regulatory modules, the SCENIC workflow was performed as previously described.57 Expression matrices were prepared for filtered genes expressed in at least 1% of cells and with > 200 counts. SCENIC-derived AUC values for filtered transcription factor modules were visualized via UMAP in Seurat.127 Regulon specificity scores (RSS) for each transcription factor module were plotted for all BMMC cell clusters (calcRSS; thr = 0.01, zThreshold = 2).
Flow cytometry analysis
All flow cytometry data were analyzed with FlowJo (BD Life Sciences). For ex vivo BMMC experiments, mean fluorescence intensity (MFI) values for each antibody were normalized to the average MFI value for WT PBS control cells on a given experimental day. For FlowSOM analysis of bone marrow cells, individual CTRL and CS replicates were downsampled to 15,000 (CTRL) or 10,000 (CS) cells using the DownSampleV3 plugin, for a total of 120,000 cells per condition. Next, cells were clustered using the FlowSOM plugin (15 Metaclusters; Set Seed = 3). All clusters with < 0.5% cells represented were removed from the analysis (Pop0, Pop4, and Pop10), as well as one cluster with poor mapping consistency (Pop13). Cell clusters were visualized using the UMAP plugin.
Statistics
General statistical analyses were performed using Prism 9 (Graphpad). Comparisons between two groups were performed using a two-tailed t-test based on the normal distribution of the data. Comparisons between three or more groups were performed using one-way ANOVA adjusted for Tukey’s multiple comparisons, except II10, Morrbid, and Foxp1 CS model qRT-PCR analyses, which were analyzed by non-parametric Kruskal-Wallis with Dunn’s multiple comparisons. Paired comparisons of PBS control and LPS exhaustion conditions were corrected using Šidák based on the assumption that each comparison is independent of the other. Pearson correlation analyses for DNA methylation against gene expression or H3K27ac signal, as well as Mood’s nonparametric median test for differences in genomic 5mC distributions between cecal slurry samples, were performed in R.138 Sample sizes were chosen based on variation observed in previous BMMC and CS datasets from our laboratory.11,46,48,55,139
Supplementary Material
KEY RESOURCES TABLE
| REAGENT or RESOURCE | SOURCE | IDENTIFIER |
|---|---|---|
| Antibodies | ||
| Rat anti-mouse CD16/CD32 (Fc block) | BD Biosciences | 553142; RRID:AB_394657 |
| PE-Cy7 anti-mouse Ly6C | Biolegend | 128018; RRID:AB_1732082 |
| APC-Cy7 anti-mouse/human CD11b | Biolegend | 101226; RRID:AB_830642 |
| FITC anti-mouse CD86 | Biolegend | 105006; RRID:AB_313149 |
| APC anti-mouse CD274 (PD-L1) | Biolegend | 124312; RRID:AB_10612741 |
| PE anti-mouse CD38 | Biolegend | 102708; RRID:AB_312929 |
| Pacific Blue anti-mouse Ly6C | Biolegend | 128014; RRID:AB_1732079 |
| BV650 rat anti-CD11b | BD Biosciences | 563402; RRID:AB_2738184 |
| PE/Cy5.5 anti-mouse Ly6g | Elabscience | E-AB-F1108I |
| Mouse CXCR2/Il-8RB Alexa Fluor 488 | R&D Systems | FAB2164G |
| APC/Fire 750 anti-mouse CD68 | Biolegend | 137041; RRID:AB_2910295 |
| BV510 rat anti-mouse CD172a | BD Biosciences | 740159; RRID:AB_2739912 |
| PE/Cy7 anti-mouse CX3CR1 | Biolegend | 149016; RRID:AB_2565700 |
| BV711 rat anti-mouse F4/80 | BD Biosciences | 565612; RRID:AB_2734769 |
| BV750 rat anti-mouse CD38 | BD Biosciences | 747103; RRID:AB_2871855 |
| BV421 rat anti-mouse CD274 (PD-L1) | BD Biosciences | 564716; RRID:AB_2738911 |
| Mouse MARCO Alexa Fluor 647 | R&D Systems | FAB29561R |
| BV605 anti-mouse CD95 (FAS) | Biolegend | 152612; RRID:AB_2728202 |
| PerCP anti-mouse I-A/I-E (MHCII) | Biolegend | 107624; RRID:AB_2191073 |
| RHAMM/CD168 [PE] | Novus | NBP1-76538PE; RRID:AB_2927540 |
| Human/Mouse TREM2 Alexa Fluor 700 | R&D Systems | FAB17291N |
| H3K4me1 antibody, for CUT&RUN | EpiCypher | 13-0057; RRID:AB_3076424 |
| H3K4me3 antibody, for CUT&RUN | EpiCypher | 13-0041; RRID:AB_3076423 |
| CUTANA IgG Negative Control for CUT&RUN | EpiCypher | 13-0042; RRID:AB_2923178 |
| Chemicals, peptides, and recombinant proteins | ||
| M-CSF | PeproTech | 315-02 |
| Lipopolysaccharide (LPS) | Sigma-Aldrich | L2630 |
| Monensin A | Sigma Aldrich | M5273 |
| Wnt agonist 1 | Cayman Chemical | 19903 |
| 5-azacytidine | Stem Cell Technologies | 72012 |
| Propidium iodide | Invitrogen | 00-6990-50 |
| Fetal bovine serum (FBS) | TCB | 101 |
| Penicilin / Streptomycin | Gibco | 15140122 |
| GlutaMAX | Gibco | 35050061 |
| Trehalose-6,6-dimycolate | invivoGen | tlrl-tdm-1 |
| Critical commercial assays | ||
| Infinium Mouse Methylation BeadChip | Illumina | 20041558 |
| MiSeq Reagent Nano Kit v2 (500 cycles) | Illumina | MS-103-1003 |
| Amplite Fluorimetric cADP-Ribose Assay Kit | AAT Bioquest | 20305 |
| Power SYBR Green Master Mix | Thermo Fisher | 4367659 |
| NextSeq 1000 v3 P1 (300 cycles) | Illumina | 20050264 |
| Qubit dsDNA Quantification Assay Kit | Invitrogen | Q32851 |
| Deposited data | ||
| H3K27ac ChIP-seq (LPS exhausted bone marrow monocytes) | Naler et al.46 | GEO: GSE168190 |
| scRNA-seq (WT and Ticam2−/− bone marrow monocytes) | Pradhan et al.11 | GEO: GSE182355 |
| H3K4me CUT&RUN-seq (LPS exhausted bone marrow monocytes) | This paper | GEO: GSE253201 |
| DNA methylation Infinium BeadChip array (LPS exhausted bone marrow monocytes and cecal slurry monocytes) | This paper | GEO: GSE242816 |
| Experimental models: Organisms/strains | ||
| C57BL/6 mice | The Jackson Laboratory | 000664 |
| Ticam2−/− mice | Eltzschig Laboratory | https://doi.org/10.1038/s41598-020-71379-y |
| Oligonucleotides | ||
| qRT-PCR primers (See Table S9 for primer sequences) | This paper | N/A |
| MiSeq primers (See Table S9 for primer sequences and genomic coordinates) | This paper | N/A |
| Software and algorithms | ||
| FlowJo (v10) | BD Life Sciences | https://www.flowjo.com |
| Prism (v9) | Graphpad | www.graphpad.com |
| BD FACSDiva (v8.0.2) | BD Life Biosciences | www.bdbiosciences.com/en-us/products/software/instrument-software/bd-facsdiva-software |
| Cytek SpectroFlo (v3.1.2) | Cytek | www.cytekbio.com |
| BioRad CFX Manager (v3.1) | BioRad | 1845000 |
| R (v4.2.0) | R Core Team | cran.r-project.org/bin/windows/base/ |
| sesame (R package; v1.14.2) | Zhou et al.30 | www.bioconductor.org/packages/release/bioc/html/sesame.html |
| ChIPSeeker (R package; v1.22.1) | Yuetal.121 | bioconductor.org/packages/release/bioc/html/ChIPseeker.html |
| HOMER (v4.11) | Heinz etal.122 | homer.ucsd.edu/homer/motif/ |
| g:Profiler2 (R package; v0.2.1) | Peterson et al.123 | cran.r-project.org/web/packages/gprofiler2/index.html |
| pheatmap(R package; v1.0.12) | Raivo Kolde | www.rdocumentation.org/packages/pheatmap |
| Vioplot (R package; v0.4.0) | Tom Kelly | github.com/TomKellyGenetics/vioplot |
| ggplot2 (R package; v3.4.0) | Ginestet124 | cran.r-project.org/web/packages/ggplot2/index.html |
| BEDTools (v2.30.0) | Quinlan et al.125 | bedtools.readthedocs.io/en/latest/ |
| deepTools (v3.5.2) | Ramirez et al.126 | deeptools.readthedocs.io/en/latest/ |
| Trim Galore (v0.6.7) | Felix Krueger | www.bioinformatics.babraham.ac.uk/projects/trim_galore |
| Bismark (v0.22.3) | Felix Krueger | www.bioinformatics.babraham.ac.uk/projects/bismark |
| 10x Genomics Cell Ranger (v3.1.0) | 10x Genomics | www.10xgenomics.com |
| Seurat (R package; v4.3.0.1) | Stuart et al.127 | https://cran.r-project.org/web/packages/Seurat/index.html |
| SCENIC (R package; v1.3.1) | Aibar et al.58 | https://github.com/aertslab/SCENIC |
| SEACR (v1.3) | Meers et al.128 | https://github.com/FredHutch/SEACR |
| Other | ||
| Monocyte Isolation Kit (BM), mouse | Miltenyi | 130-100-629 |
| LS columns | Miltenyi | 130-042-401 |
| RNeasy Plus Mini Kit | QIAGEN | 74134 |
| High-Capacity cDNA Reverse Transcription Kit | Applied Biosystems | 4368813 |
| Amplite Fluorimetric cADPR-Ribose Assay Kit | AAT Bioquest | 20305 |
| DNeasy Blood & Tissue Kit | QIAGEN | 69504 |
| EpiTect Bisulfite Kit | QIAGEN | 59104 |
| PyroMark PCR Kit | QIAGEN | 978703 |
| Multiplex PCR Kit | QIAGEN | 206143 |
| CUTANA ChIC/CUT&RUN Kit | EpiCypher | 14-1048 |
| CUTANA CUT&RUN Library Prep Kit | EpiCypher | 14-1001 |
Highlights.
Monocytes experience broad DNA methylation reprogramming during innate immune exhaustion
Altered DNA methylation at enhancers correlates with disrupted immune gene expression
TICAM2 signaling and Wnt suppression contribute to altered methylome in exhausted cells
Therapeutic intervention with immune training agents restores healthy DNA methylation
ACKNOWLEDGMENTS
The authors would like to thank Yao Zhang for assistance with mouse dissections and Feng Xu for mouse colony management. We would also like to thank technicians at the Fralin Life Sciences Institute at Virginia Tech Genomics Sequencing Center and Children’s Hospital of Philadelphia Center for Applied Genomics for their service and guidance in DNA methylation array- and sequencing-based approaches. This work was supported by the National Institutes of Health: 5TL1DK132771 (B.A.C.) and R01-AI-172133 (L.L.). Figure schematics were created using Biorender.com.
Footnotes
SUPPLEMENTAL INFORMATION
Supplemental information can be found online at https://doi.org/10.1016/j.celrep.2024.113894.
DECLARATION OF INTERESTS
The authors declare no competing interests.
REFERENCES
- 1.Turvey SE, and Broide DH (2010). Innate immunity. J. Allergy Clin. Immunol 125, S24–S32. 10.1016/J.JACI.2009.07.016. [DOI] [PMC free article] [PubMed] [Google Scholar]
- 2.Geissmann F, Manz MG, Jung S, Sieweke MH, Merad M, and Ley K (2010). Development of monocytes, macrophages, and dendritic cells. Science 327, 656–661. 10.1126/science.11783. [DOI] [PMC free article] [PubMed] [Google Scholar]
- 3.Sica A, and Mantovani A (2012). Macrophage plasticity and polarization: in vivo veritas. J. Clin. Invest 122, 787–795. 10.1172/JCI59643. [DOI] [PMC free article] [PubMed] [Google Scholar]
- 4.Quintin J, Cheng SC, van der Meer JWM, and Netea MG (2014). Innate immune memory: towards a better understanding of host defense mechanisms. Curr. Opin. Immunol 29, 1–7. 10.1016/J.COI.2014.02.006. [DOI] [PubMed] [Google Scholar]
- 5.Netea MG, Domínguez-Andrés J, Barreiro LB, Chavakis T, Divangahi M, Fuchs E, Joosten LAB, van der Meer JWM, Mhlanga MM, Mulder WJM, et al. (2020). Defining trained immunity and its role in health and disease. Nat. Rev. Immunol 20, 375–388. 10.1038/s41577-020-0285-6. [DOI] [PMC free article] [PubMed] [Google Scholar]
- 6.Netea MG, Quintin J, and Van Der Meer JWM (2011). Trained Immunity: A Memory for Innate Host Defense. Cell Host Microbe 9, 355–361. 10.1016/J.CHOM.2011.04.006. [DOI] [PubMed] [Google Scholar]
- 7.Yan Q, Carmody RJ, Qu Z, Ruan Q, Jager J, Mullican SE, Lazar MA, and Chen YH (2012). Nuclear factor-κB binding motifs specify Toll-like receptor-induced gene repression through an inducible repressosome. Proc. Natl. Acad. Sci. USA 109, 14140–14145. 10.1073/PNAS.1119842109/-/DCSUPPLEMENTAL. [DOI] [PMC free article] [PubMed] [Google Scholar]
- 8.Foster SL, Hargreaves DC, and Medzhitov R (2007). Gene-specific control of inflammation by TLR-induced chromatin modifications. Nature 447, 972–978. 10.1038/nature05836. [DOI] [PubMed] [Google Scholar]
- 9.Dobrovolskaia MA, and Vogel SN (2002). Toll receptors, CD14, and macrophage activation and deactivation by LPS. Microb. Infect 4, 903–914. 10.1016/S1286-4579(02)01613-1. [DOI] [PubMed] [Google Scholar]
- 10.Fan H, and Cook JA (2016). Review: Molecular mechanisms of endotoxin tolerance. J. Endotoxin Res 10, 71–84. 10.1177/09680519040100020301. [DOI] [PubMed] [Google Scholar]
- 11.Pradhan K, Yi Z, Geng S, and Li L (2021). Development of Exhausted Memory Monocytes and Underlying Mechanisms. Front. Immunol 12, 778830. 10.3389/FIMMU.2021.778830. [DOI] [PMC free article] [PubMed] [Google Scholar]
- 12.Xiao W, Baker HV, Finnerty CC, Jeschke MG, López MC, Klein MB, Gamelli RL, Gibran NS, Arnoldo B, Xu W, et al. (2011). A genomic storm in critically injured humans. J. Exp. Med 208, 2581–2590. 10.1084/JEM.20111354. [DOI] [PMC free article] [PubMed] [Google Scholar]
- 13.Tang Y, Liu J, Zhang D, Xu Z, Ji J, and Wen C (2020). Cytokine Storm in COVID-19: The Current Evidence and Treatment Strategies. Front. Immunol 11, 1708. 10.3389/FIMMU.2020.01708/BIBTEX. [DOI] [PMC free article] [PubMed] [Google Scholar]
- 14.Hu B, Huang S, and Yin L (2021). The cytokine storm and COVID-19. J. Med. Virol 93, 250–256. 10.1002/JMV.26232. [DOI] [PMC free article] [PubMed] [Google Scholar]
- 15.Baudesson de Chanville C, Chousterman BG, Hamon P, Laviron M, Guillou N, Loyher PL, Meghraoui-Kheddar A, Barthelemy S, Deterre P, Boissonnas A, and Combadière C (2020). Sepsis Triggers a Late Expansion of Functionally Impaired Tissue-Vascular Inflammatory Monocytes During Clinical Recovery. Front. Immunol 11, 675. 10.3389/FIMMU.2020.00675/BIBTEX. [DOI] [PMC free article] [PubMed] [Google Scholar]
- 16.Gentile LF, Cuenca AG, Efron PA, Ang D, Bihorac A, McKinley BA, Moldawer LL, and Moore FA (2012). Persistent inflammation and immunosuppression: A common syndrome and new horizon for surgical intensive care. J. Trauma Acute Care Surg 72, 1491–1501. 10.1097/TA.0B013E318256E000. [DOI] [PMC free article] [PubMed] [Google Scholar]
- 17.Prescott HC, and Angus DC (2018). Enhancing Recovery From Sepsis: A Review. JAMA 319, 62–75. 10.1001/JAMA.2017.17687. [DOI] [PMC free article] [PubMed] [Google Scholar]
- 18.Smale ST, Tarakhovsky A, and Natoli G (2014). Chromatin Contributions to the Regulation of Innate Immunity. Annu. Rev. Immunol 32, 489–511. 10.1146/ANNUREV-IMMUNOL-031210-101303. [DOI] [PubMed] [Google Scholar]
- 19.Rodriguez RM, Suarez-Alvarez B, and Lopez-Larrea C (2019). Therapeutic Epigenetic Reprogramming of Trained Immunity in Myeloid Cells. Trends Immunol. 40, 66–80. 10.1016/J.IT.2018.11.006. [DOI] [PubMed] [Google Scholar]
- 20.Saeed S, Quintin J, Kerstens HHD, Rao NA, Aghajanirefah A, Matarese F, Cheng SC, Ratter J, Berentsen K, Van Der Ent MA, et al. (2014). Epigenetic programming of monocyte-to-macrophage differentiation and trained innate immunity. Science 345, 1251086. 10.1126/science.1251086. [DOI] [PMC free article] [PubMed] [Google Scholar]
- 21.Kleinnijenhuis J, Quintin J, Preijers F, Joosten LAB, Ifrim DC, Saeed S, Jacobs C, Van Loenhout J, De Jong D, Stunnenberg HG, et al. (2012). Bacille Calmette-Guérin induces NOD2-dependent nonspecific protection from reinfection via epigenetic reprogramming of monocytes. Proc. Natl. Acad. Sci. USA 109, 17537–17542. 10.1073/PNAS.1202870109/-/DCSUPPLEMENTAL. [DOI] [PMC free article] [PubMed] [Google Scholar]
- 22.Bekkering S, Quintin J, Joosten LAB, Van Der Meer JWM, Netea MG, and Riksen NP (2014). Oxidized low-density lipoprotein induces long-term proinflammatory cytokine production and foam cell formation via epigenetic reprogramming of monocytes. Arterioscler. Thromb. Vasc. Biol 34, 1731–1738. 10.1161/ATVBAHA.114.303887. [DOI] [PubMed] [Google Scholar]
- 23.De Santa F, Totaro MG, Prosperini E, Notarbartolo S, Testa G, and Natoli G (2007). The Histone H3 Lysine-27 Demethylase Jmjd3 Links Inflammation to Inhibition of Polycomb-Mediated Gene Silencing. Cell 130, 1083–1094. 10.1016/J.CELL.2007.08.019. [DOI] [PubMed] [Google Scholar]
- 24.De Santa F, Narang V, Yap ZH, Tusi BK, Burgold T, Austenaa L, Bucci G, Caganova M, Notarbartolo S, Casola S, et al. (2009). Jmjd3 contributes to the control of gene expression in LPS-activated macrophages. EMBO J. 28, 3341–3352. 10.1038/EMBOJ.2009.271. [DOI] [PMC free article] [PubMed] [Google Scholar]
- 25.Zhang L, Lu Q, and Chang C (2020). Epigenetics in Health and Disease. Adv. Exp. Med. Biol 1253, 3–55. 10.1007/978-981-15-3449-2_1/FIGURES/6. [DOI] [PubMed] [Google Scholar]
- 26.Novakovic B, Habibi E, Wang SY, Arts RJW, Davar R, Megchelenbrink W, Kim B, Kuznetsova T, Kox M, Zwaag J, et al. (2016). β-Glucan Reverses the Epigenetic State of LPS-Induced Immunological Tolerance. Cell 167, 1354–1368.e14. 10.1016/J.CELL.2016.09.034. [DOI] [PMC free article] [PubMed] [Google Scholar]
- 27.Lorente-Sorolla C, Garcia-Gomez A, Català-Moll F, Toledano V, Ciudad L, Avendaño-Ortiz J, Maroun-Eid C, Martín-Quirós A, Martínez-Gallo M, Ruiz-Sanmartín A, et al. (2019). Inflammatory cytokines and organ dysfunction associate with the aberrant DNA methylome of monocytes in sepsis. Genome Med. 11, 66–18. 10.1186/s13073-019-0674-2. [DOI] [PMC free article] [PubMed] [Google Scholar]
- 28.Bird A (2007). Perceptions of epigenetics. Nature 447, 396–398. 10.1038/nature05913. [DOI] [PubMed] [Google Scholar]
- 29.Smith ZD, and Meissner A (2013). DNA methylation: Roles in mammalian development. Nat. Rev. Genet 14, 204–220. 10.1038/nrg3354. [DOI] [PubMed] [Google Scholar]
- 30.Zhou W, Hinoue T, Barnes B, Mitchell O, Iqbal W, Lee SM, Foy KK, Lee KH, Moyer EJ, VanderArk A, et al. (2022). DNA methylation dynamics and dysregulation delineated by high-throughput profiling in the mouse. Cell Genom. 2, 100144. 10.1016/J.XGEN.2022.100144. [DOI] [PMC free article] [PubMed] [Google Scholar]
- 31.Zhou W, Triche TJ, Laird PW, and Shen H (2018). SeSAMe: Reducing artifactual detection of DNA methylation by Infinium BeadChips in genomic deletions. Nucleic Acids Res. 46, 123. 10.1093/nar/gky691. [DOI] [PMC free article] [PubMed] [Google Scholar]
- 32.Lee K, Boyd KL, Parekh DV, Kehl-Fie TE, Baldwin HS, Brakebusch C, Skaar EP, Boothby M, and Zent R (2013). Cdc42 promotes host defenses against fatal infection. Infect. Immun 81, 2714–2723. 10.1128/IAI.01114-12. [DOI] [PMC free article] [PubMed] [Google Scholar]
- 33.Hahmeyer M.L.d.S., and da Silva-Santos JE (2021). Rho-Proteins and Downstream Pathways as Potential Targets in Sepsis and Septic Shock: What Have We Learned from Basic Research. Cells 10, 1844. 10.3390/CELLS10081844. [DOI] [PMC free article] [PubMed] [Google Scholar]
- 34.Roy R, Ramamoorthy S, Shapiro BD, Kaileh M, Hernandez D, Sarantopoulou D, Arepalli S, Boller S, Singh A, Bektas A, et al. (2021). DNA methylation signatures reveal that distinct combinations of transcription factors specify human immune cell epigenetic identity. Immunity 54, 2465–2480.e5. 10.1016/J.IMMUNI.2021.10.001. [DOI] [PMC free article] [PubMed] [Google Scholar]
- 35.Reyes M, Filbin MR, Bhattacharyya RP, Billman K, Eisenhaure T, Hung DT, Levy BD, Baron RM, Blainey PC, Goldberg MB, and Hacohen N (2020). An immune-cell signature of bacterial sepsis. Nat. Med 26, 333–340. 10.1038/s41591-020-0752-4. [DOI] [PMC free article] [PubMed] [Google Scholar]
- 36.Schulte-Schrepping J, Reusch N, Paclik D, Baßler K, Schlickeiser S, Zhang B, Krämer B, Krammer T, Brumhard S, Bonaguro L, et al. (2020). Severe COVID-19 Is Marked by a Dysregulated Myeloid Cell Compartment. Cell 182, 1419–1440.e23. 10.1016/J.CELL.2020.08.001. [DOI] [PMC free article] [PubMed] [Google Scholar]
- 37.Kurotaki D, Osato N, Nishiyama A, Yamamoto M, Ban T, Sato H, Nakabayashi J, Umehara M, Miyake N, Matsumoto N, et al. (2013). Essential role of the IRF8-KLF4 transcription factor cascade in murine monocyte differentiation. Blood 121, 1839–1849. 10.1182/blood-2012-06. [DOI] [PMC free article] [PubMed] [Google Scholar]
- 38.de la Rica L, Rodríguez-Ubreva J, García M, Islam ABMMK, Urquiza JM, Hernando H, Christensen J, Helin K, Gómez-Vaquero C, and Ballestar E (2013). PU.1 target genes undergo Tet2-coupled demethylation and DNMT3b-mediated methylation in monocyte-to-osteoclast differentiation. Genome Biol. 14, R99–R21. 10.1186/gb-2013-14-9-r99. [DOI] [PMC free article] [PubMed] [Google Scholar]
- 39.Dekkers KF, Neele AE, Jukema JW, Heijmans BT, and De Winther MPJ (2019). Human monocyte-to-macrophage differentiation involves highly localized gain and loss of DNA methylation at transcription factor binding sites. Epigenet. Chromatin 12, 34–13. 10.1186/s13072-019-0279-4. [DOI] [PMC free article] [PubMed] [Google Scholar]
- 40.Voon DCC, Hor YT, and Ito Y (2015). The RUNX complex: reaching beyond haematopoiesis into immunity. Immunology 146, 523–536. 10.1111/IMM.12535. [DOI] [PMC free article] [PubMed] [Google Scholar]
- 41.Kabra A, and Bushweller J (2022). The Intrinsically Disordered Proteins MLLT3 (AF9) and MLLT1 (ENL) – Multimodal Transcriptional Switches With Roles in Normal Hematopoiesis, MLL Fusion Leukemia, and Kidney Cancer. J. Mol. Biol 434, 167117. 10.1016/J.JMB.2021.167117. [DOI] [PMC free article] [PubMed] [Google Scholar]
- 42.Calvanese V, Nguyen AT, Bolan TJ, Vavilina A, Su T, Lee LK, Wang Y, Lay FD, Magnusson M, Crooks GM, et al. (2019). MLLT3 governs human haematopoietic stem-cell self-renewal and engraftment. Nature 576, 281–286. 10.1038/s41586-019-1790-2. [DOI] [PMC free article] [PubMed] [Google Scholar]
- 43.Ferry L, Fournier A, Tsusaka T, Adelmant G, Shimazu T, Matano S, Kirsh O, Amouroux R, Dohmae N, Suzuki T, et al. (2017). Methylation of DNA Ligase 1 by G9a/GLP Recruits UHRF1 to Replicating DNA and Regulates DNA Methylation. Mol. Cell 67, 550–565.e5. 10.1016/j.molcel.2017.07.012. [DOI] [PubMed] [Google Scholar]
- 44.Ooi SKT, Qiu C, Bernstein E, Li K, Jia D, Yang Z, Erdjument-Bromage H, Tempst P, Lin SP, Allis CD, et al. (2007). DNMT3L connects unmethylated lysine 4 of histone H3 to de novo methylation of DNA. Nature 448, 714–717. 10.1038/nature05987. [DOI] [PMC free article] [PubMed] [Google Scholar]
- 45.Otani J, Nankumo T, Arita K, Inamoto S, Ariyoshi M, and Shirakawa M (2009). Structural basis for recognition of H3K4 methylation status by the DNA methyltransferase 3A ATRX–DNMT3–DNMT3L domain. EMBO Rep. 10, 1235–1241. 10.1038/EMBOR.2009.218. [DOI] [PMC free article] [PubMed] [Google Scholar]
- 46.Naler LB, Hsieh YP, Geng S, Zhou Z, Li L, and Lu C (2022). Epigenomic and transcriptomic analyses reveal differences between low-grade inflammation and severe exhaustion in LPS-challenged murine monocytes. Commun. Biol 5, 102–117. 10.1038/s42003-022-03035-2. [DOI] [PMC free article] [PubMed] [Google Scholar]
- 47.Vento-Tormo R, Company C, Rodríguez-Ubreva J, de la Rica L, Urquiza JM, Javierre BM, Sabarinathan R, Luque A, Esteller M, Aran JM, et al. (2016). IL-4 orchestrates STAT6-mediated DNA demethylation leading to dendritic cell differentiation. Genome Biol. 17, 4–18. 10.1186/s13059-015-0863-2. [DOI] [PMC free article] [PubMed] [Google Scholar]
- 48.Lee J, Geng S, Li S, and Li L (2021). Single Cell RNA-Seq and Machine Learning Reveal Novel Subpopulations in Low-Grade Inflammatory Monocytes With Unique Regulatory Circuits. Front. Immunol 12, 266. 10.3389/FIMMU.2021.627036/BIBTEX. [DOI] [PMC free article] [PubMed] [Google Scholar]
- 49.Schmidl C, Renner K, Peter K, Eder R, Lassmann T, Balwierz PJ, Itoh M, Nagao-Sato S, Kawaji H, Carninci P, et al. (2014). Transcription and enhancer profiling in human monocyte subsets. Blood 123, e90–e99. 10.1182/BLOOD-2013-02-484188. [DOI] [PubMed] [Google Scholar]
- 50.Ugalde AP, Bretones G, Rodríguez D, Quesada V, Llorente F, Fernández-Delgado R, Jiménez-Clavero MÁ, Vázquez J, Calvo E, Tamargo-Gómez I, et al. (2022). Autophagy-linked plasma and lysosomal membrane protein PLAC8 is a key host factor for SARS-CoV-2 entry into human cells. EMBO J. 41, e110727. 10.15252/EMBJ.2022110727. [DOI] [PMC free article] [PubMed] [Google Scholar]
- 51.Tse LV, Meganck RM, Araba KC, Yount BL, Shaffer KM, Hou YJ, Munt JE, Adams LE, Wykoff JA, Morowitz JM, et al. (2022). Genomewide CRISPR knockout screen identified PLAC8 as an essential factor for SADS-CoVs infection. Proc. Natl. Acad. Sci. USA 119, e2118126119. 10.1073/pnas.2118126119. [DOI] [PMC free article] [PubMed] [Google Scholar]
- 52.Villani AC, Satija R, Reynolds G, Sarkizova S, Shekhar K, Fletcher J, Griesbeck M, Butler A, Zheng S, Lazo S, et al. (2017). Single-cell RNA-seq reveals new types of human blood dendritic cells, monocytes, and progenitors. Science 356, eaah4573. 10.1126/science.aah4573. [DOI] [PMC free article] [PubMed] [Google Scholar]
- 53.Wolf AA, Yáñez A, Barman PK, and Goodridge HS (2019). The ontogeny of monocyte subsets. Front. Immunol 10, 469610. 10.3389/FIMMU.2019.01642/BIBTEX. [DOI] [PMC free article] [PubMed] [Google Scholar]
- 54.Ikeda N, Kubota H, Suzuki R, Morita M, Yoshimura A, Osada Y, Kishida K, Kitamura D, Iwata A, Yotsumoto S, et al. (2023). The early neutrophil-committed progenitors aberrantly differentiate into immuno-regulatory monocytes during emergency myelopoiesis. Cell Rep. 42, 112165. 10.1016/J.CELREP.2023.112165. [DOI] [PubMed] [Google Scholar]
- 55.Lin R, Zhang Y, Pradhan K, and Li L (2020). TICAM2-related pathway mediates neutrophil exhaustion. Sci. Rep 10, 14397–14412. 10.1038/s41598-020-71379-y. [DOI] [PMC free article] [PubMed] [Google Scholar]
- 56.Li Y, Zhang P, Wang C, Han C, Meng J, Liu X, Xu S, Li N, Wang Q, Shi X, and Cao X (2013). Immune Responsive Gene 1 (IRG1) promotes endotoxin tolerance by increasing A20 expression in macrophages through reactive oxygen species. J. Biol. Chem 288, 16225–16234. 10.1074/jbc.M113.454538. [DOI] [PMC free article] [PubMed] [Google Scholar]
- 57.Aibar S, González-Blas CB, Moerman T, Huynh-Thu VA, Imrichova H, Hulselmans G, Rambow F, Marine JC, Geurts P, Aerts J, et al. (2017). SCENIC: single-cell regulatory network inference and clustering. Nat. Methods 14, 1083–1086. 10.1038/nmeth.4463. [DOI] [PMC free article] [PubMed] [Google Scholar]
- 58.Avendaño-Ortiz J, Maroun-Eid C, Martín-Quirós A, Toledano V, Cubillos-Zapata C, Gómez-Campelo P, Varela-Serrano A, Casas-Martin J, Llanos-González E, Alvarez E, et al. (2018). PD-L1 Overexpression During Endotoxin Tolerance Impairs the Adaptive Immune Response in Septic Patients via HIF1α. J. Infect. Dis 217, 393–404. 10.1093/INFDIS/JIX279. [DOI] [PubMed] [Google Scholar]
- 59.Kang R, Zeng L, Xie Y, Yan Z, Zhou B, Cao L, Klionsky DJ, Tracey KJ, Li J, Wang H, et al. (2016). A novel PINK1- and PARK2-dependent protective neuroimmune pathway in lethal sepsis. Autophagy 12, 2374–2385. 10.1080/15548627.2016.1239678. [DOI] [PMC free article] [PubMed] [Google Scholar]
- 60.El Kasmi KC, Smith AM, Williams L, Neale G, Panopoulos AD, Watowich SS, Häcker H, Foxwell BMJ, and Murray PJ (2007). Cutting Edge: A Transcriptional Repressor and Corepressor Induced by the STAT3-Regulated Anti-Inflammatory Signaling Pathway. J. Immunol 179, 7215–7219. 10.4049/JIMMUNOL.179.11.7215. [DOI] [PubMed] [Google Scholar]
- 61.Bujor AM, El Adili F, Parvez A, Marden G, and Trojanowska M (2020). Fli1 Downregulation in Scleroderma Myeloid Cells Has Profibrotic and Proinflammatory Effects. Front. Immunol 11, 531627. 10.3389/FIMMU.2020.00800/BIBTEX. [DOI] [PMC free article] [PubMed] [Google Scholar]
- 62.Lee JC, Espéli M, Anderson CA, Linterman MA, Pocock JM, Williams NJ, Roberts R, Viatte S, Fu B, Peshu N, et al. (2013). Human SNP links differential outcomes in inflammatory and infectious disease to a FOXO3-regulated pathway. Cell 155, 57–69. 10.1016/j.cell.2013.08.034. [DOI] [PMC free article] [PubMed] [Google Scholar]
- 63.Del Bosque-Plata L, Martínez-Martínez E, Espinoza-Camacho MÁ, and Gragnoli C (2021). The Role of TCF7L2 in Type 2 Diabetes. Diabetes 70, 1220–1228. 10.2337/DB20-0573. [DOI] [PMC free article] [PubMed] [Google Scholar]
- 64.Tumova L, Pombinho AR, Vojtechova M, Stancikova J, Gradl D, Krausova M, Sloncova E, Horazna M, Kriz V, Machonova O, et al. (2014). Monensin inhibits canonical Wnt signaling in human colorectal cancer cells and suppresses tumor growth in multiple intestinal neoplasia mice. Mol. Cancer Therapeut 13, 812–822. 10.1158/1535-7163.MCT-13-0625. [DOI] [PubMed] [Google Scholar]
- 65.Zhao L, Glazov EA, Pattabiraman DR, Al-Owaidi F, Zhang P, Brown MA, Leo PJ, and Gonda TJ (2011). Integrated genomewide chromatin occupancy and expression analyses identify key myeloid pro-differentiation transcription factors repressed by Myb. Nucleic Acids Res. 39, 4664–4679. 10.1093/NAR/GKR024. [DOI] [PMC free article] [PubMed] [Google Scholar]
- 66.Yusenko MV, Trentmann A, Andersson MK, Ghani LA, Jakobs A, Arteaga Paz MF, Mikesch JH, Peter von Kries J, Stenman G, and Klempnauer KH (2020). Monensin, a novel potent MYB inhibitor, suppresses proliferation of acute myeloid leukemia and adenoid cystic carcinoma cells. Cancer Lett. 479, 61–70. 10.1016/J.CAN-LET.2020.01.039. [DOI] [PubMed] [Google Scholar]
- 67.Piedra-Quintero ZL, Wilson Z, Nava P, and Guerau-de-Arellano M (2020). CD38: An Immunomodulatory Molecule in Inflammation and Autoimmunity. Front. Immunol 11, 597959. 10.3389/FIMMU.2020.597959/BIBTEX. [DOI] [PMC free article] [PubMed] [Google Scholar]
- 68.Joe Y, Chen Y, Park J, Kim HJ, Rah SY, Ryu J, Cho GJ, Choi HS, Ryter SW, Park JW, et al. (2020). Cross-talk between CD38 and TTP Is Essential for Resolution of Inflammation during Microbial Sepsis. Cell Rep. 30, 1063–1076.e5. 10.1016/J.CELREP.2019.12.090. [DOI] [PubMed] [Google Scholar]
- 69.Hong G, Zheng D, Zhang L, Ni R, Wang G, Fan GC, Lu Z, and Peng T (2018). Administration of nicotinamide riboside prevents oxidative stress and organ injury in sepsis. Free Radic. Biol. Med 123, 125–137. 10.1016/J.FREERADBIOMED.2018.05.073. [DOI] [PMC free article] [PubMed] [Google Scholar]
- 70.Galley HF (2011). Oxidative stress and mitochondrial dysfunction in sepsis. Br. J. Anaesth 107, 57–64. 10.1093/BJA/AER093. [DOI] [PubMed] [Google Scholar]
- 71.Charvat RA, and Arrizabalaga G (2016). Oxidative stress generated during monensin treatment contributes to altered Toxoplasma gondii mitochondrial function. Sci. Rep 6, 22997–23017. 10.1038/srep22997. [DOI] [PMC free article] [PubMed] [Google Scholar]
- 72.Decout A, Silva-Gomes S, Drocourt D, Barbe S, André I, Cueto FJ, Lioux T, Sancho D, Pérouzel E, Vercellone A, et al. (2017). Rational design of adjuvants targeting the C-type lectin Mincle. Proc. Natl. Acad. Sci. USA 114, 2675–2680. 10.1073/pnas.1612421114. [DOI] [PMC free article] [PubMed] [Google Scholar]
- 73.Madonna GS, Ledney GD, Elliott TB, Brook I, Ulrich JT, Myers KR, Patchen ML, and Walker RI (1989). Trehalose dimycolate enhances resistance to infection in neutropenic animals. Infect. Immun 57, 2495–2501. 10.1128/IAI.57.8.2495-2501.1989. [DOI] [PMC free article] [PubMed] [Google Scholar]
- 74.Ohishi K, Varnum-Finney B, Flowers D, Anasetti C, Myerson D, and Bernstein ID (2000). Monocytes express high amounts of Notch and undergo cytokine specific apoptosis following interaction with the Notch ligand, Delta-1. Blood 95, 2847–2854. 10.1182/BLOOD.V95.9.2847.009K19_2847_2854. [DOI] [PubMed] [Google Scholar]
- 75.Hildebrand D, Uhle F, Sahin D, Krauser U, Weigand MA, and Heeg K (2018). The interplay of notch signaling and STAT3 in TLR-activated human primary monocytes. Front. Cell. Infect. Microbiol 8, 382917. 10.3389/FCIMB.2018.00241/BIBTEX. [DOI] [PMC free article] [PubMed] [Google Scholar]
- 76.Frede S, Stockmann C, Freitag P, and Fandrey J (2006). Bacterial lipopolysaccharide induces HIF-1 activation in human monocytes via p44/42 MAPK and NF-κB. Biochem. J 396, 517–527. 10.1042/BJ20051839. [DOI] [PMC free article] [PubMed] [Google Scholar]
- 77.Van Gassen S, Callebaut B, Van Helden MJ, Lambrecht BN, De-meester P, Dhaene T, and Saeys Y (2015). FlowSOM: Using self-organizing maps for visualization and interpretation of cytometry data. Cytometry A. 87, 636–645. 10.1002/CYTO.A.22625. [DOI] [PubMed] [Google Scholar]
- 78.Serbina NV, Jia T, Hohl TM, and Pamer EG (2008). Monocyte-Mediated Defense Against Microbial Pathogens. Annu. Rev. Immunol 26, 421–452. 10.1146/annurev.immunol.26.021607.090326. [DOI] [PMC free article] [PubMed] [Google Scholar]
- 79.Cebinelli GCM, de Lima KA, Silva Castanheira F.V.e., Hiroki CH, Monteiro VVS, de Lima MHF, Nascimento DCB, Alves Filho JC, Cunha TM, and Cunha F.d.Q. (2021). CCR2-deficient mice are protected to sepsis by the disruption of the inflammatory monocytes emigration from the bone marrow. J. Leukoc. Biol 109, 1063–1070. 10.1002/JLB.4MR0820-049RR. [DOI] [PubMed] [Google Scholar]
- 80.Mukherjee R, Kanti Barman P, Kumar Thatoi P, Tripathy R, Kumar Das B, and Ravindran B (2015). Non-Classical monocytes display inflammatory features: Validation in Sepsis and Systemic Lupus Erythematous. Sci. Rep 5, 13886–13914. 10.1038/srep13886. [DOI] [PMC free article] [PubMed] [Google Scholar]
- 81.Gibellini L, De Biasi S, Paolini A, Borella R, Boraldi F, Mattioli M, Lo Tartaro D, Meschiari M,, et al. Fidanza L, et al. (2020). Altered bioenergetics and mitochondrial dysfunction of monocytes in patients with COVID-19 pneumonia. EMBO Mol. Med 12, e13001. 10.15252/EMMM.202013001. [DOI] [PMC free article] [PubMed] [Google Scholar]
- 82.Hortová-Kohoutková M, Láznicková P, Bendíčková K, De Zuani M, Andrejcinová I, Tomášková V, Suk P, Šrámek V, Helán M, and Frič J (2020). Differences in monocyte subsets are associated with short-term survival in patients with septic shock. J. Cell Mol. Med 24, 12504–12512. 10.1111/JCMM.15791. [DOI] [PMC free article] [PubMed] [Google Scholar]
- 83.Ayala A, Lomas JL, Grutkoski PS, and Chung CS (2003). Fas-ligand mediated apoptosis in severe sepsis and shock. Scand. J. Infect. Dis 35, 593–600. 10.1080/00365540310015656. [DOI] [PubMed] [Google Scholar]
- 84.Wesche DE, Lomas-Neira JL, Perl M, Chung C-S, and Ayala A (2005). Leukocyte apoptosis and its significance in sepsis and shock. J. Leukoc. Biol 78, 325–337. 10.1189/JLB.0105017. [DOI] [PubMed] [Google Scholar]
- 85.Weber GF, Chousterman BG, He S, Fenn AM, Nairz M, Anzai A, Brenner T, Uhle F, Iwamoto Y, Robbins CS, et al. (2015). Interleukin-3 amplifies acute inflammation and is a potential therapeutic target in sepsis. Science 347, 1260–1265. 10.1126/science.aaa4268. [DOI] [PMC free article] [PubMed] [Google Scholar]
- 86.Serantes R, Arnalich F, Figueroa M, Salinas M, Andrés-Mateos E, Codoceo R, Renart J, Matute C, Cavada C, Cuadrado A, and Montiel C (2006). Interleukin-1β Enhances GABAA Receptor Cell-surface Expression by a Phosphatidylinositol 3-Kinase/Akt Pathway: RELEVANCE TO SEPSIS-ASSOCIATED ENCEPHALOPATHY. J. Biol. Chem 281, 14632–14643. 10.1074/JBC.M512489200. [DOI] [PubMed] [Google Scholar]
- 87.Recknagel P, Gonnert FA, Westermann M, Lambeck S, Lupp A, Rudiger A, Dyson A, Carré JE, Kortgen A, Krafft C, et al. (2012). Liver Dysfunction and Phosphatidylinositol-3-Kinase Signalling in Early Sepsis: Experimental Studies in Rodent Models of Peritonitis. PLoS Med. 9, e1001338. 10.1371/JOURNAL.PMED.1001338. [DOI] [PMC free article] [PubMed] [Google Scholar]
- 88.Lee SK, Kim SD, Kook M, Lee HY, Ghim J, Choi Y, Zabel BA, Ryu SH, and Bae YS (2015). Phospholipase D2 drives mortality in sepsis by inhibiting neutrophil extracellular trap formation and downregulating CXCR2. J. Exp. Med 212, 1381–1390. 10.1084/JEM.20141813. [DOI] [PMC free article] [PubMed] [Google Scholar]
- 89.Abdulnour REE, Howrylak JA, Tavares AH, Douda DN, Henkels KM, Miller TE, Fredenburgh LE, Baron RM, Gomez-Cambronero J, and Levy BD (2018). Phospholipase D isoforms differentially regulate leukocyte responses to acute lung injury. J. Leukoc. Biol 103, 919–932. 10.1002/JLB.3A0617-252RR. [DOI] [PMC free article] [PubMed] [Google Scholar]
- 90.Wasyluk W, and Zwolak A (2021). Metabolic Alterations in Sepsis. J. Clin. Med 10, 2412. 10.3390/JCM10112412. [DOI] [PMC free article] [PubMed] [Google Scholar]
- 91.Ifrim DC, Quintin J, Joosten LAB, Jacobs C, Jansen T, Jacobs L, Gow NAR, Williams DL, Van Der Meer JWM, and Netea MG (2014). Trained immunity or tolerance: Opposing functional programs induced in human monocytes after engagement of various pattern recognition receptors. Clin. Vaccine Immunol 21, 534–545. 10.1128/CVI.00688-13. [DOI] [PMC free article] [PubMed] [Google Scholar]
- 92.Shalova IN, Lim JY, Chittezhath M, Zinkernagel AS, Beasley F, Hernández-Jiménez E, Toledano V, Cubillos-Zapata C, Rapisarda A, Chen J, et al. (2015). Human Monocytes Undergo Functional Re-programming during Sepsis Mediated by Hypoxia-Inducible Factor-1α. Immunity 42, 484–498. 10.1016/J.IMMUNI.2015.02.001. [DOI] [PubMed] [Google Scholar]
- 93.Bomans K, Schenz J, Sztwiertnia I, Schaack D, Weigand MA, and Uhle F (2018). Sepsis induces a long-lasting state of trained immunity in bone marrow monocytes. Front. Immunol 9, 422344. 10.3389/FIMMU.2018.02685/BIBTEX. [DOI] [PMC free article] [PubMed] [Google Scholar]
- 94.Hamers L, Kox M, and Pickkers P (2015). Sepsis-induced immunoparalysis: mechanisms, markers, and treatment options. Minerva Anestesiol. 81, 426–439. [PubMed] [Google Scholar]
- 95.Netea MG, Joosten LAB, Latz E, Mills KHG, Natoli G, Stunnenberg HG, O’Neill LAJ, and Xavier RJ (2016). Trained immunity: A program of innate immune memory in health and disease. Science 352, aaf1098. 10.1126/science.aaf1098. [DOI] [PMC free article] [PubMed] [Google Scholar]
- 96.Davis FM, Schaller MA, Dendekker A, Joshi AD, Kimball AS, Evanoff H, Wilke C, Obi AT, Melvin WJ, Cavassani K, et al. (2019). Sepsis Induces Prolonged Epigenetic Modifications in Bone Marrow and Peripheral Macrophages Impairing Inflammation and Wound Healing. Arterioscler. Thromb. Vasc. Biol 39, 2353–2366. 10.1161/ATVBAHA.119.312754. [DOI] [PMC free article] [PubMed] [Google Scholar]
- 97.Van Der Kroef M, Castellucci M, Mokry M, Cossu M, Garonzi M, Bossini-Castillo LM, Chouri E, Wichers CGK, Beretta L, Trombetta E, et al. (2019). Histone modifications underlie monocyte dysregulation in patients with systemic sclerosis, underlining the treatment potential of epigenetic targeting. Ann. Rheum. Dis 78, 529–538. 10.1136/ANNRHEUMDIS-2018-214295. [DOI] [PubMed] [Google Scholar]
- 98.Caldwell B, and Li L (2024). Epigenetic regulation of innate immune dynamics during inflammation. J Leukoc Biol, qiae026. 10.1093/jleuko/qiae026. [DOI] [PMC free article] [PubMed] [Google Scholar]
- 99.Verma D, Parasa VR, Raffetseder J, Martis M, Mehta RB, Netea M, and Lerm M (2017). Anti-mycobacterial activity correlates with altered DNA methylation pattern in immune cells from BCG-vaccinated subjects. Sci. Rep 7, 12305–12310. 10.1038/s41598-017-12110-2. [DOI] [PMC free article] [PubMed] [Google Scholar]
- 100.Morante-Palacios O, Lorente-Sorolla C, Ciudad L, Calafell-Segura J, Garcia-Gomez A, Català-Moll F, Ruiz-Sanmartín A, Martínez-Gallo M, Ferrer R, Ruiz-Rodriguez JC, et al. (2021). JAK2-STAT Epigenetically Regulates Tolerized Genes in Monocytes in the First Encounter With Gram-Negative Bacterial Endotoxins in Sepsis. Front. Immunol 12, 4688. 10.3389/FIMMU.2021.734652/BIBTEX. [DOI] [PMC free article] [PubMed] [Google Scholar]
- 101.Deaton AM, and Bird A (2011). CpG islands and the regulation of transcription. Genes Dev. 25, 1010–1022. 10.1101/GAD.2037511. [DOI] [PMC free article] [PubMed] [Google Scholar]
- 102.Galaviz-Hernandez C, Stagg C, De Ridder G, Tanaka TS, Ko MSH, Schlessinger D, and Nagaraja R (2003). Plac8 and Plac9, novel placental-enriched genes identified through microarray analysis. Gene 309, 81–89. 10.1016/S0378-1119(03)00508-0. [DOI] [PubMed] [Google Scholar]
- 103.Kinsey C, Balakrishnan V, O’Dell MR, Huang JL, Newman L, Whitney-Miller CL, Hezel AF, and Land H (2014). Plac8 Links Oncogenic Mutations to Regulation of Autophagy and Is Critical to Pancreatic Cancer Progression. Cell Rep. 7, 1143–1155. 10.1016/J.CELREP.2014.03.061. [DOI] [PMC free article] [PubMed] [Google Scholar]
- 104.Jimenez-Preitner M, Berney X, Uldry M, Vitali A, Cinti S, Ledford JG, and Thorens B (2011). Plac8 Is an Inducer of C/EBPβ Required for Brown Fat Differentiation, Thermoregulation, and Control of Body Weight. Cell Metabol 14, 658–670. 10.1016/J.CMET.2011.08.008. [DOI] [PubMed] [Google Scholar]
- 105.Tickenbrock L, Schwäble J, Strey A, Sargin B, Hehn S, Baas M, Choudhary C, Gerke V, Berdel WE, Müller-Tidow C, and Serve H (2006). Wnt signaling regulates transendothelial migration of monocytes. J. Leukoc. Biol 79, 1306–1313. 10.1189/JLB.0905539. [DOI] [PubMed] [Google Scholar]
- 106.Lee DK, Nathan Grantham R, Trachte AL, Mannion JD, and Wilson CL (2006). Activation of the canonical Wnt/β-catenin pathway enhances monocyte adhesion to endothelial cells. Biochem. Biophys. Res. Commun 347, 109–116. 10.1016/J.BBRC.2006.06.082. [DOI] [PubMed] [Google Scholar]
- 107.Sheng Y, Ju W, Huang Y, Li J, Ozer H, Qiao X, and Qian Z (2016). Activation of wnt/β-catenin signaling blocks monocyte–macrophage differentiation through antagonizing PU.1-targeted gene transcription. Leukemia 30, 2106–2109. 10.1038/leu.2016.146. [DOI] [PMC free article] [PubMed] [Google Scholar]
- 108.van der Meer JWM, Joosten LAB, Riksen N, and Netea MG (2015). Trained immunity: A smart way to enhance innate immune defence. Mol. Immunol 68, 40–44. 10.1016/J.MOLIMM.2015.06.019. [DOI] [PubMed] [Google Scholar]
- 109.Bekkering S, Joosten LAB, Van Der Meer JWM, Netea MG, and Riksen NP (2015). The Epigenetic Memory of Monocytes and Macrophages as a Novel Drug Target in Atherosclerosis. Clin. Therapeut 37, 914–923. 10.1016/J.CLINTHERA.2015.01.008. [DOI] [PubMed] [Google Scholar]
- 110.Netea MG, Giamarellos-Bourboulis EJ, Domínguez-Andrés J, Curtis N, van Crevel R, van de Veerdonk FL, and Bonten M (2020). Trained Immunity: a Tool for Reducing Susceptibility to and the Severity of SARS-CoV-2 Infection. Cell 181, 969–977. 10.1016/J.CELL.2020.04.042. [DOI] [PMC free article] [PubMed] [Google Scholar]
- 111.Quintin J, Saeed S, Martens JHA, Giamarellos-Bourboulis EJ, Ifrim DC, Logie C, Jacobs L, Jansen T, Kullberg BJ, Wijmenga C, et al. (2012). Candida albicans Infection Affords Protection against Reinfection via Functional Reprogramming of Monocytes. Cell Host Microbe 12, 223–232. 10.1016/J.CHOM.2012.06.006. [DOI] [PMC free article] [PubMed] [Google Scholar]
- 112.Freyne B, Marchant A, and Curtis N (2015). BCG-associated heterologous immunity, a historical perspective: intervention studies in animal models of infectious diseases. Trans. R. Soc. Trop. Med. Hyg 109, 52–61. 10.1093/TRSTMH/TRU197. [DOI] [PubMed] [Google Scholar]
- 113.Moorlag SJCFM, Arts RJW, van Crevel R, and Netea MG (2019). Non-specific effects of BCG vaccine on viral infections. Clin. Microbiol. Infect 25, 1473–1478. 10.1016/J.CMI.2019.04.020. [DOI] [PubMed] [Google Scholar]
- 114.Escobar LE, Molina-Cruz A, and Barillas-Mury C (2020). BCG vaccine protection from severe coronavirus disease 2019 (COVID-19). Proc. Natl. Acad. Sci. USA 117, 17720–17726. 10.1073/pnas.2008410117. [DOI] [PMC free article] [PubMed] [Google Scholar]
- 115.Netea MG, van der Meer JW, and van Crevel R (2021). BCG vaccination in health care providers and the protection against COVID-19. J. Clin. Invest 131, e145545. 10.1172/JCI145545. [DOI] [PMC free article] [PubMed] [Google Scholar]
- 116.Rivas MN, Ebinger JE, Wu M, Sun N, Braun J, Sobhani K, van Eyk JE, Cheng S, and Arditi M (2021). BCG vaccination history associates with decreased SARS-CoV-2 seroprevalence across a diverse cohort of health care workers. J. Clin. Invest 131, e145157. 10.1172/JCI145157. [DOI] [PMC free article] [PubMed] [Google Scholar]
- 117.Kong L, Moorlag SJCFM, Lefkovith A, Li B, Matzaraki V, van Emst L, Kang HA, Latorre I, Jaeger M, Joosten LAB, et al. (2021). Single-cell transcriptomic profiles reveal changes associated with BCG-induced trained immunity and protective effects in circulating monocytes. Cell Rep. 37, 110028. 10.1016/J.CELREP.2021.110028. [DOI] [PMC free article] [PubMed] [Google Scholar]
- 118.Pacis A, Tailleux L, Morin AM, Lambourne J, MacIsaac JL, Yotova V, Dumaine A, Danckært A, Luca F, Grenier JC, et al. (2015). Bacterial infection remodels the DNA methylation landscape of human dendritic cells. Genome Res. 25, 1801–1811. 10.1101/GR.192005.115. [DOI] [PMC free article] [PubMed] [Google Scholar]
- 119.Morante-Palacios O, Godoy-Tena G, Calafell-Segura J, Ciudad L, Martínez-Cáceres EM, Sardina JL, and Ballestar E (2022). Vitamin C enhances NF-κB-driven epigenomic reprogramming and boosts the immunogenic properties of dendritic cells. Nucleic Acids Res. 50, 10981–10994. 10.1093/NAR/GKAC941. [DOI] [PMC free article] [PubMed] [Google Scholar]
- 120.Morante-Palacios O, Ciudad L, Micheroli R, De La Calle-Fabregat C, Li T, Barbisan G, Houtman M, Edalat SG, Frank-Bertoncelj M, Ospelt C, and Ballestar E (2022). Coordinated glucocorticoid receptor and MAFB action induces tolerogenesis and epigenome remodeling in dendritic cells. Nucleic Acids Res. 50, 108–126. 10.1093/NAR/GKAB1182. [DOI] [PMC free article] [PubMed] [Google Scholar]
- 121.Yu G, Wang LG, and He QY (2015). ChIP seeker: An R/Bio-conductor package for ChIP peak annotation, comparison and visualization. Bioinformatics 31, 2382–2383. 10.1093/bioinformatics/btv145. [DOI] [PubMed] [Google Scholar]
- 122.Heinz S, Benner C, Spann N, Bertolino E, Lin YC, Laslo P, Cheng JX, Murre C, Singh H, and Glass CK (2010). Simple Combinations of Lineage-Determining Transcription Factors Prime cis-Regulatory Elements Required for Macrophage and B Cell Identities. Mol. Cell 38, 576–589. 10.1016/J.MOLCEL.2010.05.004. [DOI] [PMC free article] [PubMed] [Google Scholar]
- 123.Peterson H, Kolberg L, Raudvere U, Kuzmin I, and Vilo J (2020). gprofiler2 – an R package for gene list functional enrichment analysis and namespace conversion toolset g:Profilerx. F1000Res 9. 10.12688/F1000RESEARCH.24956.2. [DOI] [PMC free article] [PubMed] [Google Scholar]
- 124.Ginestet C (2011). ggplot2: Elegant Graphics for Data Analysis. J R Stat Soc Ser A Stat Soc 174, 245–246. 10.1111/j.1467-985X.2010.00676_9.x. [DOI] [Google Scholar]
- 125.Quinlan AR, and Hall IM (2010). BEDTools: a flexible suite of utilities for comparing genomic features. Bioinformatics 26, 841–842. 10.1093/bioinformatics/btq033. [DOI] [PMC free article] [PubMed] [Google Scholar]
- 126.Ramírez F, Ryan DP, Grüning B, Bhardwaj V, Kilpert F, Richter AS, Heyne S, Dündar F, and Manke T (2016). deepTools2: a next generation web server for deep-sequencing data analysis. Nucleic Acids Res. 44, W160–W165. 10.1093/NAR/GKW257. [DOI] [PMC free article] [PubMed] [Google Scholar]
- 127.Stuart T, Butler A, Hoffman P, Hafemeister C, Papalexi E, Mauck WM, Hao Y, Stoeckius M, Smibert P, and Satija R (2019). Comprehensive Integration of Single-Cell Data. Cell 177, 1888–1902.e21. 10.1016/J.CELL.2019.05.031. [DOI] [PMC free article] [PubMed] [Google Scholar]
- 128.Meers MP, Tenenbaum D, and Henikoff S (2019). Peak calling by Sparse Enrichment Analysis for CUT&RUN chromatin profiling. Epigenet. Chromatin 12, 1–11. 10.1186/S13072-019-0287-4/FIGURES/6. [DOI] [PMC free article] [PubMed] [Google Scholar]
- 129.Geng S, Chen K, Yuan R, Peng L, Maitra U, Diao N, Chen C, Zhang Y, Hu Y, Qi CF, et al. (2016). The persistence of low-grade inflammatory monocytes contributes to aggravated atherosclerosis. Nat. Commun 7, 13436–13515. 10.1038/ncomms13436. [DOI] [PMC free article] [PubMed] [Google Scholar]
- 130.Starr ME, Steele AM, Saito M, Hacker BJ, Evers BM, Saito H, and Raju R (2014). A New Cecal Slurry Preparation Protocol with Improved Long-Term Reproducibility for Animal Models of Sepsis. PLoS One 9, e115705. 10.1371/JOURNAL.PONE.0115705. [DOI] [PMC free article] [PubMed] [Google Scholar]
- 131.Bernstein DL, Kameswaran V, Le Lay JE, Sheaffer KL, and Kaestner KH (2015). The BisPCR2 method for targeted bisulfite sequencing. Epigenet. Chromatin 8, 27. 10.1186/s13072-015-0020-x. [DOI] [PMC free article] [PubMed] [Google Scholar]
- 132.De Waal E, Mak W, Calhoun S, Stein P, Ord T, Krapp C, Coutifaris C, Schultz RM, and Bartolomei MS (2014). In Vitro Culture Increases the Frequency of Stochastic Epigenetic Errors at Imprinted Genes in Placental Tissues from Mouse Concepti Produced Through Assisted Reproductive Technologies. Biol. Reprod 90, 22–12. 10.1095/biolreprod.113.114785. [DOI] [PMC free article] [PubMed] [Google Scholar]
- 133.Ernst J, and Kellis M (2012). ChromHMM: automating chromatin-state discovery and characterization. Nat. Methods 9, 215–216. 10.1038/nmeth.1906. [DOI] [PMC free article] [PubMed] [Google Scholar]
- 134.Langmead B, and Salzberg SL (2012). Fast gapped-read alignment with Bowtie 2. Nat. Methods 9, 357–359. 10.1038/nmeth.1923. [DOI] [PMC free article] [PubMed] [Google Scholar]
- 135.Li H, Handsaker B, Wysoker A, Fennell T, Ruan J, Homer N, Marth G, Abecasis G, and Durbin R; 1000 Genome Project Data Processing Subgroup, 1000 Genome Project Data Processing (2009). The Sequence Alignment/Map format and SAMtools. Bioinformatics 25, 2078–2079. 10.1093/bioinformatics/btp352. [DOI] [PMC free article] [PubMed] [Google Scholar]
- 136.Cusanovich DA, Hill AJ, Aghamirzaie D, Daza RM, Pliner HA, Berletch JB, Filippova GN, Huang X, Christiansen L, DeWitt WS, et al. (2018). A Single-Cell Atlas of In Vivo Mammalian Chromatin Accessibility. Cell 174, 1309–1324.e18. 10.1016/j.cell.2018.06.052. [DOI] [PMC free article] [PubMed] [Google Scholar]
- 137.Kent WJ, Zweig AS, Barber G, Hinrichs AS, and Karolchik D (2010). Data and text mining BigWig and BigBed: enabling browsing of large distributed datasets. Bioinformatics 26, 2204–2207. 10.1093/bioinformatics/btq351. [DOI] [PMC free article] [PubMed] [Google Scholar]
- 138.R Core Team. R: A Language and Environment for Statistical Computing. Vienna, Austria: R Foundation for Statistical Computing. https://www.R-project.org/. [Google Scholar]
- 139.Geng S, Zhang Y, Yi Z, Lu R, and Li L (2021). Resolving monocytes generated through TRAM deletion attenuate atherosclerosis. JCI Insight 6, e149651. 10.1172/JCI.INSIGHT.149651. [DOI] [PMC free article] [PubMed] [Google Scholar]
Associated Data
This section collects any data citations, data availability statements, or supplementary materials included in this article.
Supplementary Materials
Data Availability Statement
Raw and processed DNA methylation array and CUT&RUN sequencing data produced during this study are available through the Gene Expression Omnibus under the accession number GEO: GSE253202. Source data for all figures in the paper are available at Mendeley Data: https://doi.org/10.17632/b62hnycy59.1.
This paper does not report original code.
Any additional information required to reanalyze the data reported in this paper is available from the lead contact upon request.