

SUMMARY
The ataxia telangiectasia mutated (ATM) protein kinase is a master regulator of the DNA damage response and also an important sensor of oxidative stress. Analysis of gene expression in ataxia-telangiectasia (A-T) patient brain tissue shows that large-scale transcriptional changes occur in patient cerebellum that correlate with the expression level and guanine-cytosine (GC) content of transcribed genes. In human neuron-like cells in culture, we map locations of poly(ADP-ribose) and RNA-DNA hybrid accumulation genome-wide with ATM inhibition and find that these marks also coincide with high transcription levels, active transcription histone marks, and high GC content. Antioxidant treatment reverses the accumulation of R-loops in transcribed regions, consistent with the central role of reactive oxygen species in promoting these lesions. Based on these results, we postulate that transcription-associated lesions accumulate in ATM-deficient cells and that the single-strand breaks and PARylation at these sites ultimately generate changes in transcription that compromise cerebellum function and lead to neurodegeneration over time in A-T patients.
In brief
Woolley et al. investigate relationships between gene expression and ATM status in this work, examining human ataxia-telangiectasia (A-T) patient postmortem brain tissue as well as ATM-deficient neuron-like cells in culture. Their findings suggest a direct relationship between genomic DNA lesions and loss of transcription regulation in A-T.
Graphical abstract

INTRODUCTION
Ataxia-telangiectasia (A-T) is a childhood-onset progressive neurodegenerative disorder caused by the loss of the ataxia telangiectasia mutated (ATM) protein kinase.1 ATM is well known as a cell-cycle checkpoint kinase that responds to DNA damage in the form of double-strand breaks through the Mre11-Rad50-Nbs1 (MRN) complex and phosphorylates hundreds of substrates involved in checkpoints, DNA repair, and DNA damage survival.2,3 In addition, we have previously shown that ATM can be activated independently of DNA breaks through direct oxidation of cysteine residues,4 and many groups have noted the chronic oxidative stress in mammalian cells caused by ATM loss.3,5 The molecular basis of ATM activation via oxidation has also been determined recently.6 Despite the molecular insights into ATM function over the last two decades, however, it is still not clear how the loss of this kinase results in the cerebellum-specific neurodegeneration that is considered to be the most debilitating clinical outcome of this autosomal recessive disorder.
During our characterization of mutant ATM alleles in human cells and experiments with purified proteins in vitro, we identified several forms of ATM that fail to be activated by oxidative stress but have normal MRN-mediated activation.4,7 One of these, the R3047X mutant, lacking the last 10 amino acids of ATM, is responsible for cerebellar neurodegeneration in several patients.8–10 For this reason we have focused our recent efforts on the reactive oxygen species (ROS)-dependent pathway of ATM activation, which we found in human tumor-derived cells to control many cellular responses, including ROS levels, mitochondrial functions, and ROS-induced checkpoints and autophagy, as well as protection from nuclear protein aggregate formation.11 We also observed DNA damage in cells lacking ATM ROS activation, specifically single-strand DNA (ssDNA) breaks, a form of DNA damage known to be associated with cerebellar ataxia in several familial disorders.12,13 The ssDNA breaks we observed with the loss of ATM activity or the loss of its ROS activation are transcription dependent and are eliminated with the overexpression of either RNaseH or the human Senataxin (SETX) enzyme, both of which act to remove RNA-DNA hybrids.14 The ssDNA breaks also induce hyper-poly-ADP-ribosylation (hyperPARylation) by poly(ADP-ribose) polymerase 1 (PARP1) and PARP2 in ATM-deficient cells that drives the protein aggregation that we observed.11
Based on these findings, we hypothesize that high ROS in human cells lacking ATM function causes transcriptional stress in the form of RNA-DNA hybrids that ultimately lead to ssDNA breaks and hyperPARylation. We further postulate that transcription patterns at specific genomic locations may be altered in A-T tissues because of the accumulated hybrids and DNA damage over time. To test these ideas directly, we quantified transcripts in A-T patient cerebellum tissues using RNA sequencing (RNA-seq) and found significant changes between the patient and control groups that were primarily evident in the cerebellum. Analysis of these changes indicates a strong relationship between DNA sequence context, expression levels, and dysregulation in A-T patients. In addition, we used human neuron-like cells differentiated in culture to assess the locations of DNA damage in the absence of ATM function by quantifying levels of PAR and RNA-DNA hybrids genome-wide. Through this analysis, we find patterns of DNA damage that increase with the loss of ATM activity and correlate with both guanine-cytosine (GC) content and transcription levels. Taken together, these results suggest a unified model for deficiencies in critical gene expression patterns that occur as a result of ATM loss in human A-T patients.
RESULTS
A-T cerebellum transcriptomics indicate significant changes in comparison with controls
Our previous results in human cells in culture and our analysis of A-T patient brain tissue by mass spectrometry11 suggested that transcription patterns may be altered in A-T patients. To quantify these changes, we performed total RNA extraction and RNA-seq on five A-T patient and four control patient brain tissues (Table S1). The tissue types examined included the cerebellum, which is most affected functionally in A-T patients, as well as two regions in the cortex that are not functionally affected (frontal cortex regions BA9 and BA10). Significant transcription differences were observed in the A-T patient cerebellum and BA9 compared to control cerebellum samples, whereas fewer changes were observed in A-T patient BA10 cortex samples (Figures 1A–1C). We identified both upregulated genes (>2-fold compared to controls, q < 0.01, 714 transcripts) and downregulated genes (<2-fold compared to controls, q < 0.01, 1,151 transcripts) in A-T patient cerebellum tissue (Figure 1D). A substantial subset of these differentially expressed genes were found to be more than 4-fold up- or downregulated (486 and 477, respectively). Gene set enrichment analysis revealed many pathways affected in cerebellum and cortex tissues, including calcium signaling, oxidative phosphorylation, and pathways related to other forms of neurodegeneration (Figure S1).
Figure 1. The A-T patient transcriptome shows dramatic differences from controls.
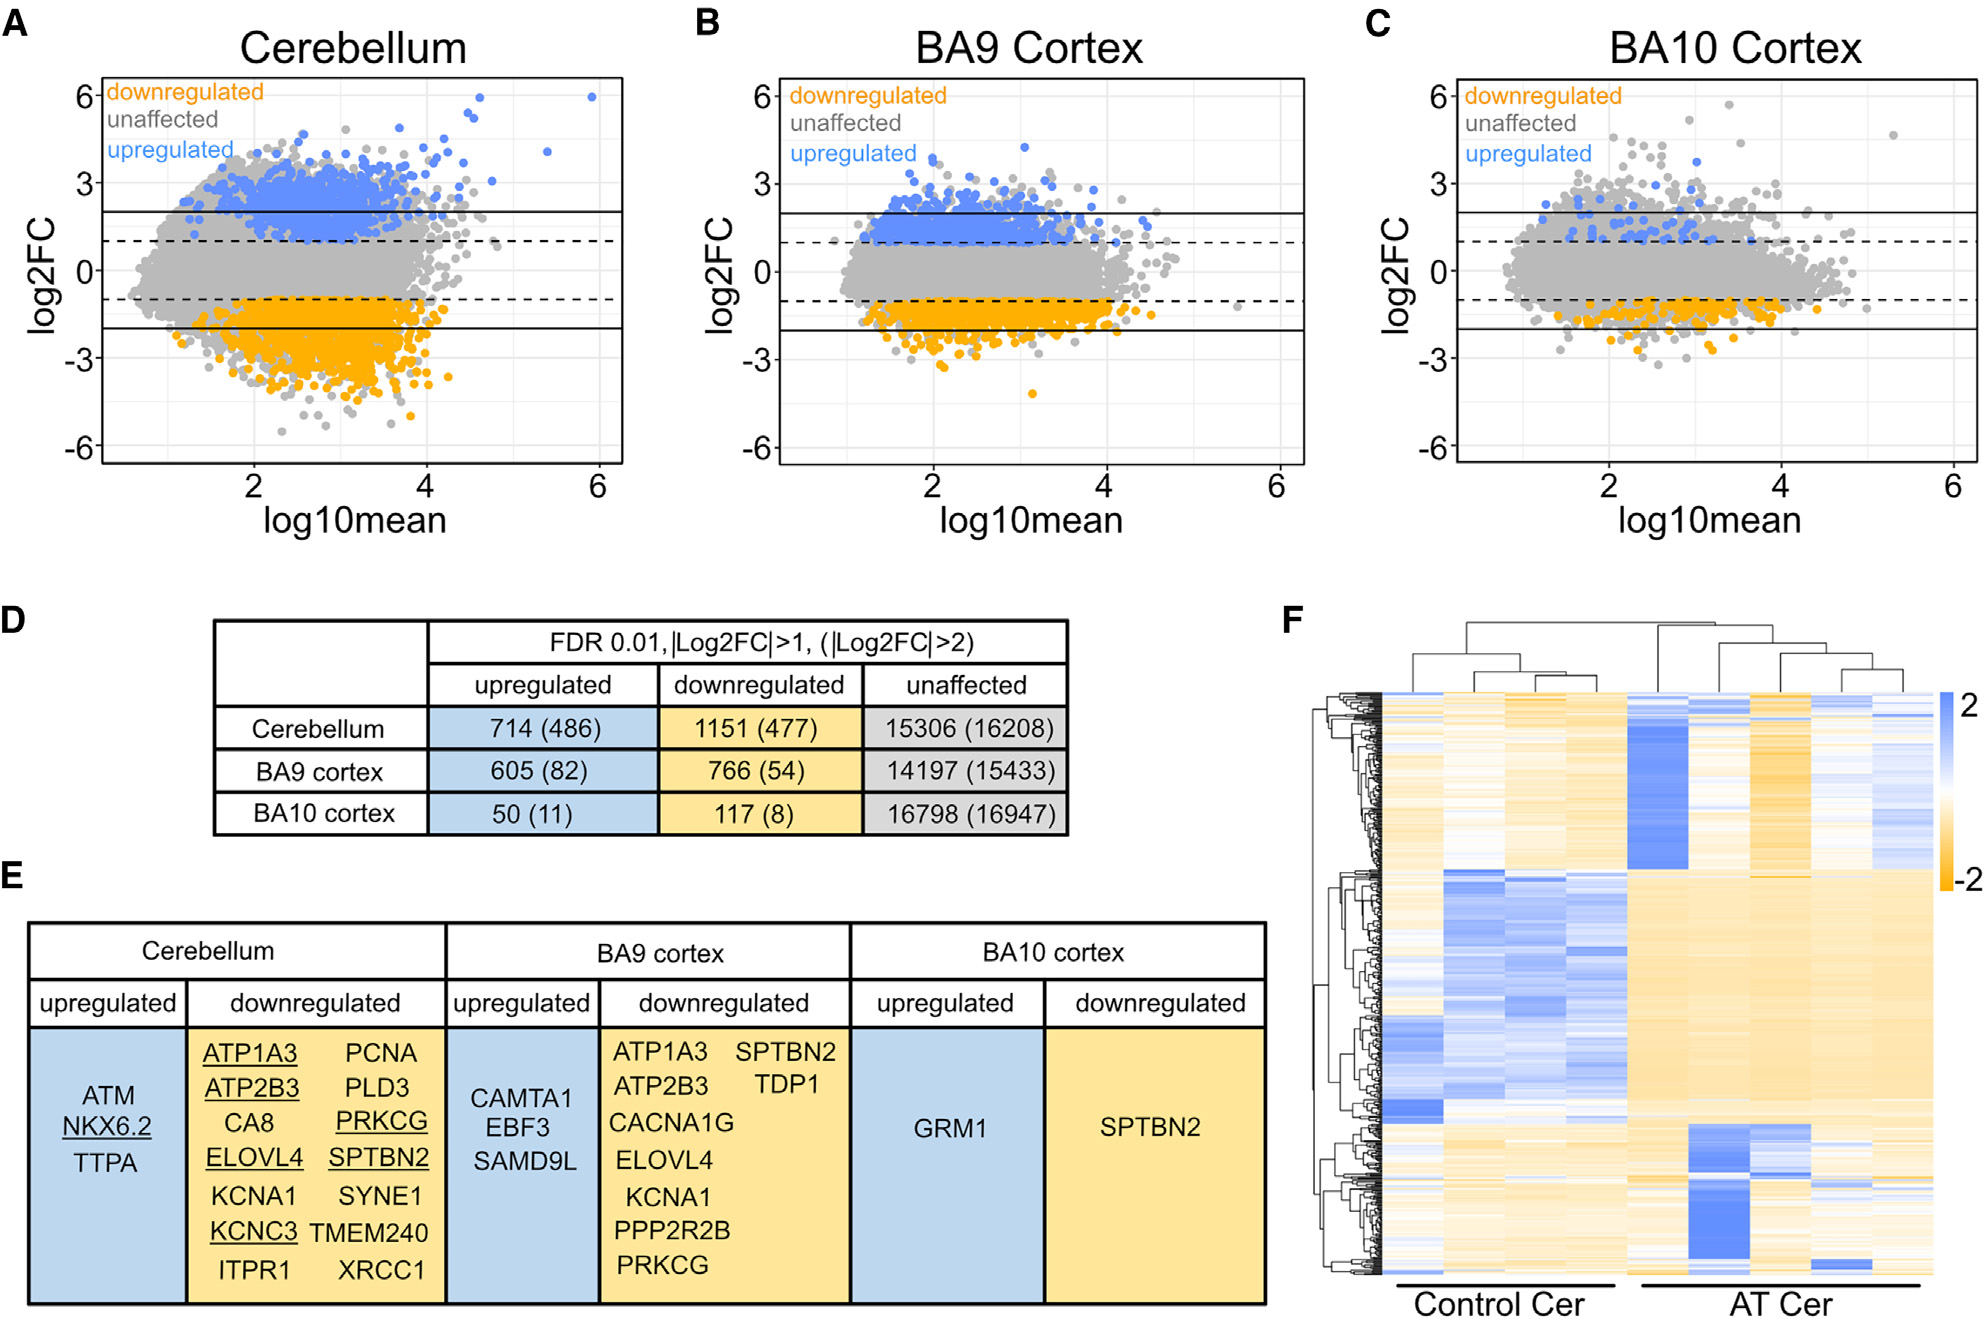
(A) MA plot comparing cerebellar A-T patient transcriptome (5 patients) to control transcriptome (4 patients). Dashed lines correspond to |Log2FC| > 1, solid lines correspond to |Log2FC| > 2. Orange corresponds to Log2FC < −1 with q < 0.01 (downregulated gene set) and blue corresponds to Log2FC > 1, with q < 0.01 (upregulated gene set). FC, fold change.
(B) MA plot comparing BA9 cortex A-T patient transcriptome to control patient transcriptome.
(C) MA plot comparing BA10 cortex A-T patient transcriptome to control patient transcriptome.
(D) Numbers of genes in upregulated (|Log2FC| > 1), downregulated (Log2FC < −1), and unaffected gene sets in each tissue type. Gene sets in parentheses indicate numbers of differentially transcribed genes with at least 4-fold change from wild type (|Log2FC| > 2). FDR, false discovery rate.
(E) Human cerebellar ataxia-linked genes that fall within upregulated and downregulated gene sets for each tissue type. Underlined genes are in the |Log2FC| > 2 subset.
(F) Heatmap for the 500 genes with the most extreme |Log2FC| values in the cerebellum. Columns are patients and rows are genes.
Notably, transcripts with significant downregulation in the cerebellum and BA10 cortex included several genes linked to other forms of ataxia (Figure 1E). These include ITPR1 and CA8, genes involved in in inositol phosphate regulation of calcium signaling that we previously found to be reduced at the protein level.11 In addition to these, 12 other genes we identified in the subset of transcripts strongly reduced in A-T patients are individually linked to cerebellar ataxia in other hereditary disorders.15–29
In addition to the large number of dysregulated genes common to all of the A-T patients tested, heatmap analysis also demonstrated significant heterogeneity between A-T patient cerebellum samples (Figure 1F). The level of transcriptional change specific to each patient was not obviously correlated with the age or sex of the patient.
Given the magnitude of transcriptional changes observed in the patients and the large number of genes affected, we sought to identify characteristics that distinguish affected from unaffected genes. We grouped transcripts according to their levels in A-T patients: downregulated, unaffected, or upregulated compared to controls. Comparisons of gene groups in relation to their gene expression level in controls showed an obvious separation between the downregulated and upregulated genes. Specifically, genes downregulated in A-T tended to be those that are highly expressed in control patients, whereas genes upregulated in A-T tended to be lowly expressed in control patients (levels of transcript change in A-T patients relative to controls shown in relation to the rank of the expression of each transcript in control individuals, Figure 2A). Comparisons between these subsets passed nonparametric cumulative distribution tests, including Kolmogorov-Smirnov and Anderson-Darling with 5,000 bootstraps. The highly expressed genes, largely downregulated in patients, include many transcripts specific to Purkinje cells, which are considered to be one of the most affected cell types in A-T.1 Another way to view these data is to show the downregulated or upregulated transcripts in expression quantiles in comparison to transcript levels in normal cells. This analysis shows that the genes downregulated in A-T are biased toward those that are highly expressed in the cerebellum (Figure 2B), whereas the genes upregulated in A-T are biased toward those that are expressed at a low level (Figure 2C). Similar trends are observed in the cortex tissue of A-T patients, with the downregulated gene set being among the highest expressed in that tissue, although there are fewer genes affected, and the trends are not as extreme as those observed in the cerebellum (Figures 2D–2F).
Figure 2. Differentially expressed genes in A-T patients align with patterns of transcript abundance and GC content.

(A) Transcript change vs. expression rank plots for cerebellum genes with q < 0.01. Expression rank is defined as the set of all genes with q < 0.01 sorted by mean control patient transcript abundance. The higher the expression rank, the higher expressed the gene is in controls. Cohort includes 5 A-T patients and 4 controls (see Table S1).
(B) Expression quantile histograms for cerebellum downregulated gene set. As in (A), but without a q value requirement, all of the genes were sorted by mean control patient transcript abundance before being divided into 100 equally sized, nonoverlapping bins. The rightmost bin contains the 1% highest expressed genes in control patients, and the leftmost bin contains the 1% lowest expressed genes in control patients. The number of downregulated genes in each bin are plotted on the histogram. Light orange: genes with Log2FC < 1 in A-T patients relative to controls; dark orange: genes with Log2FC < 2.
(C) Expression quantile histograms for cerebellum upregulated gene set. Light blue: genes with Log2FC > 1 in A-T patients relative to controls; dark blue: genes with Log2FC > 2.
(D) As in (A), but for the BA9 cortex.
(E) As in (B), but for the BA9 cortex.
(F) As in (C), but for the BA9 cortex.
(G) Density plots for gene GC content for cerebellar upregulated, downregulated, and unaffected gene sets from Figure 1A.
(H) Density plots for gene GC content for BA9 upregulated, downregulated, and unaffected gene sets from Figure 1B.
(I) Density plots for gene GC content for BA10 upregulated, downregulated, and unaffected gene sets from Figure 1C.
(J) Density plots for the maximum 100-nt GC content per gene for cerebellar upregulated, downregulated, and unaffected gene sets.
(K) Density plots for the maximum 100-nt GC content per gene for BA9 upregulated, downregulated, and unaffected gene sets.
(L) Density plots for the maximum 100-nt GC content per gene for BA10 upregulated, downregulated, and unaffected gene sets.
Although the affected genes in A-T patient tissues are not all specific to Purkinje cells, it is possible that one explanation for these trends could be the reduced density of Purkinje cells in patient tissue. To investigate this, we reanalyzed micrographs of A-T patient cerebellum that were collected in our previous study11 (Table S1). Six A-T patient tissue samples and 6 controls were analyzed for the density of Purkinje cells by examining previously collected images of the tissues and determining the number of cells per micron of Purkinje layer. These results showed that A-T patients exhibit a reduction of ~40% in the density of Purkinje neurons in the Purkinje layer (Figure S2). This difference is significant based on these 6 pairs of patients and controls, although the loss of mRNA transcripts observed in patients is much more extreme (changes leading to a loss of >75% shown in Figures 1 and 2). Notably, the expression level downregulation trend was also observed in the BA9 cortex tissue, which does not have any precedent of neurodegeneration in A-T patients and does not show cellular atrophy.30
Lastly, we analyzed the GC content of each class of genes (upregulated, downregulated, or unchanged in A-T patients) and found that the downregulated genes show a distinct pattern of high overall GC content per gene (Figures 2G–2I) and higher than average GC content when considering the 100 nt of maximum GC content per gene (Figures 2J–2L). In contrast, the unaffected and upregulated genes show lower GC content overall and lower than average GC content when considering the 100 nt of maximum GC content per gene. These patterns are most obvious in the cerebellum tissue but also apparent in the neocortex samples. Comparisons of downregulated with nondownregulated gene sets passed nonparametric cumulative distribution tests, including Kolmogorov-Smirnov and AndersonDarling with 5,000 bootstraps. In contrast, no differences were observed between differentially expressed genes with respect to GC skew (defined as (G − C)/(G + C)), regardless of whether the entire gene or only the promoter region was included in this analysis (Figure S3). Overall, the analysis suggests that the patterns of gene expression in A-T patient tissue are nonrandom and strongly correlated with both the level of gene expression in normal individuals and the DNA sequence context.
To confirm and validate these findings using an orthogonal method, we used spatial transcriptomics to analyze a cerebellum tissue slice from an A-T patient in comparison to a control individual. These results show striking differences between the patient and control tissue, particularly in the molecular layer (Figure S4). Although Purkinje cells cannot be uniquely analyzed from this method due to low resolution, we observed the downregulation of many genes known to be specific to this cell type, including ITPR1 and CA8.
Quantification of PAR genome-wide in ATM-inhibited neuron-like cells
From our previous study of the effects of ATM on tumor-derived cells in culture, we know that the loss of ATM activity leads to high levels of ROS and that RNA-DNA hybrids accumulate as a result of high ROS.11 In addition, we observed single-strand breaks and hyperactivation of PARP1 and PARP2 in these cells with loss of ATM or its oxidative activation pathway. Based on these findings, we hypothesize that RNA-DNA hybrids and PARP activation occur at sites of transcriptional stress in ATM-deficient cells and that these events likely lead to transcriptional changes over time, as we observed in A-T patients (working model in Figure 3A).
Figure 3. ATM inhibition in postmitotic neuronal-like cells generates ROS-dependent single-strand breaks.
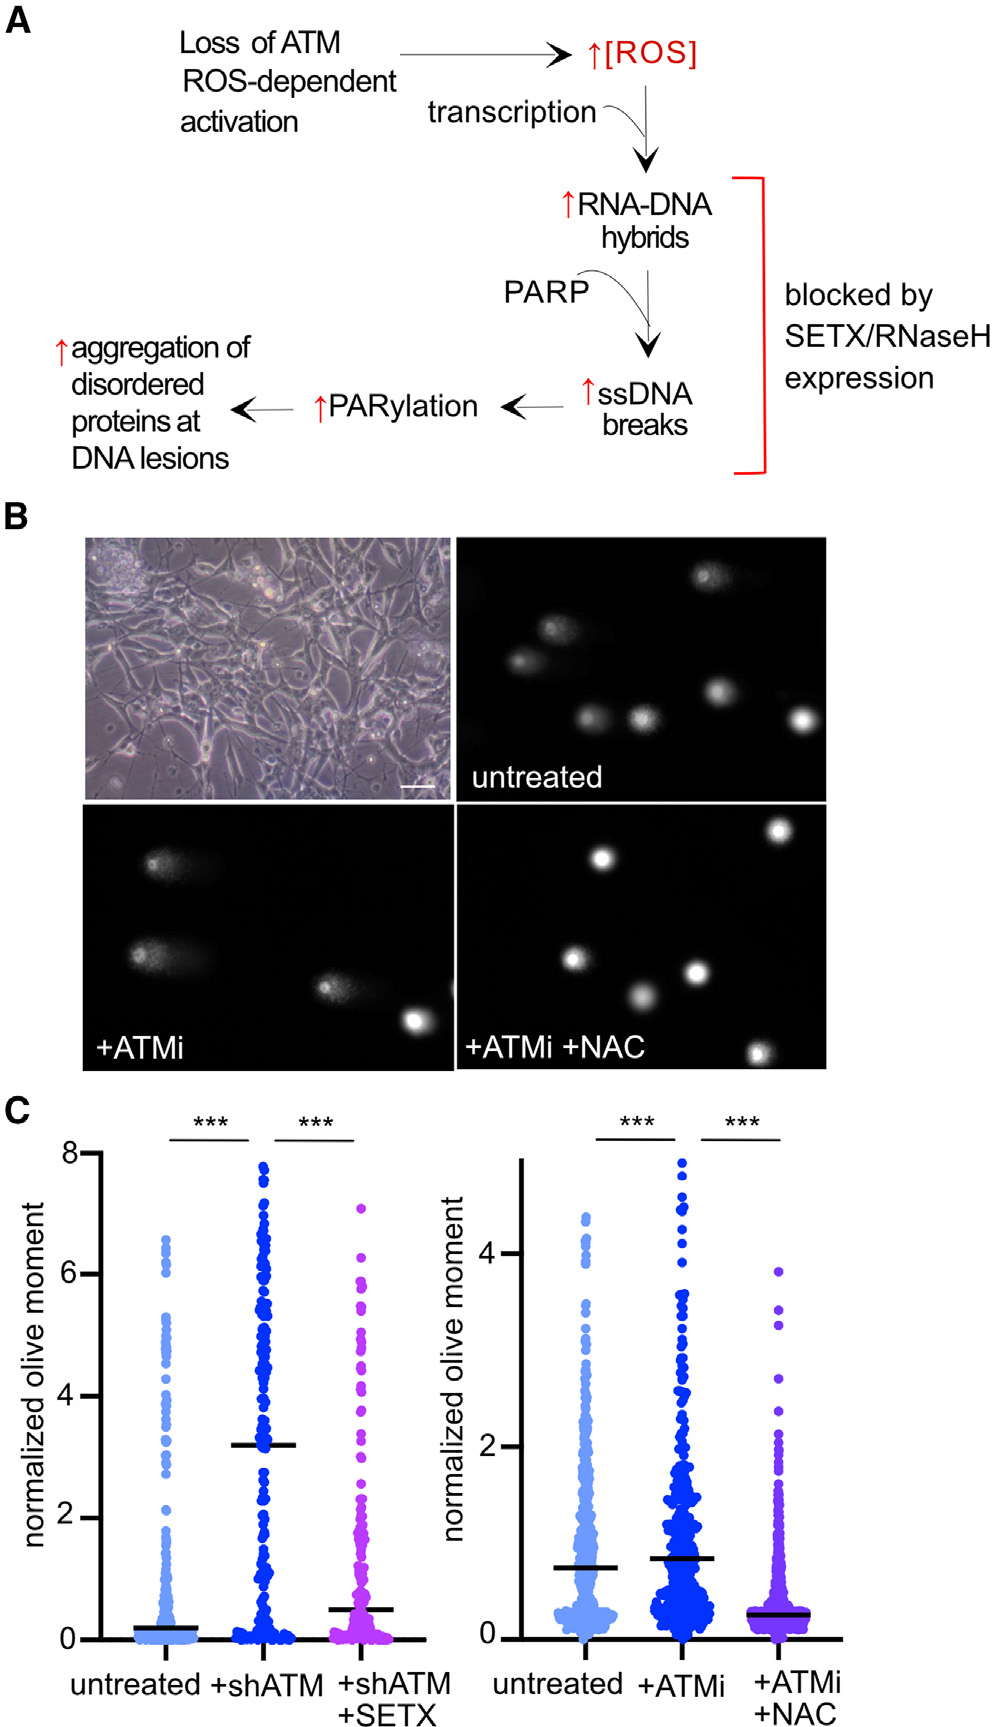
(A) Working model for transcription-associated lesions in ATM-deficient cells based on previous observations.7,11 Loss of ATM produces high ROS in human cells, which generates R-loops, ssDNA breaks, hyperPARylation, and protein aggregates.
(B) Bright-field image of differentiated cells (top left) and examples of alkaline comet assay results from postmitotic human neuron-like cells differentiated from SH-SY5Y neuroblastoma cells comparing untreated, ATMi-treated, and ATMi + NAC conditions. Scale bar: 20 μm.
(C) Quantitation of the olive moment in alkaline comet assays measuring >380 cells from each treatment group. Differentiated SH-SY5Y cells were depleted of ATM by short hairpin RNA and complemented with expression of the C-terminal helicase domain of SETX as indicated (left). Differentiated SH-SY5Y cells were treated with ATMi or ATMi with NAC as indicated (right).
***p < 0.0005 by two-sample t test assuming unequal variances.
To test this hypothesis we used human SH-SY5Y neuroblastoma cells that were differentiated into postmitotic neuronal-like cells, as previously described, over the course of 7 days using retinoic acid and brain-derived neurotrophic factor (BDNF).11,31 Under these conditions, the inhibition of ATM in differentiated SH-SY5Y cells generates significantly higher levels of ROS (Figure S5) as well as ssDNA breaks as measured by alkaline comet assay (Figures 3B and 3C). No increase in double-strand breaks was observed under these conditions (Figure S6). As we demonstrated previously in human osteosarcoma cells, the expression of the RNA-DNA helicase SETX in these cells reduced the levels of single-strand breaks significantly (Figure 3C). Breaks were also eliminated by the treatment of differentiated neuron-like cells with N-acetyl cysteine (NAC), an antioxidant (Figure 3C), or with ascorbic acid, another antioxidant (Figure S7).
PARylation occurs at sites of DNA damage, and we know that hyperPARylation is observed in the absence of ATM catalytic activity.11,32 To quantify locations of PAR genome-wide, we used ADP-ribose chromatin immunoprecipitation sequencing (ChIP--seq),33 a method of ChIP that uses a macrodomain that is specific for monomeric and polymeric forms of ADP-ribose34 in the place of an antibody. Cells were differentiated for 7 days and then crosslinked with formaldehyde and processed for ADP-ribose ChIP-seq. From this analysis, we identified 2,938 PAR peaks in the postmitotic cells in the absence of any treatment, consistent with our observations of damage in untreated SH-SY5Y neuron-like cells11 (Figures 3B and 3C). Examples of genome browser views of ADP-ribose ChIP-seq signal at several genomic locations are shown in Figure 4A. We also analyzed cells in which ATM activity was blocked with the ATM inhibitor AZD139035 for the final 2 days of differentiation. Consistent with these observations, here, we observed more PAR peaks (5,028) in ATM-inhibited cells compared to cells with normal ATM function.
Figure 4. PAR ChIP shows increased signal with loss of ATM activity.

(A) Examples of genome browser views of PAR ChIP in untreated SH-SY5Y differentiated neuron-like cells (“no ATMi”), cells with 2-day treatment with 1 μM AZD1390 (“+ATMi”), and ATAC-seq and H3K27ac data from previously published datasets.36,37
(B) Recovery of PAR ChIP products in the presence or absence of ATMi; signal shown is ChIP signal from 2 replicates with input contribution removed and reads normalized by read depth for each sample.
(C) Normalized PAR ChIP signal at all promoters (1,000 nt upstream of TSS to 500 nt downstream) and promoters of genes that are transcribed, based on RNA-seq data from SH-SY5Y cells.
(D) Pattern of accumulated PAR ChIP signal in the presence of ATMi compared to the pattern of H3K27ac signal at TSSs genome-wide.
(E) Normalized PAR ChIP signal at H3K27ac peak locations (57,068).
(F) Normalized PAR ChIP signal at H3K27me3 peak locations (176,439).
(G) Pattern of accumulated PAR ChIP signal in the presence of ATMi compared to the pattern of ATAC-seq signal at ATAC-seq peak locations (“center”) genome-wide, including 3 kb upstream and downstream.
(H) Normalized PAR ChIP signal is shown at subsets of chromosome 1 locations with the indicated levels of GC content. We used 100-nt sequence blocks (14,000 per bin for all bins except for 10–20 [13,181], 70–80 [13,677], and 80–90 [2,523]) for each analysis. The locations of these blocks are shown (“center”), as well as 3-kb windows upstream and downstream.
***p < 0.0005 by two-sample t test assuming unequal variances comparing untreated to ATMi. NS, nonsignificant.
Our previous work also suggested that transcription stress is an important upstream factor in inducing ssDNA breaks and PAR. Our analysis here shows that 22% of all PAR peaks identified in untreated cells overlap a transcription start site (TSS) and that this overlap increases to 35% in cells with ATM inhibition. Profiles of PAR signal at all TSSs show a clear peak at the TSS that increases with ATM inhibition (Figure 4B). Consistent with this observation, we see higher normalized PAR ChIP signal at promoter-proximal regions (defined here as the region 1,000 nt upstream of the TSS through 500 nt downstream) with ATM inhibitor (ATMi) exposure (Figure 4C). We used RNA-seq data from differentiated SH-SY5Y cells to determine which genes are transcribed under these conditions and used this to identify the subset of expressed genes. When PAR ChIP signal is evaluated for these promoter regions specifically (“transcribed promoters”), higher levels of signal are observed, especially with ATM inhibition (Figure 4C).
The strong association with TSSs suggests that PAR ChIP signal is likely correlated with chromatin marks found at active transcription locations. To analyze this, we used previously published datasets for H3K27ac, H3K27me3, and assay for transposase-accessible chromatin (ATAC)-seq in SH-SY5Y cells.36–38 The transcription-associated peaks in PAR signal align exactly in the center of the peak-valley-peak signal pattern of H3K27ac at promoters and enhancers (Figure 4D), predicted to be the nucleosome-free region at these active promoter and enhancer sites.39 The accumulated PAR signal in ATM-inhibited cells at these H3K27ac sites is significantly higher than in untreated cells (Figure 4E), similar to the relationship at promoters. In contrast, no increase in PAR ChIP signal is observed at sites with H3K27me3, a repressive transcription mark (Figure 4F).
Active transcription marks are often coincident with measurements of “open” chromatin, as measured by ATAC-seq.40 Previously published ATAC-seq data from SH-SY5Y cells36 also shows a correlation with the locations of PAR ChIP marks, and levels of PAR with ATMi exposure are significantly higher at ATAC-seq peak locations compared to untreated neuron-like cells (Figure 4G). Nevertheless, there are also PAR ChIP signals in both untreated and ATMi-treated cells that appear to be independent of either ATAC-seq accessibility or H3K27ac marks (examples in Figure 4A).
Lastly, we analyzed the levels of PAR ChIP signal at genomic sites varying in GC content (100-nt bins sampled across chromosome 1). This analysis shows that, overall, PAR is strongly biased toward high GC (>70%) regions of the genome and that levels of PAR are significantly higher in these regions in ATMi-treated cells (Figure 4H). In contrast, we did not observe a positive correlation between PAR ChIP signal and GC skew (Figure S8).
R-loops are coincident with PAR in differentiated SH-SY5Y neuron-like cells
We previously found that R-loops are higher in human cells depleted for ATM or treated with ATM catalytic inhibitors compared to untreated human cells.11 In addition, the ssDNA breaks that appear with ATM loss as well as hyperPARylation can be reduced to normal levels with the overexpression of SETX, an RNA-DNA helicase, suggesting that R-loops play a causal role in generating DNA damage in the absence of ATM function. If this is also the case in human neurons, then we expect that locations of R-loops should be strongly correlated with locations of PAR. To test this idea, we expressed a tagged catalytic mutant of human RNaseH in the neuron-like cells and used this to identify RNA-DNA hybrids, a method previously used in other cell types called R-ChIP.41
We observed R-loop peaks in both untreated and ATMi-treated cells, and the levels of R-loops measured by R-ChIP in the differentiated neuron-like cells increased in the absence of ATM function, similar to our observations with PAR ChIP signal (see examples of genome browser views in Figure 5A). This increase was eliminated in neuron-like cells simultaneously treated with the antioxidant NAC, consistent with the idea that high levels of oxidative stress that form in the absence of ATM catalytic function are key to triggering these events. Importantly, the locations of R-loop signal often overlapped with that of PAR ChIP signal in both untreated and ATMi-treated neuron-like cells. Nearly twice as many R-ChIP peaks were called in ATMi-treated cells (8,018 peaks) compared to R-ChIP with ATMi and NAC exposure (4,614 peaks).
Figure 5. R-loops increase with inhibition of ATM and are relieved by antioxidant treatment.

(A) Examples of genome browser views of R-ChIP in untreated SH-SY5Y differentiated neuron-like cells (“R-ChIP no ATMi”), cells with 2-day treatment with 1 μM AZD1390 (“R-ChIP +ATMi”), and cells with NAC treatment only (“R-ChIP +NAC”), and cells with both ATMi and NAC (“R-ChIP +ATMi +NAC”) as indicated in comparison to PAR ChIP signal in the presence of ATMi as in Figure 4. Signal shown is ChIP signal from 2 replicates with input contribution removed and reads normalized by read depth for each sample.
(B) Pattern of accumulated R-ChIP signal at TSSs genome-wide as indicated.
(C) Normalized R-ChIP signal at transcribed promoters.
(D–F) Normalized R-ChIP signal at H3K27ac (D), H3K4me1 (E), and H3K4me3 (F) ChIP locations, respectively.38
(G) Pattern of accumulated R-ChIP signal at PAR ChIP sites in ATMi-treated cells genome-wide as indicated.
(H) Normalized R-ChIP signal at PAR ChIP sites in ATMi-treated cells.
(I) Normalized R-ChIP signal at ATAC-seq locations.36
(J) Pattern of accumulated R-ChIP signal at ATAC-seq sites as indicated.
***p < 0.0005 by two-sample t test assuming unequal variances.
As with locations of PAR, many R-ChIP peaks were also aligned with TSSs (61% of R-ChIP peaks measured with ATMi exposure overlap with at least 1 TSS). Quantification of R-loop peaks in all treatment conditions shows a 1.6-fold increase in total R-ChIP signal within 3 kb of TSSs in ATMi-treated cells that is not observed in the presence of NAC (Figure 5B). This increase is clearly observed at transcribed promoters (Figure 5C). Similar patterns are also observed at H3K27ac, H3K4me1, and H3K4me3 locations that coincide with active promoters and enhancers (Figures 5D–5F). Previous observations suggested that ssDNA breaks are primarily located at enhancers in human neurons,33 but our analysis shows that a relatively small proportion (<2%) of R-ChIP peaks in neuron-like cells inhibited for ATM activity overlap with an enhancer, either ubiquitous or neuron specific.42
Lastly, we examined the relationship between PAR ChIP locations and R-ChIP peaks and observed that a subset of R-ChIP peaks are localized coincident with PAR ChIP locations (Figures 5A and 5G). R-ChIP signal was ~2-fold higher in intensity at ATMi PAR ChIP locations in ATMi-treated cells compared with control cells or cells with both ATMi and NAC exposure (Figures 5G and 5H). As with PAR, the R-ChIP signal also closely aligned with ATAC-seq peaks (Figures 5I and 5J).
PAR and R-loop patterns are aligned with transcription activity and GC content
The differences in PAR and R-ChIP patterns that we observed suggested that transcription patterns may be altered in the cells with ATM inhibition. To examine this, we analyzed mRNA transcripts in SH-SY5Y differentiated cells in untreated, ATMi exposure, NAC, or ATMi plus NAC conditions using RNA-seq. The results show minimal changes with ATM inhibition although NAC exposure induces significant alterations in transcription, both upregulated and downregulated genes (Figure S9).
Despite the lack of change in RNA transcripts with ATMi exposure in SH-SY5Y cells, we considered the possibility that the levels of PAR and R-loops observed at specific loci could be directly related to the level of transcription activity at these locations since our transcriptome analysis in A-T brain tissue showed a strong relationship between expression level in controls and the extent of change in A-T patients (Figure 2). To examine this question, we analyzed the mean PAR and R-ChIP signals in 100-nt sliding windows across the genome, where each nucleotide position is represented by the mean ChIP signal between that position and 100 nt upstream (Figure S10). Using these data, we determined the mean ChIP signal within the “promoter-proximal” region of every expressed gene (defined here as 1,000 nt upstream to 500 nt downstream of a gene start for genes with corresponding RNA-seq data) and compared these values to the corresponding transcript level for each gene (Figures 6A–6C). This comparison shows a positive correlation between PAR and transcript abundance, particularly at high transcript levels (Figure 6A). A positive correlation between R-ChIP and transcript abundance is also observed that levels off above the lowest quartile of expression values (Figure 6B). Inhibition of ATM increased the overall PAR and R-ChIP signal but did not otherwise change the pattern. Consistent with the analysis of R-loop levels described above, NAC treatment reversed the relative R-ChIP signal patterns such that R-loops observed with ATMi and NAC treatment were lower than with NAC alone but showed an overall similar pattern relative to transcript abundance (Figure 6C).
Figure 6. PAR and R-ChIP signals correlate with transcript abundance and GC content.

(A) Mean TSS PAR ChIP plotted against ln(transcript abundance). TSS is defined in this figure as the window 1,000 nt upstream to 500 nt downstream of a gene start. Sample space comprises locations where PAR is present within a TSS, with corresponding transcript abundance information from RNA-seq (“active TSS”). Sample space was sorted by transcript abundance value and divided into nonoverlapping bins of 1 million observations. The mean PAR and mean ln(abundance) value for each bin is plotted. Process was performed for no ATMi and +ATMi PAR samples.
(B) As in (A), but for no ATMi and +ATMi R-ChIP.
(C) As in (B), but for NAC-treated R-ChIP.
(D) Mean TSS PAR ChIP plotted against 100-nt rolling mean GC content. Sample space comprises locations where PAR is present within a TSS with corresponding transcript abundance information (“active TSS”). Sample was sorted by GC content and divided into nonoverlapping bins of 250,000 observations. The mean PAR and mean GC content for each bin is plotted. The process was performed for no ATMi and +ATMi PAR samples.
(E) As in (D), but for no ATMi and +ATMi R-ChIP.
(F) As in (E), but for NAC-treated R-ChIP.
(G) Mean PAR ChIP plotted against mean GC content and mean R-ChIP (no ATMi samples only). Sample space comprises locations where PAR and R-ChIP signal are both present. Sample space was first sorted by GC content into nonoverlapping bins of 500,000 observations. Each 500,000 observations bin was then sorted by R-ChIP value before being divided into nonoverlapping bins of 25,000 observations. Each 25,000 observations bin was plotted based on mean PAR signal and mean GC content and colored by ln(R-ChIP).
(H) As in (G), but for +ATMi ChIP.
(I) Mean ChIP signal per GC bins for various subsets of locations (no ATMi samples only). Subset of locations where PAR and R-ChIP coincide was sorted by GC content and divided into nonoverlapping bins of 250,000 observations. Subset of locations where PAR is present but R-ChIP is not and subset of locations where R-ChIP is present but PAR is not were each sorted by GC content and divided into nonoverlapping bins of 1 million observations.
(J) As in (I), but for ATMi-treated cells.
Genome-wide GC content was calculated using the same 100-nt sliding window scheme as the ChIP data (Figures S10 and S11). The mean PAR and R-ChIP in promoter-proximal regions were plotted against GC content. Here, we found that mean PAR signal is positively correlated with GC content, with a maximum at ~75% GC (Figure 6D). Mean R-ChIP is also positively correlated with GC content but has a less dramatic increase until 50%–60% GC, and the highest values are also at ~75% GC, similar to the PAR signal (Figure 6E). Analysis of PAR and R-ChIP data with respect to GC skew showed higher levels overall with ATM inhibition but much less dependence on the level of skew compared to GC content (Figure S8). As with the transcript abundance comparisons, ATMi treatment increased the overall signal of both PAR and R-ChIP but not the signal shape. With NAC exposure, we observe the same overall GC dependence, but the ATMi samples show dramatically lower levels of R-ChIP signal–below that of the untreated +NAC samples (Figure 6F).
When controlling for the GC influence on PAR, we observe that PAR signal in the control still correlates with R-ChIP signal (Figure 6G). If PAR and R-ChIP were coincidentally correlated because both correlate to GC content, then this plot would not show a clear pattern of R-ChIP signal increasing as PAR increases for a given GC level. This is also observed in the ATMi sample but to a greater extent, with PAR bins separated by R-ChIP value extending higher when first binned by GC content (Figure 6H). To further characterize the relationship between PAR signal and R-ChIP, we compared the sets of all of the locations where PAR and R-ChIP coexist and exist separately. For both PAR and R-ChIP, the signal was higher when the other was present and lower when separate (Figures 6I and 6J). These results show strong associations between PARylation and R-loop patterns that are not solely dependent on GC content.
DISCUSSION
In this work, we identified and quantified R-loops and PAR-associated DNA damage sites in human postmitotic neuronal-like cells with loss of ATM catalytic activity. The impetus for this was our previous study linking loss of ATM function to high ROS, transcriptional stress, and hyperPARylation.11 Here, by mapping sites of PAR genome-wide, we have identified sequence patterns and correlations with histone marks that show that the PARylation events are strongly associated with gene promoters and high GC gene elements. These associations correlate well with patterns of transcriptional changes in A-T patients, as determined in this study by analysis of transcripts in cerebellum and cortex brain tissues.
PARylation at transcription sites
We show in this and previous work7,11 that ssDNA breaks occur at a significantly higher level in ATM-inhibited neuron-like cells compared to untreated cells. This increase correlates well with the increases in PAR ChIP signal that we have measured here. PARP1 and PARP2 are very rapidly activated at sites of DNA lesions to modify hundreds of proteins as well as undergoing automodification.43–45 The PAR ChIP method was described by Nussenzweig and colleagues, who showed that sites of PARylation in human induced neurons coincide with sites of DNA repair synthesis and that many of these are found at enhancer elements.33 In parallel work, Gage et al. also identified neuron-specific sites of repair-related fill-in synthesis and reported that these are associated with promoters, 5′ UTRs, and gene bodies.46 Both studies found significant correlation between sites of DNA damage in neurons and regions of open chromatin mapped by ATAC-seq. Chromatin accessibility has also been found to be a key determinant of transcription disruption in a mouse model of cerebellar neurodegeneration with ATM and aprataxin loss.47
In our PAR ChIP data, we see that 20% of called peaks in untreated neuron-like cells are located at promoter elements and 56% are associated with an annotated gene. With ATM inhibition, the number and intensity of PAR ChIP peaks increases, consistent with the increase that we observe in DNA damage by alkaline comet assays. A total of 35% of PAR peaks called in ATMi-treated cells are located at promoter elements and 78% are overlapping with or within a gene. Although we are largely equating PAR signal with DNA damage here, it is also possible that a subset of PAR ChIP signal we observe, particularly the low-level basal signal, is associated with transcription independent of DNA damage since PARP1 is reported to be present at active genes and to regulate transcription in some cases.48,49 Low levels of serine-targeted mono-ADP-ribose (MAR) were shown on chromatin throughout the cell cycle when the glycohydrolase ARH3 is eliminated,50 which is perhaps an indication of housekeeping-associated, replication-independent MAR. This study by Ahel and colleagues50 also showed that excessive PAR production, as was observed in the absence of both ARH3 and PARG glycohydrolases, causes dysregulation of transcription.
R-loops coincident with PARylation sites
Similar to our observations of PAR signal, we found that R-loops increased genome-wide with the inhibition of ATM and that these sites were enriched in promoter regions as well as sites with active transcription marks. We used R-ChIP with catalytically inactive RNaseH here, which has the advantage that RNA-DNA hybrids are recognized within cells, before lysis and chromatin fragmentation.41 Native recognition of R-loops in this way has been shown to be best suited for the quantification of R-loops formed by paused RNA polymerase in promoter-proximal regions.51,52 The promoter-associated R-loops where we observe the largest changes with ATM inhibition are class I lesions, which have also been shown to be sites of R-loop accumulation in cells with dysfunctional splicing or BRD4.53,54 Importantly, the increase in R-loop signals that we observe with ATM inhibition is completely reversed with NAC antioxidant exposure, consistent with our previous observations using the S9.6 antibody and DNA-RNA immunoprecipitation-qPCR.11 These results show that the increase in promoter-associated R-loops caused by the loss of ATM activity is dependent on the ROS generated under these conditions. Another example of ROS-induced R-loops comes from Lan and colleagues, who use an inducible system to generate ROS at specific loci.55 This work showed that R-loops are created in a ROS-dependent manner when induced at transcriptionally active sites and that these ultimately lead to transcription-coupled repair. Currently, it is not known how ROS generates R-loops and whether stalling of RNA polymerase may contribute to this or whether recruitment of repair factors to oxidative DNA damage may play a role.
Unexpectedly, we found that cells with normal ATM function appear to have higher levels of R-loops with NAC exposure. This increase also correlates with a large number of differentially expressed genes that we observed in NAC-treated cells, similar to previous reports of NAC-treated cells in culture where this antioxidant is reported to be generally antiproliferative.56 Why NAC would increase levels of R-loops in normal cells is not clear, although it has been reported that the neutralization of ROS in otherwise untreated cells can reduce ROS to such low levels that it triggers reductive stress, an aberrant state involving increased mitochondrial oxidation and cytotoxicity.57 Under these conditions, oxidative stress can actually be induced by reductive stress through feedback mechanisms.58 Transcriptional upregulation in response to reductive stress could be the source of the increase in the R-loops we observe.
GC content
Our meta-analysis of PAR and R-ChIP signal, GC content, and transcription levels indicates that both PAR and R-loops are strongly correlated with gene expression levels as well as with DNA sequence. GC content and GC skew have been known to be associated with R-loop propensity for many years, and several classes of promoter region have been defined in mammalian cells based on the levels of R-loops and sequence context.51,59 Here, we find that sites with high GC content overall have PAR and R-loops, particularly with ATM inhibition, and that the sites that exhibit the highest signals show both marks. Interestingly, there appears to be a threshold of GC content that promotes a transition to high PAR/R-loop propensity. Genomic sites with GC content above this level, ~60%, delineates groups of loci that are associated with both marks.
Gene expression levels
In SH-SY5Y-derived neuron-like cells with ATM inhibition, there are relatively few changes in gene expression compared to untreated cells, despite the accumulation of PAR and R-loops that we demonstrate here. In contrast, we found dramatic changes in transcripts in brain tissue from A-T patients compared to controls. The pattern of downregulated genes in the cerebellum closely matches the GC content trends seen in the neuron-like cells in culture, however, and the most affected genes had the highest level of expression in control individuals, similar to the expression patterns we observed with PAR and R-ChIP signals in cells. We hypothesize that the loss of transcripts from highly expressed genes in A-T cerebellum likely requires a significant duration of ATM loss, especially considering the progressive nature of cerebellar atrophy in A-T and the ages of the patients analyzed here (up to 31 years).
A-T patients show a loss of cerebellum volume over time that is visible in computed tomography and MRI images.30 These changes are often not apparent early in the course of the disease, when functional changes are starting; however, MRI studies do show a progressive cerebellar atrophy in patients over time.1 The loss of Purkinje cells from the cerebellum is known to be characteristic of A-T patients, and the importance of this cell type for the function of the cerebellum suggests that the disappearance of Purkinje cells likely is related to loss of cerebellar function. Here, we considered the possibility that the loss of Purkinje cells may be responsible for the apparent loss of highly expressed transcripts simply because the cells are absent in the patients. We determined the density of Purkinje neurons along the Purkinje cell layer of A-T patients and control individuals and found that, as a group, there is a reduction in Purkinje cell density in patients of ~40%. Given the magnitude of this change, it is possible that transcripts reduced by 30%–50% may result from the partial loss of this cell type. A subset of the downregulated transcripts fall into this category, including ITPR1 and CA8, genes with expression loss at the protein level that we observed by mass spectrometry previously.11 Several hundred gene transcripts are reduced more than 4-fold in A-T cerebellum, however, so these are not likely to be lower simply due to loss of this cell type. Another piece of evidence in this regard is the fact that over 800 transcripts are downregulated in the frontal cortex tissue, which does not lose significant tissue mass or cell types in A-T.30,60 The characteristics of downregulated genes in the cortex match the GC content and expression patterns of genes affected in the cerebellum, which argues that the patterns are due to transcriptional changes resulting from the loss of ATM rather than the loss of a specific cell type in the tissue. It is not known why ATM loss affects the cerebellum more than other parts of the brain, although it is clear that there is a cerebellum specificity to many DNA repair-related syndromes that involve ssDNA breaks.12 In addition, the cerebellum shows some of the highest levels of ROS production compared to other brain regions.61
In addition to Purkinje cell-specific transcripts, we observed a large number of other changes in gene expression that were significant even when considering the magnitude of Purkinje cell loss in the tissue. Although A-T patients are known to lose Purkinje neurons, it is likely that abnormalities in other cells in the cerebellum are also critical. It is worth noting that the concomitant loss of ATM and POLB in the mouse leads to cerebellar ataxia but not to the loss of Purkinje cells62; thus, it is possible that other events are important drivers of neurodegeneration outside of this cell type. For instance, several groups have demonstrated effects of ATM loss on microglia that suggest that these immune cells play very important roles in regulating neuroinflammation and neuronal function.63–65
Overall, the results shown here illuminate the genome-wide patterns of DNA damage and R-loops in neuron-like cells lacking ATM function and support the hypothesis that these molecular events may underlie ROS-driven changes in gene expression. The transcriptional changes we observed in A-T patient cerebellum tissue are very likely related to the pathology of the disease, considering that many genes implicated in cerebellar ataxia are significantly reduced in patient samples. Further work is needed to determine the source of R-loop-associated ssDNA breaks and to generate a biological model system with human cells to study the progression of damage and how it affects transcription patterns over time.
Limitations of the study
The neuron-like cells with ATM inhibition used in this work do not show significant changes in transcription, unlike the A-T brain tissue that we analyzed. We hypothesize that the duration of ATM loss needs to be significant to show the effects of DNA damage, PAR accumulation, and R-loops that we document here. For this, it will be essential to use a cellular or organismal model system that allows for an extended time of observation to document these changes in transcriptional regulation.
STAR★METHODS
RESOURCE AVAILABILITY
Lead contact
Further information and requests for resources and reagents should be directed to and will be fulfilled by the lead contact, Tanya Paull (tpaull@utexas.edu).
Materials availability
All plasmids generated in this study are available upon request, without restrictions.
Data and code availability
All sequencing data is available via the NIH GEO database (GSE233479).
Original code is deposited at https://github.com/prwoolley/ATM_par_rchip_paper/tree/main
Any additional information required to reanalyze the data reported in this work paper is available from the lead contact upon request.
EXPERIMENTAL MODEL AND STUDY PARTICIPANT DETAILS
Human samples
Postmortem, flash-frozen cerebellum and cortex samples from A-T patients (5 A-T, 4 female, 1 male) and age-matched controls (4 female) with ages ranging from 19 to 31 were obtained from the NIH Neurobiobank. For details see Table S1. All samples were de-identified.
Cell lines
Human SH-SY5Y neuroblastoma cells obtained from ATCC (CRL-2266) were grown in DMEM (Invitrogen) supplemented with 10% fetal bovine serum (26400044, Thermo Fisher) and 100 units/ml penicillin-streptomycin (P4333, Millipore Sigma), adherent cells only. The cells were induced to differentiate using a 3 day treatment with 1% FBS media and 10 μM retinoic acid (Sigma R2625) followed by 4 days with zero FBS, 10 μM retinoic acid, and 50 ng/mL BDNF (R&D Systems 248-BDB-250). HEK-293T cells were grown in DMEM(Invitrogen) supplemented with 10% fetal bovine serum (26400044, Thermo Fisher) and 100 units/ml penicillin-streptomycin (P4333, Millipore Sigma).
For R-ChIP studies, human RNaseH1 was expressed using a lentivirus derived from pTP5135, containing a tet-on allele of RNaseH D210N in a pLenti Hygro H2B mRuby backbone. pLentiPGK Hygro DEST H2B-mRuby2 was a gift from Markus Covert (Addgene plasmid # 90236; http://n2t.net/addgene:90236; RRID:Addgene_90236).66 Lentivirus was prepared in HEK-293T cells as previously described7; SH-SY5Y cells were transduced with lentivirus and selected in hygromycin (200 μg/mL, Millipore Sigma 40052). For experiments with ATM inhibitor, AZD1390 (Selleckchem S8680) was added for the final two days of differentiation at a concentration of 1 μM). For experiments with NAC (Sigma A9165), 1 mM was added for the final 2 days of differentiation. The C terminus (a.a. 666 to 2677) of Senataxin was expressed in SH-SY5Y cells from a tet-on promotor in pTP4764, a derivative of pcDNA5, for the final 2 days of differentiation by addition of doxycycline at 1 μg/mL).
METHOD DETAILS
Comet assays
Comet assays were performed using the Cell Biolabs OxiSelect comet assay kit according to manufacturer instructions with the following modifications: The gel was run using a Horizon 11–14 agarose gel apparatus using 35V for 15 to 30 min for alkaline comet assays and 50V for 15 min for neutral comet assays. Images were obtained using a Nikon TS2-FL microscope and analyzed with OpenComet.67
ROS measurements
CM-H2DCFDA (Thermo Fisher C6827) ROS assays were performed with differentiated SH-SY5Y cells using 1 μM CM-H2DCFDA for 15 min and analyzed by FACS.
PAR ChIP
The protocol was adapted from Wu et al.33 Briefly, SH-SY5Y cells were differentiated as described above and two 15 cm dishes were used for each ChIP replicate (approximately 20M cells). Cells were removed from dishes using trypsin and then resuspended in media in a volume of 36 mL. Formaldehyde (37%, Sigma F1635) was added to 1% final concentration and incubated at 37°C for 7 min with occasional inversion of the tube. 2.5M glycine was added to a final concentration of 0.125M. The tube was inverted several times and cells recovered by centrifugation at 550×g for 5 min at 4°C. The pellet was washed twice with 10 mL cold PBS using 550×g centrifugation for 5 min each time. The pellets were snap frozen using liquid nitrogen and stored at −80°C for later use. Each cell pellet was resuspended in 1mL cold PAR ChIP RIPA buffer (10 mM Tris-HCl, pH7.6, 1 mM EDTA, 0.1% SDS, 0.1% sodium deoxycholate, 1% Triton X-100) containing protease inhibitor (Fisher, A32955). Samples were sonicated using a Diagenode Bioruptor UCD-200 instrument on high power with 15 s on/15 s off cycles for 45 min at 4°C. Under these conditions, fragmented chromatin was 200–500 bp. Samples were centrifuged at 20,000×g for 10 min at 4°C. The supernatant was transferred to another tube; 50 μL were reserved as input DNA. 40 μL of Protein A/G magnetic beads (Thermo Fisher 88803) was incubated with 5 μg anti-pan-ADP-ribose binding reagent (Millipore Sigma, MABE1016) per IP sample in 100 μL PBS for 30 min then washed with 200μL PBS twice. The beads were then added to the supernatant and incubated at 4°C overnight. The following day, beads were washes for 10 min at 4°C with the following sequence of buffers: 2x with 1 mL of RIPA buffer, 2x with 1 mL of RIPA buffer +0.3M NaCl, 1x with 1 mL of TE pH 8 + 0.2% Triton X-100, 1x with 1 mL of TE pH 8. The beads were resuspended in 100 μL TE; 3μL 10% SDS and 5μL 20 mg/mL proteinase K were added and the samples incubated at 65°C for 4 h while rocking. The tubes were vortexed every 30 to 50 min. The DNA was removed from beads using a magnetic stand; 100 μL TE + 0.5M NaCl was added to the beads and then removed and combined with the first sample. 200 μL phenol/chloroform/isoamyl alcohol was added and samples were added to Phase Lock gel columns (VWR, 10847–802) and processed according to manufacturer instructions. Samples were then ethanol precipitated by adding 2μL glycogen (20 mg/mL), 20μL 3M NaOAc pH 5.2, and 500 μL cold ethanol (100%). After incubation on dry ice for 15 min, samples were centrifuged at 20,000×g for 15 min at 4°C. Pellets were washed with 70% ethanol twice; the supernatant was removed and pellets dried at room temp. Pellets were resuspended in 22 μL 10 mM Tris-HCl pH 8.0, vortexed, and stored at −20°C.
R-ChIP
The protocol was adapted from Chen et al.41 Briefly, SH-SY5Y cells were differentiated as described above and two 15 cm dishes were used for each ChIP replicate (approximately 20M cells). Cells were crosslinked in the dishes with the addition of formaldehyde to 1% final concentration and incubated for 7 min while shaking (120 RPM). 2.5M glycine was added to a final concentration of 0.125M. Cells were removed by scraping and transferred to conical tubes with an additional 5 mL PBS to wash the dishes. Cells were centrifuged at 2187×g for 15 min at 4°C, then washed with cold PBS and pelleted again. The pellets were snap frozen using liquid nitrogen and stored at −80°C for later use. Each cell pellet was resuspended in 2.3 mL cold R-ChIP RIPA buffer (50 mM TrisHCl, pH 8.0, 0.15M NaCl, 2 mM EDTA, 0.1% SDS, 0.5% sodium deoxycholate, 0.1% Igepal CA-630 (NP40) containing protease inhibitor (Fisher, A32955) and incubated on ice for 10 min. Samples were sonicated using a Diagenode Bioruptor UCD-200 instrument on high power with 15 s on/15 s off cycles for 45 min at 4°C. Samples were centrifuged at 3,889×g for 10 min at 4°C. The supernatant was transferred to another tube; 50 μL were reserved as input DNA. 25 μL of Protein A/G magnetic beads per IP sample were washed with 1 mL wash buffer (20 mM Tris-HCl pH 8.0, 0.15M NaCl, 2 mM EDTA, 1% Triton X-100) using a magnetic separator; this step was repeated for a total of 3 washes. Beads were resuspended in bead blocking buffer (0.2 μg/mL BSA, 0.2 mg/mL glycogen in PBS) and incubated for 1 h at RT. Beads were then washed 3 times with antibody binding buffer (5 μg/mL BSA in PBS), resuspended in 250 μL antibody binding buffer and 2.5 μg FLAG M2 antibody (Sigma) per 25 μL of Protein A/G magnetic beads and incubated overnight at 4°C with rotation. After removal of unbound antibody, beads were resuspended in 1 mL sonicated lysate and incubated overnight at 4°C with rotation. The following day, beads were washed 3 times for 3 min at room temperature with 1 mL wash buffer I (20 mM Tris-HCl pH 8.0, 150 mM NaCl, 2 mM EDTA, 1% Triton X-100, 0.1% SDS) containing protease inhibitor, then 3 times with wash buffer II (wash buffer I containing 0.5M NaCl), then once with wash buffer III (20 mM Tris-HCl pH 8.0, 1 mM EDTA, 1% NP40, 0.25M LiCl), then once with TE. Samples were moved to a new tube and eluted with 100 μL elution buffer (0.1 M sodium bicarbonate, 1% SDS) at 30°C for 30 min. Beads were removed, 1 μL RNase A (20 mg/mL) was added to each sample and supernatants were decrosslinked at 65°C for 22 h 1 μL Proteinase K (20 mg/mL) was added to each sample and incubated for an additional 2 h at 65°C. Samples were purified using the nucleotide removal kit (Qiagen) according to manufacturer instructions.
ChIP library preparation and sequencing
For PAR and R-ChIP, the eluted DNA (2 biological replicates per condition) as well as input samples were used to make sequencing libraries using the NEBNext Ultra II DNA Library Prep Kit for Illumina (NEB) with NEBNext Multiplex dual index primers using 12 amplification cycles and 2 additional AMPure XP clean-up steps at 0.8X. Libraries were sequenced by the UT Genomic Sequencing and Analysis Facility (RRID:SCR_021713) using the Illumina NovaSeq SP platform with PE150 runs.
RNA extraction from patient tissues
Fresh-frozen A-T patient and control tissues were obtained from the NIH Neurobiobank (Table S1). 50mg patient tissue RNA was extracted in an RNase free environment using RNA Extraction kit for Bioruptor Plus (Diagenode Cat# C20000010). The additional protocol listed for DNaseI treatment was followed for 10μg of extracted RNA per sample. DNaseI treated RNA was cleaned using RNeasy Mini Kit (Qiagen Cat# 74104). RNAseq library prep was performed using NEBNext Ultra II RNA Library Prep for Illumina (NEB Cat# E7770S). The NEB protocol was followed using the Poly(A) mRNA Magnetic Isolation Module and SPRIselect beads (Beckman Coulter B23317). Library adapter was diluted 5-fold. The additional SPRIselect cleanup step referred to at 1.11.3 in the NEB protocol was followed.
Purkinje cell density estimation
Purkinje cell counts were done in triplicate for each A-T patient and control using previously generated chromogenic immunohistochemistry image files.11 For each image, Purkinje cells were enumerated and normalized by the total length in μm of the Purkinje layer as measured in Fiji.
RNA extraction from SH-SY5Y neuroblastoma cells
Total RNA extraction was performed using NEB Monarch Total RNA Miniprep Kit (New England Biolabs Cat #T2010S). RNAseq library prep was performed using NEBNext Ultra II RNA Library Prep for Illumina (NEB Cat# E7770S). The NEB protocol was followed using the Poly(A) mRNA Magnetic Isolation Module and SPRIselect beads (Beckman Coulter B23317). Library adapter was diluted 5-fold. The additional SPRIselect cleanup step referred to at 1.11.3 in the NEB protocol was followed.
RNAseq computation
Sequencing reads were cleaned using FASTP in paired end mode, transcript abundance levels were determined using Salmon pseudoaligner and GRCh38 (hg38), and differentially abundant transcripts were quantified using Swish in the Gene mode. Statistically significant differences between density plots were determined using empirical cumulative distribution function tests via DTS R package with 5000 bootstraps. GSEA information was computed via the Fast Gene Set Enrichment Analysis (FGSEA) R package.68 Code is deposited on GitHub: https://github.com/prwoolley/ATM_par_rchip_paper/tree/main.
ChIP computation
Sequencing reads were cleaned using FASTP in paired end mode and mapped to the genome using STAR aligner and GRCh38 (hg38). Aligned reads were converted to bedgraph format via MACS2.69 Output bedgraph files were processed again using MACS2’s bdgcmp command with the ppois flag to approximately remove the ChIP input influence from the ChIP bedgraph files. Finally, bedgraph output was read depth normalized to make files equivalent in total signal.
For analysis shown in Figures 4 and 5, bedgraph files were converted to bigwig format and analyzed using deepTools computematrix and plotheatmap or with multibigwigsummary.70 Bed files for comparisons at specific sites were taken from refTSS,71 data from this study, or from previously published GEO datasets SRR3363259, SRR3363257, SRR3363256, SRR3363255, SRR3363258, SRR5819663, SRR5819664.36–38 Processing of external data was done as described for the other raw data; bed files used for comparisons were peaks called using MACS2 with input files as controls.
For analysis shown in Figure 6, Final bedgraph files were separated into separate bedgraph files for each chromosome. Bedgraph files were converted into “extended” Numpy arrays where each array element represents a nucleotide on the genome and the element value is the bedgraph value at that location. Pandas rolling(window=100) function was paired with mean() to calculate the 100nt rolling mean ChIP signal across the genome (see Figure S10). Rolling mean GC Content was computed similarly. GRCh38 genome sequence was converted to integer data type (0 for A/T and 1 for G/C) before the 100nt rolling mean was computed as above. Processed data using these arrays for figures was all computed using Numpy and Pandas. Plots were made using Matplotlib. Code is deposited on GitHub: https://github.com/prwoolley/ATM_par_rchip_paper/tree/main.
Visium spatial transcriptomics
Fresh-frozen A-T and control tissues (A-T patient 1 and Control 2, Table S1) were sectioned and mounted on Visium slides and sequenced using a NovaSeq 500 platform with PE150.
Visium preprocessing
Spaceranger software was used to align dot transcription information onto tissue slice stains. Specifically, “spaceranger count” was ran on each tissue sample with default flags. Aggregation was performed to merge the AT and Control samples into one file using “spaceranger aggr” with the “–normalize = mapped” flag.
Once quantified, the Cloupe files were analyzed using 10X Genomics Loupe Browser 6. Cell layers were manually assigned using the stain layers and candidate gene markers as reference. tSNE plots were processed using Loupe Browser 6 as well. Once linking each dot to a cell layer, transcript counts for each gene in each dot was exported using instructions from this 10X tutorial: https://kb.10xgenomics.com/hc/en-us/articles/360023793031-How-can-I-convert-the-feature-barcode-matrix-from-Cell-Ranger-3-to-a-CSV-file-?source=search. We fed dot transcript data into DESeq2 where each dot was considered a replicate for each condition (AT or C). Purkinje cell markers were downloaded from an annotated, developing cerebellum scRNAseq dataset provided by UCSC linked here: https://cells.ucsc.edu/?ds=cbl-dev.
GC skew
GC Skew was calculated as (#G-#C)/(#G+#C).
Poisson comparison of ChIP data
Statsmodels (v 0.14.0) Poisson ratio test of independence was used to compare mean ChIP values between samples. Sample sizes were 1,000 to save on computational resources. Poisson parameters for each distribution were the mean values plotted.
Actual command
test_poisson_2indep(1_000, Mean1, 1_000, Mean2, method = ‘etest-score’,compare = ‘ratio’)
QUANTIFICATION AND STATISTICAL ANALYSIS
RNAseq comparisons: Statistically significant differences between density plots were determined using empirical cumulative distribution function tests via DTS R package with 5000 bootstraps. p value comparisons for comet assays, ROS measurements, and PAR ChIP and R-ChIP comparisons at specific subsets of loci, were determined by 2-sample t test assuming unequal variances. Relationships between PAR and R-ChIP and GC content, GC skew, and transcriptional abundance were determined by a Poisson ratio test of independence using the statsmodels “test_poisson_2indep()” function.
Supplementary Material
KEY RESOURCES TABLE.
| REAGENT or RESOURCE | SOURCE | IDENTIFIER |
|---|---|---|
|
| ||
| Antibodies | ||
|
| ||
| FLAG M2 antibody | Millipore Sigma | F1804 |
|
| ||
| Biological samples | ||
|
| ||
| Human brain samples, frozen (See Table S1) | NIH Neurobiobank | N/A |
|
| ||
| Chemicals, peptides, and recombinant proteins | ||
|
| ||
| penicillin-streptomycin | Millipore Sigma | P4333 |
| fetal bovine serum | Thermo Fisher | 26400044 |
| retinoic acid | Sigma | R2625 |
| BDNF | R&D Systems | 248-BDB-250 |
| hygromycin | Millipore Sigma | 400052 |
| AZD1390 | Selleckchem | S8680 |
| N-acetyl cysteine | Sigma | A9165 |
| CM-H2DCFDA | Thermo Fisher | C6827 |
| formaldehyde | Sigma | F1635 |
| protease inhibitor | Thermo Fisher | A32955 |
| anti-pan-ADP-ribose binding reagent | Millipore Sigma | MABE1016 |
| protein A/G magnetic beads | Thermo Fisher | 88803 |
|
| ||
| Critical commercial assays | ||
|
| ||
| Oxiselect comet assay kit | Fisher | STA-350 |
|
| ||
| Deposited data | ||
|
| ||
| ChIP and RNAseq datasets | GEO | GEO: GSE233479 |
|
| ||
| Experimental models: Cell lines | ||
|
| ||
| Human SH-SY5Y neuroblastoma cells | ATCC | CRL-2266 |
| human HEK-293T cells | ATCC | CRL-11268 |
|
| ||
| Oligonucleotides | ||
|
| ||
| NEBNext Multiplex dual index primers | NEB | E7500S |
|
| ||
| Recombinant DNA | ||
|
| ||
| tet-on allele of Flag-RNaseH D210N in a pLenti Hygro H2B mRuby backbone | This study | pTP5135 |
| C terminus of Senataxin in pcDNA5 | This study | pTP4764 |
| pLentiPGK Hygro DEST H2B-mRuby2 | Addgene | 90236 |
|
| ||
| Software and algorithms | ||
|
| ||
| OpenComet | N/A | https://cometbio.org/ |
| Fast Gene Set Enrichment Analysis R package | N/A | https://bioconductor.org/packages/fgsea |
| code to calculate the 100nt rolling mean ChIP signal across the genome | N/A | https://github.com/prwoolley/ATM_par_rchip_paper/tree/main. |
|
| ||
| Other | ||
|
| ||
| nucleotide removal kit | Qiagen | 28306 |
| NEBNext Ultra II DNA Library Prep Kit for Illumina | NEB | E7645L |
| RNA Extraction kit for Bioruptor Plus | Diagenode | C20000010 |
| RNeasy mini kit | Qiagen | 74104 |
| NEBNext Ultra II RNA Library Prep for Illumina | NEB | E7770S |
| SPRIselect beads | Beckman Coulter | B23317 |
| NEB Monarch Total RNA Miniprep Kit | NEB | T2010S |
| phase lock columns | VWR | 10847–802 |
Highlights.
Significant differences in gene expression found in A-T patient brain samples
Many genes associated with cerebellar ataxia are downregulated in A-T
ATM loss in neuron-like cells generates hyperPARylation at transcribed loci
PAR-associated sites in the genome correlate with high GC content and transcription
ACKNOWLEDGMENTS
We thank members of the Paull laboratory for helpful discussion and Vishwanath Iyer for useful suggestions. We are indebted to the families of the A-T patients and control individuals who contributed the autopsy material for research use, as well as the Neurobiobank for providing us with the frozen and fixed tissue samples. We acknowledge grant support from the A-T Society, NIH R01NS126747, and Cancer Prevention and Research Institute grant RP200254. Sequencing was performed by the University of Texas Genomic Sequencing and Analysis Facility (RRID: SCR_021756).
Footnotes
DECLARATION OF INTERESTS
The authors declare no competing interests.
SUPPLEMENTAL INFORMATION
Supplemental information can be found online at https://doi.org/10.1016/j.celrep.2024.113896.
REFERENCES
- 1.Rothblum-Oviatt C, Wright J, Lefton-Greif MA, McGrath-Morrow SA, Crawford TO, and Lederman HM (2016). Ataxia telangiectasia: a review. Orphanet J. Rare Dis. 11, 159. 10.1186/s13023-016-0543-7. [DOI] [PMC free article] [PubMed] [Google Scholar]
- 2.Shiloh Y, and Ziv Y (2013). The ATM protein kinase: regulating the cellular response to genotoxic stress, and more. Nat. Rev. Mol. Cell Biol. 14, 197–210. 10.1038/nrm3546. [DOI] [PubMed] [Google Scholar]
- 3.Lee J-H, and Paull TT (2021). Cellular functions of the protein kinase ATM and their relevance to human disease. Nat. Rev. Mol. Cell Biol. 22, 796–814. 10.1038/s41580-021-00394-2. [DOI] [PubMed] [Google Scholar]
- 4.Guo Z, Kozlov S, Lavin MF, Person MD, and Paull TT (2010). ATM activation by oxidative stress. Science 330, 517–521. 10.1126/science.1192912. [DOI] [PubMed] [Google Scholar]
- 5.Barzilai A, Rotman G, and Shiloh Y (2002). ATM deficiency and oxidative stress: a new dimension of defective response to DNA damage. DNA Repair 1, 3–25. [DOI] [PubMed] [Google Scholar]
- 6.Howes AC, Perisic O, and Williams RL (2023). Structural insights into the activation of ataxia-telangiectasia mutated by oxidative stress. Sci. Adv. 9, eadi8291. 10.1126/sciadv.adi8291. [DOI] [PMC free article] [PubMed] [Google Scholar]
- 7.Lee J-H, Mand MR, Kao C-H, Zhou Y, Ryu SW, Richards AL, Coon JJ, and Paull TT (2018). ATM directs DNA damage responses and proteostasis via genetically separable pathways. Sci. Signal. 11, eaan5598. 10.1126/scisignal.aan5598. [DOI] [PMC free article] [PubMed] [Google Scholar]
- 8.Chessa L, Petrinelli P, Antonelli A, Fiorilli M, Elli R, Marcucci L, Federico A, and Gandini E (1992). Heterogeneity in ataxia-telangiectasia: classical phenotype associated with intermediate cellular radiosensitivity. Am. J. Med. Genet. 42, 741–746. 10.1002/ajmg.1320420524. [DOI] [PubMed] [Google Scholar]
- 9.Gilad S, Chessa L, Khosravi R, Russell P, Galanty Y, Piane M, Gatti RA, Jorgensen TJ, Shiloh Y, and Bar-Shira A (1998). Genotype-phenotype relationships in ataxia-telangiectasia and variants. Am. J. Hum. Genet. 62, 551–561. 10.1086/301755. [DOI] [PMC free article] [PubMed] [Google Scholar]
- 10.Toyoshima M, Hara T, Zhang H, Yamamoto T, Akaboshi S, Nanba E, Ohno K, Hori N, Sato K, and Takeshita K (1998). Ataxia-telangiectasia without immunodeficiency: novel point mutations within and adjacent to the phosphatidylinositol 3-kinase-like domain. Am. J. Med. Genet. 75, 141–144. . [DOI] [PubMed] [Google Scholar]
- 11.Lee J-H, Ryu SW, Ender NA, and Paull TT (2021). Poly-ADP-ribosylation drives loss of protein homeostasis in ATM and Mre11 deficiency. Mol. Cell 81, 1515–1533.e5. 10.1016/j.molcel.2021.01.019. [DOI] [PMC free article] [PubMed] [Google Scholar]
- 12.Yoon G, and Caldecott KW (2018). Nonsyndromic cerebellar ataxias associated with disorders of DNA single-strand break repair. Handb. Clin. Neurol. 155, 105–115. 10.1016/B978-0-444-64189-2.00007-X. [DOI] [PubMed] [Google Scholar]
- 13.McKinnon PJ (2017). Genome integrity and disease prevention in the nervous system. Genes Dev. 31, 1180–1194. 10.1101/gad.301325.117. [DOI] [PMC free article] [PubMed] [Google Scholar]
- 14.Groh M, Albulescu LO, Cristini A, and Gromak N (2017). Senataxin: Genome Guardian at the Interface of Transcription and Neurodegeneration. J. Mol. Biol. 429, 3181–3195. 10.1016/j.jmb.2016. 10.021. [DOI] [PubMed] [Google Scholar]
- 15.Ashizawa T, Öz G, and Paulson HL (2018). Spinocerebellar ataxias: prospects and challenges for therapy development. Nat. Rev. Neurol. 14, 590–605. 10.1038/s41582-018-0051-6. [DOI] [PMC free article] [PubMed] [Google Scholar]
- 16.Xiao C, Binkley EM, Rexach J, Knight-Johnson A, Khemani P, Fogel BL, Das S, Stone EM, and Gomez CM (2019). A family with spinocerebellar ataxia and retinitis pigmentosa attributed to an ELOVL4 mutation. Neurol. Genet. 5, e357. 10.1212/NXG.0000000000000357. [DOI] [PMC free article] [PubMed] [Google Scholar]
- 17.Waters MF, Minassian NA, Stevanin G, Figueroa KP, Bannister JPA, Nolte D, Mock AF, Evidente VGH, Fee DB, Müller U, et al. (2006). Mutations in voltage-gated potassium channel KCNC3 cause degenerative and developmental central nervous system phenotypes. Nat. Genet. 38, 447–451. 10.1038/ng1758. [DOI] [PubMed] [Google Scholar]
- 18.Yabe I, Sasaki H, Chen D-H, Raskind WH, Bird TD, Yamashita I, Tsuji S, Kikuchi S, and Tashiro K (2003). Spinocerebellar ataxia type 14 caused by a mutation in protein kinase C gamma. Arch. Neurol. 60, 1749–1751. 10.1001/archneur.60.12.1749. [DOI] [PubMed] [Google Scholar]
- 19.van de Leemput J, Chandran J, Knight MA, Holtzclaw LA, Scholz S, Cookson MR, Houlden H, Gwinn-Hardy K, Fung H-C, Lin X, et al. (2007). Deletion at ITPR1 underlies ataxia in mice and spinocerebellar ataxia 15 in humans. PLoS Genet. 3, e108. 10.1371/journal.pgen.0030108. [DOI] [PMC free article] [PubMed] [Google Scholar]
- 20.Türkmen S, Guo G, Garshasbi M, Hoffmann K, Alshalah AJ, Mischung C, Kuss A, Humphrey N, Mundlos S, and Robinson PN (2009). CA8 mutations cause a novel syndrome characterized by ataxia and mild mental retardation with predisposition to quadrupedal gait. PLoS Genet. 5, e1000487. 10.1371/journal.pgen.1000487. [DOI] [PMC free article] [PubMed] [Google Scholar]
- 21.Ikeda Y, Dick KA, Weatherspoon MR, Gincel D, Armbrust KR, Dalton JC, Stevanin G, Dürr A, Zühlke C, Bürk K, et al. (2006). Spectrin mutations cause spinocerebellar ataxia type 5. Nat. Genet. 38, 184–190. 10.1038/ng1728. [DOI] [PubMed] [Google Scholar]
- 22.Sweadner KJ, Toro C, Whitlow CT, Snively BM, Cook JF, Ozelius LJ, Markello TC, and Brashear A (2016). ATP1A3 Mutation in Adult Rapid-Onset Ataxia. PLoS One 11, e0151429. 10.1371/journal.pone.0151429. [DOI] [PMC free article] [PubMed] [Google Scholar]
- 23.Scheffer H, Brunt ER, Mol GJ, van der Vlies P, Stulp RP, Verlind E, Mantel G, Averyanov YN, Hofstra RM, and Buys CH (1998). Three novel KCNA1 mutations in episodic ataxia type I families. Hum. Genet. 102, 464–466. 10.1007/s004390050722. [DOI] [PubMed] [Google Scholar]
- 24.Zanni G, Calí T, Kalscheuer VM, Ottolini D, Barresi S, Lebrun N, Montecchi-Palazzi L, Hu H, Chelly J, Bertini E, et al. (2012). Mutation of plasma membrane Ca2+ ATPase isoform 3 in a family with X-linked congenital cerebellar ataxia impairs Ca2+ homeostasis. Proc. Natl. Acad. Sci. USA 109, 14514–14519. 10.1073/pnas.1207488109. [DOI] [PMC free article] [PubMed] [Google Scholar]
- 25.Delplanque J, Devos D, Huin V, Genet A, Sand O, Moreau C, Goizet C, Charles P, Anheim M, Monin ML, et al. (2014). TMEM240 mutations cause spinocerebellar ataxia 21 with mental retardation and severe cognitive impairment. Brain 137, 2657–2663. 10.1093/brain/awu202. [DOI] [PubMed] [Google Scholar]
- 26.Nibbeling EAR, Duarri A, Verschuuren-Bemelmans CC, Fokkens MR, Karjalainen JM, Smeets CJLM, de Boer-Bergsma JJ, van der Vries G, Dooijes D, Bampi GB, et al. (2017). Exome sequencing and network analysis identifies shared mechanisms underlying spinocerebellar ataxia. Brain 140, 2860–2878. 10.1093/brain/awx251. [DOI] [PubMed] [Google Scholar]
- 27.Magrino J, Munford V, Martins DJ, Homma TK, Page B, Gaubitz C, Freire BL, Lerario AM, Vilar JB, Amorin A, et al. (2023). A thermo-sensitive PCNA allele underlies an ataxia-telangiectasia-like disorder. J. Biol. Chem. 299, 104656. 10.1016/j.jbc.2023.104656. [DOI] [PMC free article] [PubMed] [Google Scholar]
- 28.Hoch NC, Hanzlikova H, Rulten SL, Tétreault M, Komulainen E, Ju L, Hornyak P, Zeng Z, Gittens W, Rey SA, et al. (2017). XRCC1 mutation is associated with PARP1 hyperactivation and cerebellar ataxia. Nature 541, 87–91. 10.1038/nature20790. [DOI] [PMC free article] [PubMed] [Google Scholar]
- 29.Gros-Louis F, Dupré N, Dion P, Fox MA, Laurent S, Verreault S, Sanes JR, Bouchard J-P, and Rouleau GA (2007). Mutations in SYNE1 lead to a newly discovered form of autosomal recessive cerebellar ataxia. Nat. Genet. 39, 80–85. 10.1038/ng1927. [DOI] [PubMed] [Google Scholar]
- 30.Sahama I, Sinclair K, Pannek K, Lavin M, and Rose S (2014). Radiological Imaging in Ataxia Telangiectasia: a Review. Cerebellum 13, 521–530. 10.1007/s12311-014-0557-4. [DOI] [PubMed] [Google Scholar]
- 31.Agholme L, Lindström T, Kågedal K, Marcusson J, and Hallbeck M (2010). An in vitro model for neuroscience: differentiation of SH-SY5Y cells into cells with morphological and biochemical characteristics of mature neurons. J. Alzheimers Dis. 20, 1069–1082. 10.3233/JAD-2010-091363. [DOI] [PubMed] [Google Scholar]
- 32.Fang EF, Kassahun H, Croteau DL, Scheibye-Knudsen M, Marosi K, Lu H, Shamanna RA, Kalyanasundaram S, Bollineni RC, Wilson MA, et al. (2016). NAD+ Replenishment Improves Lifespan and Health-span in Ataxia Telangiectasia Models via Mitophagy and DNA Repair. Cell Metabol. 24, 566–581. 10.1016/j.cmet.2016.09.004. [DOI] [PMC free article] [PubMed] [Google Scholar]
- 33.Wu W, Hill SE, Nathan WJ, Paiano J, Callen E, Wang D, Shinoda K, van Wietmarschen N, Colón-Mercado JM, Zong D, et al. (2021). Neuronal enhancers are hotspots for DNA single-strand break repair. Nature 593, 440–444. 10.1038/s41586-021-03468-5. [DOI] [PMC free article] [PubMed] [Google Scholar]
- 34.Gibson BA, Conrad LB, Huang D, and Kraus WL (2017). Generation and Characterization of Recombinant Antibody-like ADP-Ribose Binding Proteins. Biochemistry 56, 6305–6316. 10.1021/acs.biochem.7b00670. [DOI] [PMC free article] [PubMed] [Google Scholar]
- 35.Durant ST, Zheng L, Wang Y, Chen K, Zhang L, Zhang T, Yang Z, Riches L, Trinidad AG, Fok JHL, et al. (2018). The brain-penetrant clinical ATM inhibitor AZD1390 radiosensitizes and improves survival of preclinical brain tumor models. Sci. Adv. 4, eaat1719. 10.1126/sciadv.aat1719. [DOI] [PMC free article] [PubMed] [Google Scholar]
- 36.Zimmerman MW, Liu Y, He S, Durbin AD, Abraham BJ, Easton J, Shao Y, Xu B, Zhu S, Zhang X, et al. (2018). MYC Drives a Subset of High-Risk Pediatric Neuroblastomas and Is Activated through Mechanisms Including Enhancer Hijacking and Focal Enhancer Amplification. Cancer Discov. 8, 320–335. 10.1158/2159-8290.CD-17-0993. [DOI] [PMC free article] [PubMed] [Google Scholar]
- 37.Boeva V, Louis-Brennetot C, Peltier A, Durand S, Pierre-Eugène C, Raynal V, Etchevers HC, Thomas S, Lermine A, Daudigeos-Dubus E, et al. (2017). Heterogeneity of neuroblastoma cell identity defined by transcriptional circuitries. Nat. Genet. 49, 1408–1413. 10.1038/ng.3921. [DOI] [PubMed] [Google Scholar]
- 38.Henrich K-O, Bender S, Saadati M, Dreidax D, Gartlgruber M, Shao C, Herrmann C, Wiesenfarth M, Parzonka M, Wehrmann L, et al. (2016). Integrative Genome-Scale Analysis Identifies Epigenetic Mechanisms of Transcriptional Deregulation in Unfavorable Neuroblastomas. Cancer Res. 76, 5523–5537. 10.1158/0008-5472.CAN-15-2507. [DOI] [PubMed] [Google Scholar]
- 39.Pundhir S, Bagger FO, Lauridsen FB, Rapin N, and Porse BT (2016). Peak-valley-peak pattern of histone modifications delineates active regulatory elements and their directionality. Nucleic Acids Res. 44, 4037–4051. 10.1093/nar/gkw250. [DOI] [PMC free article] [PubMed] [Google Scholar]
- 40.Buenrostro JD, Wu B, Chang HY, and Greenleaf WJ (2015). ATAC-seq: A Method for Assaying Chromatin Accessibility Genome-Wide. Curr. Protoc. Mol. Biol. 109, 21.29.1–21.29.9. 10.1002/0471142727.mb2129s109. [DOI] [PMC free article] [PubMed] [Google Scholar]
- 41.Chen L, Chen J-Y, Zhang X, Gu Y, Xiao R, Shao C, Tang P, Qian H, Luo D, Li H, et al. (2017). R-ChIP Using Inactive RNase H Reveals Dynamic Coupling of R-loops with Transcriptional Pausing at Gene Promoters. Mol. Cell 68, 745–757.e5. 10.1016/j.molcel.2017.10.008. [DOI] [PMC free article] [PubMed] [Google Scholar]
- 42.Andersson R, Gebhard C, Miguel-Escalada I, Hoof I, Bornholdt J, Boyd M, Chen Y, Zhao X, Schmidl C, Suzuki T, et al. (2014). An atlas of active enhancers across human cell types and tissues. Nature 507, 455–461. 10.1038/nature12787. [DOI] [PMC free article] [PubMed] [Google Scholar]
- 43.Gupte R, Liu Z, and Kraus WL (2017). PARPs and ADP-ribosylation: recent advances linking molecular functions to biological outcomes. Genes Dev. 31, 101–126. 10.1101/gad.291518.116. [DOI] [PMC free article] [PubMed] [Google Scholar]
- 44.Ray Chaudhuri A, and Nussenzweig A (2017). The multifaceted roles of PARP1 in DNA repair and chromatin remodelling. Nat. Rev. Mol. Cell Biol. 18, 610–621. 10.1038/nrm.2017.53. [DOI] [PMC free article] [PubMed] [Google Scholar]
- 45.Schützenhofer K, Rack JGM, and Ahel I (2021). The Making and Breaking of Serine-ADP-Ribosylation in the DNA Damage Response. Front. Cell Dev. Biol. 9, 745922. 10.3389/fcell.2021.745922. [DOI] [PMC free article] [PubMed] [Google Scholar]
- 46.Reid DA, Reed PJ, Schlachetzki JCM, Nitulescu II, Chou G, Tsui EC, Jones JR, Chandran S, Lu AT, McClain CA, et al. (2021). Incorporation of a nucleoside analog maps genome repair sites in postmitotic human neurons. Science 372, 91–94. 10.1126/science.abb9032. [DOI] [PMC free article] [PubMed] [Google Scholar]
- 47.Kwak YD, Shaw TI, Downing SM, Tewari A, Jin H, Li Y, Dumitrache LC, Katyal S, Khodakhah K, Russell HR, and McKinnon PJ (2021). Chromatin architecture at susceptible gene loci in cerebellar Purkinje cells characterizes DNA damage-induced neurodegeneration. Sci. Adv. 7, eabg6363. 10.1126/sciadv.abg6363. [DOI] [PMC free article] [PubMed] [Google Scholar]
- 48.Kraus WL, and Lis JT (2003). PARP goes transcription. Cell 113, 677–683. 10.1016/s0092-8674(03)00433-1. [DOI] [PubMed] [Google Scholar]
- 49.Zong W, Gong Y, Sun W, Li T, and Wang Z-Q (2022). PARP1: Liaison of Chromatin Remodeling and Transcription. Cancers 14, 4162. 10.3390/cancers14174162. [DOI] [PMC free article] [PubMed] [Google Scholar]
- 50.Prokhorova E, Agnew T, Wondisford AR, Tellier M, Kaminski N, Beijer D, Holder J, Groslambert J, Suskiewicz MJ, Zhu K, et al. (2021). Unrestrained poly-ADP-ribosylation provides insights into chromatin regulation and human disease. Mol. Cell 81, 2640–2655.e8. 10.1016/j.molcel.2021.04.028. [DOI] [PMC free article] [PubMed] [Google Scholar]
- 51.Castillo-Guzman D, and Chédin F (2021). Defining R-loop classes and their contributions to genome instability. DNA Repair 106, 103182. 10.1016/j.dnarep.2021.103182. [DOI] [PMC free article] [PubMed] [Google Scholar]
- 52.Wang K, Wang H, Li C, Yin Z, Xiao R, Li Q, Xiang Y, Wang W, Huang J, Chen L, et al. (2021). Genomic profiling of native R loops with a DNA-RNA hybrid recognition sensor. Sci. Adv. 7, eabe3516. 10.1126/sciadv.abe3516. [DOI] [PMC free article] [PubMed] [Google Scholar]
- 53.Edwards DS, Maganti R, Tanksley JP, Luo J, Park JJH, Balkanska-Sinclair E, Ling J, and Floyd SR (2020). BRD4 Prevents R-Loop Formation and Transcription-Replication Conflicts by Ensuring Efficient Transcription Elongation. Cell Rep. 32, 108166. 10.1016/j.celrep.2020.108166. [DOI] [PMC free article] [PubMed] [Google Scholar]
- 54.Chen L, Chen J-Y, Huang Y-J, Gu Y, Qiu J, Qian H, Shao C, Zhang X, Hu J, Li H, et al. (2018). The Augmented R-Loop Is a Unifying Mechanism for Myelodysplastic Syndromes Induced by High-Risk Splicing Factor Mutations. Mol. Cell 69, 412–425.e6. 10.1016/j.molcel.2017.12.029. [DOI] [PMC free article] [PubMed] [Google Scholar]
- 55.Teng Y, Yadav T, Duan M, Tan J, Xiang Y, Gao B, Xu J, Liang Z, Liu Y, Nakajima S, et al. (2018). ROS-induced R loops trigger a transcription-coupled but BRCA1/2-independent homologous recombination pathway through CSB. Nat. Commun. 9, 4115. 10.1038/s41467-018-06586-3. [DOI] [PMC free article] [PubMed] [Google Scholar]
- 56.Jurkowska H, and Wróbel M (2018). Inhibition of Human Neuroblastoma Cell Proliferation by N-acetyl-L-cysteine as a Result of Increased Sulfane Sulfur Level. Anticancer Res. 38, 5109–5113. 10.21873/anticanres.12831. [DOI] [PubMed] [Google Scholar]
- 57.Zhang H, Limphong P, Pieper J, Liu Q, Rodesch CK, Christians E, and Benjamin IJ (2012). Glutathione-dependent reductive stress triggers mitochondrial oxidation and cytotoxicity. FASEB J. 26, 1442–1451. 10.1096/fj.11-199869. [DOI] [PMC free article] [PubMed] [Google Scholar]
- 58.Pé rez-Torres I, Guarner-Lans V, and Rubio-Ruiz ME (2017). Reductive Stress in Inflammation-Associated Diseases and the Pro-Oxidant Effect of Antioxidant Agents. Int. J. Mol. Sci. 18, 2098. 10.3390/ijms18102098. [DOI] [PMC free article] [PubMed] [Google Scholar]
- 59.Ginno PA, Lim YW, Lott PL, Korf I, and Chédin F (2013). GC skew at the 5′ and 3′ ends of human genes links R-loop formation to epigenetic regulation and transcription termination. Genome Res. 23, 1590–1600. 10.1101/gr.158436.113. [DOI] [PMC free article] [PubMed] [Google Scholar]
- 60.Verhagen MMM, Martin J-J, van Deuren M, Ceuterick-de Groote C, Weemaes CMR, Kremer BHPH, Taylor MAR, Willemsen MAAP, and Lammens M (2012). Neuropathology in classical and variant ataxia-telangiectasia. Neuropathology 32, 234–244. 10.1111/j.1440-1789.2011.01263.x. [DOI] [PubMed] [Google Scholar]
- 61.Vinokurov AY, Stelmashuk OA, Ukolova PA, Zherebtsov EA, and Abramov AY (2021). Brain region specificity in reactive oxygen species production and maintenance of redox balance. Free Radic. Biol. Med. 174, 195–201. 10.1016/j.freeradbiomed.2021.08.014. [DOI] [PubMed] [Google Scholar]
- 62.Kim J, Kim K, Mo J-S, and Lee Y (2020). Atm deficiency in the DNA polymerase b null cerebellum results in cerebellar ataxia and Itpr1 reduction associated with alteration of cytosine methylation. Nucleic Acids Res. 48, 3678–3691. 10.1093/nar/gkaa140. [DOI] [PMC free article] [PubMed] [Google Scholar]
- 63.Bourseguin J, Cheng W, Talbot E, Hardy L, Lai J, Jeffries AM, Lodato MA, Lee EA, and Khoronenkova SV (2022). Persistent DNA damage associated with ATM kinase deficiency promotes microglial dysfunction. Nucleic Acids Res. 50, 2700–2718. 10.1093/nar/gkac104. [DOI] [PMC free article] [PubMed] [Google Scholar]
- 64.Lai J, Kim J, Jeffries AM, Tolles A, Chittenden TW, Buckley PG, Yu TW, Lodato MA, and Lee EA (2021). Single-nucleus transcriptomic analyses reveal microglial activation underlying cerebellar degeneration in Ataxia Telangiectasia. Preprint at bioRxiv. 10.1101/2021.09.09.459619. [DOI] [Google Scholar]
- 65.Song X, Ma F, and Herrup K (2019). Accumulation of Cytoplasmic DNA Due to ATM Deficiency Activates the Microglial Viral Response System with Neurotoxic Consequences. J. Neurosci. 39, 6378–6394. 10.1523/JNEUROSCI.0774-19.2019. [DOI] [PMC free article] [PubMed] [Google Scholar]
- 66.Kudo T, Jeknic S, Macklin DN, Akhter S, Hughey JJ, Regot S, and Covert MW (2018). Live-cell measurements of kinase activity in single cells using translocation reporters. Nat. Protoc. 13, 155–169. 10.1038/nprot.2017.128. [DOI] [PubMed] [Google Scholar]
- 67.Gyori BM, Venkatachalam G, Thiagarajan PS, Hsu D, and Clement M-V (2014). OpenComet: An automated tool for comet assay image analysis. Redox Biol. 2, 457–465. 10.1016/j.redox.2013.12.020. [DOI] [PMC free article] [PubMed] [Google Scholar]
- 68.Korotkevich G, Sukhov V, Budin N, Shpak B, Artyomov MN, and Sergushichev A (2016). Fast gene set enrichment analysis. Preprint at bioRxiv. 10.1101/060012. [DOI] [Google Scholar]
- 69.Zhang Y, Liu T, Meyer CA, Eeckhoute J, Johnson DS, Bernstein BE, Nusbaum C, Myers RM, Brown M, Li W, and Liu XS (2008). Model-based analysis of ChIP-Seq (MACS). Genome Biol. 9, R137. 10.1186/gb-2008-9-9-r137. [DOI] [PMC free article] [PubMed] [Google Scholar]
- 70.Ramı F, Ryan DP, Grüning B, Bhardwaj V, Kilpert F, Richter AS, Heyne S, Dündar F, and Manke T (2016). deepTools2: a next generation web server for deep-sequencing data analysis. Nucleic Acids Res. 44, W160–W165. 10.1093/nar/gkw257. [DOI] [PMC free article] [PubMed] [Google Scholar]
- 71.Abugessaisa I, Noguchi S, Hasegawa A, Kondo A, Kawaji H, Carninci P, and Kasukawa T (2019). refTSS: A Reference Data Set for Human and Mouse Transcription Start Sites. J. Mol. Biol. 431, 2407–2422. 10.1016/j.jmb.2019.04.045. [DOI] [PubMed] [Google Scholar]
Associated Data
This section collects any data citations, data availability statements, or supplementary materials included in this article.
Supplementary Materials
Data Availability Statement
All sequencing data is available via the NIH GEO database (GSE233479).
Original code is deposited at https://github.com/prwoolley/ATM_par_rchip_paper/tree/main
Any additional information required to reanalyze the data reported in this work paper is available from the lead contact upon request.