Abstract
Organic anion transporting polypeptide (OATP) 1B1 and OATP1B3 (collectively, OATP1B) transporters encoded by the solute carrier organic anion transporter (SLCO) genes mediate uptake of multiple pharmaceutical compounds. Nonalcoholic steatohepatitis (NASH), a severe form of nonalcoholic fatty liver disease (NAFLD), decreases OATP1B abundance. This research characterized the pathologic and pharmacokinetics effects of three diet- and one chemical-induced NAFLD model in male and female humanized OATP1B mice, which comprises knock-out of rodent Oatp orthologs and insertion of human SLCO1B1 and SLCO1B3. Histopathology scoring demonstrated elevated steatosis and inflammation scores for all NAFLD-treatment groups. Female mice had minor changes in SLCO1B1 expression in two of the four NAFLD treatment groups, and pitavastatin (PIT) area under the concentration-time curve (AUC) increased in female mice in only one of the diet-induced models. OATP1B3 expression decreased in male and female mice in the chemical-induced NAFLD model, with a coinciding increase in PIT AUC, indicating the chemical-induced model may better replicate changes in OATP1B3 expression and OATP substrate disposition observed in NASH patients. This research also tested a reported multifactorial pharmacokinetic interaction between NAFLD and silymarin, an extract from milk thistle seeds with notable OATP-inhibitory effects. Males showed no change in PIT AUC, whereas female PIT AUC increased 1.55-fold from the diet alone and the 1.88-fold from the combination of diet with silymarin, suggesting that female mice are more sensitive to pharmacokinetic changes than male mice. Overall, the humanized OATP1B model should be used with caution for modeling NAFLD and multifactorial pharmacokinetic interactions.
SIGNIFICANCE STATEMENT
Advanced stages of NAFLD cause decreased hepatic OATP1B abundance and increase systemic exposure to OATP substrates in human patients. The humanized OATP1B mouse strain may provide a clinically relevant model to recapitulate these observations and predict pharmacokinetic interactions in NAFLD. This research characterized three diet-induced and one drug-induced NAFLD model in a humanized OATP1B mouse model. Additionally, a multifactorial pharmacokinetic interaction was observed between silymarin and NAFLD.
Introduction
Nonalcoholic fatty liver disease (NAFLD) is characterized by > 5% steatosis in hepatocytes in the absence of other etiological factors (e.g., alcohol consumption, steatogenic drug use, heredity, etc.) (Kleiner et al., 2005). It is a progressive disease encompassing nonalcoholic fatty liver (NAFL), nonalcoholic steatohepatitis (NASH), cirrhosis, and hepatocellular carcinoma (Sanyal, 2002; Kleiner et al., 2005). The clinical burden of NAFLD parallels that of obesity and metabolic syndrome, with cardiovascular disease and nonhepatic malignancy being the primary cause of death in patients without advanced fibrosis (Younossi et al., 2016, 2018; Friedman et al., 2018; Stefan et al., 2019; Cotter and Rinella, 2020). In addition to comorbidities and increased risk of mortality in NAFLD patients, evidence suggests these patients may be at increased risk of altered pharmacokinetics due to changes in multiple metabolizing enzymes and transporters (Kolwankar et al., 2007; Fisher et al., 2009; Woolsey et al., 2015; Vildhede et al., 2020).
Two important transporters known to have altered expression and function in NASH are organic anion transporting polypeptide (OATP) 1B1 and OATP1B3 (collectively, OATP1Bs). OATP1Bs are uptake transporters expressed on the sinusoidal membrane of hepatocytes that have an integral role in hepatic uptake of several classes of drugs, some of which have narrow therapeutic windows (McFeely et al., 2019). Additionally, the US Food and Drug Administration includes OATP1Bs as transporters of interest that should be considered when assessing pharmacokinetic interactions (Food and Drug Administration, 2020). OATP function is controlled at several levels, including transcription, translation, post-translational modifications, and membrane trafficking. N-linked glycosylation is an important factor for proper transporter localization to the plasma membrane (Clarke et al., 2017). NASH is reported to decrease abundance and glycosylation of both OATP1B transporters (Clarke et al., 2017; Vildhede et al., 2020). Having a preclinical model that can replicate the pathophysiological and pharmacokinetic effects of NAFLD will facilitate the prediction of clinical pharmacokinetic interactions. Previous mouse models of NAFLD have used wild-type or Oatp1b2 knockout mice to investigate OATP-mediated pharmacokinetic interactions in vivo. Incongruence between rodent and human OATPs limits the clinical translation of these data. To overcome this challenge, we tested several models of NAFLD in a transgenic mouse strain that has several mouse Oatp orthologs (Slco1a1, 1a4, 1a5, 1a6, and 1b2 cluster) knocked out and transgenic insertion of human SLCO1B1 and SLCO1B3 genes (van de Steeg et al., 2009, 2013).
Many approaches to model NAFLD in rodent species have been investigated with varying degrees of success in recapitulating specific aspects of the disease. Dietary models employ high fat, carbohydrate, and/or cholesterol content to mimic nutritional drivers of NAFLD pathology. These diets often contain ≥ 45% kilocalories (kcal) from fat or carbohydrates, whereas high cholesterol diets commonly contain ≥ 0.5% added cholesterol. These diets have mixed effects on pathology, metabolizing enzymes, and transporter expression changes (Rinella and Green, 2004; Charlton et al., 2011; Savard et al., 2013; Canet et al., 2014; Li et al., 2018; Ipsen et al., 2020; Arman et al., 2021). In contrast to overnutrition diets, there are methionine and choline low or deficient diets that can also recapitulate pathology and transporter changes. We selected high fat-high fructose (HFHF), high fat-high cholesterol (HFHC), and methionine and choline deficient (MCD) diets to induce NAFLD/NASH-like pathology due to their frequent usages and characterized effects. In addition to dietary models, several drug-induced models have been proposed to model specific features of NAFLD (Lee et al., 2012; Ipsen et al., 2020; Zhong et al., 2020). Tunicamycin was selected for this investigation because it induces endoplasmic reticulum (ER) stress and decreases N-linked glycosylation, similar to what occurs in NAFLD (Banerjee et al., 2011; Clarke et al., 2017; Guha et al., 2017).
One clinical concern for NAFLD patients is the lack of safe and efficacious pharmacological treatment options, which has led to multiple dietary supplements being investigated for their potential beneficial effects in NAFLD (https://www.niddk.nih.gov/health-information/liver-disease/nafld-nash/treatment). Silymarin, an extract from the seed of milk thistle (Silybum marianum (L.) Gaertn.), has received significant attention due to its purported hepatoprotective effects (Kroll et al., 2007). Unfortunately, the main constituents in silymarin, flavonolignans, are also inhibitors of OATPs (Köck et al., 2013; Montonye et al., 2019; Lynch et al., 2021). Therefore, NAFLD patients may be at risk of multifactorial OATP-mediated disease-natural product–drug interactions. These interactions may occur with the pharmacological therapies prescribed to NAFLD patients for comorbidities (e.g., statins for hypercholesterolemia, hypoglycemics for type 2 diabetes mellitus, etc.). We investigated this multifactorial pharmacokinetic interaction in the humanized OATP1B mice.
Here, we characterized the effects of three previously established NAFLD/NASH diet models and one drug-induced model on SLCO1B1 and SLCO1B3 mRNA expression, OATP1B3 protein expression, and pharmacokinetics of pitavastatin (PIT), a canonical OATP1B probe substrate in the OATP1B mice. Additionally, we characterized the multifactorial effects of NAFLD (HFHF diet) and oral silymarin on PIT pharmacokinetics.
Methods
Materials
PIT calcium was purchased from MedKoo Biosciences (Cat. # 318503, Morrisville, NC). PIT-d5 was purchased from Toronto Research Chemicals (Cat. # P531022, Toronto, ON, Canada). Silymarin was purchased from Madaus AG (Cologne, Germany) and previously characterized (Davis-Searles et al., 2005). Teklad standard chow (SC) diet containing 12% kcal fat (Cat. # 2016) was purchased from Inotiv (West Lafayette, IN). A high-fat diet (Cat. # D12451) containing 45% kcal fat and a HFHC diet (Cat. # D06061401) containing 60% kcal fat, 10 g cholesterol, and 4 g sodium cholate/4057 kcal were purchased from Research Diets, Inc. (New Brunswick, NJ). MCD diet (Cat. # D518810) was purchased from Dyets, Inc. (Bethlehem, PA). Fructose (Cat. # BT123445-5KG) was purchased from VWR (Radnor, PA). Tunicamycin (Cat. # T7765-10MG) was purchased from Millipore Sigma (St. Louis, MO). Polyethylene glycol 400, propylene glycol, and DMSO were purchased from Sigma-Aldrich (St. Louis, MO). TRIzol was purchased from Thermo Fischer Scientific (Cat. # 15596018, Waltham, MA).
Animals
Humanized OATP1B1/1B3 (OATP1B) mice were purchased from Taconic Biosciences (Model #11594, Germantown, NY) and bred to produce male and female mice for the pharmacokinetics studies. All animals were housed in accordance with all laws and regulations in a temperature-controlled environment with a 12-hour light/dark cycle. Food and water were provided ad libitum. All animal handling, care, and maintenance occurred in the Program of the Laboratory Animal Resources facility of Washington State University Health Sciences Spokane, which is accredited by the Association for the Assessment of Laboratory Animal Care International. The experimental protocol was approved by the Institutional Animal Care and Use Committee at Washington State University.
Diet-Induced NAFLD
Male and female OATP1B mice were fed a SC (n = 12 male and 12 female), HFHF (n = 12 male and 12 female), HFHC (n = 6 male and 6 female), or MCD (n = 6 male and 6 female) diet. SC, HFHF, and HFHC diets were administered for 16 weeks. The MCD diet was administered for 6 weeks. The MCD diet could not be continued beyond this time due to some animals experiencing ≥ 20% weight loss. Pharmacokinetics studies were completed at 32 to 36 weeks of age for SC, HFHF, and HFHC mice and 30 to 34 weeks of age for MCD mice.
Following the diet phase, six male and six female mice from each diet group were administered an oral gavage of 5 mg/kg PIT. Additionally, six male and six female mice fed the SC and HFHF diets were coadministered an oral gavage of 5 mg/kg PIT with 500 mg/kg silymarin.
Tunicamycin-Induced NAFLD
Male and female OATP1B mice were administered saline vehicle (n = 6 male and 6 female) or 1 mg/kg tunicamycin (n = 6 male and 6 female) via intraperitoneal injection 48 hours before oral gavage of 5 mg/kg PIT. Pharmacokinetic studies were completed at 32 to 36 weeks of age for saline and tunicamycin mice.
Age variation was distributed equally among all diet and treatment groups. The vehicle for all oral gavages comprised 45% polyethylene glycol-400, 20% propylene glycol, 10% DMSO, and 25% water.
Following oral gavage, mice were anesthetized via isoflurane inhalation and 1 to 2 mm of the tip of the tail was removed for blood collections. Blood collections occurred at 0.08, 0.25, 0.5, 1, 2, 4, 8, and 12 hours post-gavage. Blood was collected in heparinized capillary tubes then immediately centrifuged to collect plasma. Plasma was acidified with 0.55 M ammonium acetate:plasma (1:10, v:v). Plasma was stored at –80°C until analysis. Liver tissue samples were snap-frozen in liquid nitrogen for mRNA and protein analyses or formalin fixed for staining and histopathology scoring.
Histopathology
Formalin fixed liver tissues were processed, paraffin embedded, and sectioned at 4 μm. Sections were stained with H&E. The H&E-stained slides were analyzed by a board-certified veterinary pathologist for steatosis and inflammation. Based on the severity of the pathologies, the samples were scored from 0 to 5, with 5 being the most severe. A detailed description of the scoring was previously provided (Clarke et al., 2019).
mRNA Expression
Total RNA was extracted from OATP1B mouse liver using TRIzol reagent according to the manufacturer’s protocol. RNA concentrations were determined using a nano-drop. iScript cDNA synthesis kit (Cat. # 1708841, Bio-Rad, Hercules, CA) was used for cDNA synthesis from total RNA, and PerfeCTa SYBR Green SuperMix (Cat.# 95055, Quantabio, Beverly, MA) was used for real-time quantitative polymerase chain reaction analysis as per the manufacturer’s protocol using the qTower3G instrument (Analytik Jena, Upland, CA). Primers were purchased from Sigma (St. Louis, MO, USA) for SLCO1B1 (NM_006446.4) (forward sequence: AGTTGCCGGACTAACCATGA; reverse sequence: AGCATGACATGTGAGGTGCC) and SLCO1B3 (NM_019844.3) (forward sequence: TGGAAGGGTCTACTTGGGCT; reverse sequence: GCAGCAGCATTGTCTTGCAT). The expression for the genes of interest were normalized to the average expression of the housekeeping gene ubiquitin C (Ubc)(forward sequence: CAAGAAGGTCAAACAGGAAGACAG; reverse sequence: GCTTAAAAGATAGGGAAAACTAAGACACC) using two technical duplicates.
Western Blot
Frozen liver tissue samples were pulverized into a fine powder using mortar and pestle. Approximately 100 mg of the pulverized tissue was lysed with NP-40 lysis buffer containing protease inhibitors (Cat. # PI88665, Thermo Fisher Scientific) in a Tissuelyser II (Qiagen, Hilden, Germany). Protein lysates were separated by centrifugation at 10,000 × g at 4°C for 30 minutes and stored at –80°C. Protein concentrations were determined using the Pierce BCA Protein Quantification Assay kit (Thermo Fisher Scientific).
Thirty micrograms of total protein from liver tissue lysates were prepared in Laemmli buffer with 2.5% β-mercaptoethanol and heated at 37°C for 30 minutes. Samples were loaded into 7.5% SDS-PAGE gels and probed with an OATP1B3 primary antibody (graciously gifted by Dr. Bruno Hagenbuch of the University of Kansas Medical Center) at 4°C overnight at a dilution of 1:1000. The blots were subsequently incubated with anti-rabbit (1:10,000 dilution; Cat. # 20-304, Genesee Scientific, San Diego, CA) secondary antibody in 5% nonfat dry milk in Tris-buffered saline/Tween 20 for 1 hour at room temperature. Densitometry was performed using Image Laboratory (Bio-Rad, Standard Edition, Version 6.1.0 build 7). Proteins of interest were normalized to total protein stained with amido black and presented as protein expression relative to the standard chow or saline group.
Plasma Preparation and Liquid Chromatography Tandem Mass Spectrometer Analysis
Plasma samples were processed for liquid chromatography tandem mass spectrometer (LC-MS/MS) analysis via acetonitrile protein precipitation. Briefly, 10 µL plasma was diluted with 50 µL of 2 µM PIT-d5 and 0.5 µM PIT lactone-d5 in high-performance liquid chromatography-grade water containing 0.1% formic acid. Following dilution, 40 µL of acetonitrile containing 0.1% formic acid was added to the sample and vortexed. Samples were centrifuged at 18,000 × g for 15 minutes at 4°C. The supernatant was collected and injected for LC-MS/MS analysis.
LC-MS/MS analysis for PIT was conducted using SCIEX QTRAP 6500 tandem mass spectrometer (Framingham, MA) with a Shimadzu LC-30AD (Columbia, MD). Peak area quantification was accomplished using Analyst 1.7.3 software. Two microliters of prepared sample were injected onto a Waters ACQUITY UPLC HSS T3 Column (1.8 µm, 2.1 mm i.d. × 50 mm, 100 Å, Cat. # 186003538, Milford, MA) with 0.1% formic acid in water (A) and 0.1% formic acid in acetonitrile (B) mobile phase at a flow rate of 0.75 ml/min. The gradient started at 35% B, increased linearly to 95% B over 1.0 minute, followed by 95% B for 0.5 minute, and ended with 20% B for 0.5 minute. The mass spectrometer was operated in positive multiple reaction monitoring mode with precursor > product ions of m/z 422.1 > 290.1 for PIT, m/z 404.2 > 290.1 for PIT lactone, m/z 427.2 > 293.8 for PIT-d5, and m/z 409.2 > 295.2 for PIT lactone-d5.
Pharmacokinetic Analysis
The pharmacokinetics of PIT was determined via noncompartmental analysis methods using Phoenix WinNonlin (v8.3; Certara, Princeton, NJ). PIT area under the concentration-time profile (AUC) was determined using the linear up/log down trapezoidal method and reported as the geometric mean (upper and lower 90% confidence interval). Cmax and time to Cmax (tmax) were obtained directly from the concentration-time profiles and are represented as arithmetic mean (SD) and median (range), respectively. Half-life (t1/2) was calculated as (ln 2)/λz where λz is terminal elimination rate constant calculated by linear regression of at least three data points in the elimination phase of the concentration-time profile and presented as arithmetic mean (SD). The AUC ratios (AUCRs) were calculated as the ratio of the AUC of PIT in the presence of a NAFLD-inducer (i.e., diet or tunicamycin) and/or silymarin over the AUC of PIT in the absence of a NAFLD-inducer and silymarin (i.e., control diet and vehicle).
Statistical Analysis
Statistical analyses were conducted using GraphPad Prism (v 9.3.1; San Diego, CA). The nonparametric Kruskal–Wallis analysis was used with a Dunn’s post-test for multiple comparisons for all AUC analyses in diet-induced NAFLD models. The nonparametric Mann–Whitney t test was used for all AUC analyses in the tunicamycin-induced NAFLD model and all sex-based differences comparing only a single variable. The nonparametric unpaired two-way ANOVA test with Sidak’s post-test for multiple comparisons was used for AUC analyses in the multifactorial (silymarin and HFHF diet) pharmacokinetic study. Statistical analyses of diet-only and tunicamycin quantitative polymerase chain reaction, OATP1B3 protein expression, PIT Cmax, PIT tmax, and PIT t1/2 data used a parametric one-way ANOVA with Dunnett’s post-test for multiple comparisons when more than two groups were considered and the Student’s t test when only two groups were considered. Parametric unpaired two-way ANOVA tests with Sidak’s post-test for multiple comparisons were used for Cmax, tmax, and t1/2 analyses in the multifactorial (silymarin and HFHF diet) pharmacokinetic study. A single, double, triple, or quadruple symbol (*, #, $) indicates a P value of ≤ 0.05, 0.01, 0.001, or 0.0001, respectively.
Results
Histopathology Scoring
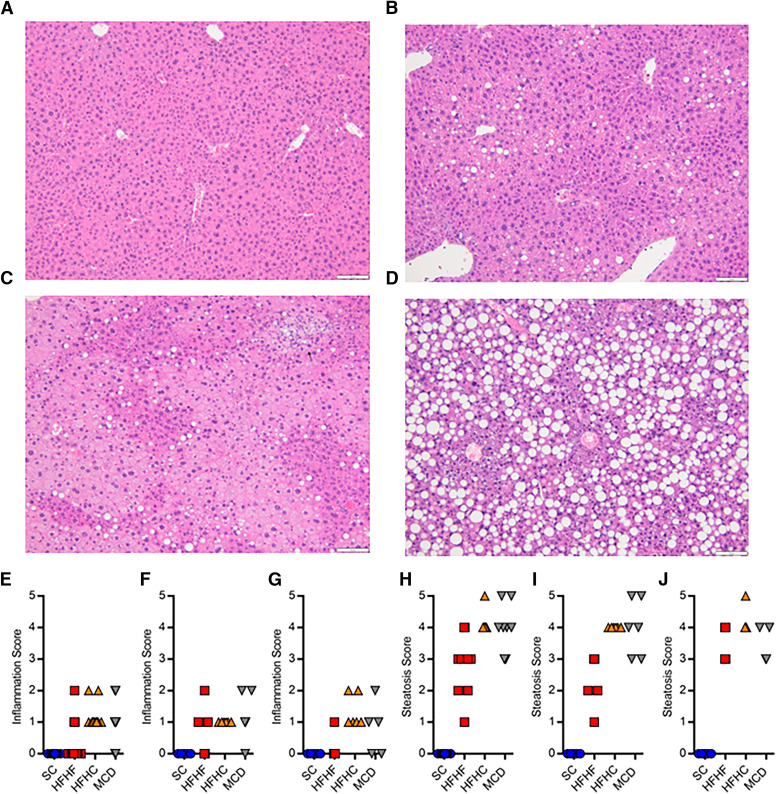
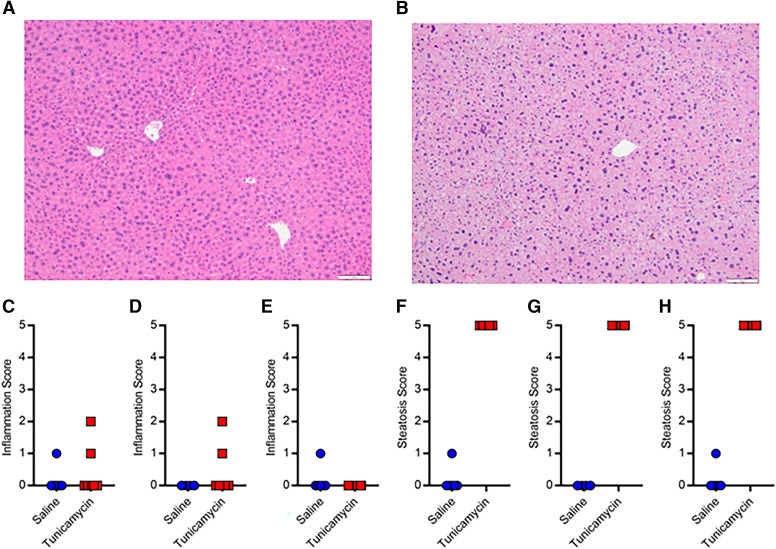
Histopathology scoring of H&E stained liver samples was completed by a board-certified veterinary pathologist (Fig. 1, A–D; Fig. 2, A and B). Inflammation caused by the NAFLD diets ranged from none to mild (Fig. 1, E–G). No major differences in inflammation were apparent between diets or sexes. Steatosis caused by the NAFLD diets ranged from minimal to severe (Fig. 1 H–J). Male HFHF mice appeared to have less steatosis compared with the other diet groups (scores 1–3 versus 3–5). Inflammation caused by tunicamycin ranged from none to mild (Fig. 2, C–E), while steatosis was primarily microvesicular in nature and scored exclusively as severe (Fig. 2, F–H). No major differences in inflammation or steatosis after tunicamycin treatment were apparent between sexes.
Fig. 1.
Representative H&E liver histology for SC (A), HFHF (B), HFHC (C), and MCD (D) mice. Inflammation scores in OATP1B mice fed a SC, HFHF, HFHC, or MCD diet in both sexes (E, n = 12), males (F, n = 6), and females (G, n = 6). Steatosis scores in OATP1B mice fed a SC, HFHF, HFHC, or MCD diet in both sexes (H), males (I), and females (J).
Fig. 2.
Representative H&E liver histology for saline (A) and tunicamycin (B) treated mice. Inflammation scores in OATP1B mice administered saline or tunicamycin in both sexes (C, n = 12), males (D, n = 6), and females (E, n = 6). Steatosis scores in OATP1B mice administered saline or tunicamycin in both sexes (F), males (G), and females (H).
SLCO1B1 and SLCO1B3 mRNA Expression
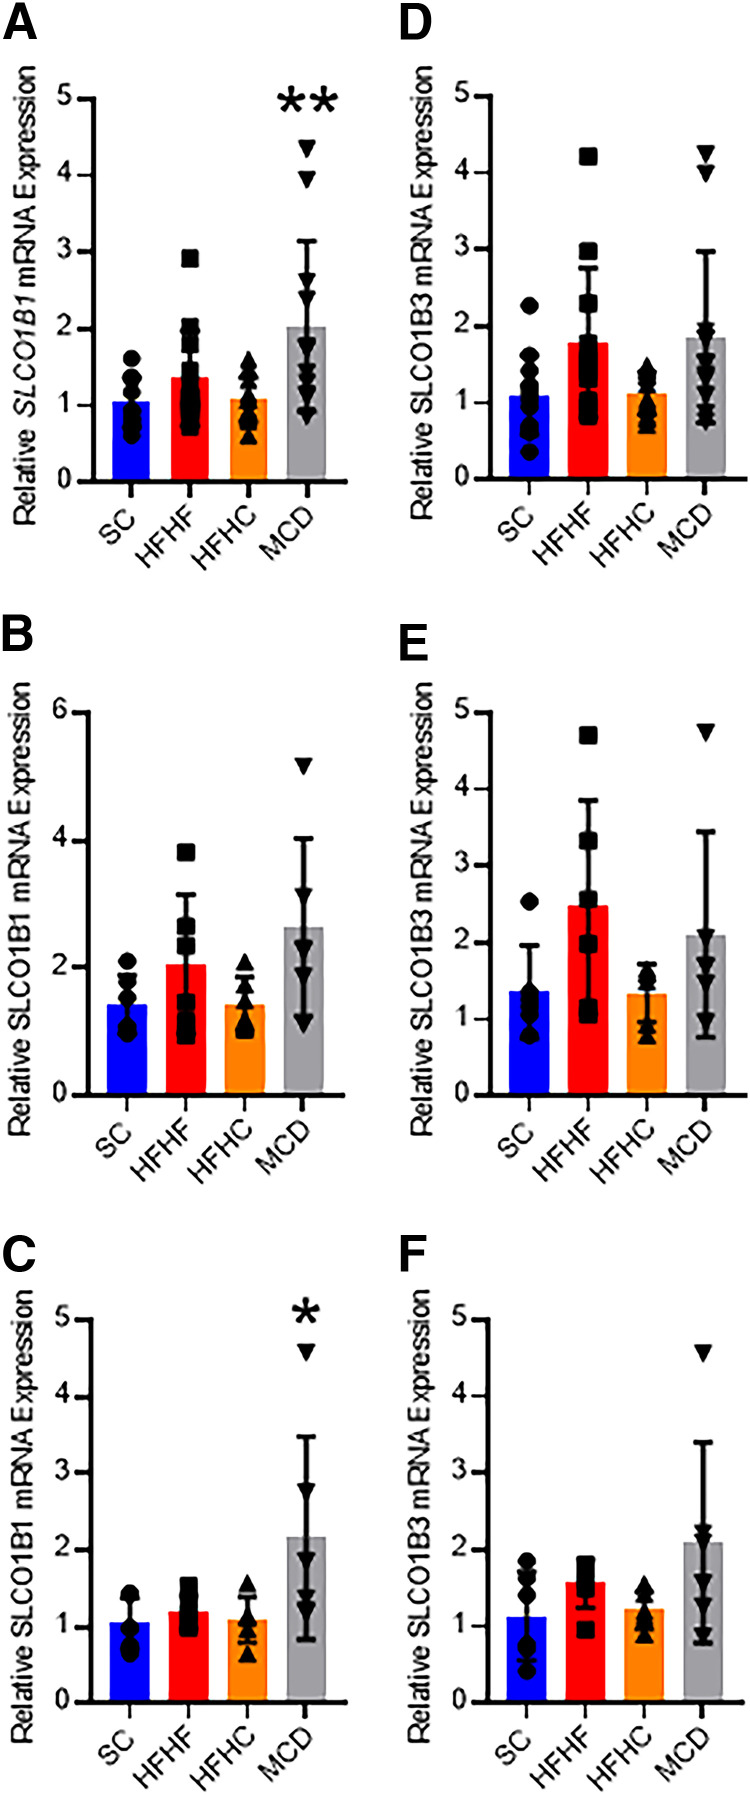
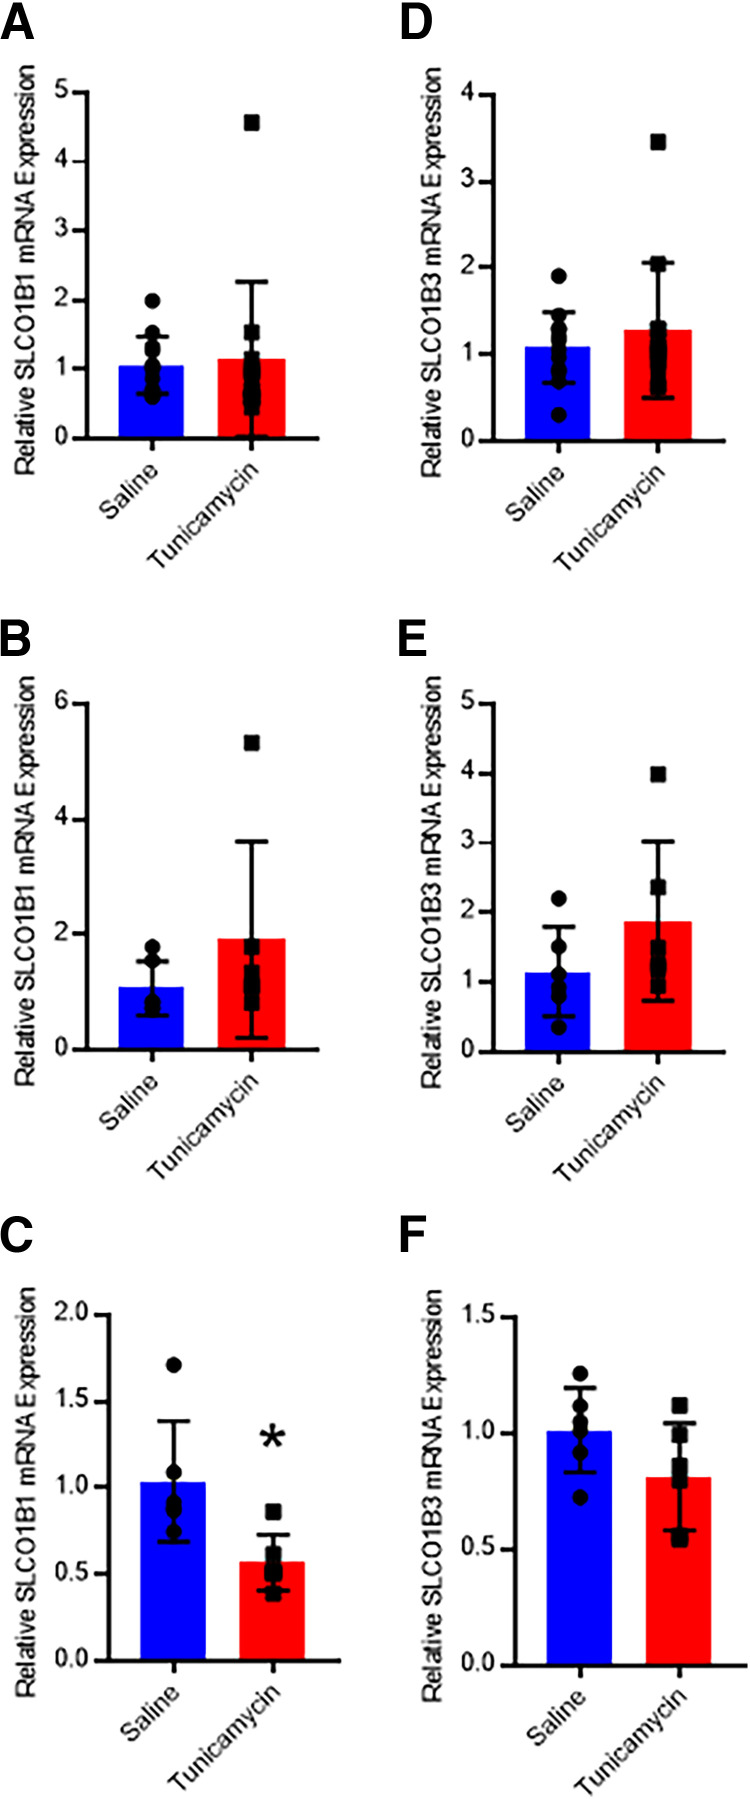
Hepatic SLCO1B1 and SLCO1B3 mRNA expression was quantified using real-time quantitative polymerase chain reaction. Expression of SLCO1B1 mRNA was 1.95-fold higher in the MCD mice when both sexes were considered (Fig. 3A). Male MCD mice exhibited no difference in SLCO1B1 expression (Fig. 3B), whereas female MCD mice had a 2.07-fold increase in expression (Fig. 3C). No other diets elicited changes in SLCO1B1 or SLCO1B3 mRNA expression. When both sexes were considered, gene expression of the transporters was not affected by the administration of tunicamycin compared with saline (Fig. 4, A and C). While no tunicamycin-induced differences were observed in male mice (Fig. 4, B and D), tunicamycin decreased SLCO1B1 mRNA expression 45% in the female mice (Fig. 4, C and F), although there was greater variability in expression in the male mice.
Fig. 3.
SLCO1B1 mRNA qRT-PCR analysis for SC, HFHF, HFHC, or MCD mice in both sexes (A, n = 12), males (B, n = 6), and females (C,n = 6). SLCO1B3 mRNA qRT-PCR analysis for SC, HFHF, HFHC, or MCD mice in both sexes (D, n = 12), males (E, n = 6), and females (F, n = 6). Bar height and error bars represent arithmetic mean and standard deviation, respectively. One-way ANOVA with Dunnet’s post-test for multiple comparisons: * P < 0.05 or ** P < 0.01. qRT-PCR, real time quantitative polymerase chain reaction.
Fig. 4.
SLCO1B1 mRNA qRT-PCR analysis for mice administered saline or tunicamycin in both sexes (A, n = 12), males (B, n = 6), and females (C, n = 6). SLCO1B3 mRNA qRT-PCR analysis for mice administered saline or tunicamycin in both sexes (D, n = 12), males (E, n = 6), and females (F, n = 6). Bar height and error bars represent arithmetic mean and standard deviation, respectively. Student’s t test: * P < 0.05. qRT-PCR, real time quantitative polymerase chain reaction.
Western Blots
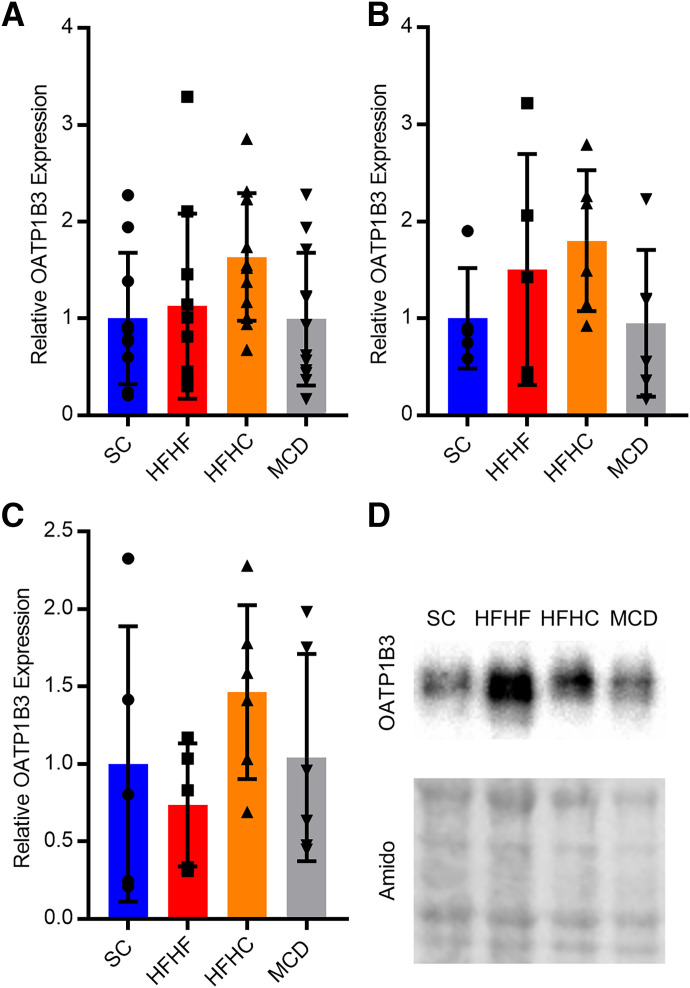
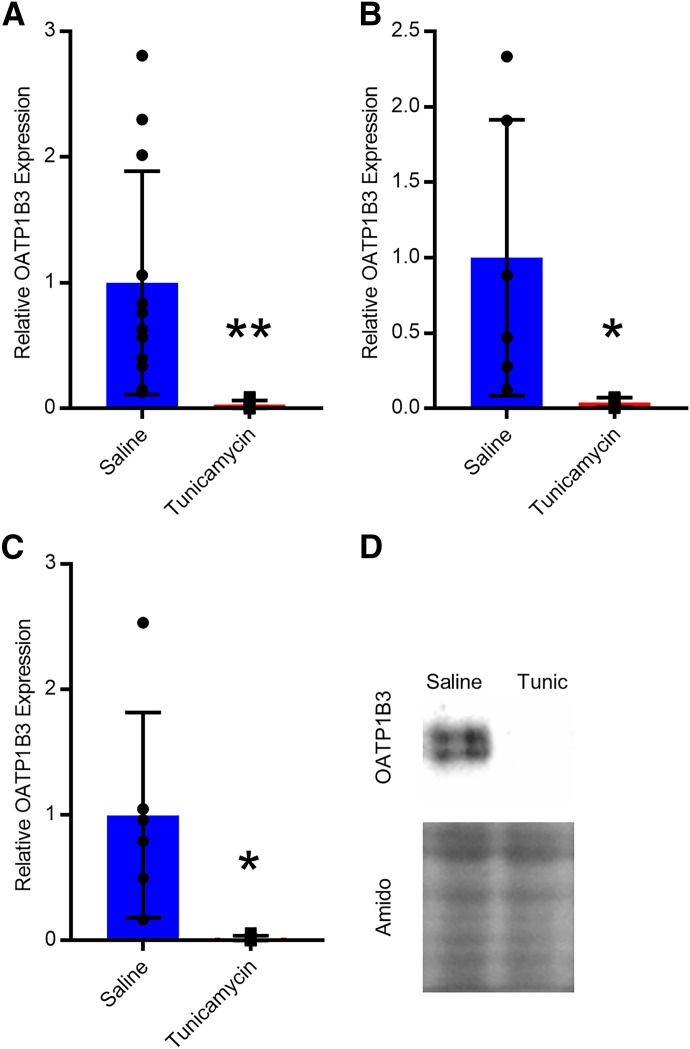
Hepatic OATP1B3 protein expression was determined using Western blots. When sexes were considered together or separately, no changes in OATP1B3 protein expression were observed in HFHF, HFHC, or MCD mice (Fig. 5, A–C). When both sexes were considered, tunicamycin decreased OATP1B3 protein expression 97% (Fig. 6A). OATP1B3 protein expression was reduced by 96% in male mice and 98% in female mice (Fig. 6, B and C). Several different OATP1B1 antibodies were purchased, and extensive optimization was performed, but blots were either blank or produced nonspecific binding from 65 to 110 kDa, which is the expected molecular weight range for OATP1B1.
Fig. 5.
Relative protein expression of OATP1B3 in SC, HFHF, HFHC, or MCD mice in both sexes (A, n = 12), males (B, n = 6), and females (C, n = 6). Protein expression was normalized to amido black total protein staining for each sample and represented relative to SC. A representative Western blot for OATP1B3 and amido black staining in a male mouse (D). Bar height and error bars represent arithmetic mean and standard deviation, respectively.
Fig. 6.
Relative protein expression of OATP1B3 in mice administered saline or tunicamycin in both sexes (A, n = 12), males (B, n = 6), and females (C, n = 6). Protein expression was normalized to amido black total protein staining for each sample and represented relative to saline. A representative Western blot for OATP1B3 and amido black staining in male saline and tunicamycin mice (D). Bar height and error bars represent arithmetic mean and standard deviation, respectively. Student’s t test: * P < 0.05 or ** P < 0.01.
Pharmacokinetic Analyses
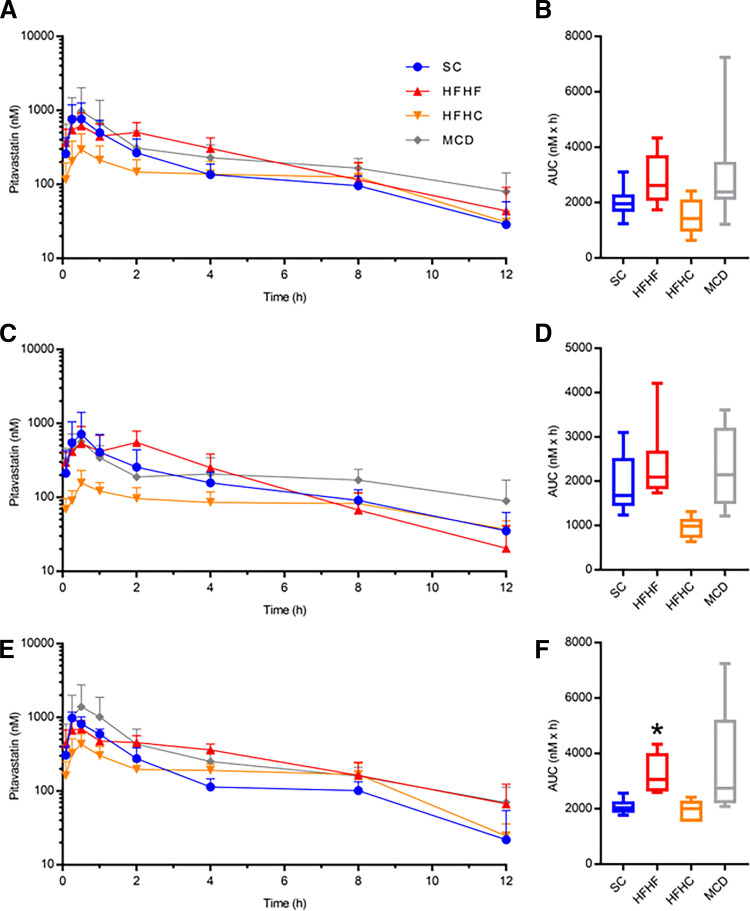
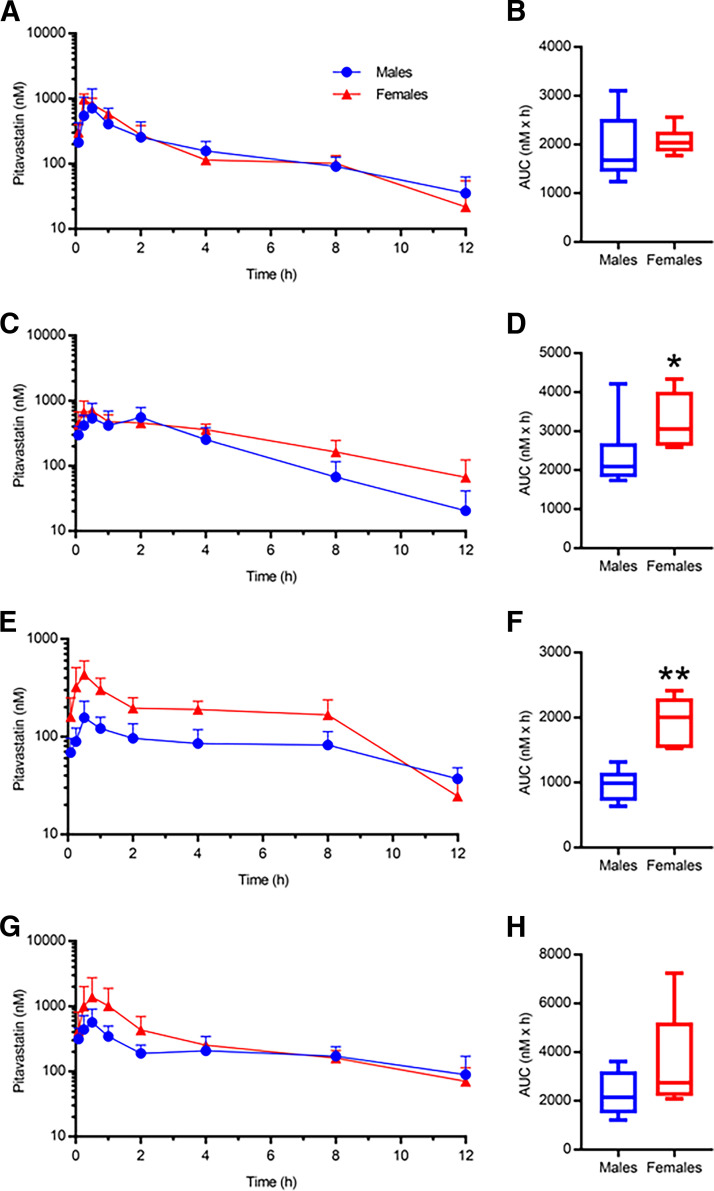
Oral pharmacokinetic analyses of the canonical OATP1B probe substrate PIT were completed in humanized OATP1B mice. Table 1 summarizes the PIT pharmacokinetic data for SC, HFHF, HFHC, and MCD mice. When both sexes were considered, the HFHF and MCD mice showed a nonsignificant increase in PIT AUC (AUCR 1.38 and 1.30, respectively), and the HFHC mice showed a nonsignificant decrease (AUCR 0.65) compared with the SC mice (Fig. 7A and B). When the data were stratified by sex, males showed no significant differences between the diet groups; however, the HFHF females exhibited a 1.55-fold higher PIT AUC compared with the SC females (Fig. 7, C–F). When the data were stratified by diet, HFHF females had a 1.42-fold higher PIT AUC than HFHF males and HFHC females had a 2.21-fold higher PIT AUC compared with HFHC males (Fig. 8). No changes in Cmax, tmax, or t1/2 were observed in any diet when sexes were considered together or separately (Table 1).
TABLE 1.
Summary of PIT pharmacokinetic changes in male and female OATP1B mice fed a SC, HFHF, HFHC, or MCD diet for 16 weeks (6 weeks for MCD diet)
| Pitavastatin | |||||
|---|---|---|---|---|---|
| SC | HFHF | HFHC | MCD | ||
| AUC0-12h | All | 1.94 (1.71-2.21) | 2.68 (2.28-3.16) | 1.27 (1.01-1.67) | 2.52 (1.89-3.35) |
| (µM × h) | Male | 1.83 (1.40-2.41) | 2.25 (1.73-2.93) | 0.87 (0.67-1.13) | 3.24 (2.18-4.81) |
| Female | 2.06 (1.86-2.29) | 3.20 (2.70-3.81) # $ | 1.92 (1.63-2.28) ## | 3.24 (2.18-4.81) | |
| Cmax | All | 857 (500) | 750 (237) | 300 (188) | 1004 (1029) |
| (nM) | Male | 732 (689) | 708 (260) | 162 (67) | 569 (336) |
| Female | 983 (190) | 793 (228) | 438 (168) | 1438 (1328) | |
| tmax | All | 0.38 (0.25-1.0) | 0.5 (0.08-2.0) | 0.5 (0.25-2.0) | 0.5 (0.25-1.0) |
| (h) | Male | 0.5 (0.25-0.5) | 1.25 (0.08-2.0) | 0.5 (0.5-2.0) | 0.5 (0.25-0.5) |
| Female | 0.25 (0.25-1.0) | 0.38 (0.25-2.0) | 0.5 (0.25-0.5) | 0.5 (0.25-1.0) | |
| t1/2 | All | 3.5 (2.2) | 2.7 (1.3) | 5.7 (4.3) | 5.1 (2.6) |
| (h) | Male | 4.2 (2.5) | 2.1 (0.6) | 8.8 (5.0) | 5.8 (3.2) |
| Female | 2.7 (1.8) | 3.3 (1.5) | 3.2 (0.9) | 4.5 (1.9) | |
# represents comparison with males of the same diet group and $ represents comparison with SC of the same sex. A single or double symbol (#, $) indicates a P value of ≤ 0.05 or 0.01, respectively. AUC represents geometric mean (upper and lower 90% confidence interval). Cmax and t1/2 represent arithmetic mean (SD), and tmax represents median (range).
Fig. 7.
PIT plasma concentration-time profiles for SC, HFHF, HFHC, MCD mice in both sexes (A, n = 12) with corresponding PIT AUC data (B). PIT plasma concentration-time profiles and corresponding PIT AUCs for male (C and D, n = 6) and female (E and F, n = 6) mice. For box and whisker plots, the box extends to the 25th and 75th percentiles with the median represented as the horizontal line, and the whiskers represent the 90% confidence interval. Kruskall–Wallis test with Dunn’s post-test for multiple comparisons: * P ≤ 0.05.
Fig. 8.
Male (n = 6) and female (n = 6) PIT plasma concentration-time profiles and corresponding PIT AUC data for SC (A and B), HFHF (C and D), HFHC (E and F), or MCD (G and H) mice. For box and whisker plots, the box extends to the 25th and 75th percentiles with the median represented as the horizontal line, and the whiskers represent the 90% confidence interval. Unpaired Mann–Whitney t test: * P ≤ 0.05 or ** P ≤ 0.01.
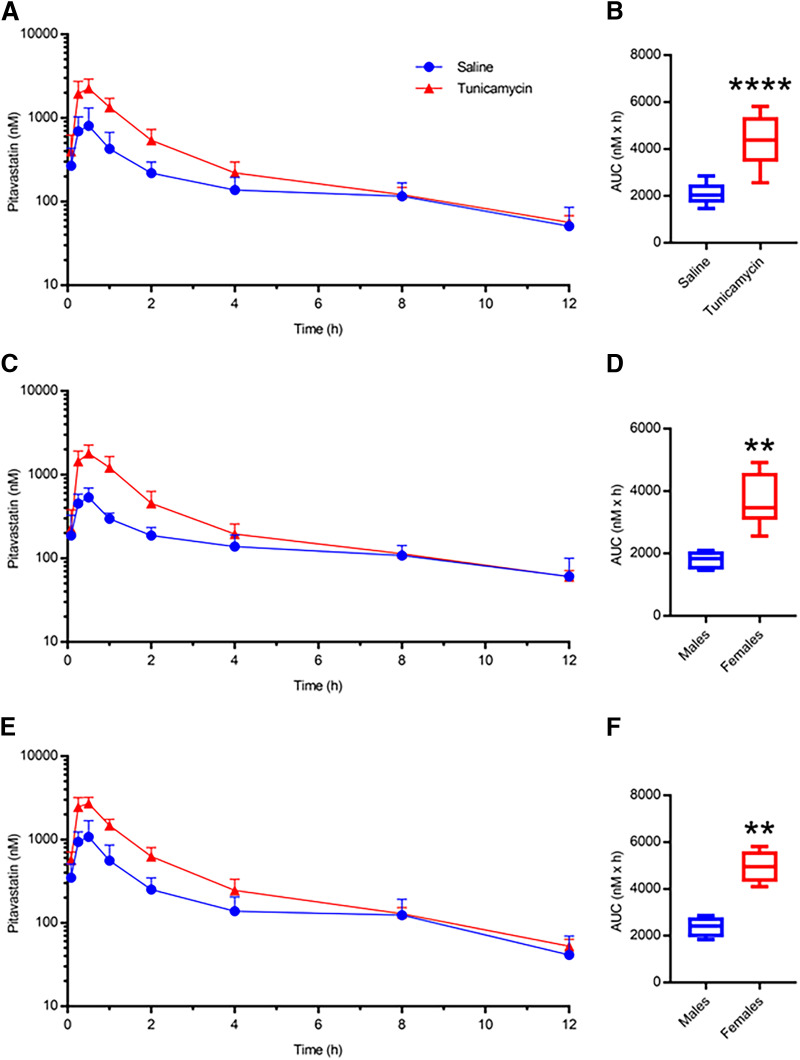
PIT pharmacokinetic data for OATP1B mice administered saline or tunicamycin are summarized in Table 2. When both sexes were considered, tunicamycin-induced fatty liver caused a 2.06-fold increase in PIT AUC compared with the saline mice (Fig. 9, A and B). Male and female mice demonstrated similar PIT AUC changes compared with their respective saline group (2.03-fold and 2.10-fold, respectively) (Fig. 9, C–F). PIT Cmax increased 2.67-fold in tunicamycin mice when both sexes were considered. Males administered tunicamycin exhibited a larger increase (3.39-fold) in PIT Cmax than females (2.35-fold) when compared with saline-treated mice of the same sex. When sexes were considered together or separately, tunicamycin did not result in any changes in PIT tmax or t1/2 (Table 2). The lactone form of PIT in all diet and chemical treatment groups was not detectable at all time points, and, when detected, the exposure was negligible (0.5%–1.3%) relative to the PIT AUC in the OATP1B mouse plasma, thus further analysis on the PIT lactone pharmacokinetics was not completed.
TABLE 2.
Summary of PIT pharmacokinetic changes in male and female OATP1B mice administered saline or tunicamycin
| Pitavastatin | |||
|---|---|---|---|
| Saline | Tunicamycin | ||
| AUC0-12h | All | 2.04 (1.82-2.29) | 4.21 (3.70-4.79) **** |
| (µM x h) | Male | 1.78 (1.55-2.03) | 3.61 (2.98-4.38) $$ |
| Female | 2.34 (2.02-2.72) | 4.91 (4.34-5.57) $$ | |
| Cmax | All | 875 (541) | 2336 (718) **** |
| (nM) | Male | 542 (161) | 1837 (471) $$$$ |
| Female | 1206 (594) | 2835 (562) $$$ | |
| tmax | All | 0.5 | 0.5 (0.25-0.5) |
| (h) | Male | 0.5 | 0.5 |
| Female | 0.38 (0.25-0.5) | 0.5 (0.25-0.5) | |
| t1/2 | All | 4.9 (2.5) | 4.4 (1.2) |
| (h) | Male | 6.2 (3.0) | 5.0 (1.0) |
| Female | 3.5 (0.8) | 3.9 (1.3) | |
* represent comparisons to saline in all sexes and $ represents comparison with saline of the same sex. A double, triple, or quadruple symbol (*, $) indicates a P value of ≤ 0.01, 0.001, or 0.0001, respectively. AUC represents geometric mean (upper and lower 90% confidence interval). Cmax and t1/2 represent arithmetic mean (SD), and tmax represents median (range).
Fig. 9.
PIT plasma concentration-time profiles for mice administered saline or tunicamycin in both sexes (A, n = 12) and corresponding PIT AUC data (B). PIT plasma concentration-time profiles and corresponding PIT AUCs for male (C and D, n = 6) and female (E and F, n = 6) mice. For box and whisker plots, the box extends to the 25th and 75th percentiles with the median represented as the horizontal line, and the whiskers represent the 90% confidence interval. Unpaired Mann–Whitney t test: ** P ≤ 0.01 or **** P ≤ 0.0001.
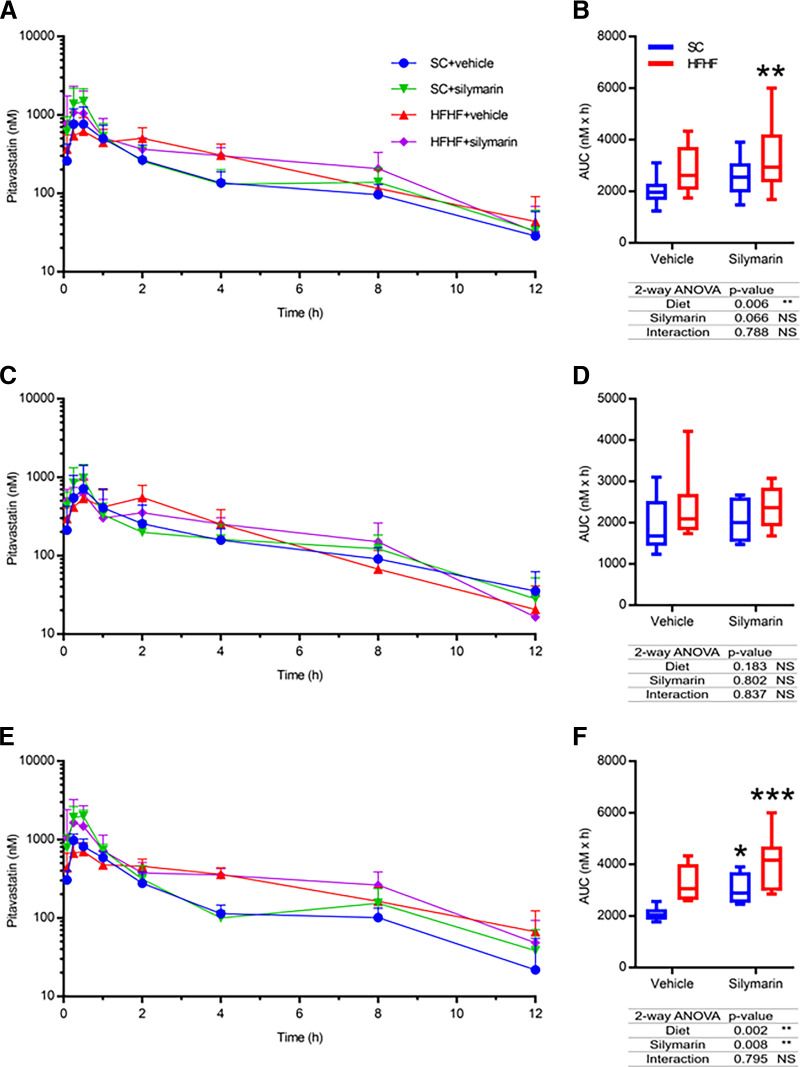
PIT pharmacokinetic data for the multifactorial study are summarized in Table 3. Mice were separated into four groups: 1) mice fed a SC diet and administered vehicle (SC + vehicle), 2) mice fed a SC diet and administered silymarin (SC + silymarin), 3) mice fed a HFHF diet and administered vehicle (HFHF + vehicle), or 4) mice fed a HFHF diet and administered silymarin (HFHF + silymarin). When both sexes were considered together, neither silymarin nor the HFHF diet alone changed PIT AUC based on the post-test analysis (i.e., Dunnet’s post-test P value > 0.05), although the overall two-way ANOVA P value for diet was 0.006 (Fig. 10, A and B). The multifactorial HFHF + silymarin group increased PIT AUC 1.49-fold compared with the SC + vehicle group (Fig. 10, A and B). When only males were considered, neither the individual diet or silymarin factors nor the combination of the two factors caused a significant change in PIT AUC (Fig. 10, C and D). However, females exhibited an increase in PIT AUC in both the HFHF + vehicle group (AUCR 1.55) and the HFHF + silymarin group (AUCR 1.88) compared with the female SC + vehicle group (Fig. 10, E and F). The two-way ANOVA interaction P value was not significant (> 0.05) in all instances. Similarly, HFHF + silymarin females exhibited a nonsignificant 2.31-fold higher PIT Cmax than males of the same group and a nonsignificant 1.76-fold higher Cmax than the female SC + vehicle mice using a two-way ANOVA. No changes in PIT tmax or t1/2 were observed in any treatment group when sexes were considered together or separately (Table 3).
TABLE 3.
Summary of PIT pharmacokinetic changes in male and female OATP1B mice administered vehicle or silymarin after being fed a SC or HFHF diet for 16 weeks
| Pitavastatin | |||||
|---|---|---|---|---|---|
| Vehicle | Silymarin | ||||
| SC | HFHF | SC | HFHF | ||
| AUC0-12h | All | 1.94 (1.71-2.21) | 2.68 (2.28-3.16) | 2.45 (2.09-2.86) | 2.90 (2.34-3.61) ** |
| (µM x h) | Male | 1.83 (1.40-2.41) | 2.25 (1.73-2.93) | 2.00 (1.63-2.45) | 2.18 (1.69-2.82) |
| Female | 2.06 (1.86-2.29) | 3.20 (2.70-3.81) | 3.00 (2.54-3.54) $ | 3.87 (3.00-4.98) $$$ | |
| Cmax | All | 857 (500) | 750 (237) | 1589 (765) | 1240 (1206) |
| (nM) | Male | 732 (689) | 708 (260) | 992 (458) | 749 (302) |
| Female | 983 (190) | 793 (228) | 2187 (469) | 1731 (1591) | |
| tmax | All | 0.38 (0.25-1) | 0.5 (0.08-2) | 0.5 (0.25-0.5) | 0.38 (0.08-2) |
| (h) | Male | 0.5 (0.25-0.5) | 1.25 (0.08-2) | 0.5 (0.25-0.5) | 0.38 (0.08-0.5) |
| Female | 0.25 (0.25-1) | 0.38 (0.25-2) | 0.5 (0.25-0.5) | 0.38 (0.25-2) | |
| t1/2 | All | 3.5 (2.2) | 2.7 (1.3) | 3.2 (1.3) | 2.5 (0.8) |
| (h) | Male | 4.2 (2.5) | 2.1 (0.6) | 3.2 (1.3) | 2.3 (0.9) |
| Female | 2.7 (1.8) | 3.3 (1.5) | 3.2 (1.4) | 2.7 (0.7) | |
* represent comparisons to SC + vehicle group in all sexes and $ represents comparison with SC + vehicle group of the same sex. A single, double, or triple symbol (*, $) indicates a P value of ≤ 0.05, 0.01, or 0.001, respectively. AUC represents geometric mean (upper and lower 90% confidence interval). Cmax and t1/2 represent arithmetic mean (SD), and tmax represents median (range).
Fig. 10.
PIT plasma concentration-time profiles for SC and HFHF mice orally administered vehicle or silymarin (A, n = 12) with corresponding PIT AUC data (B). PIT plasma concentration-time profiles and corresponding PIT AUCs for male (C and D, n = 6) and female (E and F, n = 6) SC and HFHF mice orally administered vehicle or silymarin with corresponding PIT AUC data. For box and whisker plots, the box extends to the 25th and 75th percentiles with the median represented as the horizontal line, and the whiskers represent the 90% confidence interval. Statistical test for AUCs of all diet groups used the nonparametric unpaired two-way ANOVA. * P ≤ 0.05; ** P ≤ 0.01; *** P ≤ 0.001.
Discussion
NAFLD patients may be at risk for single or multifactorial pharmacokinetic interactions involving hepatic OATPs. A robust preclinical model would allow for safe and efficient prediction of transporter-mediated pharmacokinetic interactions in these patients. Multiple approaches have been taken to model NAFLD in rodents. These include diet-, chemical-, and/or genetic-induced approaches. The research presented here investigated various diet- and chemical-induced models of NAFLD in the humanized OATP1B mice. Our data indicate NAFLD model- and sex-dependent effects on the pharmacokinetics of PIT, a canonical OATP1B probe substrate.
Common dietary approaches to model NAFLD include high amounts of fat, carbohydrates, and/or cholesterol. Alternatively, diets deficient or low in specific nutrients, such as methionine and choline, are also common. Many different iterations of these diets have been investigated, and each produce varying degrees of specific features of NAFLD pathology (Martin-Grau et al., 2022). High-fat diets in mice are reported to induce steatosis and some inflammation and increase the liver damage biomarkers alanine transaminase (ALT) and aspartate transaminase, which are common features in NAFLD patients (Kubota et al., 2013). However, severity of NAFLD from the high-fat diet alone is relatively low, and outcomes are variable between mouse strains (Kubota et al., 2013; Farrell et al., 2014). Similarly, high-fructose diets in mice exhibit variability between strains and also show low NAFLD pathology severity, as evident by mild increases in inflammation, hepatocyte ballooning, and ALT and aspartate transaminase levels (Charlton et al., 2011; Nigro et al., 2017; Savari et al., 2019). The use of a high-fat diet with high-fructose drinking water (i.e., HFHF) creates a more severe NAFLD pathology more closely resembling NASH (Kim et al., 2017). Similarly, the combination of high fat and high cholesterol in the diet (i.e., HFHC) synergistically induces a NASH-like pathology in mice, with the mice exhibiting greater steatosis, inflammation, and ALT levels (Savard et al., 2013). In our study, 16 weeks of HFHF or HFHC diets produced mild levels of inflammation and minimal to severe levels of steatosis, which is consistent with previous reports for these diets and demonstrates NAFLD development in the OATP1B humanized mice. MCD diets are known to rapidly induce severe NAFLD pathology, but they fail to replicate the metabolic perturbations associated with the disease in humans (Rinella and Green, 2004). For example, cachexia and little to no insulin resistance are reported with the MCD diets in mice and rats, which stands in stark contrast with clinical features associated with NAFLD (i.e., central obesity and diabetes) (Rinella and Green, 2004). Consistent with these observations, the MCD mice in our study demonstrated cachexia, mild inflammation, and moderate to severe steatosis. Sex differences in the prevalence and/or severity of NAFLD have been reported in patients and in rodent models, with males exhibiting a higher prevalence and/or severity compared with females (Lonardo et al., 2019; Chella Krishnan et al., 2021). We did not observe differences in NAFLD severity between the male and female OATP1B mice. Testosterone-mediated upregulation of liver pyruvate kinase has been implicated for the sex differences in both humans and mice (Chella Krishnan et al., 2021). It is noteworthy that male OATP1B mice lose fertility at a relatively young age, though the underlying cause is not yet known. It is possible that factors causing reduced fertility, such as lower testosterone, may also contribute to lack of differences between male and female mice in our study. Collectively, these pathology data in the three diets indicate the presence of NAFLD in the humanized OATP1B mice.
Chemical-induced approaches to model NAFLD attempt to rapidly reproduce specific pathologic features of NAFLD, such as inflammation, steatosis, and fibrosis. Similar to the MCD diet, a limitation of these chemical approaches is the inability to reproduce metabolic features of NAFLD (Martin-Grau et al., 2022). We selected tunicamycin treatment because it produces a NASH-like phenotype and causes ER stress, which occurs in NAFLD and may be related to changes in OATP1B expression. We observed minimal inflammation and severe microvesicular steatosis in the humanized OATP1B mice 60 hours after tunicamycin treatment. Compared with what we observed in the diet-induced models, the amount of inflammation was lower, while the amount of steatosis was higher. These pathology data indicate the presence of a NAFLD-like phenotype in the tunicamycin OATP1B humanized mice.
In addition to pathology, changes in hepatic transporter expression and function are another important feature of NAFLD. Transporter function is controlled through transcription, translation, post-translational modifications, and membrane trafficking, and previous data indicate NASH alters each of these processes (Clarke et al., 2014, 2017; Dzierlenga et al., 2016; Vildhede et al., 2020). Regarding mRNA, previous data reported expression of mouse Slco1b2 and human SLCO1B3 was downregulated in MCD mice and NASH patients, whereas an HFHC diet did not change Slco1b2 expression (Canet et al., 2014). In contrast to SLCO1B3, the expression of SLCO1B1 did not change in NASH patients. The Slco1b2 data mentioned previously were generated in wild-type mice where Slco1b2 is under transcriptional control of native mouse promoters. The humanized OATP1B mice have the SLCO1B1 and SLCO1B3 genes randomly inserted at multiple locations in the mouse genome, and they are under transcriptional control of the liver-specific ApoE promoter (van de Steeg et al., 2009, 2012). Therefore, if the mechanism of decreased transporter mRNA expression is dependent on association with a specific promoter or the gene’s location in the genome [e.g., epigenetics factors (Hardy et al., 2017)], then NAFLD-specific effects may not occur in the humanized OATP1B mice. The only changes in SLCO1B mRNA expression we observed across all NAFLD groups were increased SLCO1B1 expression in the female MCD mice and decreased SLCO1B1 expression in female tunicamycin mice. The tunicamycin effects in female mice may be related to reported tunicamycin-elicited changes in transcription factor activity (i.e., ATF4, ATF6, XBP, NFkB, CHOP, AP1, NFAT, TCF/LEF, and PXR) (Jiang et al., 2016). In fact, it has been reported that upregulation of NFkB decreased expression of ApoE via interaction with the ApoE promoter (Trusca et al., 2016). Thus, it is possible that tunicamycin may perturb SLCO1B expression in the OATP1B mice by modulating transcription factors associated with ApoE promoter, such as NFkB. However, it is not clear why this effect was only observed in female OATP1B mice and only SLCO1B1. Overall, these data contrasts with data in NASH patients, indicating the NAFLD models tested in the humanized OATP1B mice do not consistently recapitulate SLCO1B mRNA changes.
OATP1B protein and glycosylation are both reported to decrease in NASH patients but not in individuals exhibiting steatosis only (Clarke et al., 2017; Vildhede et al., 2020). Several aspects of our models attempted to reproduce the potential pathologic mechanisms for altered OATP function. Previously published literature has shown steatosis alone does not decrease OATP1B1 and OATP1B3 protein abundance or glycosylation, and decreases are only achieved once pathology advances to NASH (Vildhede et al., 2020). These data indicate inflammation, or a component of its molecular pathway, may play an integral role in the NASH-mediated decrease in OATP1B expression and/or glycosylation. The NAFLD models used here produced robust steatosis but only mild inflammation, which may be insufficient to alter OATP1B protein and glycosylation through this mechanism likely due to the lack of severity of the disease state as indicated by mild inflammation scores. Accordingly, we observed no change in OATP1B3 expression in either the HFHF, HFHC, or MCD mice. Another important mechanism that may contribute to OATP1B protein and glycosylation changes is N-linked glycosylation. Lack of protein glycosylation typically results in reduced membrane localization and decreased overall protein levels due to protein degradation and decreased translation initiation (Guha et al., 2017). Thus, we selected tunicamycin because it induces ER stress and the unfolded protein response through inhibition of N-linked glycosylation, which represents a clinically relevant mechanism for altered OATP1B expression observed in NASH patients. Indeed, we observed a substantial decrease in overall OATP1B3 protein levels with tunicamycin treatment. In summary, the NAFLD diets did not produce changes in OATP1B3 protein, whereas the tunicamycin NAFLD model recapitulated the protein abundance and glycosylation changes observed in NASH patients.
PIT is an accepted probe drug to assess hepatic OATP1B function in patients, making it a reliable substrate to determine pharmacokinetic effects of the NAFLD models in humanized OATP1B mice. The only diet-induced changes in PIT pharmacokinetics we observed was increased PIT exposure in female HFHF mice. No clear changes in SLCO1B1, SLCO1B3, or OATP1B3 appear to contribute to this altered pharmacokinetics. As stated in the results section, we were not able to determine OATP1B1 expression; thus it is not clear whether altered expression of that transporter contributed to the observed pharmacokinetic effect. It is possible that disease severity (e.g., inflammation, impaired hepatic blood flow, etc.) may have been insufficient to cause a robust phenotype to alter transporter expression or PIT pharmacokinetics. On the other hand, as discussed previously, the incongruent regulation of SLCO1B expression in the humanized strain may preclude diet-induced changes in transporter expression. Unlike the diets, tunicamycin decreased OATP1B3 expression with a corresponding increase in PIT exposure, indicating this model may be suited to predict transporter-mediated pharmacokinetic changes in NASH patients. Previous data demonstrated OATP1B1 and OATP1B3 protein expression and function in the dual humanized mice (Salphati et al., 2014; Mir et al., 2019), but, to date, a majority of the published data for humanized OATP1B mice has been completed in single humanized mice (i.e., OATP1B1 or OATP1B3) rather than dual humanized mice (i.e., OATP1B1 and OATP1B3) (Higgins et al., 2014; Salphati et al., 2014). Additionally, pharmacokinetic data from our laboratory demonstrated functionality of the dual humanized model by testing four OATP1B substrates (PIT, pravastatin, coproporphyrin-I, and coproporphyrin-III) in the FVB wild-type and dual humanized OATP1B mice in the presence and absence of rifampin-mediated OATP1B inhibition (data not shown).
NAFLD patients experience polypharmacy as a result of multiple comorbidities and are potential targets for botanical dietary supplement use due to lack of efficacious pharmacological treatments for NAFLD. As stated earlier, NASH patients also have decreased OATP1B expression. While each of these factors alone may not precipitate pharmacokinetic interactions, two or more of these factors may have a larger, combined effect on drug disposition. Previous rodent data indicate diet-induced NASH and silymarin had an additive effect on PIT disposition (Montonye et al., 2019). We observed a similar multifactorial pharmacokinetic effect in the OATP1B mice with the HFHF diet and silymarin, although the female OATP1B mice were more sensitive models to diet- and natural product-mediated pharmacokinetic interaction than males. This multifactorial interaction has not been tested in NASH patients; therefore, clinical data need to be collected before a robust clinical recommendation can be made.
In conclusion, our data indicate the humanized OATP1B mice may not be appropriate with models predicated on transcriptional regulation of the SLCO1B transporters. However, these mice are more appropriate for models with mechanisms related to protein regulation (e.g., translation, turnover, glycosylation, etc.). We found that tunicamycin caused this type of protein dysregulation and altered OATP substrate disposition, suggesting it may be an appropriate preclinical model for pharmacokinetics in NASH, and future multifactorial study designs may benefit from a drug-induced NAFLD model like tunicamycin. In addition, the HFHF females reproduced the clinical observation that OATP1B substrate exposure is higher in NASH patients (Ali et al., 2017), although the mechanism in mice is unclear and a greater sample size may be required due to a small effect size. Combining the HFHF diet with an OATP1B inhibitor (e.g., silymarin) increases the risk of altered pharmacokinetics. Overall, this transgenic humanized mouse model should be used judiciously to carefully model relevant mechanisms of transporter and pharmacokinetic changes.
Acknowledgments
The OATP1B3 Western blot antibody was graciously gifted by Bruno Hagenbuch.
Data Availability
The authors declare that all the data supporting the findings of this study are contained within the paper.
Abbreviations
- ALT
alanine transaminase
- AUC
area under the concentration-time curve
- AUCR
area under the concentration-time curve ratio
- ER
endoplasmic reticulum
- HFHC
high fat-high cholesterol
- HFHF
high fat-high fructose
- MCD
methionine and choline deficient
- LC-MS/MS
liquid chromatography tandem mass spectrometer
- NAFLD
nonalcoholic fatty liver disease
- NASH
nonalcoholic steatohepatitis
- Oatp OATP
organic anion transporting polypeptide
- PIT
pitavastatin
- SLCO Slco
solute carrier gene family
- SC
standard chow
- t1/2
terminal half-life
- tmax
time to reach Cmax
Authorship Contributions
Participated in research design: Bechtold, Clarke.
Conducted experiments:Bechtold, Lynch, Oyanna, Call.
Contributed new reagents or analytic tools: Graf, Oberlies.
Performed data analysis: Bechtold, Lynch, White, Clarke.
Wrote or contributed to the writing of the manuscript: Bechtold, Clarke.
Footnotes
This work was funded by National Institutes of Health National Center for Complementary and Integrative Health [Grant R56 AT010650].
N.H.O. and T.N.G. are members of the Scientific Advisory Board of Clue Genetics, Inc. N.H.O. is also a member of the Scientific Advisory Boards of both Mycosynthetix, Inc. and Ionic Pharmaceuticals, LLC.
References
- Ali I, Slizgi JR, Kaullen JD, Ivanovic M, Niemi M, Stewart PW, Barritt AS 4th, Brouwer KLR (2017) Transporter-mediated alterations in patients with NASH increase systemic and hepatic exposure to an OATP and MRP2 substrate. Clin Pharmacol Ther 104:749–756. [DOI] [PMC free article] [PubMed] [Google Scholar]
- Arman T, Baron JA, Lynch KD, White LA, Aldan J, Clarke JD (2021) MCLR-elicited hepatic fibrosis and carcinogenic gene expression changes persist in rats with diet-induced nonalcoholic steatohepatitis through a 4-week recovery period. Toxicology 464:153021. [DOI] [PMC free article] [PubMed] [Google Scholar]
- Banerjee A, Lang J-Y, Hung M-C, Sengupta K, Banerjee SK, Baksi K, Banerjee DK (2011) Unfolded protein response is required in nu/nu mice microvasculature for treating breast tumor with tunicamycin. J Biol Chem 286:29127–29138. [DOI] [PMC free article] [PubMed] [Google Scholar]
- Canet MJ, Hardwick RN, Lake AD, Dzierlenga AL, Clarke JD, Cherrington NJ (2014) Modeling human nonalcoholic steatohepatitis-associated changes in drug transporter expression using experimental rodent models. Drug Metab Dispos 42:586–595. [DOI] [PMC free article] [PubMed] [Google Scholar]
- Charlton M, Krishnan A, Viker K, Sanderson S, Cazanave S, McConico A, Masuoko H, Gores G (2011) Fast food diet mouse: novel small animal model of NASH with ballooning, progressive fibrosis, and high physiological fidelity to the human condition. Am J Physiol Gastrointest Liver Physiol 301:G825–G834. [DOI] [PMC free article] [PubMed] [Google Scholar]
- Chella Krishnan KFloyd RRSabir SJayasekera DWLeon-Mimila PVJones AECortez AAShravah VPéterfy MStiles L, et al. (2021) Liver pyruvate kinase promotes NAFLD/NASH in both mice and humans in a sex-specific manner. Cell Mol Gastroenterol Hepatol 11:389–406. [DOI] [PMC free article] [PubMed] [Google Scholar]
- Clarke JD, Dzierlenga A, Arman T, Toth E, Li H, Lynch KD, Tian DD, Goedken M, Paine MF, Cherrington N (2019) Nonalcoholic fatty liver disease alters microcystin-LR toxicokinetics and acute toxicity. Toxicon 162:1–8. [DOI] [PMC free article] [PubMed] [Google Scholar]
- Clarke JD, Hardwick RN, Lake AD, Lickteig AJ, Goedken MJ, Klaassen CD, Cherrington NJ (2014) Synergistic interaction between genetics and disease on pravastatin disposition. J Hepatol 61:139–147. [DOI] [PMC free article] [PubMed] [Google Scholar]
- Clarke JD, Novak P, Lake AD, Hardwick RN, Cherrington NJ (2017) Impaired N-linked glycosylation of uptake and efflux transporters in human non-alcoholic fatty liver disease. Liver Int 37:1074–1081. [DOI] [PMC free article] [PubMed] [Google Scholar]
- Cotter TG, Rinella M (2020) Nonalcoholic fatty liver disease 2020: the state of the disease. Gastroenterology 158:1851–1864. [DOI] [PubMed] [Google Scholar]
- Davis-Searles PR, Nakanishi Y, Kim N-C, Graf TN, Oberlies NH, Wani MC, Wall ME, Agarwal R, Kroll DJ (2005) Milk thistle and prostate cancer: differential effects of pure flavonolignans from Silybum marianum on antiproliferative end points in human prostate carcinoma cells. Cancer Res 65:4448–4457. [DOI] [PubMed] [Google Scholar]
- Dzierlenga AL, Clarke JD, Cherrington NJ (2016) Nonalcoholic steatohepatitis modulates membrane protein retrieval and insertion processes. Drug Metab Dispos 44:1799–1807. [DOI] [PMC free article] [PubMed] [Google Scholar]
- Farrell GCMridha ARYeh MMArsov TVan Rooyen DMBrooling JNguyen THeydet DDelghingaro-Augusto VNolan CJ, et al. (2014) Strain dependence of diet-induced NASH and liver fibrosis in obese mice is linked to diabetes and inflammatory phenotype. Liver Int 34:1084–1093. [DOI] [PubMed] [Google Scholar]
- Fisher CD, Lickteig AJ, Augustine LM, Ranger-Moore J, Jackson JP, Ferguson SS, Cherrington NJ (2009) Hepatic cytochrome P450 enzyme alterations in humans with progressive stages of nonalcoholic fatty liver disease. Drug Metab Dispos 37:2087–2094. [DOI] [PMC free article] [PubMed] [Google Scholar]
- Food and Drug Administration (2020) In Vitro Drug Interaction Studies—Cytochrome P450 Enzyme- and Transporter-Mediated Drug Interactions Guidance for Industry. Washington, DC: FDA. [Google Scholar]
- Friedman SL, Neuschwander-Tetri BA, Rinella M, Sanyal AJ (2018) Mechanisms of NAFLD development and therapeutic strategies. Nat Med 24:908–922. [DOI] [PMC free article] [PubMed] [Google Scholar]
- Guha P, Kaptan E, Gade P, Kalvakolanu DV, Ahmed H (2017) Tunicamycin induced endoplasmic reticulum stress promotes apoptosis of prostate cancer cells by activating mTORC1. Oncotarget 8:68191–68207. [DOI] [PMC free article] [PubMed] [Google Scholar]
- Hardy TZeybel MDay CPDipper CMasson SMcPherson SHenderson ETiniakos DWhite SFrench J, et al. (2017) Plasma DNA methylation: a potential biomarker for stratification of liver fibrosis in non-alcoholic fatty liver disease. Gut 66:1321–1328. [DOI] [PMC free article] [PubMed] [Google Scholar]
- Higgins JW,Bao JQKe ABManro JRFallon JKSmith PCZamek-Gliszczynski MJ (2014) . Utility of Oatp1a/1b-knockout and OATP1B1/3-humanized mice in the study of OATP-mediated pharmacokinetics and tissue distribution: case studies with pravastatin, atorvastatin, simvastatin, and carboxydichlorofluorescein. Drug metabolism and disposition: the biological fate of chemicals 42:182–192. [DOI] [PubMed] [Google Scholar]
- Ipsen DH, Lykkesfeldt J, Tveden-Nyborg P (2020) Animal models of fibrosis in nonalcoholic steatohepatitis: do they reflect human disease? Adv Nutr 11:1696–1711. [DOI] [PMC free article] [PubMed] [Google Scholar]
- Jiang S, Zhang E, Zhang R, Li X (2016) Altered activity patterns of transcription factors induced by endoplasmic reticulum stress. BMC Biochem 17:8. [DOI] [PMC free article] [PubMed] [Google Scholar]
- Kim TH, Choi D, Kim JY, Lee JH, Koo S-H (2017) Fast food diet-induced non-alcoholic fatty liver disease exerts early protective effect against acetaminophen intoxication in mice. BMC Gastroenterol 17:124. [DOI] [PMC free article] [PubMed] [Google Scholar]
- Kleiner DEBrunt EMVan Natta MBehling CContos MJCummings OWFerrell LDLiu Y-CTorbenson MSUnalp-Arida A, et al. ; Nonalcoholic Steatohepatitis Clinical Research Network (2005) Design and validation of a histological scoring system for nonalcoholic fatty liver disease. Hepatology 41:1313–1321. [DOI] [PubMed] [Google Scholar]
- Köck K, Xie Y, Hawke RL, Oberlies NH, Brouwer KLR (2013) Interaction of silymarin flavonolignans with organic anion-transporting polypeptides. Drug Metab Dispos 41:958–965. [DOI] [PMC free article] [PubMed] [Google Scholar]
- Kolwankar D, Vuppalanchi R, Ethell B, Jones DR, Wrighton SA, Hall SD, Chalasani N (2007) Association between nonalcoholic hepatic steatosis and hepatic cytochrome P-450 3A activity. Clin Gastroenterol Hepatol 5:388–393. [DOI] [PubMed] [Google Scholar]
- Kroll DJ, Shaw HS, Oberlies NH (2007) Milk thistle nomenclature: why it matters in cancer research and pharmacokinetic studies. Integr Cancer Ther 6:110–119. [DOI] [PubMed] [Google Scholar]
- Kubota N, Kado S, Kano M, Masuoka N, Nagata Y, Kobayashi T, Miyazaki K, Ishikawa F (2013) A high-fat diet and multiple administration of carbon tetrachloride induces liver injury and pathological features associated with non-alcoholic steatohepatitis in mice. Clin Exp Pharmacol Physiol 40:422–430. [DOI] [PubMed] [Google Scholar]
- Lee JS, Zheng Z, Mendez R, Ha SW, Xie Y, Zhang K (2012) Pharmacologic ER stress induces non-alcoholic steatohepatitis in an animal model. Toxicol Lett 211:29–38. [DOI] [PMC free article] [PubMed] [Google Scholar]
- Li H, Toth E, Cherrington NJ (2018) Asking the right questions with animal models: methionine- and choline-deficient model in predicting adverse drug reactions in human NASH. Toxicol Sci 161:23–33. [DOI] [PMC free article] [PubMed] [Google Scholar]
- Lonardo A, Nascimbeni F, Ballestri S, Fairweather D, Win S, Than TA, Abdelmalek MF, Suzuki A (2019) Sex differences in nonalcoholic fatty liver disease: state of the art and identification of research gaps. Hepatology 70:1457–1469. [DOI] [PMC free article] [PubMed] [Google Scholar]
- Lynch KD, Montonye ML, Tian DD, Arman T, Oyanna VO, Bechtold BJ, Graf TN, Oberlies NH, Paine MF, Clarke JD (2021) Hepatic organic anion transporting polypeptides mediate disposition of milk thistle flavonolignans and pharmacokinetic silymarin-drug interactions. Phytother Res 35:3286–3297. [DOI] [PMC free article] [PubMed] [Google Scholar]
- Martin-Grau M, Marrachelli VG, Monleon D (2022) Rodent models and metabolomics in non-alcoholic fatty liver disease: what can we learn? World J Hepatol 14:304–318. [DOI] [PMC free article] [PubMed] [Google Scholar]
- McFeely SJ, Ritchie TK, Yu J, Nordmark A, Levy RH, Ragueneau-Majlessi I (2019) Identification and evaluation of clinical substrates of organic anion transporting polypeptides 1B1 and 1B3. Clin Transl Sci 12:379–387. [DOI] [PMC free article] [PubMed] [Google Scholar]
- Mir FF, Tomaszewski RP, Shuboni-Mulligan DD, Mallett CL, Hix JML, Ether ND, Shapiro EM (2019) Chimeric mouse model for MRI contrast agent evaluation. Magn Reson Med 82:387–394. [DOI] [PMC free article] [PubMed] [Google Scholar]
- Montonye ML, Tian DD, Arman T, Lynch KD, Hagenbuch B, Paine MF, Clarke JD (2019) A pharmacokinetic natural product-disease-drug interaction: a double hit of silymarin and nonalcoholic steatohepatitis on hepatic transporters in a rat model. J Pharmacol Exp Ther 371:385–393. [DOI] [PMC free article] [PubMed] [Google Scholar]
- Nigro DMenotti FCento ASSerpe LChiazza FDal Bello FRomaniello FMedana CCollino MAragno M, et al. (2017) Chronic administration of saturated fats and fructose differently affect SREBP activity resulting in different modulation of Nrf2 and Nlrp3 inflammasome pathways in mice liver. J Nutr Biochem 42:160–171. [DOI] [PubMed] [Google Scholar]
- Rinella ME, Green RM (2004) The methionine-choline deficient dietary model of steatohepatitis does not exhibit insulin resistance. J Hepatol 40:47–51. [DOI] [PubMed] [Google Scholar]
- Salphati LChu XChen LPrasad BDallas SEvers RMamaril-Fishman DGeier EGKehler JKunta J, et al. (2014) Evaluation of organic anion transporting polypeptide 1B1 and 1B3 humanized mice as a translational model to study the pharmacokinetics of statins. Drug Metab Dispos 42:1301–1313. [DOI] [PubMed] [Google Scholar]
- Sanyal AJ; American Gastroenterological Association (2002) AGA technical review on nonalcoholic fatty liver disease. Gastroenterology 123:1705–1725. [DOI] [PubMed] [Google Scholar]
- Savard C, Tartaglione EV, Kuver R, Haigh WG, Farrell GC, Subramanian S, Chait A, Yeh MM, Quinn LS, Ioannou GN (2013) Synergistic interaction of dietary cholesterol and dietary fat in inducing experimental steatohepatitis. Hepatology 57:81–92. [DOI] [PMC free article] [PubMed] [Google Scholar]
- Savari F, Mard SA, Badavi M, Rezaie A, Gharib-Naseri MK (2019) A new method to induce nonalcoholic steatohepatitis (NASH) in mice. BMC Gastroenterol 19:125. [DOI] [PMC free article] [PubMed] [Google Scholar]
- Stefan N, Häring H-U, Cusi K (2019) Non-alcoholic fatty liver disease: causes, diagnosis, cardiometabolic consequences, and treatment strategies. Lancet Diabetes Endocrinol 7:313–324. [DOI] [PubMed] [Google Scholar]
- Trusca VG, Mihai AD, Fuior EV, Fenyo IM, Gafencu AV (2016) High levels of homocysteine downregulate apolipoprotein E expression via nuclear factor kappa B. World J Biol Chem 7:178–187. [DOI] [PMC free article] [PubMed] [Google Scholar]
- van de Steeg EStránecký VHartmannová HNosková LHřebíček MWagenaar Evan Esch Ade Waart DROude Elferink RPJKenworthy KE, et al. (2012) Complete OATP1B1 and OATP1B3 deficiency causes human Rotor syndrome by interrupting conjugated bilirubin reuptake into the liver. J Clin Invest 122:519–528. [DOI] [PMC free article] [PubMed] [Google Scholar]
- van de Steeg E, van der Kruijssen CMM, Wagenaar E, Burggraaff JEC, Mesman E, Kenworthy KE, Schinkel AH (2009) Methotrexate pharmacokinetics in transgenic mice with liver-specific expression of human organic anion-transporting polypeptide 1B1 (SLCO1B1). Drug Metab Dispos 37:277–281. [DOI] [PubMed] [Google Scholar]
- van de Steeg E, van Esch A, Wagenaar E, Kenworthy KE, Schinkel AH (2013) Influence of human OATP1B1, OATP1B3, and OATP1A2 on the pharmacokinetics of methotrexate and paclitaxel in humanized transgenic mice. Clin Cancer Res 19:821–832. [DOI] [PubMed] [Google Scholar]
- Vildhede A, Kimoto E, Pelis RM, Rodrigues AD, Varma MVS (2020) Quantitative proteomics and mechanistic modeling of transporter-mediated disposition in nonalcoholic fatty liver disease. Clin Pharmacol Ther 107:1128–1137. [DOI] [PubMed] [Google Scholar]
- Woolsey SJ, Mansell SE, Kim RB, Tirona RG, Beaton MD (2015) CYP3A activity and expression in nonalcoholic fatty liver disease. Drug Metab Dispos 43:1484–1490. [DOI] [PubMed] [Google Scholar]
- Younossi Z, Anstee QM, Marietti M, Hardy T, Henry L, Eslam M, George J, Bugianesi E (2018) Global burden of NAFLD and NASH: trends, predictions, risk factors and prevention. Nat Rev Gastroenterol Hepatol 15:11–20. [DOI] [PubMed] [Google Scholar]
- Younossi ZM, Koenig AB, Abdelatif D, Fazel Y, Henry L, Wymer M (2016) Global epidemiology of nonalcoholic fatty liver disease—meta-analytic assessment of prevalence, incidence, and outcomes. Hepatology 64:73–84. [DOI] [PubMed] [Google Scholar]
- Zhong F, Zhou X, Xu J, Gao L (2020) Rodent models of nonalcoholic fatty liver disease. Digestion 101:522–535. [DOI] [PubMed] [Google Scholar]


