

Abstract
Survivors of childhood cancer may experience accelerated biological aging, resulting in premature frailty and death. We used seven measures of biological age in the St. Jude Lifetime (SJLIFE) Cohort to compare biological age acceleration among SJLIFE and NHANES III controls, explore trajectories of biological age by cancer treatment and type, and test associations of biological age acceleration with frailty and death (mean follow-up of 26.5 years) among survivors. Cancer survivors aged 5% faster per year and measured, on average, 0.6–6.44 years biologically older compared to controls and 5–16 years biologically older compared to age- matched individuals at the population level. Survivors treated with hematopoietic cell transplant and vinca alkaloid chemotherapy evidenced the fastest trajectories of biological aging. Biologically, older and faster-aging survivors consistently and robustly had a higher risk of frailty and died earlier than those with slower biological aging, suggesting a potential opportunity to intervene on excess aging.
Keywords: childhood cancer, cancer survivor, biological age, accelerated aging, epigenetics, epigenetic clock, DNA methylation, frailty, mortality, biological sciences/cancer
Childhood cancer survival has improved dramatically over the past five decades, with over 85% of patients expected to live at least ten years after diagnosis1. However, these achievements in lifespan do not equate to advances in healthspan. Growing evidence suggests that adult survivors of childhood cancer experience accelerated biological aging2,3, which may result in the early onset of frailty4,5 and premature death6,7. The Reverse Geroscience Hypothesis posits that chronic diseases, such as cancer and their treatments, cause cellular damage that mimics or targets the hallmarks of aging (e.g., epigenetic alterations, DNA damage, cellular senescence)8. Over time, the accumulation of cellular damage may lead to accelerated biological aging9, premature onset of aging phenotypes (i.e., frailty), and ultimately, early death3,10. Consistent with the Reverse Geroscience Hypothesis, childhood cancer survivors show laboratory signs of premature biological aging, including telomere attrition, cellular senescence, and inflammation11– 19, and specific cancer treatments have been linked to aging phenotypes, such as frailty5. Predictive biomarkers of accelerated aging phenotypes are needed to identify survivors at risk of premature aging and those who might benefit from preventive interventions3,20.
A new generation of aging biomarkers has the potential to meet this need. These biomarkers are based on algorithms that integrate information from multiple clinical or molecular measurements to estimate an individual’s biological age or pace of aging. Initial studies suggest that at least some of these measures indicate advanced or accelerated biological aging in survivors of childhood cancer13,16. However, these measures are rarely estimated in the same population, and consensus on the best biological measure of aging has not been reached, making comparisons across measures difficult. We used a large cohort of childhood cancer survivors and matched controls to evaluate a panel of the best-evidenced and most-studied of these novel aging biomarkers to test the Reverse Geroscience Hypothesis. We included seven measures of biological aging in our analysis: two physiology-based algorithms (the Klemera-Doubal Biological Age (KDM-BA) and PhenoAge), four DNA methylation (DNAm) clocks (the Horvath, Hannum, PhenoAge, and GrimAge clocks), and DunedinPACE, a single-time-point DNAm blood-test of the speed of biological aging (Supplementary Table 1). We compared adult survivors of childhood cancer in the St. Jude Lifetime (SJLIFE) cohort with two control groups: (1) community controls from the SJLIFE cohort (herein referred to as community controls) and (2) participants in the third U.S. National Health and Nutrition Examination Survey (NHANES III) to test if cancer survivors were biologically older and aging more rapidly, as compared to non-cancer controls. Among the SJLIFE survivors, we tested if specific cancer types and treatments influenced the trajectory of biological aging over a mean follow-up period of 26.5 years using physiology-based measures. We also assessed whether participants with older biological age and a faster pace of aging were at increased risk of frailty and mortality. We hypothesize that survivors will be biologically older and aging faster as compared to SJLIFE and NHANES III controls, specific cancer types and treatments will accelerate biological age cross- sectionally and longitudinally, and survivors who are biologically older and aging faster will have a higher risk of frailty and die earlier than those with slower biological aging.
Results
Characteristics of the Study Population
A total of 4,117 adult survivors of childhood cancer, 606 community controls, and 16,421 NHANES III participants were included in analyses of physiology-based biological age, and 2,095 SJLIFE survivors and 282 community controls were included in DNAm analyses (Table 1). The mean chronological age was 35, 34, and 42 years among survivors, community controls, and NHANES III controls, respectively (p<0.001). Survivors were statistically different from the SJLIFE community and NHANES III controls, with higher proportions of men and obesity (p<0.001) and higher mean depression scores (p<0.001) observed in SJLIFE survivors. About half of the survivors participated in 150 minutes of moderate-vigorous physical activity (52.7% versus 61.8% and 62.6% of community and NHANES controls, respectively, p<0.001) and risky drinking (47.1% versus 58.8% and 27.2% of community and NHANES III controls, respectively, p<0.001). 17.8% of survivors reported current smoking compared to 12.3% and 29.0% of community and NHANES III controls, respectively (p<0.001).
Table 1.
Clinical and Demographic Characteristics of Participants and Controls
| SJLIFE Survivors | SJLIFE Community controls | NHANES controls | p-value | ||||
|---|---|---|---|---|---|---|---|
|
|
|||||||
| N | Mean (SD) | N | Mean (SD) | N | Mean (SD) | ||
|
| |||||||
| Age at evaluation, years | 4,117 | 35.08 (10.17) | 606 | 33.64 (10.18) | 16,421 | 42.07 (13.11) | <0.001 |
| Biological Age | |||||||
| Klemera-Doubal Method | 4,117 | 37.87 (13.10) | 606 | 33.17 (9.99) | 16,421 | 41.61 (12.63) | <0.001 |
| Phenotypic Age | 4,117 | 36.95 (12.76) | 606 | 33.87 (11.41) | 16,421 | 41.96 (13.93) | <0.001 |
| Horvath’s Clock | 2,095 | 49.25 (6.74) | 282 | 49.08 (6.82) | - | - | 0.69 |
| Hannum’s Clock | 2,095 | 42.56 (8.44) | 282 | 40.05 (7.09) | - | - | <0.001 |
| DNAmPhenoAge Clock | 2,095 | 40.76 (9.82) | 282 | 39.05 (8.71) | - | - | 0.01 |
| GrimAge Clock | 2,095 | 42.81 (7.98) | 282 | 43.30 (8.60) | - | - | 0.34 |
| DunedinPACE | 2,095 | 1.05 (0.11) | 282 | 0.99 (0.10) | - | - | <0.001 |
|
| |||||||
| N = 4,117 | % | N = 606 | % | N = 16,421 | % | ||
|
| |||||||
| Sex | <0.001 | ||||||
| Male | 2,169 | 52.68 | 266 | 43.89 | 7,541 | 48.29 | |
| Female | 1,948 | 47.32 | 340 | 56.11 | 8,524 | 51.71 | |
| Race/ethnicity | |||||||
| Non-Hispanic White | 3,311 | 80.42 | 517 | 85.31 | 5,960 | 74.34 | - |
| Non-Hispanic Black | 639 | 15.52 | 40 | 6.60 | 4,789 | 11.78 | |
| Hispanic | 111 | 2.70 | 22 | 3.63 | 5,316 | 13.88 | |
| Asian | 8 | 0.19 | 14 | 2.31 | - | - | |
| Other | 45 | 1.09 | 7 | 1.16 | 262 | 3.91 | |
| Unknown | 3 | 0.07 | 6 | 0.99 | - | - | |
| Educational attainment | <0.001 | ||||||
| < High School | 443 | 11.09 | 17 | 2.91 | 6,571 | 25.04 | |
| High School Graduate | 2,329 | 58.28 | 262 | 44.86 | 7,542 | 55.15 | |
| College Graduate | 1,224 | 30.63 | 305 | 52.23 | 1,841 | 19.81 | |
| Insurance status | 0.03 | ||||||
| Yes | 3,353 | 83.97 | 515 | 87.88 | 12,435 | 85.02 | |
| No | 640 | 16.03 | 71 | 12.12 | 3,251 | 14.98 | |
| Annual household income | <0.001 | ||||||
| < $40,000 | 1,449 | 41.31 | 132 | 24.22 | 11,235 | 64.36 | |
| ≥ $40,000 | 2,059 | 58.69 | 413 | 75.78 | 3,281 | 35.64 | |
| BMI | <0.001 | ||||||
| Underweight | 139 | 3.38 | 15 | 2.48 | 376 | 2.63 | |
| Normal | 1,262 | 30.66 | 228 | 37.62 | 6121 | 43.44 | |
| Overweight | 1,171 | 28.45 | 169 | 27.89 | 5441 | 32.02 | |
| Obese | 1,544 | 37.51 | 194 | 32.01 | 4078 | 21.91 | |
| Depression score, mean (SD) | 49.84 | 10.34 | 47.31 | 8.73 | - | - | <0.001 |
| Smoking status | <0.001 | ||||||
| Never | 2,821 | 70.19 | 419 | 70.66 | 8,184 | 47.32 | |
| Former | 484 | 12.04 | 101 | 17.03 | 3,625 | 23.66 | |
| Current | 714 | 17.77 | 73 | 12.31 | 4,255 | 29.02 | |
| Physical Activity (≥ 150 weekly minutes of MVPA) |
<0.001 |
||||||
| Yes | 2,109 | 52.71 | 363 | 61.84 | 8,641 | 62.61 | |
| No | 1,892 | 47.29 | 224 | 38.16 | 7,418 | 37.39 | |
| Alcohol Use | <0.001 | ||||||
| Risky drinking | 1,882 | 47.07 | 347 | 58.81 | 4,142 | 27.24 | |
| No risky drinking | 2,116 | 52.93 | 243 | 41.19 | 11,370 | 72.76 | |
SD=standard deviation, MVPA=moderate or vigorous physical activity
The median (standard deviation; SD) age at diagnosis and time since diagnosis among survivors was 8.6 years (SD=5.7 years) and 26.5 years (SD=10.4 years), respectively (Supplementary Table 2). Primary diagnoses comprised leukemia (34.3%), central nervous system (CNS) tumors (13.5%), Hodgkin lymphoma (HL) (11.9%), non-Hodgkin lymphoma (NHL) (6.9%), bone tumors (6.9%), Wilms tumor (5.9%), neuroblastoma (4.3%), soft tissue sarcoma (3.0%), and other solid tumors (13.5%). 29.6% of survivors were exposed to cranial radiation, 17.8% chest radiation, 18.3% abdominal or pelvic radiation, 64.8% vinca alkaloids, 58.8% cyclophosphamide, 57.4% doxorubicin, 43.8% methotrexate, and 34.1% 6-mercaptopurine, and 8% hematopoietic cell transplant (HCT).
Biological Age Acceleration in Survivors and Controls
Age acceleration of KDM-BA, PhenoAge, the DNAm clocks, and original scale values of DunedinPACE were correlated, although patterns varied (Supplementary Table 3). Fig. 1 and Table 2 show the difference in biological age acceleration between survivors and controls (standardized estimates presented in Supplementary Table 4). Survivors were aging at a pace of 5% faster per year than community controls (DunedinPACE β= 0.05, 95% CI: 0.04–0.06). At a mean chronological age of 35 years, cancer survivors measured, on average, 0.6–1.88 years and 2.22–6.49 years biologically older over their lifetime compared to community controls, as measured by residuals and difference scores, respectively. Moreover, survivors measured 5.2– 15.9 years biologically older than expected for someone of their chronological age at the population level. Compared to the NHANES III controls, survivors were, on average, 0.75–4.94 years biologically older (p<0.05) despite NHANES III controls being chronologically seven years older.
Fig. 1:
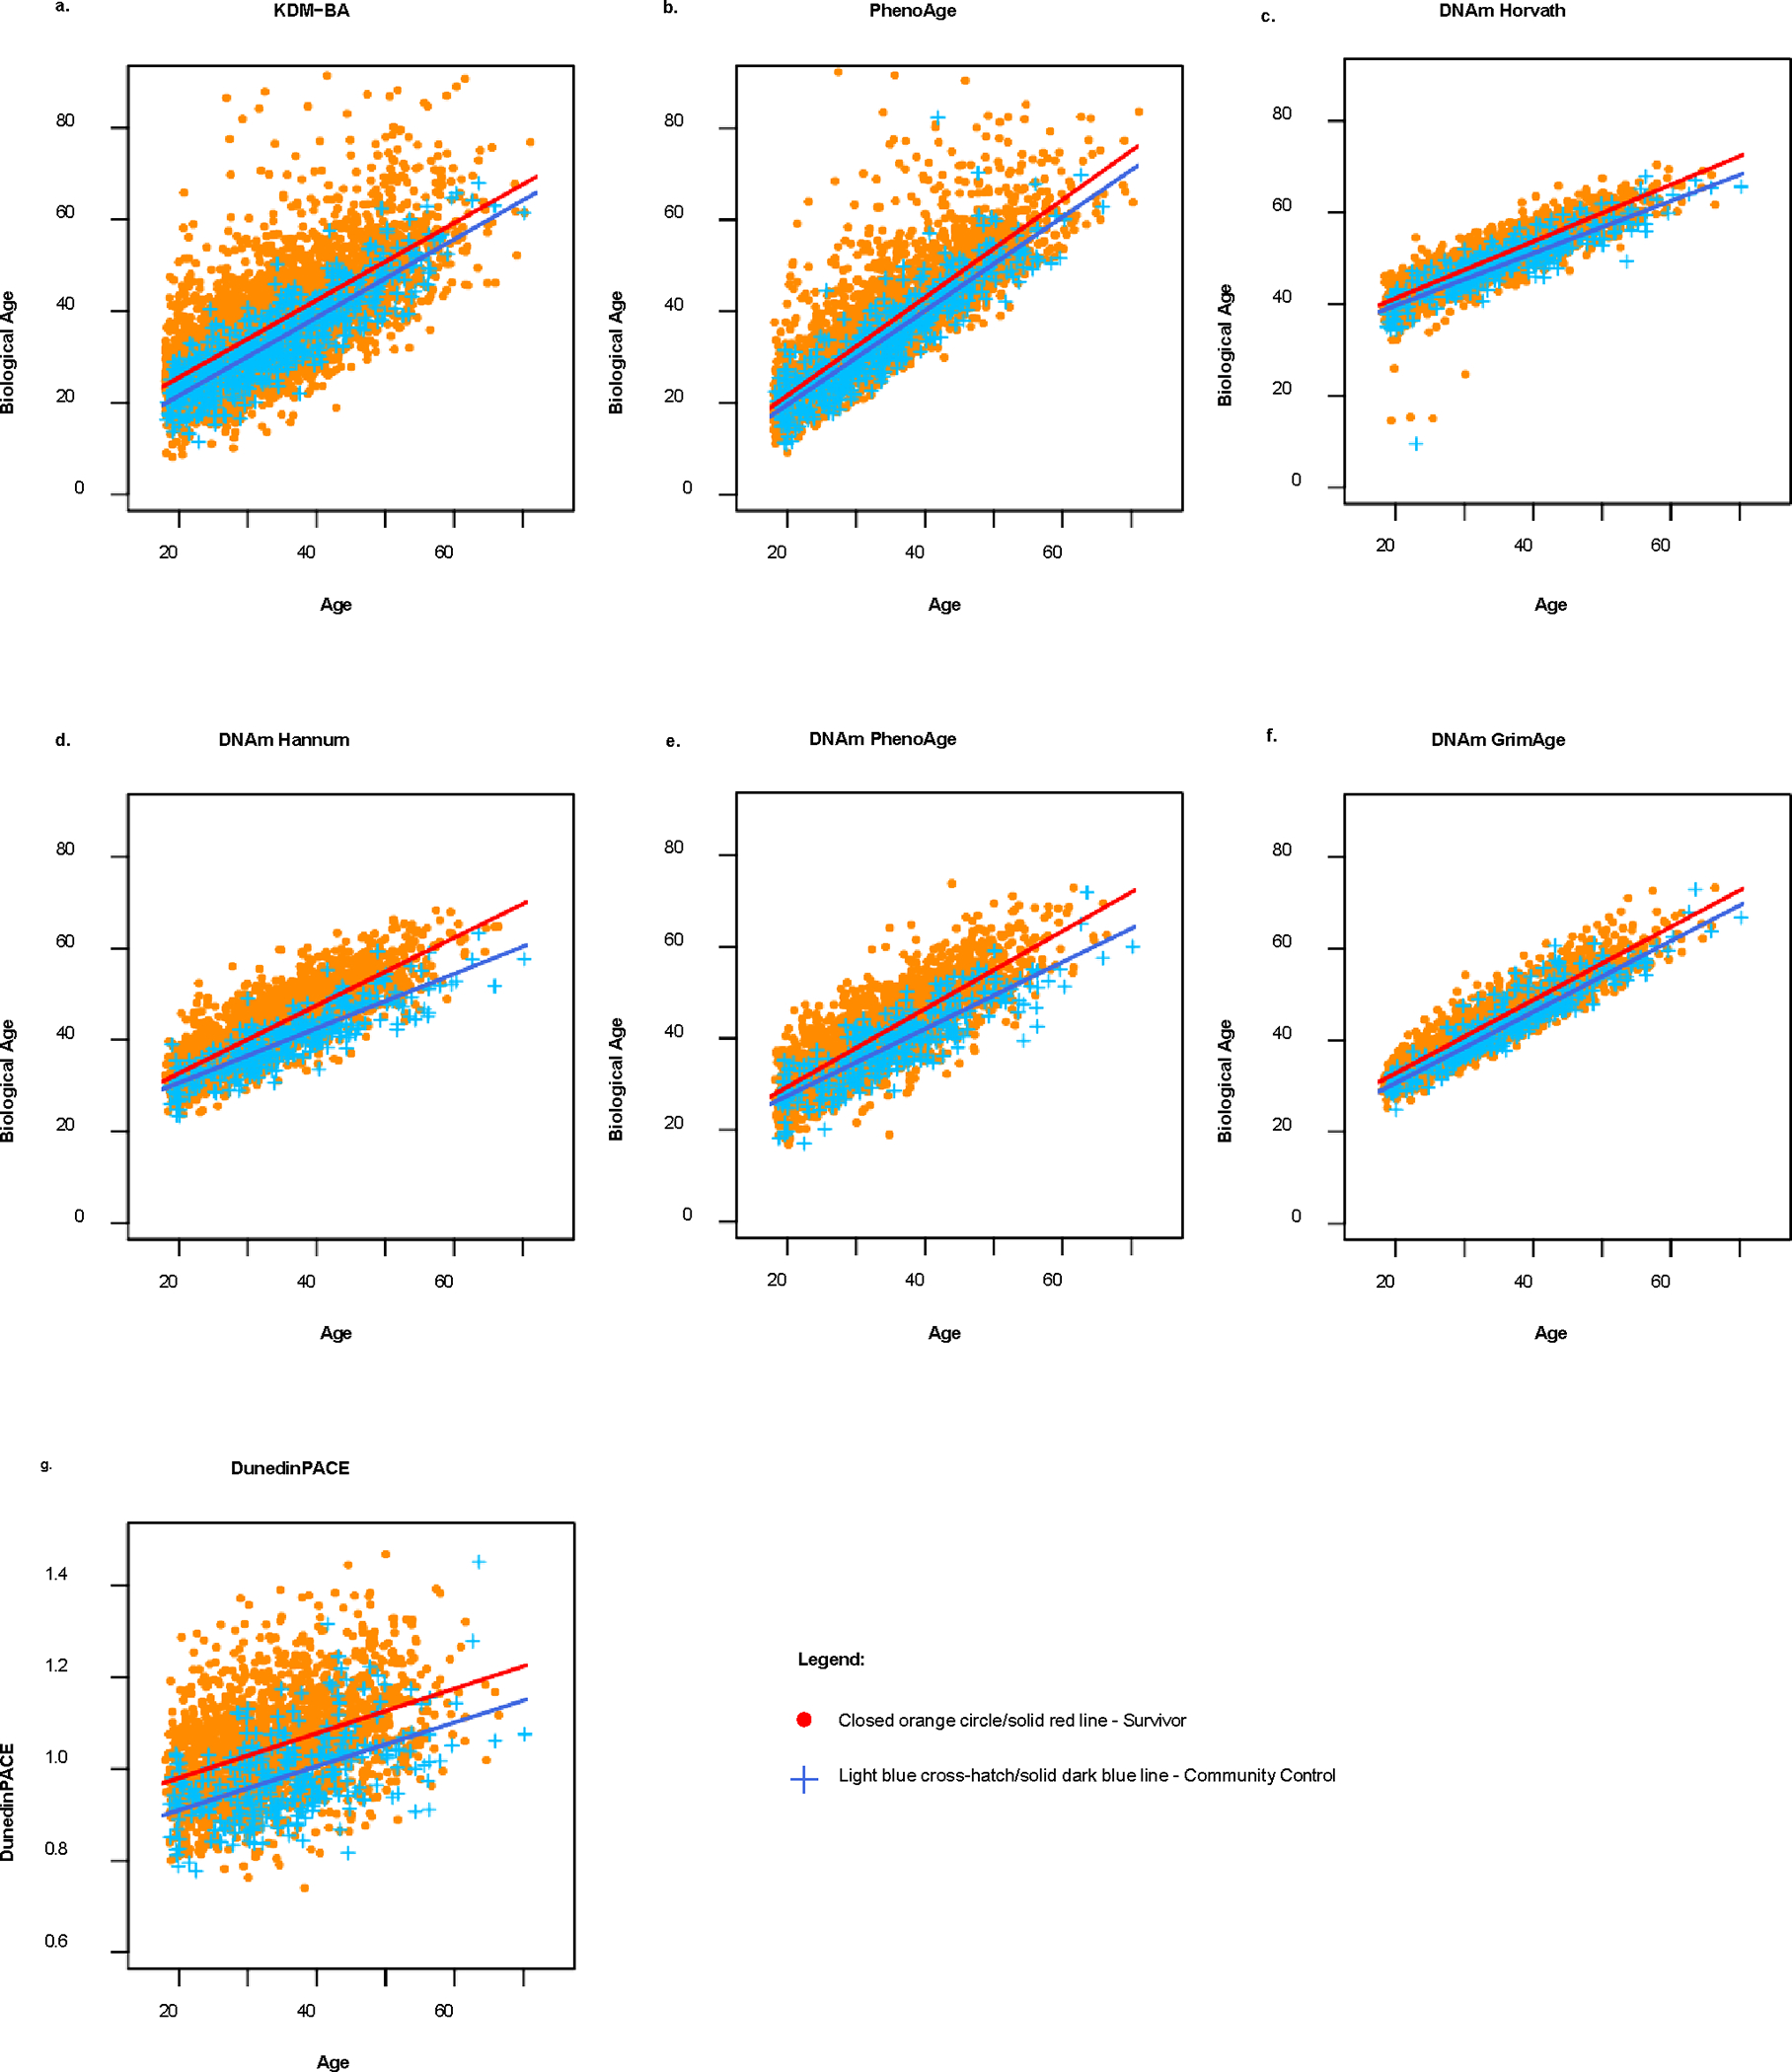
Scatterplots and linear regression lines of biological age by chronological age (i.e., age at DNA sampling) for childhood cancer survivors (N = 4117) and community controls (N = 606) in the St. Jude Lifetime Cohort Study.
Table 2.
Unstandardized Differences in Biological Age Acceleration among Adult Survivors of Childhood Cancer in the St. Jude Lifetime Cohort, Community Controls, and NHANES III Participants
| BAA Estimated with Residuals |
BAA Estimated with Difference Scores |
|||||||
|---|---|---|---|---|---|---|---|---|
| SJLIFE Participants (N=4,117) | Community Controls (N=606) | SJLIFE Participants (N=4,117) | Community Controls (N=606) | |||||
|
|
|
|||||||
| Physiology-Based Measures | Mean (SD) | Mean (SD) | Mean Difference | 95% CI | Mean (SD) | Mean (SD) | Mean Difference | 95% CI |
| Klemera-Doubal Method | 0.98 (0.17) | 0.38 (0.40) | 0.60 | (−0.25, 1.45) | 6.04 (0.17) | −0.45 (0.39) | 6.49 | (5.67,7.31) |
| Phenotypic Age | 0.53 (0.13) | −0.07 (0.35) | 0.59 | (−0.14,1.34) | 5.21 (0.13) | −0.01 (0.35) | 5.22 | (4.49,5.94) |
|
|
|
|||||||
| DNA Methylation- Based Measures | N = 2,095 | N = 282 | N = 2,095 | N = 282 | ||||
|
|
|
|||||||
| Horvath’s Clock | 2.29 (0.08) | 0.41 (0.21) | 1.88 | (1.45, 2.31) | 15.92 (0.07) | 12.35 (0.19) | 3.57 | (3.17, 3.97) |
| Hannum’s Clock | 1.42 (0.10) | 0.33 (0.27) | 1.09 | (0.52, 1.66) | 9.22 (0.10) | 3.57 (0.27) | 5.65 | (5.08, 6.21) |
| DNAmPhenoAge Clock | 0.99 (0.12) | 0.20 (0.32) | 0.79 | (0.12, 1.46) | 7.41 (0.12) | 2.79 (0.32) | 4.62 | (3.95, 5.29) |
| GrimAge Clock | 1.29 (0.07) | 0.17 (0.19) | 1.12 | (0.72, 1.51) | 9.18 (0.07) | 6.96 (0.18) | 2.22 | (1.83, 2.60) |
| DunedinPACE* | 1.04 (0.002) | 0.99 (0.01) | 0.05 | (0.04, 0.06) | ||||
|
| ||||||||
| SJLIFE Participants (N=4,117) | NHANES III Controls (N=16,421) | SJLIFE Participants (N=4,117) | NHANES III Controls (N=16,421) | |||||
|
| ||||||||
| Physiology-Based Measures | Mean (SD) | Mean (SD) | Mean Difference (β) | 95% CI | Mean (SD) | Mean (SD) | Mean Difference (β) | 95% CI |
|
| ||||||||
| Klemera-Doubal Method | 0.98 (0.12) | 0.23 (0.06) | 0.75 | (0.49,1.02) | 6.04 (0.12) | 1.10 (0.06) | 4.94 | (4.68,5.20) |
|
| ||||||||
| Phenotypic Age | 0.53 (0.12) | −0.33 (0.06) | 0.86 | (0.59, 1.13) | 5.21 (0.12) | 0.40 (0.06) | 4.81 | (4.54,5.08) |
BAA = Biological Age Acceleration; Mean = Biological age acceleration mean; SE = Standard Error; β = Beta Coefficient (Mean Difference); 95% CI = 95% Confidence Interval
For DunedinPACE, the non-residualized values (original scale) were used.
Biological age acceleration estimated with residuals was calculated by regressing biological age on chronological age. Biological age acceleration estimated with difference scores was calculated by subtracting chronological ages from the estimated biological ages. For DunedinPACE, the non-residualized values (original scale) were used. Linear regression models were used to estimate the mean difference between survivors and controls; models are unadjusted. The unstandardized mean difference for all biological age measures (except DunedinPACE) represents the total lifespan difference in aging in survivors compared to controls. The interpretation for DunedinPACE is different because it is a rate; the unstandardized mean difference can be interpreted as the difference in how much aging occurs per year in survivors compared to controls.
Trajectories of Biological Age by Cancer Site and Treatment
A subset of survivors (n=1,042) had physiology-based data available at three or more visits. For PhenoAge, survivors of lymphoma, CNS tumors, and Wilms tumor showed the fastest trajectories of biological aging (β=1.08–1.12, Supplementary Table 5). In contrast, KDM-BA showed that rates of aging across cancer types were not statistically significant. Cross- sectionally, survivors treated with HSCT, and total body irradiation showed consistent signs of biological aging across measures, with survivors experiencing 1.48–5.17 years and 0.37–9.47 years of advanced biological age for HSCT and total body irradiation, respectively (Supplementary Table 6). Survivors exposed to HCT (overall least square mean difference [OLSMD]=2.41, β=0.47, 95% CI: 0.03, 0.91) and vinca alkaloid chemotherapy (OLSMD=−0.44, β=0.15, 95% CI: 0.004, 0.30) had faster rates of biological aging, as measured by KDM-BA and PhenoAge, respectively, than survivors who did not receive the respective treatments (Supplementary Table 7); all other treatments did not show statistically significant differences. 148 Associations of Biological Age Acceleration and Frailty Among survivors, 36.1% were robust (n=1,468), 56.8% were pre-frail (n=2,307), and 7.1% were frail (n=287). After adjustment for age at diagnosis, race/ethnicity, sex, treatment type, BMI, depression, smoking, alcohol use, and physical activity (model 3), survivors with the highest biological age acceleration (tertile 3) were at increased risk of frailty (range of odds ratios: 1.08– 3.13, p<0.05), compared to those with the least age acceleration (tertile 1; Table 3, Supplementary Table 8). Horvath’s clock-frailty association was calculated with difference scores, and Hannum’s clock-frailty association was calculated with residual and difference scores, which were all in the expected direction but did not reach statistical significance.
Table 3.
Adjusted Associations of Biological Age Acceleration by Tertile with Frailty and All-Cause Mortality among Survivors
| Biological Age Acceleration Calculated with Residuals | |||||||||
|---|---|---|---|---|---|---|---|---|---|
|
| |||||||||
| Frailty (Ref = robust) |
All-Cause Mortality |
||||||||
| Pre-Frail (n = 2,307) | Frail (n = 287) | (n = 167 deaths) | |||||||
|
|
|
|
|||||||
| Tertile | n | HR | 95% CI | HR | 95% CI | n | HR | 95% CI | |
|
| |||||||||
| Klemera-Doubal Method | 1 | 3,298 | Ref | Ref | 3,336 | Ref | |||
| 2 | 1.04 | 0.83, 1.31 | 1.36 | 1.06, 1.74 | 1.14 | 0.59, 2.20 | |||
| 3 | 1.42 | 0.90, 2.24 | 2.22 | 1.38, 3.55 | 3.38 | 1.94, 5.89 | |||
| Phenotypic Age | 1 | 3,615 | Ref | Ref | 3,658 | Ref | |||
| 2 | 1.09 | 0.88, 1.35 | 1.39 | 1.10, 1.75 | 1.59 | 0.89, 2.84 | |||
| 3 | 0.71 | 0.46, 1.10 | 1.6 | 1.06, 2.43 | 1.77 | 1.02, 3.08 | |||
| Horvath’s Clock | 1 | 2,081 | Ref | Ref | 2,095 | Ref | |||
| 2 | 1.58 | 1.19, 2.08 | 1.27 | 0.96, 1.67 | 2.8 | 1.39, 5.65 | |||
| 3 | 2.32 | 1.30, 4.14 | 2.01 | 1.13, 3.58 | 4.89 | 2.50, 9.58 | |||
| Hannum’s Clock | 1 | 2,081 | Ref | Ref | 2,095 | Ref | |||
| 2 | 1.02 | 0.78, 1.33 | 1.2 | 0.92, 1.58 | 1.7 | 0.83, 3.50 | |||
| 3 | 0.9 | 0.52, 1.55 | 1.25 | 0.73, 2.14 | 3.58 | 1.89, 6.80 | |||
| DNAmPhenoAge Clock | 1 | 2,081 | Ref | Ref | 2,095 | Ref | |||
| 2 | 1.19 | 0.91, 1.55 | 1.44 | 1.09, 1.90 | 2.57 | 1.18, 5.63 | |||
| 3 | 1.66 | 0.94, 2.96 | 2.35 | 1.35, 4.10 | 5.09 | 2.47, 10.50 | |||
| GrimAge Clock | 1 | 2,035 | Ref | Ref | 2,044 | Ref | |||
| 2 | 1.19 | 0.90, 1.56 | 1.75 | 1.28, 2.39 | 3.01 | 1.28, 7.07 | |||
| 3 | 2.54 | 1.40, 4.59 | 3.13 | 1.63, 6.03 | 7.59 | 3.36, 17.16 | |||
|
| |||||||||
| Biological Age Acceleration Calculated with Difference Scores | |||||||||
|
| |||||||||
| Klemera-Doubal Method | 1 | 3298 | Ref | Ref | 3336 | Ref | |||
| 2 | 1.08 | 0.86, 1.35 | 1.37 | 1.07, 1.75 | 2 | 1.09, 3.67 | |||
| 3 | 1.38 | 0.88, 2.17 | 1.97 | 1.24, 3.13 | 4.57 | 2.62, 7.99 | |||
| Phenotypic Age | 1 | 3,615 | Ref | Ref | 3,658 | Ref | |||
| 2 | 0.85 | 0.69, 1.06 | 1.23 | 0.97, 1.55 | 1.79 | 0.88, 3.64 | |||
| 3 | 0.52 | 0.33, 0.83 | 1.72 | 1.13, 2.61 | 2.8 | 1.44, 5.45 | |||
| Horvath’s Clock | 1 | 2,081 | Ref | Ref | 2,095 | Ref | |||
| 2 | 1.15 | 0.87, 1.52 | 1.11 | 0.83, 1.50 | 4.86 | 2.55, 9.28 | |||
| 3 | 1.46 | 0.84, 2.56 | 1.43 | 0.80, 2.58 | 14.54 | 6.47, 32.68 | |||
| Hannum’s Clock | 1 | 2,081 | Ref | Ref | 2,095 | Ref | |||
| 2 | 0.99 | 0.75, 1.30 | 1.15 | 0.87, 1.53 | 1.59 | 0.90, 2.81 | |||
| 3 | 0.91 | 0.53, 1.56 | 1.08 | 0.62, 1.87 | 4.78 | 2.71, 8.44 | |||
| DNAmPhenoAge Clock | 1 | 2,081 | Ref | Ref | 2,095 | Ref | |||
| 2 | 1.04 | 0.80, 1.36 | 1.39 | 1.05, 1.84 | 2.41 | 1.29, 4.50 | |||
| 3 | 1.35 | 0.76, 2.39 | 2.33 | 1.34, 4.07 | 4.8 | 2.65, 8.71 | |||
| GrimAge Clock | 1 | 2,035 | Ref | Ref | 2,044 | Ref | |||
| 2 | 1.13 | 0.85, 1.49 | 1.34 | 0.98, 1.83 | 3.07 | 1.53, 6.15 | |||
| 3 | 1.38 | 0.77, 2.46 | 2.38 | 1.28, 4.44 | 9.42 | 4.74, 18.75 | |||
|
| |||||||||
| DunedinPACE | 1 | 2,081 | Ref | Ref | 2,094 | Ref | |||
| 2 | 1.05 | 0.82, 1.35 | 1.5 | 1.06, 2.13 | 0.84 | 0.43, 1.68 | |||
| 3 | 1.28 | 0.74, 2.19 | 2.61 | 1.39, 4.89 | 2.36 | 1.25, 4.46 | |||
OR = Odds ratio, HR = Hazard ratio, 95% CI = 95% Confidence Interval
Note: Frailty and mortality are the outcome variables, and biological age acceleration by tertile is the independent predictor of interest. Frailty models were estimated with multinomial logistic regression using the “robust” category as the reference group. All-cause mortality models were estimated using Cox regression models. Models are adjusted for age at diagnosis, race/ethnicity, sex, treatment type (chemotherapy, radiotherapy, surgery), BMI, depression, smoking, alcohol use, and physical activity.
Associations of Biological Age Acceleration and Morality
The follow-up period included 2,044–3,658 survivors (numbers differ by biological age measure) over 26.5 years, during which 4.1% of participants died (n=167). Across all measures of biological age and nested models (Fig. 2, Table 3, Supplementary Table 9), biological age acceleration was consistently and robustly associated with all-cause mortality. For instance, after adjustment for model 3 covariates, survivors with the highest biological age acceleration (tertile 3) were at increased risk of all-cause mortality (range of hazard ratios: 1.77–14.54, p<0.05; Table 3) compared to those with the least age acceleration (tertile 1). Associations were also tested between tertiles of biological age acceleration and cause-specific mortality due to recurrence and SMNs. Comparing those with the highest biological age acceleration to the lowest and using the residualized approach, Horvath’s clock (HR=3.52, 95% CI: 1.04–11.90) and DNAmPhenoAge (HR=7.27, 95% CI: 1.53–34.46) were significantly associated with mortality due to SMNs. Hannum’s clock (HR=4.68, 95% CI: 1.58, 13.84), DNAmPhenoAge (HR= 4.80, 95% CI: 1.63,14.12) and GrimAge (HR=2.93, 95% CI: 1.06, 8.13) were significantly associated with SMNs when the difference score approach was used (Supplementary Table 10); other measures were in the expected directions but did not reach statistical significance.
Fig. 2:
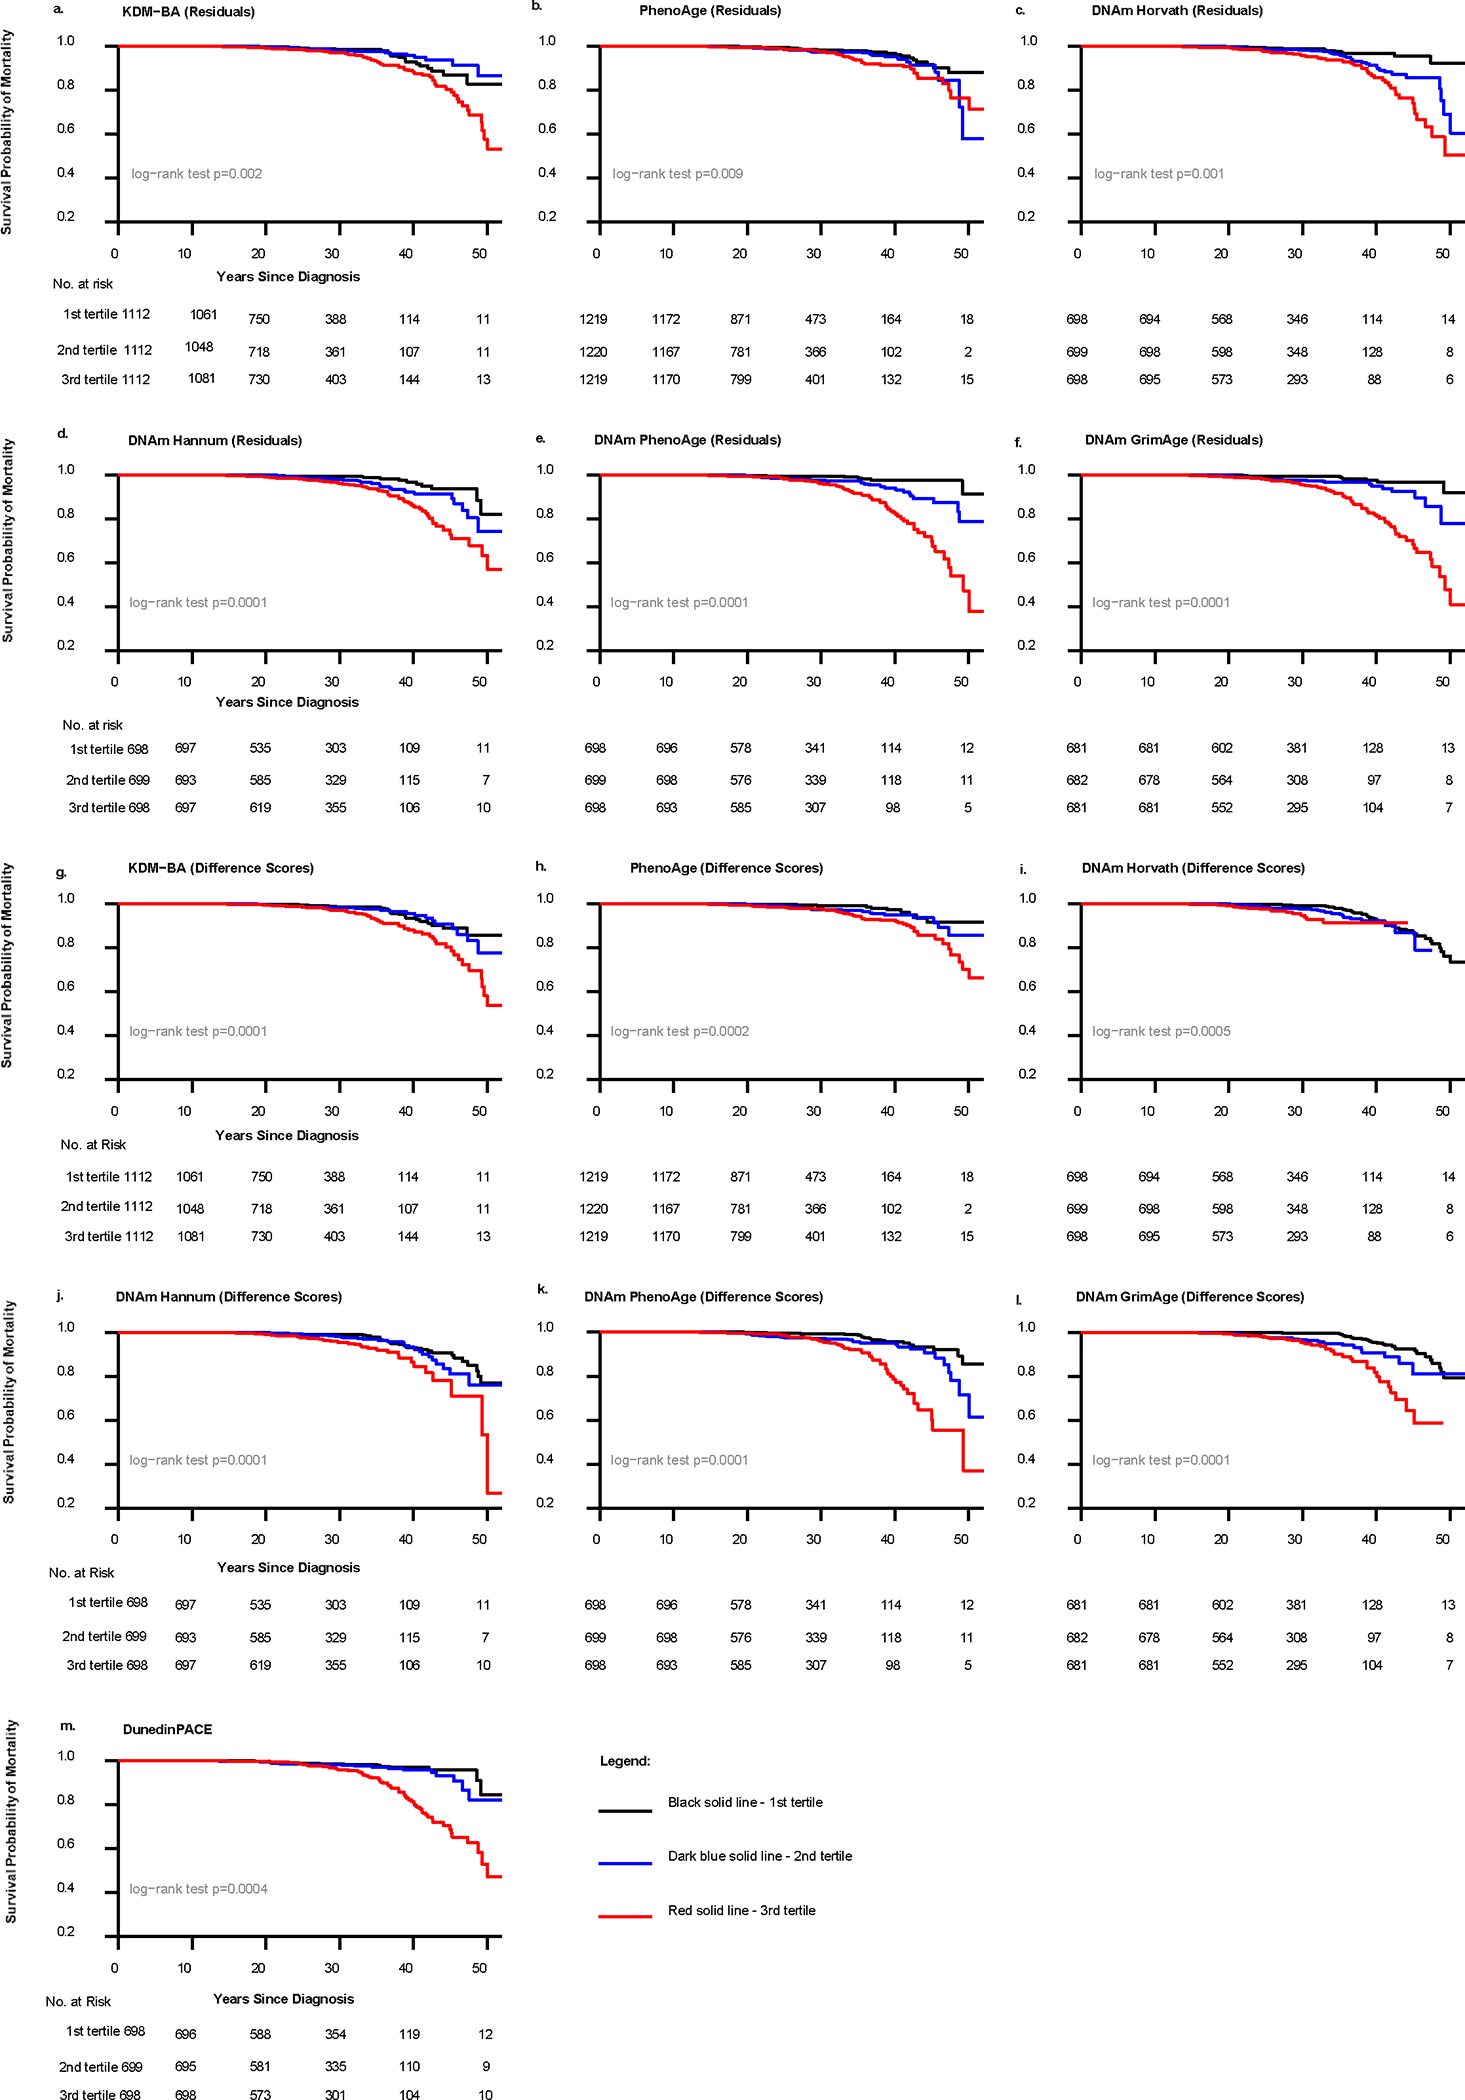
Kaplan-Meier survival curves of biological age acceleration and all-cause mortality among St. Jude Lifetime Cohort Study childhood cancer survivors (N = 4117). Note: all models are unadjusted and the sample sizes analyzed (n = (2,044, 3,658)) differ by biological age measure.
Discussion
In this large, retrospective cohort of adult survivors of childhood cancer, we found consistent evidence of biological age acceleration in comparison to community and NHANES III controls. Survivors measured 0.6–6.44 years biologically older compared to community and NHANES III controls and aged 5–16 years older than expected for individuals of the same chronological age at the population level. We also showed survivors aged 5% faster per year than SJLIFE controls, as measured by DunedinPACE. Survivors who were biologically older (measured by KDM-BA, PhenoAge, Hannum’s clock, Horvath’s clock, DNAmPhenoAge, GrimAge) and aging faster (DunedinPACE) had increased risks of frailty and premature mortality over 26.5 years of follow- up. Together, the strength of the associations and the consistency of the findings across seven measures of biological age suggest that epigenetic and physiologic composite measures of biological age may serve as predictive biomarkers of accelerated aging phenotypes (i.e., frailty, accelerated all-cause mortality, and selectively, SMN mortality) in adult survivors of childhood cancer. In addition, the longitudinal collection of physiology-based biological aging measures and the inclusion of the DunedinPACE measure, a measure of the speed of biological aging, allowed us to establish that adult survivors of childhood cancer are aging faster and that specific cancer types and treatments are associated with accelerated aging trajectories, potentially identifying critical opportunities to intervene to prevent future excess aging.
Our findings expand on those from a prior study that reported older DNAmPhenoAge in cancer survivors compared to community controls16 and illustrates that across a broad array of DNAm and physiology-based measures of biological aging, survivors of childhood cancer appear to be biologically older and aging more rapidly than adults with no cancer history. Moreover, our findings link accelerated biological aging with frailty and shorter lifespan. Together with a growing number of studies documenting altered hallmarks of aging12–19 and accelerated aging phenotypes in cancer survivors4,5,21,22, our findings advance the hypothesis that survivors experience shorter healthspan and lifespan due to a combination of disease and its treatment accelerating biological aging processes.
Accelerated biological aging trajectories were most pronounced for HL, NHL, Wilms tumor, and CNS tumors, which is likely due to the intensive treatment regimens utilized for cure. Previous studies report that survivors of HL and CNS tumors are at the highest risk for frailty compared to survivors of other cancers5,23. Wilms tumor and NHL historically used intensive treatment regimens, and these findings may reflect cohort effects, as treatments and regimens have changed in recent years. Another explanation is that the physiology-based measures include blood chemistries, such as blood urea nitrogen and creatinine, which are highly affected by nephrectomy, a common surgery for Wilms Tumor. Therefore, these measures may be more sensitive to the aging caused by Wilms tumor-associated treatment.
Our study adds to the literature by demonstrating that exposure to vinca alkaloid chemotherapy and HCT leads to faster biological aging trajectories using physiology-based metrics. Microtubule-destabilizing agents, including vinca alkaloid chemotherapeutic agents, have been associated with cardiotoxicity24,25 and epigenetic alterations, a hallmark of aging. HCT is associated with accelerated aging phenotypes, including high rates of frailty, severe/life- threatening conditions, and functional limitations21,24 and has been linked to the aging hallmarks of telomere attrition and stem cell exhaustion25. Future work is needed to replicate our findings and to further understand whether dose modification or reduction of certain intensive therapies would reduce the onset of aging phenotypes.
Despite consistent findings across the seven measures, Hannum’s clock and Horvath’s clock (selectively) did not reach statistical significance for the biological age acceleration-frailty association, and the two physiology-based measures showed differing results for the trajectory analysis by cancer treatment and type. This suggests that some biological age measures may be less sensitive for detecting cancer and treatment-related aging. Further, certain measures may contain components that are biological sequelae of specific cancers or their treatments. Because the mechanisms of action that drive changes in the DNAm clocks and other composite biomarkers are not well understood, it remains unclear whether differential performance among the aging measures primarily reflects sensitivity to cancer/treatment-related aging or confounding.
At present, it remains unclear which biomarkers of aging are most appropriate for identifying cancer survivors at risk of accelerated aging. Comprehensive approaches, including those employed in our study, are needed to interrogate consistent signs of aging across multiple biomarkers in the same population to test the Reverse Geroscience Hypothesis. Improving risk prediction by developing biological aging algorithms specific to cancer survivors may be possible. For example, in addition to frailty and reduced lifespan, adult survivors of childhood cancer also experience markedly higher arterial stiffness26 and cognitive decline22. Augmenting biological age algorithms to capture this information may help improve risk prediction, as unmeasured system damage may underestimate true biological age acceleration estimates. Additionally, studies are needed to test the effectiveness and optimal timing of preventive interventions delivered to biologically older/faster-aging cancer survivors.
The strengths of this study include its incorporation of multiple measures of biological aging in a large cohort of adult survivors of childhood cancer with frailty and all-cause mortality outcomes. However, our study is not without limitations. At the time of this analysis, DNAm data were only available at one time point, and we could not assess trajectories of biological aging using the DNAm measures. In the trajectory analysis of physiology-based biological age by treatment type, other cancer survivors treated with anticancer therapies were used as the control group, which may have reduced our ability to detect differences. Second, the SJLIFE survivors were all treated at St. Jude Children’s Research Hospital (SJCRH) and may be different than survivors treated at other institutions with differing geographic catchment areas. We used NHANES III controls to partially address this limitation, although only data on physiology-based biological aging measures were available for this group. The smaller sample size for racial/ethnic minority groups, driven by the composition of the study population, limited our ability to conduct subgroup analyses by race/ethnicity. Future studies should determine if there are differences in biological aging and risk of frailty and mortality among survivors from historically underserved and underrepresented groups. CRP and cytomegalovirus were not included in the physiology- based biological aging measures; however, multiple organ systems are still represented in the calculations to reflect multisystem aging. Lastly, survivor bias may have underestimated the findings, as those with advanced-stage cancer and/or treated with more intensive therapies may have aged most rapidly and died before study enrollment.
In summary, we demonstrated that adult survivors of childhood cancer experience accelerated biological aging compared to cancer-free controls and that among survivors, biological age acceleration was associated with frailty and premature mortality. Moreover, these associations were consistent across seven measures of biological age, suggesting that these markers may be used to identify cancer survivors at risk for accelerated aging.
Methods
The SJLIFE protocol, biospecimen banking, and genomic study were approved by the St. Jude Institutional Review Board and participants provided written informed consent. Participants were compensated $150 US dollars per day when they completed their clinical assessment.
Study Participants and Setting
SJLIFE is a large, retrospective, observational cohort study of five-year or longer survivors of childhood cancer and community controls27,28. The study was initiated in 2007 with prospective follow-up of survivors and ongoing periodic assessment of medical outcomes and biospecimen collection. The participants in the current study were followed up through December 2018. All SJLIFE participants completed medical and laboratory assessments of their health conditions and a multi-item survey on demographics and health behaviors. Eligible SJLIFE participants were 18+ years of age, diagnosed with a primary malignancy at least five years prior, and were treated at SJCRH for cancer (mean age at diagnosis=8.62 years ± 5.67 years; mean age at evaluation= 35.08 ± 10.17 years). Community controls were selected from friends and non-first-degree relatives of former and current SJCRH patients and were frequency-matched on 5-year age blocks within each sex. Because the design is observational and not experimental, participants were not randomized or blinded to a condition. Sex was considered in the study’s design and was obtained by medical record abstraction.
A total of 5338 participants from SJLIFE received a campus visit. Participants were included if they completed an on-campus visit and had physiology-based biomarker data (n=4,117 cancer survivors; and n=606 community controls) and DNAm data (n=2,095 survivors and n=282 controls) (Fig. 3). A subset of survivors had three or more campus visits and were included in biological age trajectory analyses (n=1,042). The average follow-up of survivors was 26.5 years ± 10.37 years from cancer diagnosis; controls were not followed prospectively. Additionally, because several biological age measures were trained in NHANES samples29,30 and SJLIFE survivors represent diverse geographic locations, we compared survivors to NHANES III participants (1988–1994)31 who were 18 years and older, self-reported no history of cancer and had physiology-based biological age data available (n=16,421). NHANES III epigenetic data were not publicly available at the time of writing and, therefore, were not included.
Fig. 3:
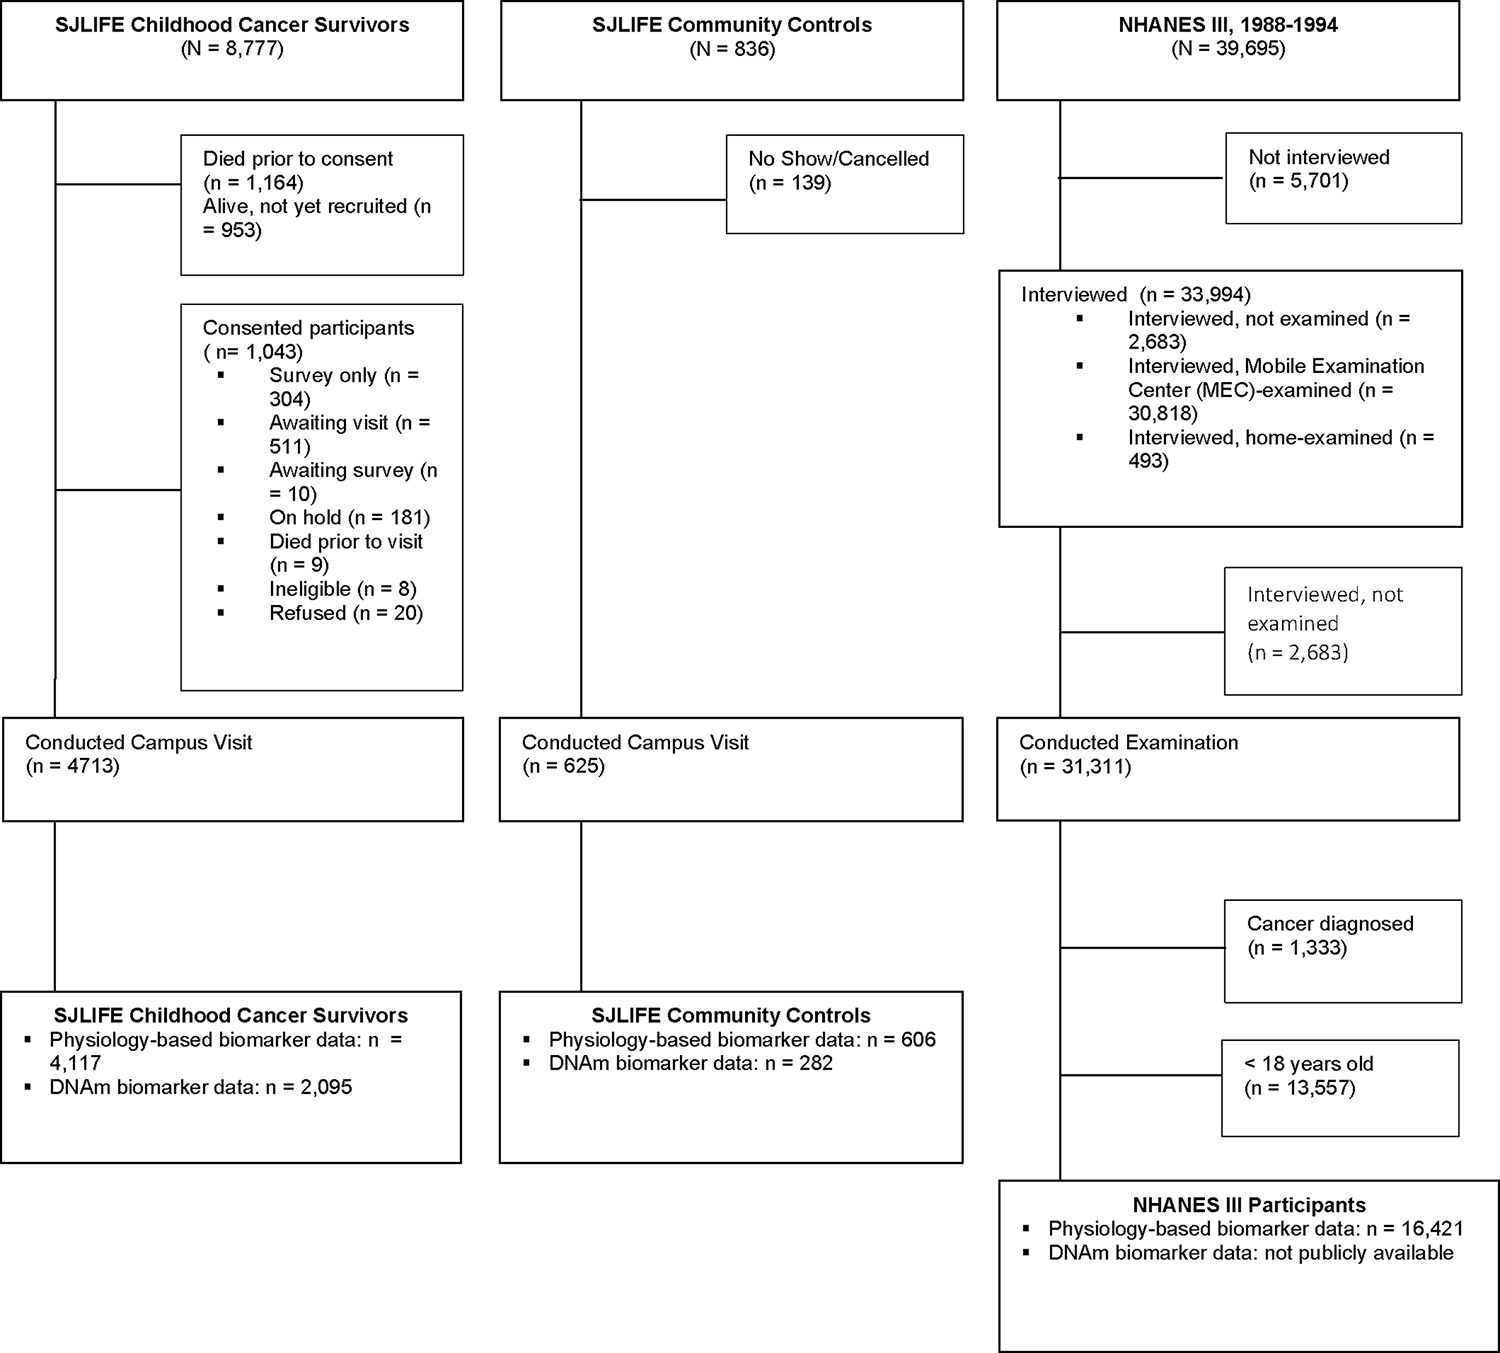
Consort diagram of the St. Jude Lifetime (SJLIFE) Cohort Study childhood cancer survivors (N = 8,777) and community controls (N = 836), and the National Health and Nutrition Examination Survey (NHANES) III (N = 39,695) study samples.
Measures
Physiology-Based Measures of Biological Age
Supplementary Table 1 summarizes the differences among measures of biological age. The Klemera-Doubal Method Biological Age (KDM-BA) algorithm32 measures biological age as the age at which a person’s physiology would be normal in a reference population. We implemented KDM-BA following the approach of Levine and colleagues29, including eight of the original ten biomarkers in their algorithm (albumin, alkaline phosphatase, blood urea nitrogen, creatinine, forced expiratory volume in one second (FEV1), glycated hemoglobin (HbA1C,) systolic blood pressure, and total cholesterol; C-reactive protein and cytomegalovirus optical density were not available in the SJLIFE cohort). 316 The Phenotypic Age (PhenoAge) algorithm30,33 measures the biological age at which a person’s predicted mortality risk would be approximately normal in a reference population. We implemented PhenoAge using seven of the original nine biomarkers (albumin, alkaline phosphatase, creatinine, lymphocyte percent, mean cell volume, and red cell distribution width; we substituted HbA1C for glucose; C-reactive protein and white blood cell count were not available in SJLIFE).
DNAm Measures of Biological Age
Epigenetic age and epigenetic age acceleration was calculated for SJLIFE cancer survivors and community controls, (n = 2,095 survivors and n = 282 controls) whose DNA extraction was completed with the same protocol in the Computational Biology Genomic Laboratory at St. Jude Children’s Research Hospital. Genome-wide methylation data were generated using the Infinium Methylation EPIC BeadChip array (Illumina, San Diego, CA, USA) on the whole blood-derived DNA.34 Genomic DNA (250 ng) was extracted from blood samples according to standard procedures as described in the previous study.16 The extracted DNA bisulfite was treated using the Zymo EZ DNA Methylation Kit (ZYMO RESEARCH, Irvine, CA) with the following thermos-cycling conditions: 16 cycles: 95°C for 30 sec, 50°C for 1 hour. After bisulfite treatment, DNA samples were desulphonated, column purified, then eluted using 12 ul of elution buffer (Zymo Research). After elution, the entire bisulfite-treated DNA was processed using the Illumina Infinium Methylation Assay including hybridization to HumanMethylation850K EPIC BeadChips, single base extension assay, staining and scanning using the Illumina iScan system according to the manufacturer’s protocol.
The raw intensity data (IDAT files) were analyzed using Illumina Genome Studio software to compute the β-values (range = 0–1), to describe the methylation level of a specific CpG site. Quality control was conducted to identify and remove samples and probes with low quality. Probes were excluded if detection rates were <95% with a detection P<0.01 across all samples (or with SNPs at CpG sites), or if samples had low call rates (<95% probes with a detection P<0.01). Cross-reactive and non-specific probes were also excluded from downstream analyses.
DNAm Clocks.
We measured biological age from DNAm data using four DNAm clock algorithms: Horvath’s clock35, Hannum’s clock36, DNAmPhenoAge33, and GrimAge37. The Horvath and Hannum clocks were developed to predict chronological age from DNAm data. These clocks are referred to as “First Generation” and are defined as the age at which a person’s methylome would be normal in a reference population. The DNAmPhenoAge and GrimAge clocks were developed to predict mortality risk from DNAm data. The DNAmPhenoAge clock was developed by modeling the physiology based PhenoAge from DNAm data in the InCHIANTI cohort33. The GrimAge clock was first developed using DNAm predictors of a panel of blood proteins and smoking history and then modeling mortality risk from the DNAm predictors in the Framingham Heart Study Offspring cohort37. DNAmPhenoAge and GrimAge are referred to as “Second Generation” clocks, and they measure biological age as the age at which a person’s DNAm-predicted risk of mortality would be normal in a reference population.
DunedinPACE. DunedinPACE is a DNAm measure of the rate of decline in system integrity38. DunedinPACE was developed by modeling a measure of the pace of aging, a composite of the rates of change in 19 biomarkers of organ system integrity measured over two decades39, from DNAm data in the Dunedin Study birth cohort40. Thus, DunedinPACE can be interpreted as whether an individual is biologically aging faster or slower (i.e., the speed of biological aging), whereas the other measures aim to assess how biologically old or young an individual is.
Cancer Type and Treatment Exposure
SJLIFE includes individuals diagnosed with any childhood cancer histology. Detailed information about cancer and cancer treatment exposures was abstracted by trained research staff using a structured protocol, as previously described27,28.
All-Cause and Cause-Specific Mortality
Vital status was assessed via linkage to the National Death Index to obtain all-cause, recurrence-, and subsequent malignant neoplasm (SMN)-specific mortality.
Frailty
Frailty was assessed at the first campus visit and defined by three or more of low lean muscle mass (assessed by DXA scan), self-reported exhaustion (self-reported using the SF-36 vitality subscale), muscle weakness (defined by handgrip strength), slow walking speed (assessed by a 15-foot walk test), and low energy expenditure (estimated using a modified form of the NHANES physical activity questionnaire to calculate calories expended per week) using a modified version of the Fried Frailty Index41. Except for exhaustion, all thresholds for abnormal were sex-specific (Supplementary Table 11). Frailty components were summed to create a score and classified as 0=robust, 1–2=pre-frail, and 3–5=frail.
Psychosocial and Behavioral Characteristics
Depression (yes/no), smoking status (never/current/former), physical activity (≥150 minutes vs. <150 minutes per week of moderate-intensity physical activity)42, and alcohol use (none/moderate vs. risky, defined as ≥5 drinks for males or ≥4 drinks for females on at least 1 day in the past) were assessed via questionnaire and chosen based on their established associations with biological age in the general population30,43.
Statistical Analysis
The normality assumption was checked for analyses of descriptive statistics. One-way analysis of variance or t-tests were conducted when the normality was not violated. Non-parametric methods (Wilcoxon rank sum test or Kruskal-Wallis test) were used when the normality violated. Outliers were detected and excluded from linear regression models (<2%) to meet the normality assumptions. The proportional hazards assumptions for mortality analyses by Cox regression models were assessed with Kolmogorov-type supremum tests and stratified Cox regression models were used when the proportional assumption was violated. No statistical methods were used to pre-determine sample sizes, but our sample sizes are similar to those reported in previous publications.16 Generalized estimating equations were used to estimate trajectories of physiology-based biological age by cancer type and treatment history among survivors with three or more waves of data, adjusting for chronological age. Trajectories of biological age by cancer type were modeled separately, while trajectories by cancer treatment were modeled together to account for other treatment exposures. Biological age acceleration was estimated using two methods: 1) by regressing biological age measures on chronological age and computing residual values, and 2) by calculating difference scores for each biological age measure by subtracting chronological age from the computed clock ages. For DunedinPACE, the original scores were used because this measure is an estimate of the pace of aging, not an age.44 Linear regression was used to test cross-sectional differences in biological age acceleration between survivors and controls. Multinomial logistic regression was used to test cross-sectional associations between tertiles of biological age acceleration (reference group=tertile 1) and frailty (reference group=robust).
For mortality outcomes, follow-up started five years from the time of diagnosis and ended at the date of death or censoring (September 2009-December 2018). Kaplan-Meier survival curves were used to illustrate unadjusted all-cause mortality outcomes. Cox regression models were used to test associations of biological age acceleration tertiles with all-cause mortality. Cause- specific mortality was assessed using Fine and Gray models using the proportional sub-distribution hazard function. The proportional hazards assumption was tested, and the hazard ratios (HR) were estimated using stratified Cox regression when the hazard assumption was violated. We conducted three sets of nested models for frailty and mortality analyses for each biological age parameter. The first model covariates included age at diagnosis, race/ethnicity, and self-reported sex; the second model additionally adjusted for treatment type (chemotherapy, radiotherapy, surgery); and the third model included model 1+2 covariates and BMI, depression, smoking, alcohol use, and physical activity. Sex-specific analyses were not conducted because there was no specific, a priori scientific rationale for conducting such analyses. Analyses were conducted in R (version 4.2.2) and SAS (version 9.4); all p-values are two-sided.
Supplementary Material
Acknowledgments
Research reported in this publication was supported by the National Cancer Institute of the National Institutes of Health under award numbers U01CA195547 and P30CA021765, the American Lebanese Syrian Associated Charities, and a National Cancer Institute post-doctoral Cancer Research Training Award fellowship awarded to JLG.
Footnotes
Competing Interests
We declare no competing interests. This work is solely the authors’ responsibility and does not necessarily represent the official views of the National Cancer Institute or the National Institutes Health.
Reporting summary
Further information on research design is available in the Nature Portfolio Reporting Summary linked to this article.
Code Availability
The code supporting this study’s findings is publicly available online at https://zenodo.org/records/10035257.
Data Availability
The dataset supporting the findings of this study has been deposited in Zenodo and is publicly available online at https://zenodo.org/records/10035257 and https://stjude.cloud. Source data for Figs. 1 and 2 have been provided as Source Data files. The DNA methylation data used in this study are accessible at the NCBI GEO website under the accession number GSE197674 for survivors and GSE197676 for controls. All other data supporting the findings of this study are available from the co-corresponding authors on reasonable request.
References
- 1.Howlader N NA, Krapcho M, Miller D, Bishop K, Kosary CL, Yu M, Ruhl J, Tatalovich Z, Mariotto A, Lewis DR, Chen HS, Feuer EJ, Cronin KA SEER Cancer Statistics Review, 1975–2014, <https://seer.cancer.gov/csr/1975_2014/> ( 2017). [Google Scholar]
- 2.Henderson TO, Ness KK & Cohen HJ Accelerated Aging Among Cancer Survivors: From Pediatrics to Geriatrics. American Society of Clinical Oncology educational book. American Society of Clinical Oncology. Annual Meeting, e423–e430 (2014). 10.14694/EdBook_AM.2014.34.e423 [DOI] [PubMed] [Google Scholar]
- 3.Guida JL et al. Measuring Aging and Identifying Aging Phenotypes in Cancer Survivors. J Natl Cancer Inst 111, 1245–1254 (2019). 10.1093/jnci/djz136 [DOI] [PMC free article] [PubMed] [Google Scholar]
- 4.Ness KK & Wogksch MD Frailty and aging in cancer survivors. Transl Res 221, 65–82 (2020). 10.1016/j.trsl.2020.03.013 [DOI] [PMC free article] [PubMed] [Google Scholar]
- 5.Hayek S et al. Prevalence and Predictors of Frailty in Childhood Cancer Survivors and Siblings: A Report From the Childhood Cancer Survivor Study. Journal of clinical oncology: official journal of the American Society of Clinical Oncology 38, 232–247 (2020). 10.1200/JCO.19.01226 [DOI] [PMC free article] [PubMed] [Google Scholar]
- 6.Suh E et al. Late mortality and chronic health conditions in long-term survivors of early-adolescent and young adult cancers: a retrospective cohort analysis from the Childhood Cancer Survivor Study. Lancet Oncol 21, 421–435 (2020). 10.1016/S1470-2045(19)30800-9 [DOI] [PMC free article] [PubMed] [Google Scholar]
- 7.Yeh JM et al. Life Expectancy of Adult Survivors of Childhood Cancer Over 3 Decades. JAMA Oncol 6, 350–576 357 (2020). 10.1001/jamaoncol.2019.5582 [DOI] [PMC free article] [PubMed] [Google Scholar]
- 8.Kohanski RA et al. Reverse geroscience: how does exposure to early diseases accelerate the age-related decline in health? Ann N Y Acad Sci 1386, 30–44 (2016). 10.1111/nyas.13297 [DOI] [PubMed] [Google Scholar]
- 9.Lopez-Otin C, Blasco MA, Partridge L, Serrano M & Kroemer G The Hallmarks of Aging. Cell 153, 1194–1217 (2013). 10.1016/j.cell.2013.05.039 [DOI] [PMC free article] [PubMed] [Google Scholar]
- 10.Margolick JB & Ferrucci L Accelerating aging research: how can we measure the rate of biologic aging? Exp Gerontol 64, 78–80 (2015). 10.1016/j.exger.2015.02.009 [DOI] [PMC free article] [PubMed] [Google Scholar]
- 11.Sulicka-Grodzicka J et al. Low-grade chronic inflammation and immune alterations in childhood and adolescent cancer survivors: A contribution to accelerated aging? Cancer Med 10, 1772–1782 (2021). 10.1002/cam4.3788 [DOI] [PMC free article] [PubMed] [Google Scholar]
- 12.Ariffin H et al. Young adult survivors of childhood acute lymphoblastic leukemia show evidence of chronic inflammation and cellular aging. Cancer 123, 4207–4214 (2017). 10.1002/cncr.30857 [DOI] [PubMed] [Google Scholar]
- 13.Daniel S et al. T cell epigenetic remodeling and accelerated epigenetic aging are linked to long-term immune alterations in childhood cancer survivors. Clin Epigenetics 10, 138 (2018). 10.1186/s13148-018-0561-5 [DOI] [PMC free article] [PubMed] [Google Scholar]
- 14.Gallicchio L, Gadalla SM, Murphy JD & Simonds NI The Effect of Cancer Treatments on Telomere Length: A Systematic Review of the Literature. J Natl Cancer Inst 110, 1048–1058 (2018). 10.1093/jnci/djy189 [DOI] [PMC free article] [PubMed] [Google Scholar]
- 15.Gramatges MM et al. Telomere content and risk of second malignant neoplasm in survivors of childhood cancer: a report from the Childhood Cancer Survivor Study. Clin Cancer Res 20, 904–911 (2014). 10.1158/1078-0432.CCR-13-2076 [DOI] [PMC free article] [PubMed] [Google Scholar]
- 16.Qin N et al. Epigenetic Age Acceleration and Chronic Health Conditions among Adult Survivors of Childhood Cancer. J Natl Cancer Inst (2020). 10.1093/jnci/djaa147 [DOI] [PMC free article] [PubMed] [Google Scholar]
- 17.Smitherman AB et al. Accelerated aging among childhood, adolescent, and young adult cancer survivors is evidenced by increased expression of p16(INK4a) and frailty. Cancer 126, 4975–4983 (2020). 10.1002/cncr.33112 [DOI] [PMC free article] [PubMed] [Google Scholar]
- 18.Song N et al. Shortened Leukocyte Telomere Length Associates with an Increased Prevalence of Chronic Health Conditions among Survivors of Childhood Cancer: A Report from the St. Jude Lifetime Cohort. Clin Cancer Res 26, 2362–2371 (2020). 10.1158/1078-0432.CCR-19-2503 [DOI] [PMC free article] [PubMed] [Google Scholar]
- 19.Walsh KM Telomere Attrition in Childhood Cancer Survivors. Clin Cancer Res 26, 2281–2283 (2020). 10.1158/1078-0432.CCR-20-0380 [DOI] [PubMed] [Google Scholar]
- 20.Ness KK et al. Premature Physiologic Aging as a Paradigm for Understanding Increased Risk of Adverse Health Across the Lifespan of Survivors of Childhood Cancer. Journal of clinical oncology: official journal of the American Society of Clinical Oncology 36, 2206–2215 (2018). 10.1200/jco.2017.76.7467 [DOI] [PMC free article] [PubMed] [Google Scholar]
- 21.Armenian SH et al. Long-term health-related outcomes in survivors of childhood cancer treated with HSCT versus conventional therapy: a report from the Bone Marrow Transplant Survivor Study (BMTSS) and Childhood Cancer Survivor Study (CCSS). Blood 118, 1413–1420 (2011). 10.1182/blood-2011-01-331835 [DOI] [PMC free article] [PubMed] [Google Scholar]
- 22.Williams AM et al. Physiologic Frailty and Neurocognitive Decline Among Young-Adult Childhood Cancer Survivors: A Prospective Study From the St Jude Lifetime Cohort. Journal of clinical oncology: official journal of the American Society of Clinical Oncology 39, 3485–3495 (2021). 10.1200/JCO.21.00194 [DOI] [PMC free article] [PubMed] [Google Scholar]
- 23.Ness KK et al. Physiologic frailty as a sign of accelerated aging among adult survivors of childhood cancer: a report from the St Jude Lifetime cohort study. Journal of clinical oncology: official journal of the American Society of Clinical Oncology 31, 4496–4503 (2013). 10.1200/JCO.2013.52.2268 [DOI] [PMC free article] [PubMed] [Google Scholar]
- 24.Arora M et al. Physiologic Frailty in Nonelderly Hematopoietic Cell Transplantation Patients: Results From the Bone Marrow Transplant Survivor Study. JAMA Oncol 2, 1277–1286 (2016). 10.1001/jamaoncol.2016.0855 [DOI] [PMC free article] [PubMed] [Google Scholar]
- 25.Cupit-Link MC et al. Biology of Premature Ageing in Survivors of Cancer. ESMO open 2, e000250–e000258 (2017). 10.1136/esmoopen-2017-000250 [DOI] [PMC free article] [PubMed] [Google Scholar]
- 26.Arnold N et al. Promotion of Arterial Stiffness by Childhood Cancer and Its Characteristics in Adult Long-Term Survivors. J Am Heart Assoc 10, e015609 (2021). 10.1161/JAHA.119.015609 [DOI] [PMC free article] [PubMed] [Google Scholar]
- 27.Howell CR et al. Cohort Profile: The St. Jude Lifetime Cohort Study (SJLIFE) for paediatric cancer survivors. Int J Epidemiol 50, 39–49 (2021). 10.1093/ije/dyaa203 [DOI] [PMC free article] [PubMed] [Google Scholar]
- 28.Hudson MM et al. Prospective medical assessment of adults surviving childhood cancer: study design, cohort characteristics, and feasibility of the St. Jude Lifetime Cohort study. Pediatr Blood Cancer 56, 825–836 (2011). 10.1002/pbc.22875 [DOI] [PMC free article] [PubMed] [Google Scholar]
- 29.Levine ME Modeling the rate of senescence: can estimated biological age predict mortality more accurately than chronological age? J Gerontol A Biol Sci Med Sci 68, 667–674 (2013). 10.1093/gerona/gls233 [DOI] [PMC free article] [PubMed] [Google Scholar]
- 30.Liu Z, Kuo PL, Horvath S, Crimmins E, Ferrucci L & Levine M A new aging measure captures morbidity and mortality risk across diverse subpopulations from NHANES IV: A cohort study. PLoS Med 15, e1002718 (2018). 10.1371/journal.pmed.1002718 [DOI] [PMC free article] [PubMed] [Google Scholar]
- 31.Statistics, N. C. f. H. National Health and Nutrition Examination Survey Data, <https://wwwn.cdc.gov/nchs/nhanes/nhanes3/default.aspx> (1988–1994).
- 32.Klemera P & Doubal S A New Approach to the Concept and Computation of Biological Age. Mech Ageing Dev 127, 240–248 (2006). 10.1016/j.mad.2005.10.004 [DOI] [PubMed] [Google Scholar]
- 33.Levine ME et al. An Epigenetic Biomarker of Aging for Lifespan and Healthspan. Aging 10, 573–591 (2018). 10.18632/aging.101414 [DOI] [PMC free article] [PubMed] [Google Scholar]
- 34.Wang Z et al. Genetic Risk for Subsequent Neoplasms Among Long-Term Survivors of Childhood Cancer. Journal of clinical oncology: official journal of the American Society of Clinical Oncology 36, 2078–2087 (2018). 10.1200/JCO.2018.77.8589 [DOI] [PMC free article] [PubMed] [Google Scholar]
- 35.Horvath S & Raj K DNA Methylation-based Biomarkers and the Epigenetic Clock Theory of Ageing. Nat Rev Genet 19, 371–384 (2018). 10.1038/s41576-018-0004-3 [DOI] [PubMed] [Google Scholar]
- 36.Hannum G et al. Genome-wide methylation profiles reveal quantitative views of human aging rates. Mol Cell 49, 359–367 (2013). 10.1016/j.molcel.2012.10.016 [DOI] [PMC free article] [PubMed] [Google Scholar]
- 37.Lu AT. et al. DNA methylation GrimAge strongly predicts lifespan and healthspan. Aging 11, 303–327 (2019). 10.18632/aging.101684 [DOI] [PMC free article] [PubMed] [Google Scholar]
- 38.Belsky DW et al. Quantification of biological aging in young adults. Proc Natl Acad Sci U S A 112, E4104–652 4110 (2015). 10.1073/pnas.1506264112 [DOI] [PMC free article] [PubMed] [Google Scholar]
- 39.Elliott ML et al. Disparities in the pace of biological aging among midlife adults of the same chronological age have implications for future frailty risk and policy. Nat Aging 1, 295–308 (2021). 10.1038/s43587-021-00044-4 [DOI] [PMC free article] [PubMed] [Google Scholar]
- 40.Belsky DW et al. DunedinPACE, a DNA methylation biomarker of the pace of aging. Elife 11 (2022). 10.7554/eLife.73420 [DOI] [PMC free article] [PubMed] [Google Scholar]
- 41.Fried LP et al. Frailty in older adults: evidence for a phenotype. J Gerontol A Biol Sci Med Sci 56, M146–M157 (2001). [DOI] [PubMed] [Google Scholar]
- 42.Piercy KL et al. The Physical Activity Guidelines for Americans. JAMA 320, 2020–2028 (2018). 10.1001/jama.2018.14854 [DOI] [PMC free article] [PubMed] [Google Scholar]
- 43.Levine ME & Crimmins EM Is 60 the New 50? Examining Changes in Biological Age Over the Past Two Decades. Demography 55, 387–402 (2018). 10.1007/s13524-017-0644-5 [DOI] [PMC free article] [PubMed] [Google Scholar]
- 44.Higgins-Chen AT et al. A computational solution for bolstering reliability of epigenetic clocks: Implications for clinical trials and longitudinal tracking. Nat Aging 2, 644–661 (2022). 10.1038/s43587-022-00248-2 [DOI] [PMC free article] [PubMed] [Google Scholar]
Associated Data
This section collects any data citations, data availability statements, or supplementary materials included in this article.
Supplementary Materials
Data Availability Statement
The dataset supporting the findings of this study has been deposited in Zenodo and is publicly available online at https://zenodo.org/records/10035257 and https://stjude.cloud. Source data for Figs. 1 and 2 have been provided as Source Data files. The DNA methylation data used in this study are accessible at the NCBI GEO website under the accession number GSE197674 for survivors and GSE197676 for controls. All other data supporting the findings of this study are available from the co-corresponding authors on reasonable request.