

Abstract
Airway hillocks are stratified epithelial structures of unknown function1. Hillocks persist for months and harbor a unique population of basal stem cells that express genes associated with barrier function and cell adhesion. Hillock basal stem cells continually replenish overlying squamous barrier cells. They exhibit dramatically higher turnover than the abundant, largely quiescent classic pseudostratified airway epithelium. Hillocks resist a remarkably broad spectrum of injuries, including toxins, infection, acid, and physical injury because hillock squamous cells shield underlying hillock basal stem cells from injury. Hillock basal stem cells are capable of massive clonal expansion that is sufficient to resurface denuded airway, and eventually regenerate normal airway epithelium with each of its six component cell types. Hillock basal stem cells preferentially stratify and keratinize in the setting of retinoic acid signaling inhibition, a known cause of squamous metaplasia2,3. Indeed, we show that murine hillock expansion is the cause of vitamin A deficiency-induced squamous metaplasia. Finally, we identify human hillocks whose basal stem cells generate functional squamous barrier structures in culture. The existence of hillocks reframes our understanding of airway epithelial regeneration. Furthermore, we show that hillocks are one origin of “squamous metaplasia,” long thought to be a precursor of lung cancer.
Main:
We recently identified discrete islands of stratified KRT13-positive epithelial cells distributed within the classic pseudostratified airway epithelium 1. We named these structures hillocks since they occur as mounds of cells that arise from a layer of proliferating basal cells that, in contrast to the classic basal stem cells of the rest of the airway epithelium, express the squamous marker gene Krt13 1. However, the function of hillocks is unknown. Given their unique stratified structure, we hypothesized that hillocks could serve as injury-resistant reservoirs of a unique population of hillock basal stem cells.
We show that mouse and human hillock structures are broadly resistant to very diverse and severe injuries due to the presence of squamous barrier cells. These barrier cells protect a distinct population of rare basal stem cells that are capable of profound clonal expansion and the creation of a stratified barrier epithelium. Additionally, hillock basal stem cells that have resurfaced denuded airway epithelium, beyond the normal anatomic boundaries associated with hillocks, manifest plasticity and generate all six types of normal pseudostratified epithelial cells. Finally, we show that hillock expansion is the cause of one form of “squamous metaplasia”.
Hillocks are homeostatic stratified structures
We found that murine hillocks cover approximately 2.5% of the luminal surface of the trachea and are variably distributed at three typical locations: (1) over the junction between a cartilage ring and smooth muscle, (2) along the posterior membrane itself, (3) and laterally over the cartilage rings (Fig. 1A, Extended Data Fig. 1A–D).
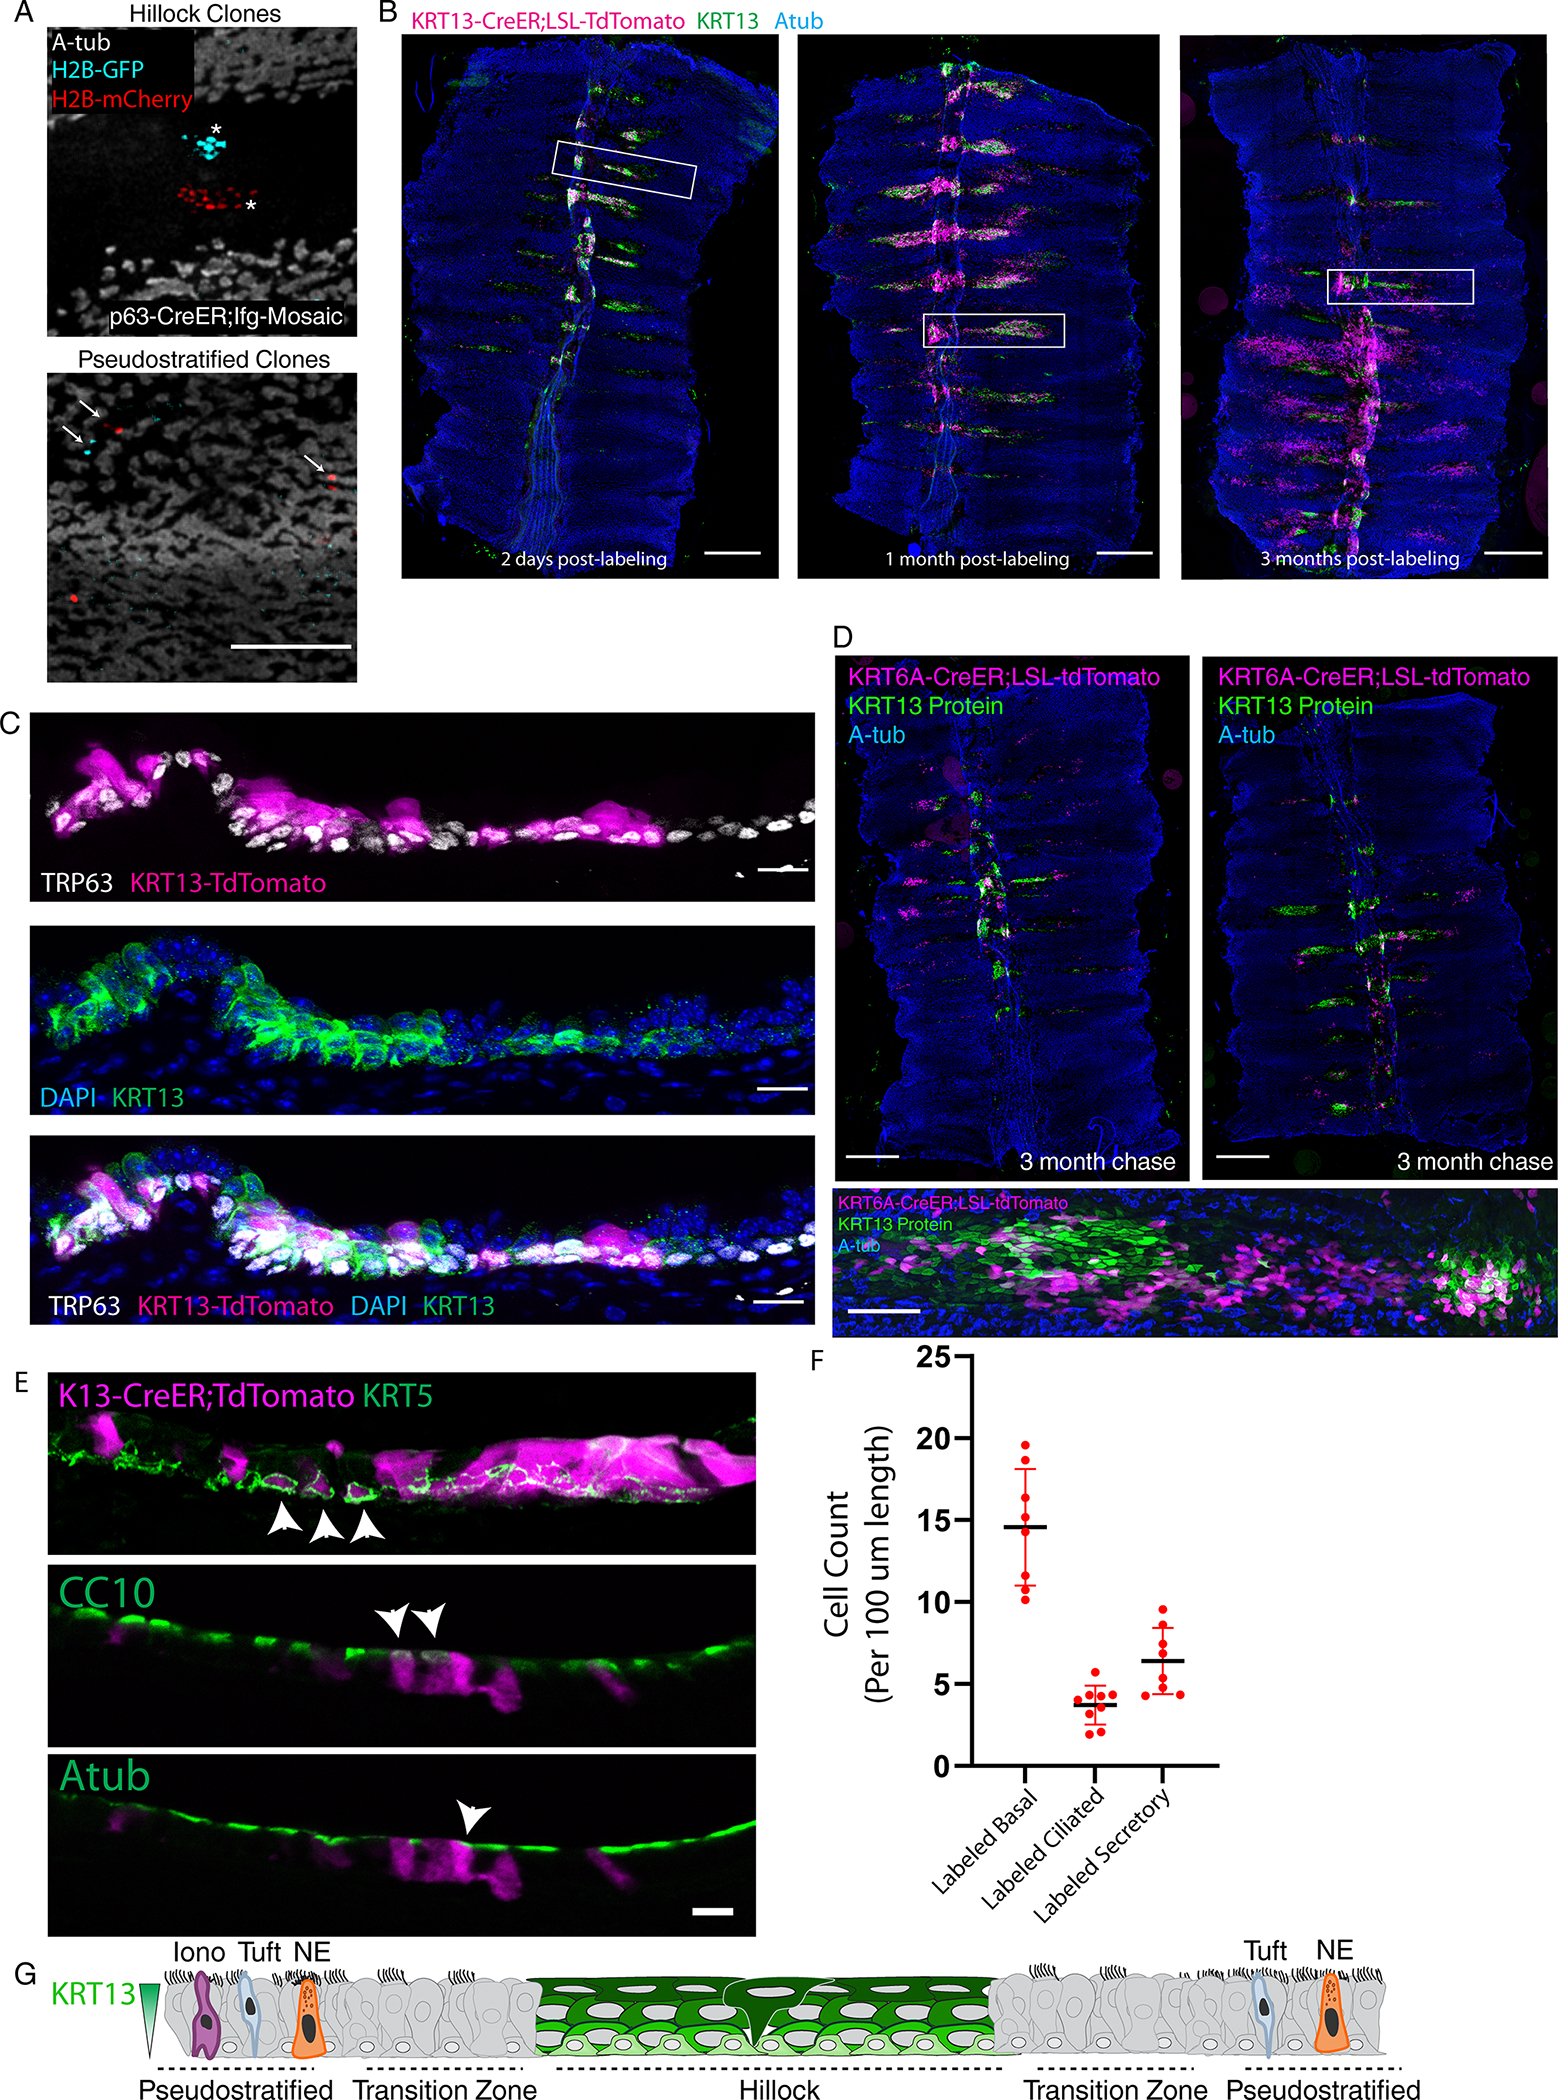
Fig.1. Hillocks are stratified structures with squamous luminal cells present in the homeostatic airway with dedicated basal stem cells.
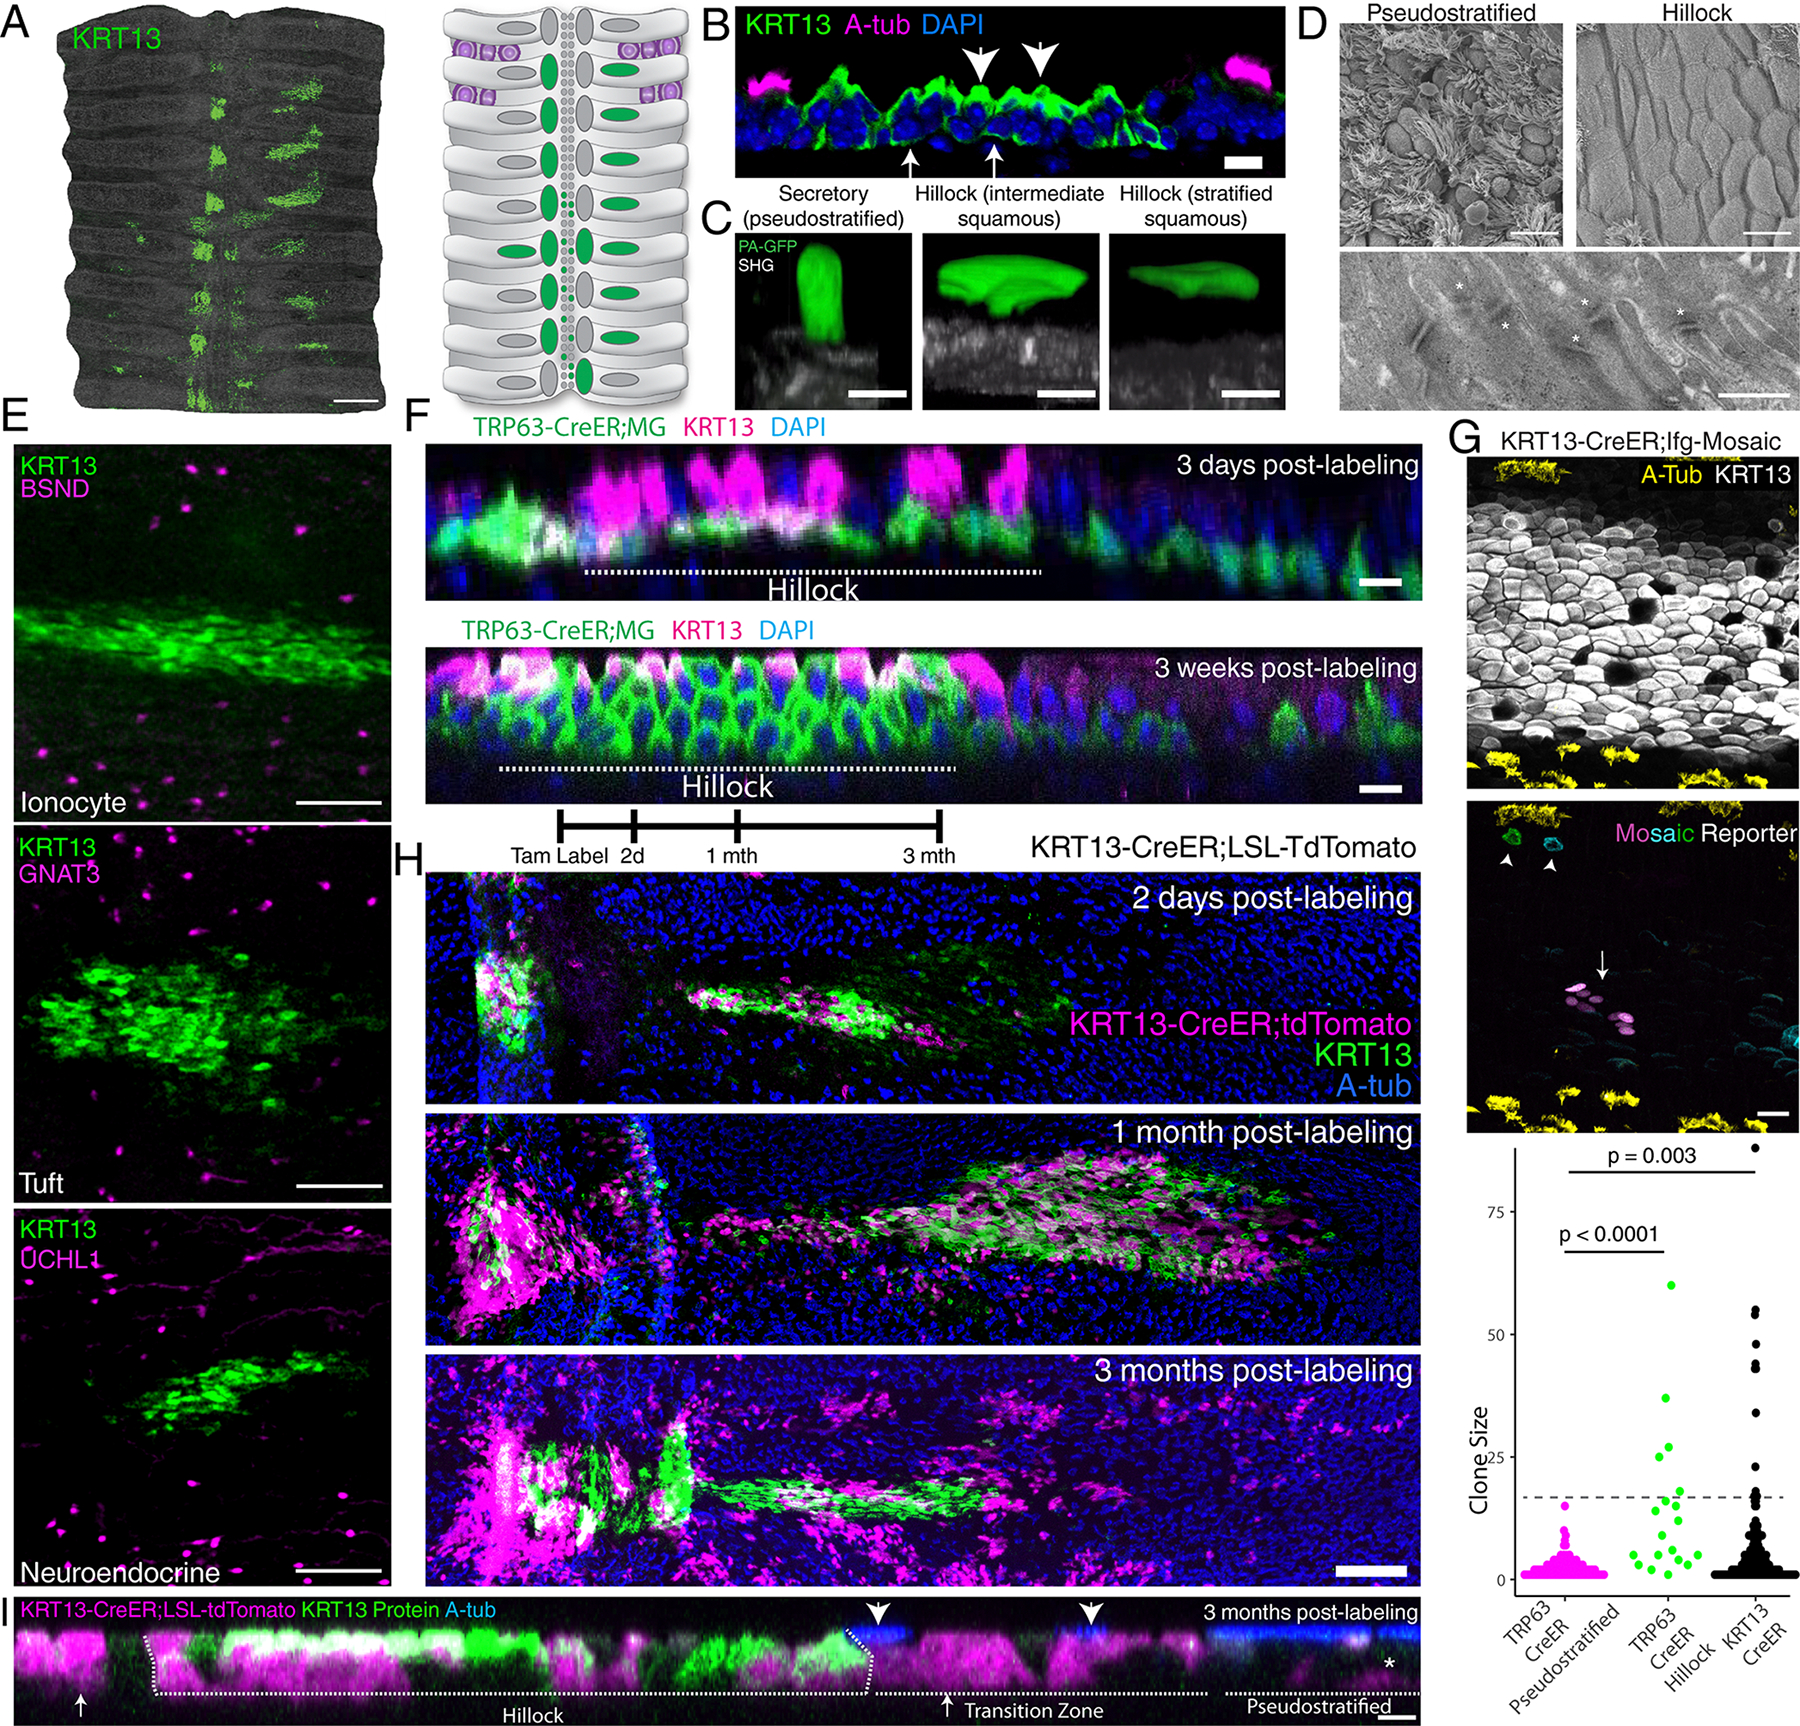
(A) KRT13 staining of mouse wholemount trachea and schematic. (B) Immunostaining of a hillock cryosection. Arrows: KRT13 (low) hillock basal cells. Arrowheads:KRT13 (high) luminal cells. (C) Single cell GFP photoactivation of a secretory cell, a hillock cell with basal foot process, and a fully stratified luminal hillock cell. Basement membrane as second harmonic generation (SHG). (D) Scanning electron microscopy of the surface of pseudostratified vs hillock epithelia (top) and transmission electron microscopy of the hillock junction, desmosomes marked by asterisk (bottom). (E) Immunostaining of hillocks and markers for rare ionocyte, tuft, and neuroendocrine cells. (F) Optical projection of TRP63-CreER lineage traces demonstrating rapid turnover of basal cells in hillock within 3 weeks. Replicated on three trachea. Dotted line: hillock region, adjacent pseudostratified epithelium. (G) 3 month chase of hillock basal cell clones. Immunostaining of KRT13 and acetylated tubulin delineate the hillock boundary (top). Arrow:large hillock clone; Arrowhead: single-cell clones found at the edge of the hillock (middle). Quantification of clone sizes from basal cell specific TRP63-CreER driver and hillock specific KRT13-CreER driver (bottom) (n=3 mice each, 125 TRP63 clones in pseudostratified epithelium (magenta), 96 TRP63 clones within hillocks(green), 226 KRT13 clones (black). Unpaired two-tailed t-test (H) KRT13-CreER hillock lineage tracing schema (top). Wholemount of hillocks 2 days, 1 month, and 3 months after labeling, showing persistence of lineage label within hillocks and new pools of circumferentially and laterally localized pseudostratified epithelium. (I) Optical projections at 3 month KRT13-CreER pulse-chase experiment showing hillock-derived cells differentiate into pseudostratified cells. Arrows:labeled secretory cells, arrowheads:labeled ciliated cells, asterisk:labeled basal cells. Scale bars 500 μm (A), 10μm (B, D top panels, F), 5 μm (C, I), 400 nm (D bottom), 100 μm (E), 20 μm (G)
The classic textbook feature of ciliated airway epithelium is pseudostratification, in which all epithelial cells maintain contact with the underlying basal lamina. However, hillocks appear to be stratified structures characterized by a gradient of KRT13 expression highest in basal cells and decreasing in luminal cells (Fig. 1A–B). Since squamous cells and stratification have historically been associated with injury and pre-cancerous squamous metaplasia, we sought to definitively establish whether bona fide squamous cells are present in the normal uninjured airway epithelium. Therefore, we employed a photo-activatable GFP (PA-GFP) to selectively label and image single hillock cells, so all their processes and contacts could be definitively identified4.
Hillocks possess squamous luminal cells
Hillocks meet the strict criterion for multilayer cell stratification and possess luminal cells that do not contact the basement membrane and are genuinely squamous (Fig. 1C, Supplementary Videos 1–2). Scanning electron microscopy of hillocks confirmed the presence of flat surface cells lacking cilia (Fig. 1D). Indeed, transmission electron microscopy revealed widespread cellular interdigitation and enrichment of desmosomal connections between hillock luminal cells (Fig. 1D, Extended Data Fig. 1E). Given the structural differences between hillocks and the surrounding pseudostratified epithelium, we next assessed the distribution of the remaining rare epithelial cell types that are characteristic of classic ciliated airway epithelium. To our surprise, we found that hillocks are rare cell deserts that are entirely devoid of ionocytes, tuft cells, and neuroendocrine cells (Fig. 1E, Extended Data Fig. 1F). Collectively, these findings suggested that the hillock is a barrier structure composed of stratified, tightly interlocking squamous cells sitting atop a layer of hillock basal stem cells. Furthermore, these findings establish that the presence of stratified squamous epithelium, long thought to be a metaplastic response to damage, is a characteristic of an uninjured airway.
To identify specific markers of hillock cells, we microdissected putative hillocks from live tissue and profiled the dissociated cells using plate-based SMART-seq for maximal depth and sensitivity (Extended Data Fig. 1G–H). In addition to Krt13, we identified a further set of genes whose expression is specific to hillock cells and absent in cells of the pseudostratified epithelium. Of note, this set of genes has been previously associated with squamous metaplasia (Extended Data Fig. 1I). Krt13, Krt6a, and Dsg3 mark both hillock basal and luminal cells, whereas Serpinb2 specifically marks hillock luminal cells (Extended Data Fig. 1I–K). The gene that best distinguishes hillock basal cells from hillock luminal cells is, in fact, the cardinal basal stem cell marker Trp63 (Extended Data Fig. 1I, K).
Hillocks house distinct basal stem cells
We used the TRP63-CreER driver to lineage label basal cells of both the pseudostratified and hillock epithelia. We found that within 3 weeks, the entire hillock compartment was lineage labeled, establishing that hillock luminal cells are rapidly replaced by underlying basal stem cells even during homeostasis, in direct contrast to the long-lasting luminal cells of the surrounding pseudostratified epithelium (Fig. 1F).
Given the low recovery of hillock cells in our targeted microdissection, we speculated that the enhanced barrier properties of the hillock prevented adequate cell dissociation. Indeed, we found that hillocks were surprisingly resistant to papain dissociation (Extended Data Fig. 2). To overcome this, we tested a variety of dissociation conditions, including dispase, pronase, and a complex mixture of enzymes targeting ECM components and adhesion complexes (Extended Data Fig. 2C). After this optimization, we used droplet based sequencing and found a significantly higher representation of hillock cells. In our original murine tracheal atlas, only 1.84% of profiled cells were confidently identified as hillock cells while in this new dataset, 14.9% were hillock cells. We confirmed that Krt13, Krt6a, Dsg3, and Serpinb2 were unique markers of hillock cells. GO pathway analyses revealed that hillock luminal cells were most highly enriched for genesets associated with the formation of a cornified envelope and intercellular junctions, while the hillock basal cells were most highly enriched for genesets associated with keratin and intermediate filaments (Extended Data Fig. 3A–D).
As we previously reported, hillock luminal cells express the secretory cell marker Scgb1a1 1. To assess whether these Scgb1a1+ hillock luminal cells are distinct from conventional secretory cells, we performed differential gene expression analysis directly comparing these two cell populations. Hillock luminal cells, highly enriched for genesets associated with cell adhesion, were distinct from secretory cells that were most highly enriched for genesets associated with ribosome biogenesis (Extended Data Fig. 3E). Since conventional secretory cells are characterized by their unique ability to functionally differentiate into mucus producing goblet cells, we next sought to assess whether hillock luminal cells could undergo this conversion. In order to specifically trace hillock-derived cells, we created a hillock-specific KRT13-CreER lineage driver mouse (Extended Data Fig. 4A–D). Using this new tool, we assessed whether hillock luminal cells would exhibit goblet cell differentiation following IL13 administration 5. They do not (Extended Data Fig. 4E–F).
Since secretory cells of the pseudostratified epithelium can dedifferentiate into stem cells 6, we next assessed whether hillock luminal cells possess such potential. We employed our KRT13-CreER driver to mark all hillock cells and sorted them into hillock basal and hillock luminal populations. We found that hillock luminal cells failed to dedifferentiate or proliferate in culture (Extended Data Fig. 4G). Taken together, luminal hillock squamous cells are seen to be a unique differentiated airway epithelial cell type.
We next turned our attention to hillock basal cells in order to establish whether hillock and pseudostratified basal stem cells display distinct attributes. We first performed pan-basal stem cell lineage labeling using a TRP63-CreER driver mouse bred to the ifgMosaic reporter to clonally label basal cells of both the hillock and the pseudostratified epithelium7,8. We then assessed whether the resulting basal stem cell-derived clones that occurred within hillocks were different from those clones that arose within the pseudostratified epithelium. Three months after lineage labeling, basal stem cells located within pseudostratified epithelium produced clones containing less than 15 cells (2.5 cells on average). Only basal stem cells found within the hillock produced large clones, containing as many as 60 cells (7.5 cells on average) (Fig. 1G, Extended Data Fig. 5A). To assess whether these basal stem cell-derived large clones were produced by hillock basal cells, we used our hillock-specific KRT13-CreER driver bred to the same ifgMosaic reporter and established that KRT13+ hillock cells were indeed the source of large clones (Fig. 1G). Thus, hillock basal stem cells display a distinct replicative behavior when compared to the pool of largely quiescent pseudostratified basal stem cells.
We then tested whether hillocks were stable structures using both our new KRT13-CreER driver line as well as a pre-existing KRT6A-CreER driver line. Hillocks retained label and were stable for 3 months (Fig. 1H, Extended Data Fig. 5B–D). Label was also identified in a sparsely ciliated transition zone immediately flanking hillocks (Fig. 1H, Extended Data Fig. 5B–D). Surprisingly, lineage labeling extended beyond the transition zone into the surrounding pseudostratified epithelium. Indeed, label was identified in all three common epithelial cell types of the pseudostratified epithelium (Fig. 1I, Extended Data Fig. 5E–F). In aggregate, hillocks are persistent, stratified squamous tissue structures devoid of rare epithelial cell types, and they occur as small islands of homogeneous epithelium embedded within the much more abundant rare cell-containing pseudostratified epithelium that is classically associated with the uninjured airway. Furthermore, hillock basal stem cells are uniquely proliferative and express low levels of genes associated with squamous differentiation. During homeostasis, they primarily contribute to a high-turnover population of squamous cells, but to a lesser degree they contribute to immediately bordering pseudostratified epithelium (Extended Data Fig. 5G).
Hillocks resist a broad range of insults
Since the tightly interlocking squamous cells of the hillock imply a physical barrier function and because hillocks are resistant to protease digestion (Extended Data Fig. 2), we next assessed the ability of hillocks to resist a broad range of environmental insults. We first employed a clinically relevant chemical injury and submerged trachea in 80 mM HCl for 2 minutes to simulate gastric acid aspiration 9. Immediately after the injury, hillock cells comprised the majority of surviving cells. When injured explants were cultured overnight, hillock cells were the predominant dividing cell population. Even in the most injured hillocks in which luminal hillock cells had undergone apoptosis, underlying hillock basal stem cells were shielded from injury and survived (Fig. 2A–B, Extended Data Fig. 6A–B). To further probe whether hillocks resist physical injury, we employed a model of clinical cryotherapy in which liquid nitrogen is used to remove pathologic epithelium in COPD 10,11. When subjected to this freeze-thaw injury, hillocks again preferentially survived and proliferated. Once again, even in the most injured hillocks, hillock basal stem cells survived (Fig. 2C–D, Extended Data Fig. 6C–D). In addition to resisting physical injuries, hillocks were dramatically resistant to influenza infection (Fig. 2E, Extended Data Fig. 6E).
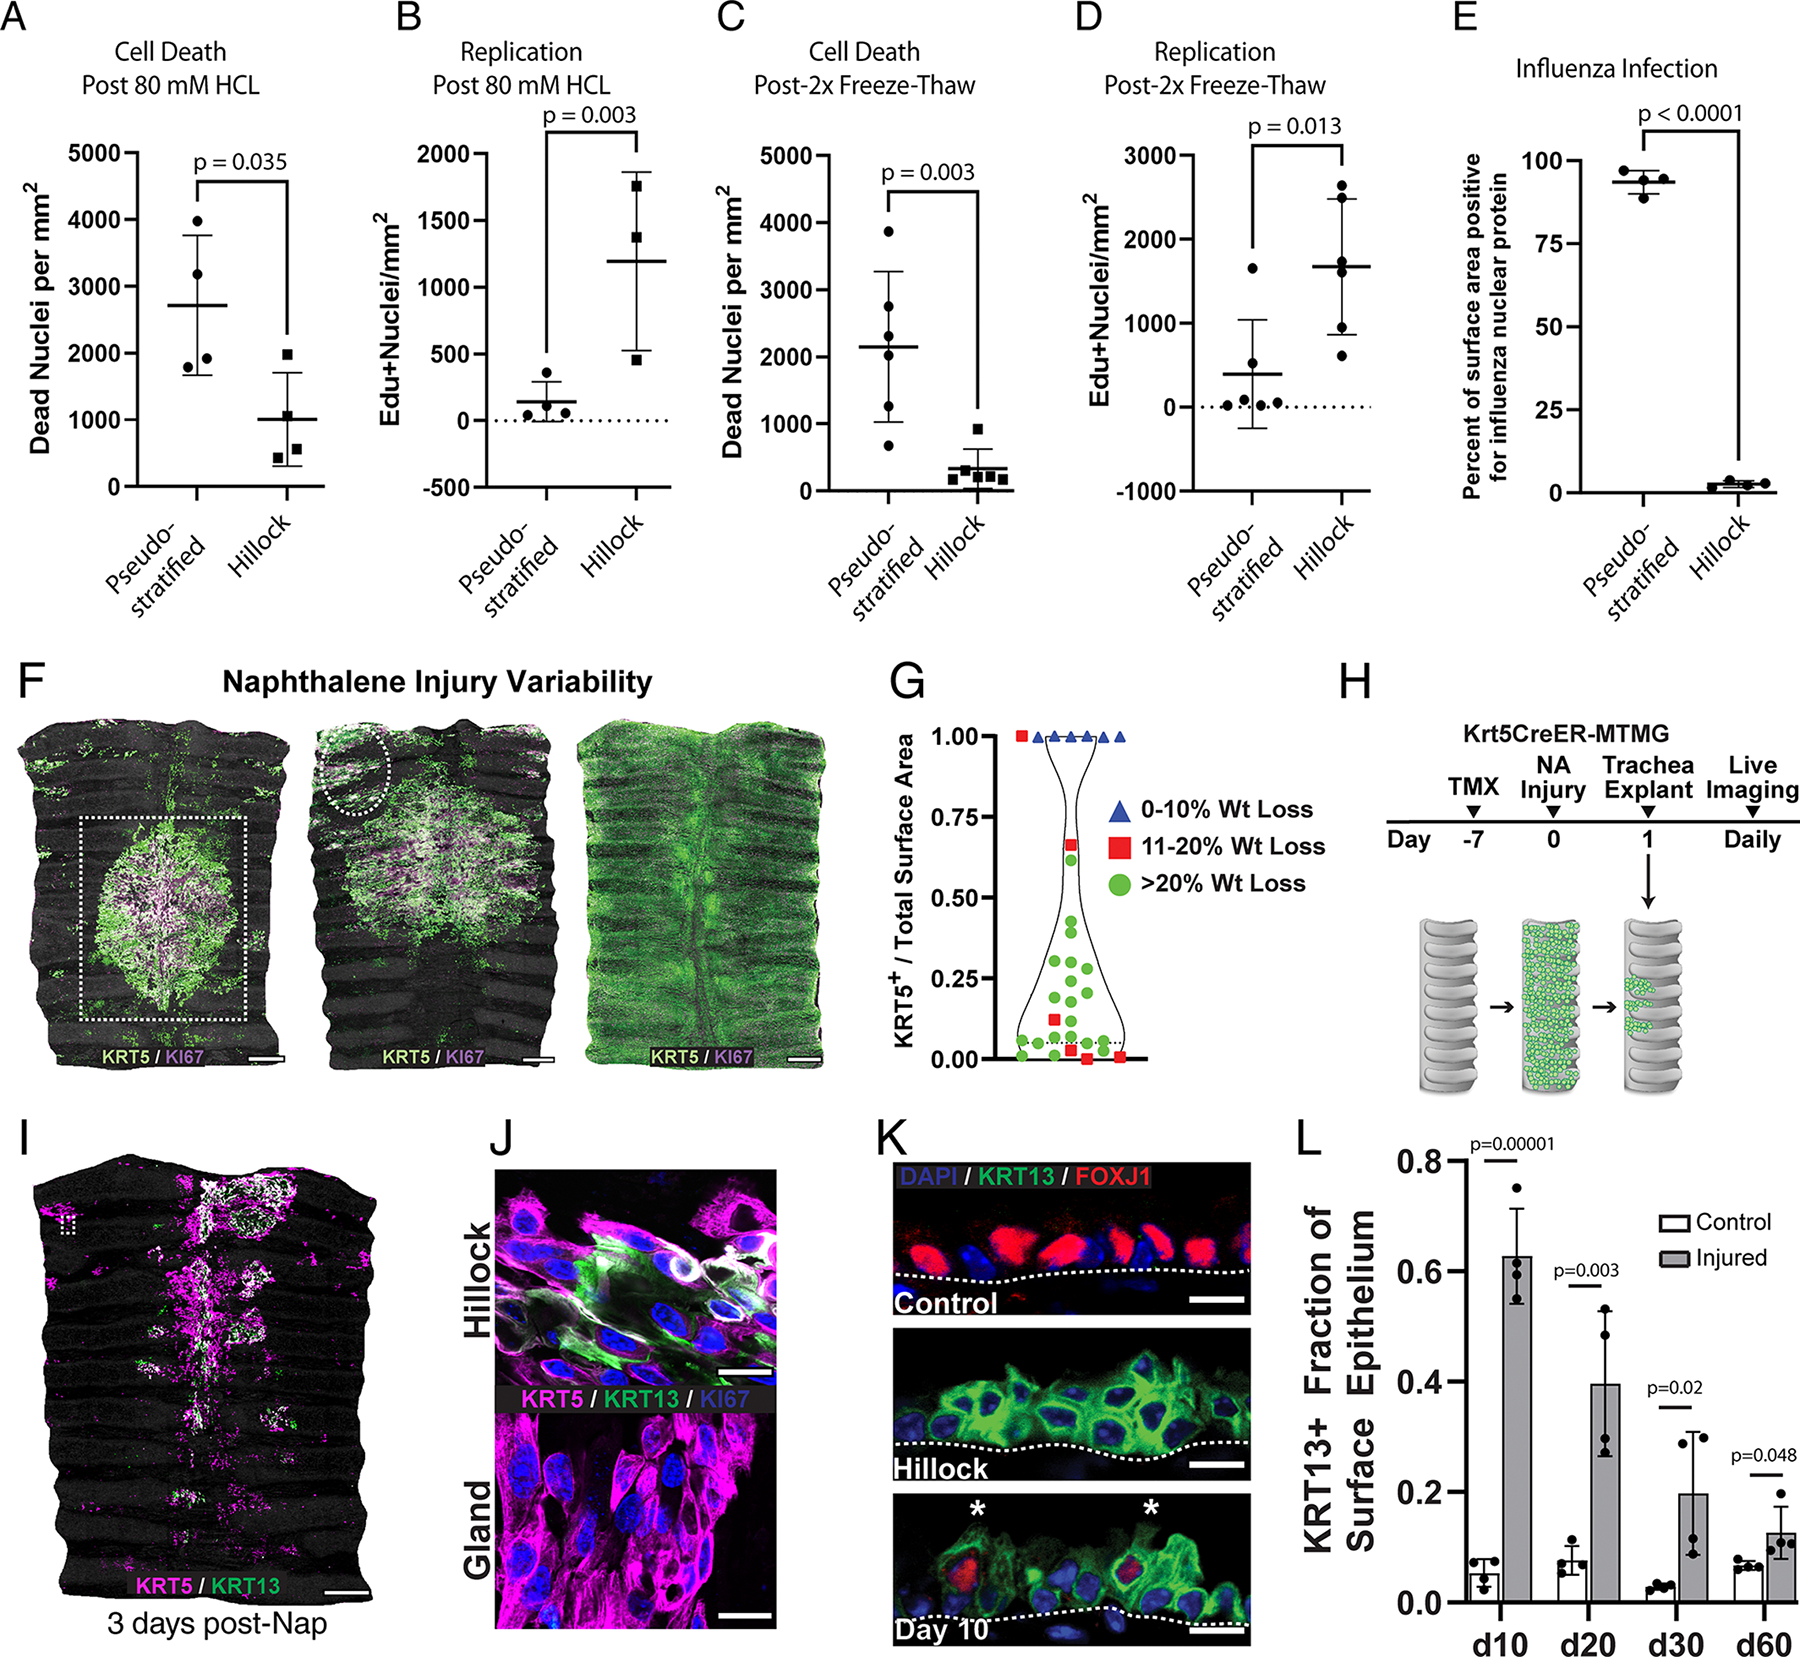
Fig. 2. Hillocks are resistant to a very broad range of insults.
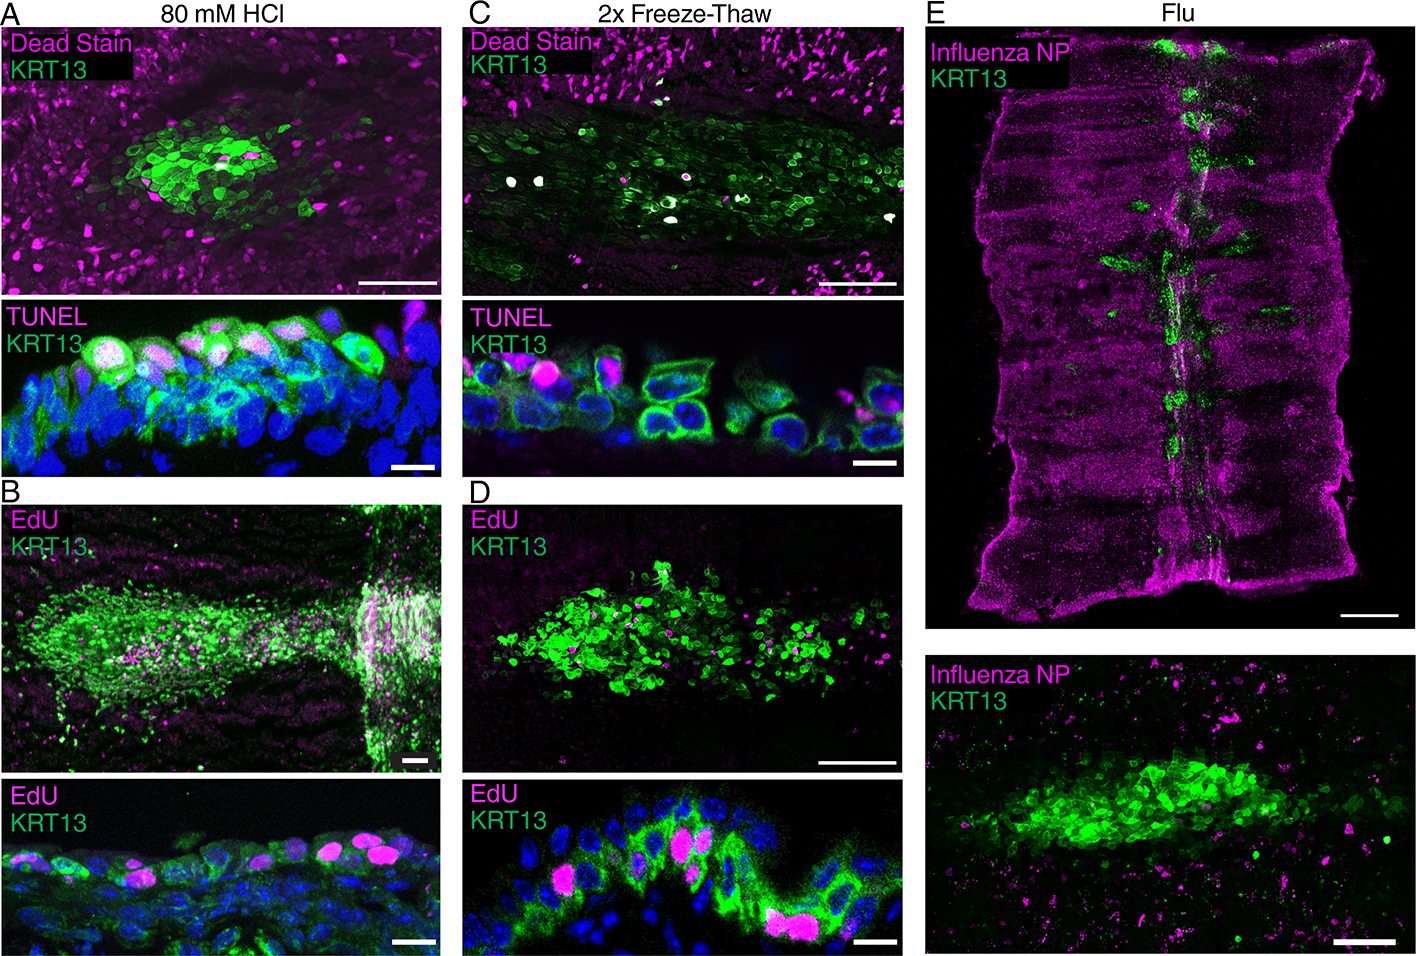
(A) Wholemount image of a hillock with a dead-cell stain following a 2 min exposure to 80 mM HCl demonstrating hillock resistance to acid (top). Cryosection of 80 mM HCl-treated hillock stained for TUNEL (dead) and KRT13 showing luminal cell death (bottom). (B) Wholemount image of a tracheal explant after exposure to 80mM HCl showing replication occurs preferentially in hillocks (top). Cryosection showing proliferation (EdU staining) in a surviving hillock (bottom). (C) Wholemount image of a hillock with a dead-cell stain following freeze-thaw demonstrating hillock resistance to freezing (top). Cryosection of freeze-thaw injured hillock with TUNEL staining showing preferential luminal cell death (bottom). (D) Wholemount image after 2x freeze-thaw injury showing proliferation (EdU staining) in the hillock (top). Cryosection of freeze-thaw injured hillock with EdU staining showing proliferation in a surviving hillock structure (bottom). (E) Wholemount image (top) and high-mag image (bottom) of influenza nuclear protein (NP) stain showing no appreciable infection in hillock regions. Scale bars 100 μm (top of A-D and bottom of E), 5 μm (bottom of A-D), 250 μm (top of E).
In order to directly define and quantify the relative contribution of hillocks to tissue repair, we deployed a standardized model of toxic airway injury by exposing mice to naphthalene, a cigarette smoke toxin. We found that weight loss greater than 20% of body weight correlated to ~65% to 100% epithelial denudation of the tracheal surface (Extended Data Fig. 6F–G). We then used live imaging to directly visualize the resurfacing behavior of lineage labeled basal stem cells of the surface airway epithelium, the glands12,13, and the hillocks (Extended Data Fig. 6H). After severe injury, surviving lineage labeled cells occurred in a distribution that mirrored the distribution of hillocks and were KRT13+ (Fig. 3A, Extended Data Fig. 6I). Over the course of 5 days, surviving cells and their progeny progressively resurfaced the denuded trachea (Fig. 3A). Gland cells, which are KRT13-, survived in the proximal trachea, but contributed minimally to resurfacing in this severe injury model (Fig. 3A, Extended Data Fig. 6I–J). By day 10 post-injury, KRT13+ cells were found throughout the resurfaced tracheal epithelium and, to our surprise, displayed evidence of progressive ciliogenesis (Fig. 3B, Extended Data Fig. 6K). By day 60 post-injury, the KRT13-positive domain of cells had regressed and reformed in the typical distribution of hillocks (Extended Data Fig. 6L).
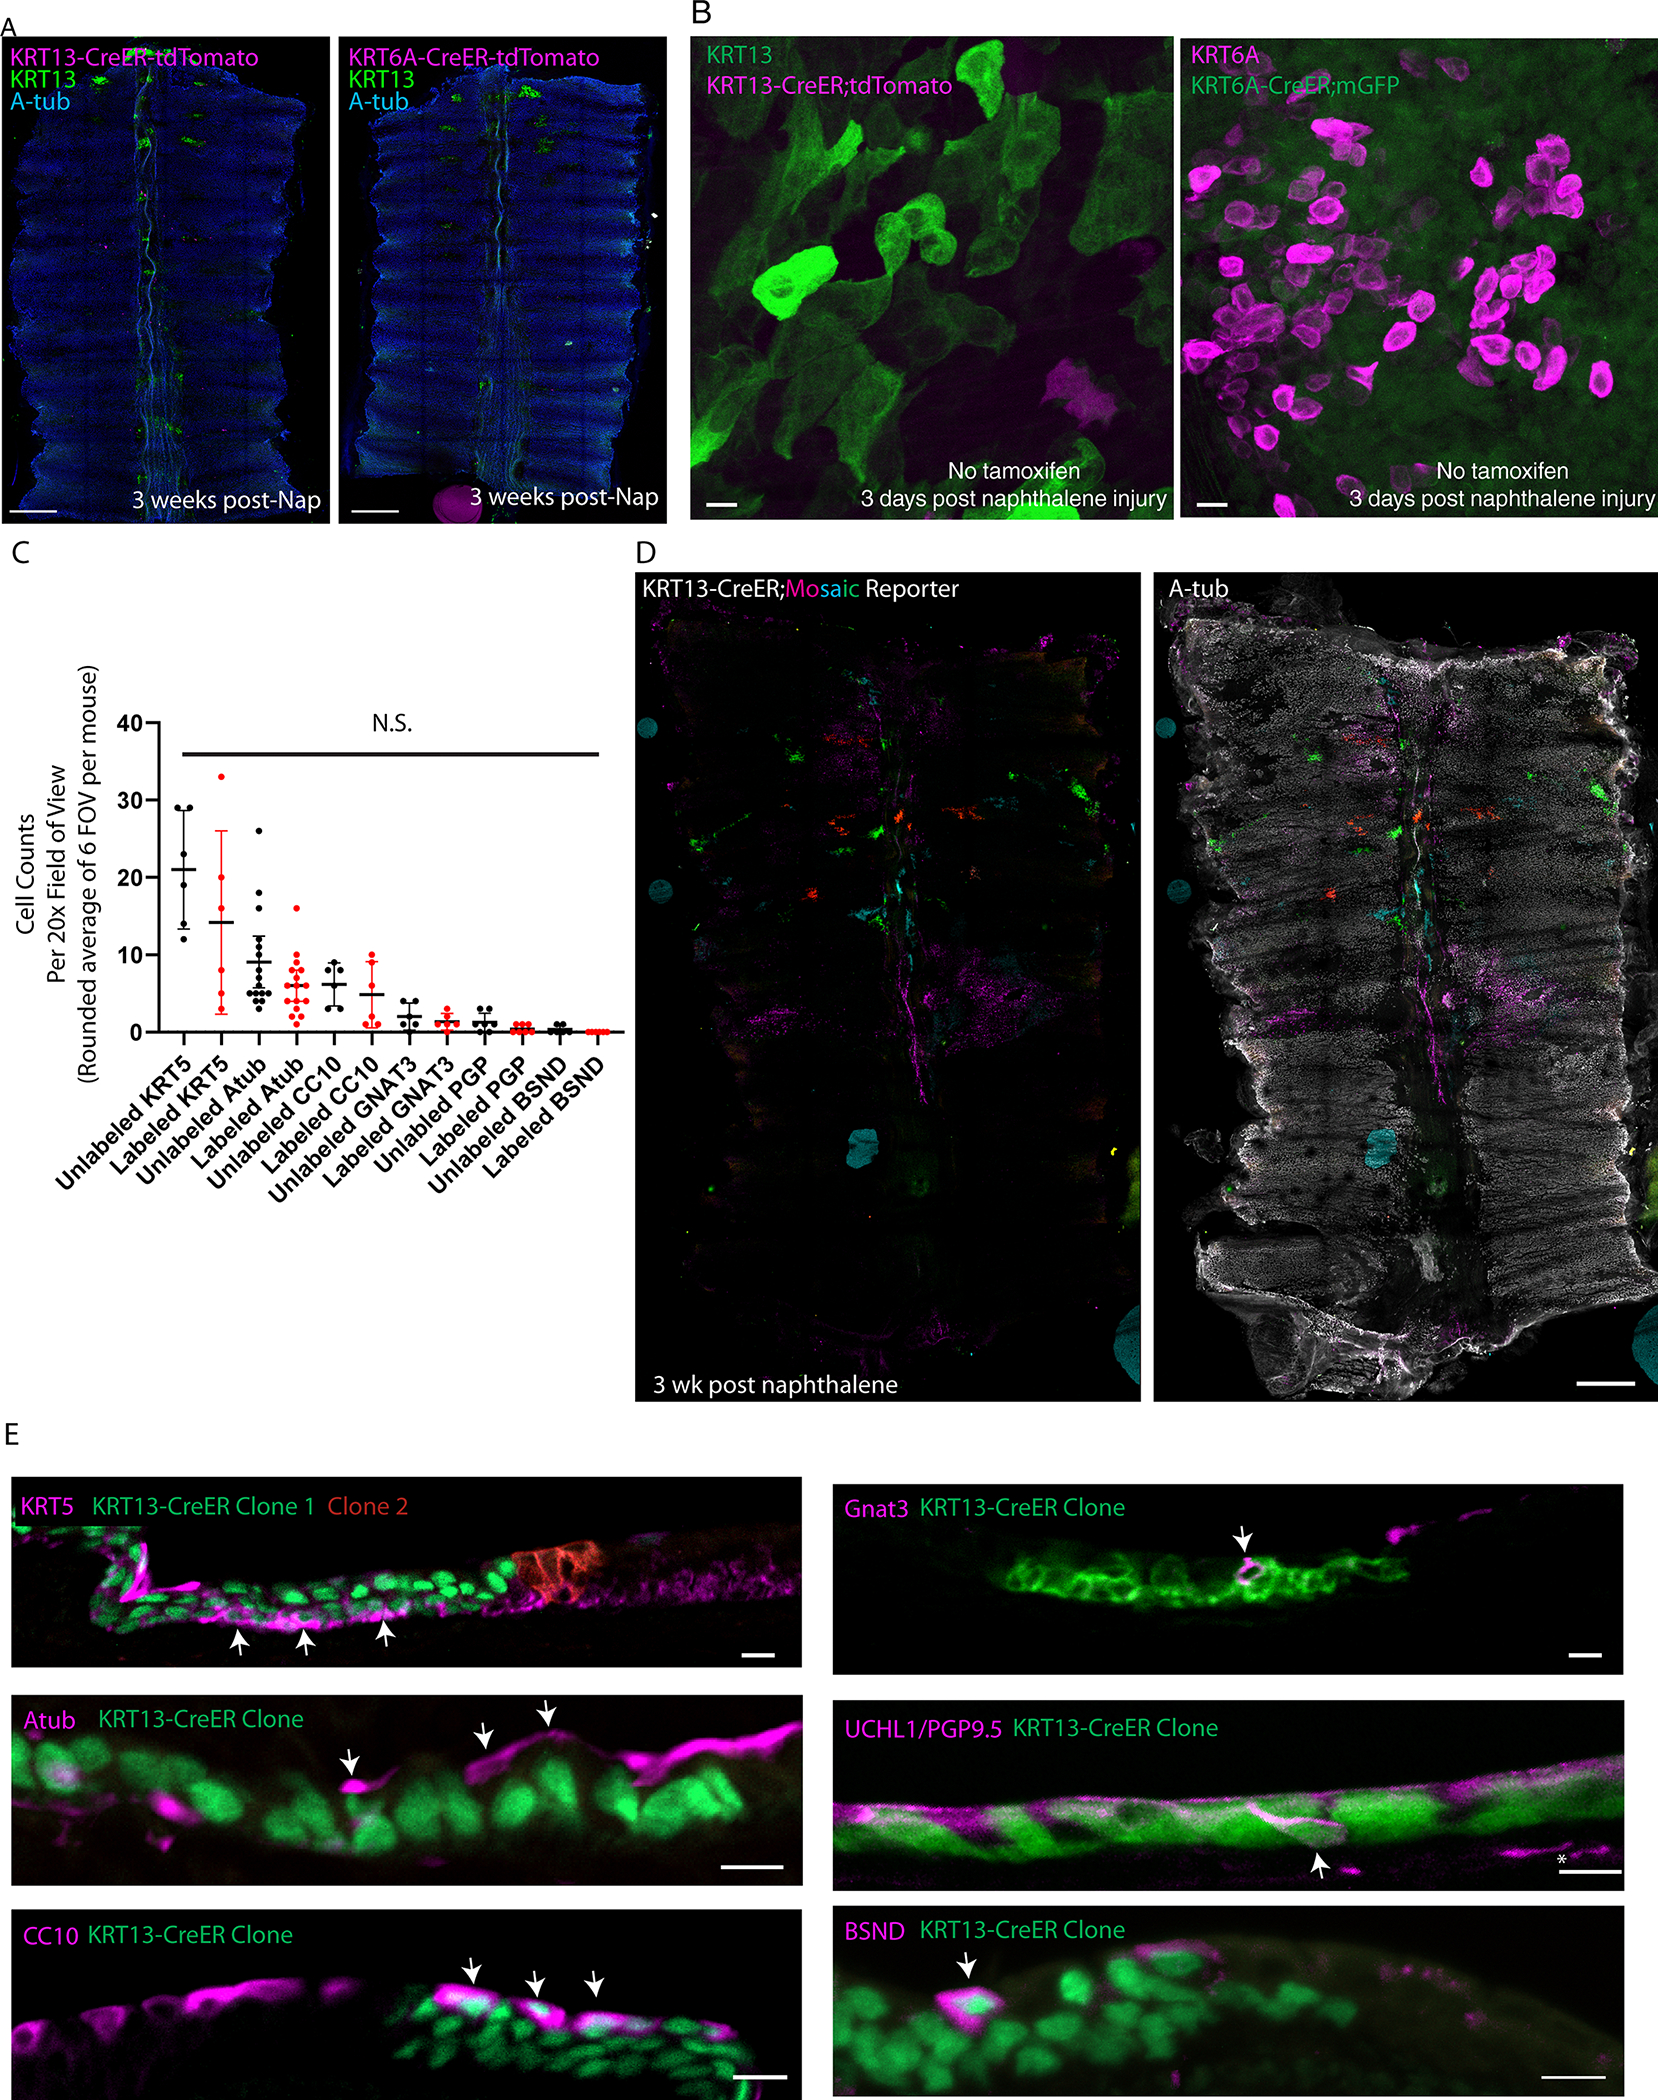
Fig. 3. Hillocks generate a normal pseudostratified airway epithelium after injury.
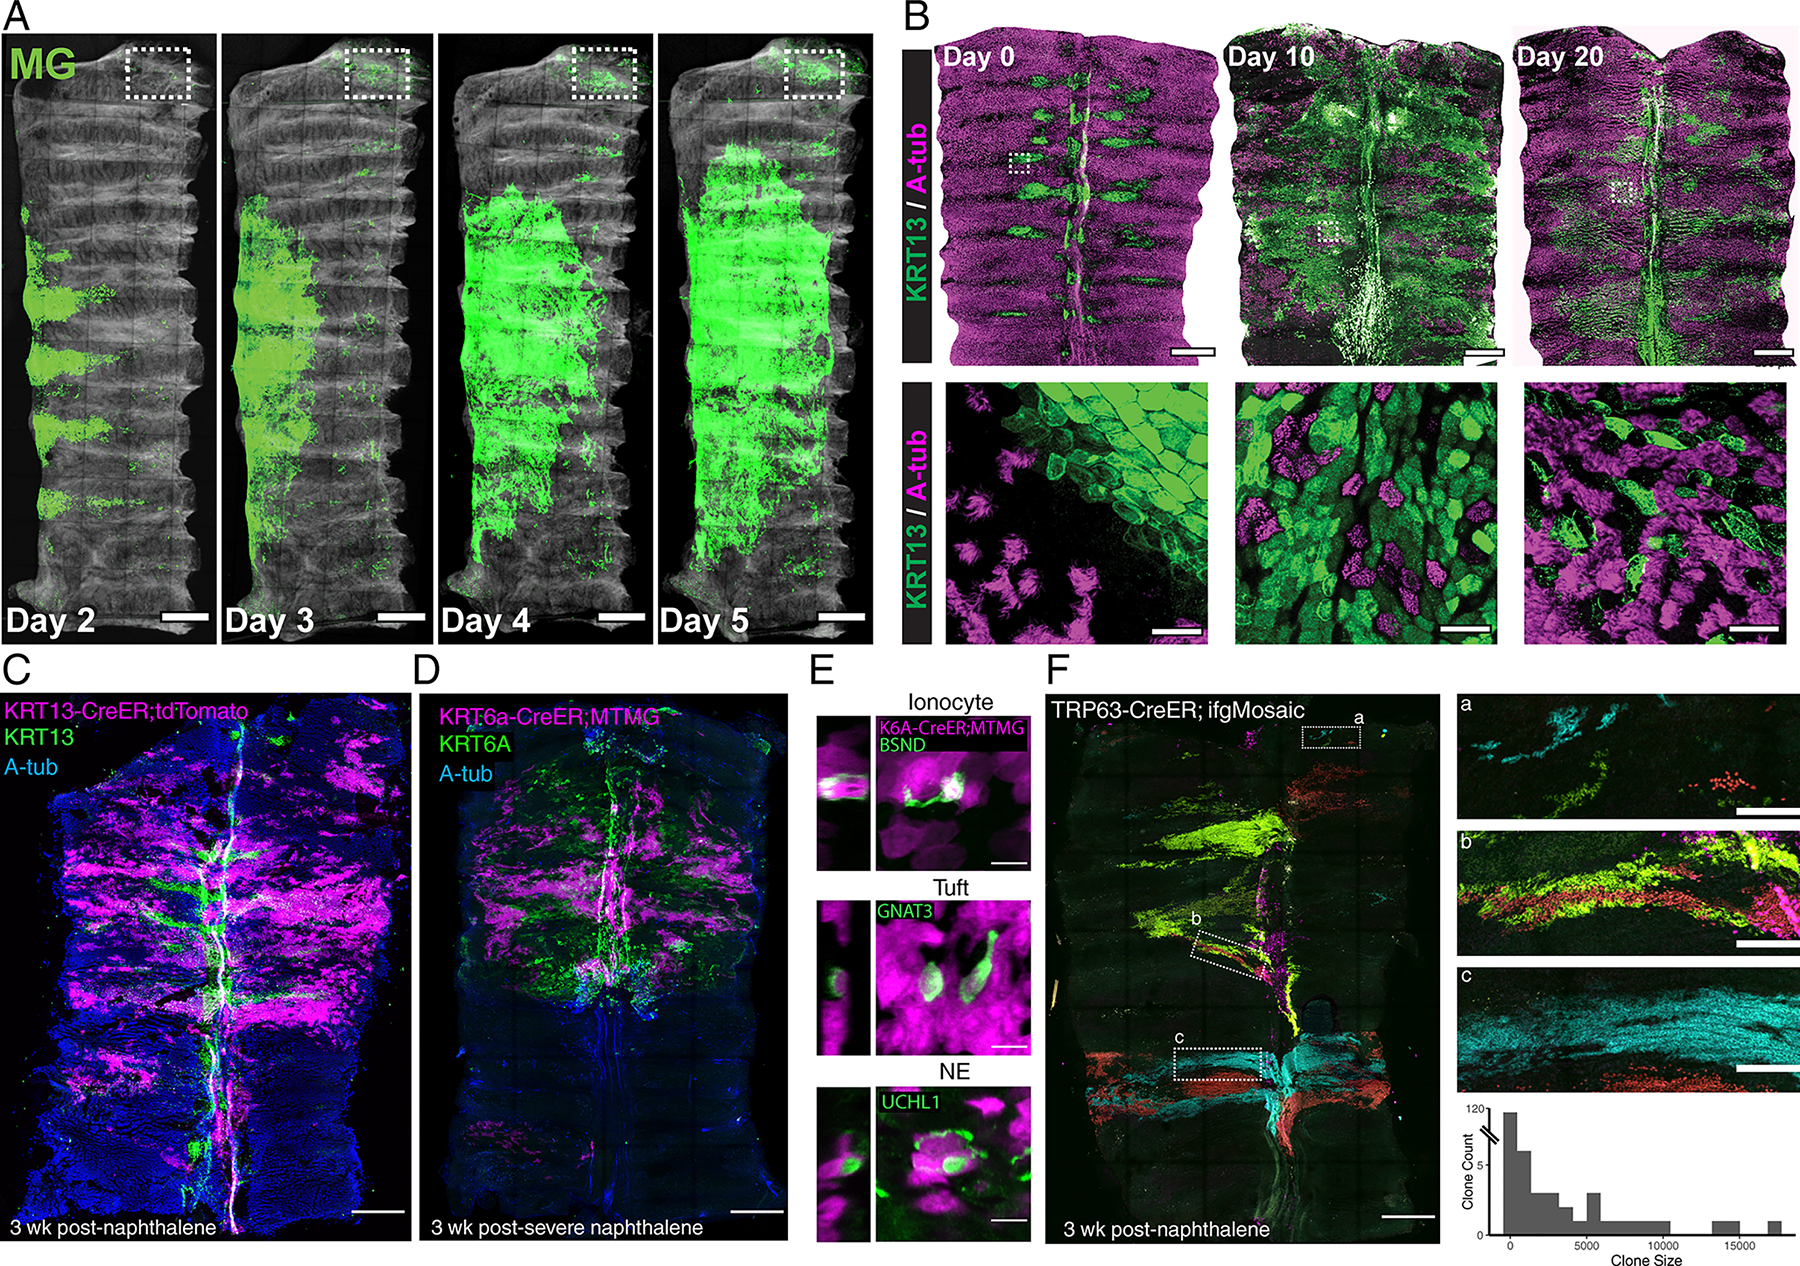
(A) 5 day timelapse images of a KRT5-CreER;MTMG tracheal explant following naphthalene injury showing massive hillock expansion and resurfacing. Boxed region indicates location of glands. (B) Wholemount (top) and high-mag (bottom) images of tracheal resurfacing after naphthalene injury demonstrate an expansion of KRT13-positive domains and the subsequent appearance of ciliated cells within these domains. (C) Wholemount image of a trachea from a KRT13-CreER;LSL-TdTomato lineage trace 3 weeks post-naphthalene injury demonstrates widespread contribution of hillock-derived cells to the fully resurfaced and regenerated ciliated epithelium, accompanied by a regression of the KRT13 expression pattern to a characteristic hillock pattern. (D) Wholemount image of KRT6A-CreER;LSL-MTMG lineage trace 3 weeks after severe naphthalene injury that has permanently denuded the distal trachea (bottom of wholemount image in center panel) demonstrates that hillock-derived cells survived even this severe injury and resurfaced the proximal trachea. (E) High-mag representative images showing that KRT6A lineage labeled hillock cells can differentiate into all three rare cell types. (F) Wholemount of TRP63-CreER;dual-ifg-Mosaic trachea 3 weeks after naphthalene demonstrates massive clonal expansion (left). High-mag insets of the regions in dotted white boxes (right). Quantification of the size of clones found after naphthalene injury (average 956 cells, 143 clones across 3 animals). Scale bars 250 μm (A, top panels of B, C, D, left panel of F), 20 μm (bottom panels of B), 10 μm (E), 50 μm (right panels of F)
Hillocks give rise to normal pseudostratified epithelium after denuding injury
To directly test whether hillocks were the source of resurfaced and ciliating epithelium, we lineage labeled hillocks using the KRT13-CreER driver and confirmed that the cells that expanded to cover the tracheal surface originated from hillocks. Subsequently, the resurfaced epithelium exhibited plasticity and converted into a fully ciliated epithelium (Fig. 3C). This finding was confirmed using a second, hillock-specific driver line, KRT6A-CreER (Fig. 3D). No lineage labeling occurred in the absence of tamoxifen using either driver line (Extended Data Fig. 7A), nor was there evidence of leaky labeling post-injury, despite the high protein expression of KRT6A and KRT13 post-injury (Extended Data Fig. 7B). Additionally, although hillocks themselves are devoid of rare cells, the reconstituted airway epithelium derived from hillock basal stem cells contained the entire panoply of rare airway epithelial cell types found in the normal pseudostratified epithelium (Fig. 3E, Extended Data Fig. 7C).
Next, we sought to determine how such extensive epithelial regeneration is possible, given the small pool of available hillock stem cells. Therefore, we employed dual-ifgMosaic clonal lineage tracing induced by the highly efficient TRP63-CreER basal stem cell driver in the setting of naphthalene injury. We found that basal cells that survived the injury generated very large clones of epithelial cells (an average of 956 cells per clone), including clones with thousands of cells (Fig. 3F). We then confirmed that the TRP63-positive basal stem cells that clonally expanded and resurfaced the airway epithelium were indeed KRT13-positive hillock basal cells using the KRT13-CreER driver in combination with dual-ifgMosaic clonal lineage tracing (Extended Data Fig. 7D). Again, these clones contained the full spectrum of epithelial cell types including ionocytes, tuft cells, and neuroendocrine cells (Extended Data Fig. 7E).
Hillocks are a source of “squamous metaplasia”
To assess whether hillock basal stem cells retain a distinct identity in vitro when removed from their local niche, we compared the transcriptomes and epigenomes of cultured and subsequently sorted hillock and pseudostratified basal cells (Extended Data Fig. 8A). An analysis of chromatin accessibility demonstrated significantly greater levels of open chromatin in hillock basal cells as compared to pseudostratified basal cells, characterized by double the number of open transcription start sites and nearly triple the number of globally open peaks (Extended Data Fig. 8B–C). We speculate that this generally permissive chromatin architecture underpins the broad plasticity associated with hillock-mediated epithelial regeneration.
At the transcriptomic level, when compared to pseudostratified basal cells, hillock basal cells were enriched for genes associated with focal adhesions and cell-substrate junctions (Extended Data Fig. 8D–F). These genes include multiple integrins (Itga2, Itga3, Itga6, Itgb1, and Itgb4) and integrin-binding proteins (Flna, Flnb, and Adam12) likely reflecting the unique structural attributes of hillocks (Extended Data Fig. 8F). Remarkably, a suite of enzymes governing the conversion of dietary vitamin A and retinyl esters into all-trans retinoic acid (RA) were enriched in pseudostratified basal cells, including Adh1, Aldh1l1, Aldh1a1, Aldh1a7, Ces1d and Ces1e. Conversely, an enzyme dedicated to retinoic acid catabolism, Cyp26b114, is specifically upregulated in hillock basal cells (Fig. 4A).
Fig. 4. Hillock basal stem cells are distinct from pseudostratified basal stem cells and represent a source of squamous metaplasia.
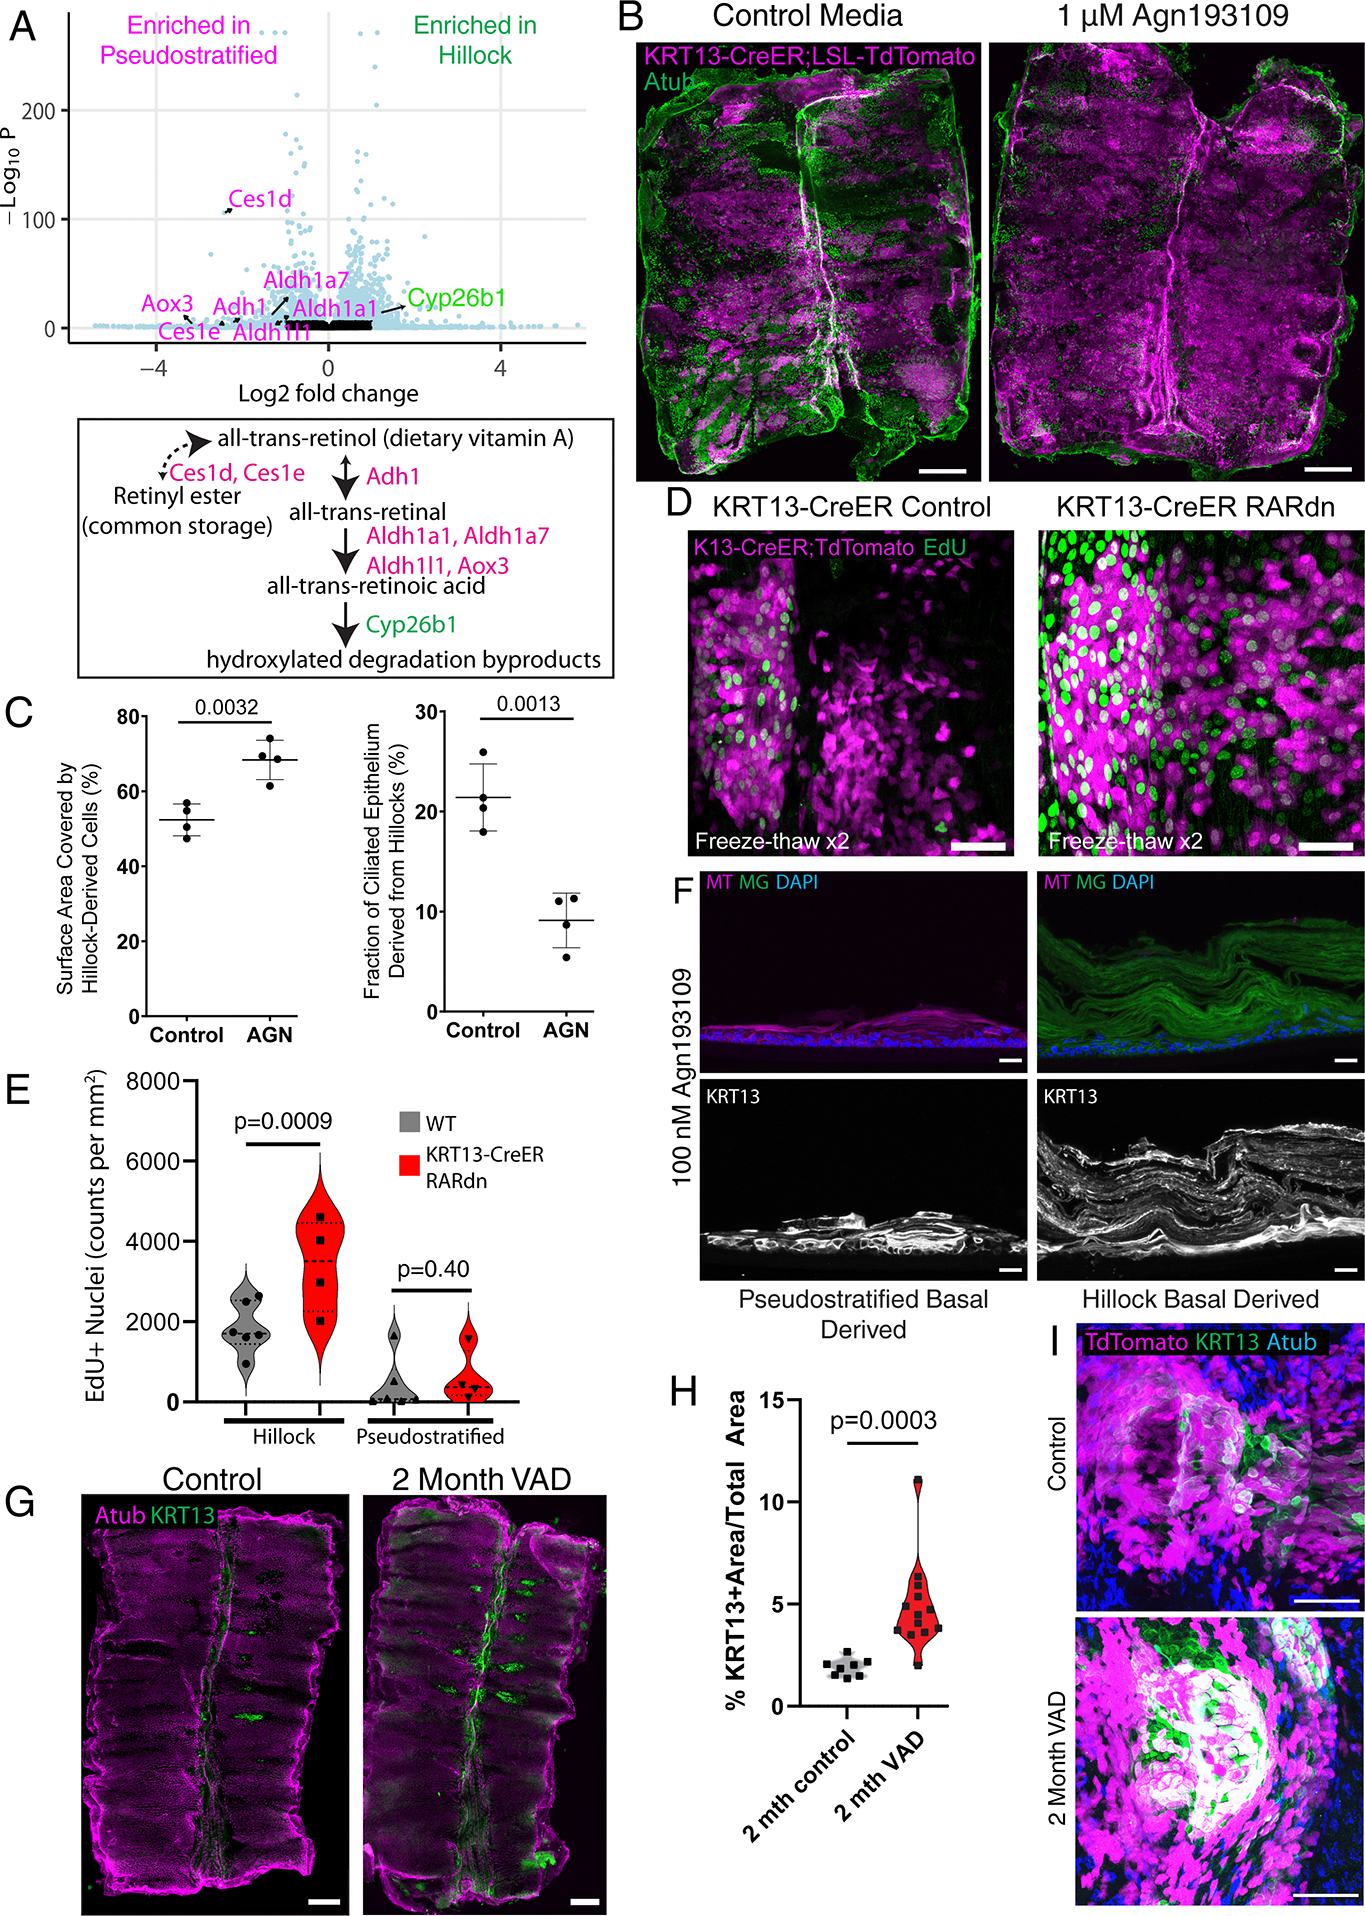
(A) Volcano plot of differentially expressed genes in cultured hillock basal cells vs cultured pseudostratified basal cells. Magenta-labeled genes are enriched in pseudostratified basal cells, while green-labeled gene is enriched in hillock basal cells (top). Gating in Extended Figure 8. A simplified retinoic acid synthesis pathway with above genes (bottom). (B) Wholemount trachea from KRT13-CreER;lsl-TdTomato mice, tamoxifen labeled in vivo prior to cryospray injury and cultured with and without Agn193109. (C) Quantification of percent surface covered by hillock-derived KRT13-CreER;lsl-TdTomato+ cells (left) and quantification of fraction of ciliated epithelium derived from hillocks (right) showing increased resurfacing and reduced ciliogenesis following Agn193109. SD is marked. (D) Wholemount trachea of hillocks from KRT13-CreER;lsl-TdTomato animal vs from KRT13-CreER;dominant negative RAR (RARdn) animal after freeze-thaw injury. (E) Quantification of EdU+ nuclei within hillocks and in surrounding pseudostratified epithelium demonstrating increased proliferation following RARdn in hillocks. (F) Cryosections of air-liquid interface cultures in the presence of 100 nM Agn193109, grown from either purified pseudostratified basal (membrane-TdTomato) vs hillock basal stem cells (membrane-GFP) isolated from KRT13-CreER;MTMG mice. FACS Gating: hillock basal cells: EpCAM-BV421+, GSIβ4-AF647+, EGFP+, pseudostratified basal cells: EpCAM-BV421+, GSIβ4-AF647+, tdTomato+. (G) Wholemount trachea of C57Bl6 animals on control diet vs vitamin A deficient (VAD) diet for 2 months. (H) Quantification of total area covered by KRT13+ hillocks in control vs VAD animals. (I) Wholemount trachea of a single hillock in KRT13-CreER;lsl-TdTomato mice on control vs VAD for 2 months showing increased hillocks (KRT13, green) are derived from pre-existing hillock cells (TdTomato, magenta). Each dot in this figure represents a biologically independent mouse trachea replicate, unpaired two-tailed t-tests were performed. Scale bars 500 μm (B, G), 50 μm (D,I), 20 μm (F)
To assess the effect of retinoic acid signaling modulation on hillock-mediated airway epithelial regeneration, we employed an explant model in the context of directly visualized controlled cryoinjury. In the setting of Agn193109 inhibition, a significantly larger percentage of the airway surface epithelium was KRT13-CreER lineage labeled (Fig. 4B–C). We then employed the KRT13-CreER driver to specifically express dominant negative retinoic acid receptor15 and subjected explants to cryoinjury. This resulted in significantly increased hillock cell proliferation (Fig 4D–E) suggesting that the effect of retinoic acid inhibition on hillock expansion is a cell-autonomous process.
Since our gene expression analysis suggested that retinoic acid metabolism is differentially handled in hillock basal cells, we reasoned that hillock basal cells would be more sensitive to retinoic acid signaling inhibition given that they are already poised to catabolize RA, while their pseudostratified counterparts synthesize RA. When mixed cultures of KRT13-CreER lineage labeled hillock basal cells and unlabeled pseudostratified basal cells were differentiated using standard air-liquid interface culture, both basal cell populations produced ciliated epithelium consistent with in vivo hillock plasticity (Extended Data Fig. 9A). However, when these mixed cultures were exposed to retinoic acid receptor antagonist Agn193109, lineage labeled hillock basal cells underwent massive expansion, dominated the entire culture, created patches of cells displaying characteristic squamous features, and underwent stratification reminiscent of squamous metaplasia (Extended Data Fig. 9B–D). These structures exhibited functional properties characteristic of hillocks including resistance to enzymatic dissociation (Extended Data Fig. 9E–F) and flu infection (Extended Data Fig. 9G). They also exhibited significantly higher transepithelial electrical resistance (TEER) indicative of barrier function16 (Extended Data Fig. 9H). We then sorted hillock and pseudostratified basal cells on the basis of KRT13-CreER lineage label and cultured pure populations of these cells with and without Agn193109. Without Agn193109, hillock basal cell derived epithelium was morphologically indistinguishable from pseudostratified basal cell derived epithelium (Extended Data Fig. 9I). However, upon addition of Agn193109, hillock basal cells preferentially developed the hallmark stratification that characterizes squamous metaplasia, including overt keratinization (Fig. 4F).
Interestingly, human squamous metaplasia arises in the setting of vitamin A deficiency, and vitamin A deficiency has been shown to cause squamous metaplasia in mice 2,3,17,18 suggesting that the distinct handling of retinoic acid metabolism by hillock basal stem cells and their functional response to RA signaling inhibition may be pathologically relevant. Therefore, we employed a murine vitamin A deficiency-induced model of squamous metaplasia and found that hillock patches more than doubled in size in the span of two months (Fig. 4G–H). Strikingly, no ectopic aciliate or KRT13+ patches occurred outside of characteristic hillock locations (Fig. 4G). To definitively determine whether the squamous metaplastic lesions associated with vitamin A deficiency are the result of hillock expansion, we performed KRT13-CreER lineage tracing prior to the institution of a vitamin A deficient diet. The previously identified patches of squamous metaplasia arose from hillocks (Fig. 4I). In aggregate, these findings point to a model in which this form of “squamous metaplasia” is a result of hillock expansion, rather than the overt metaplastic conversion of pseudostratified epithelium.
Human airways harbor hillocks
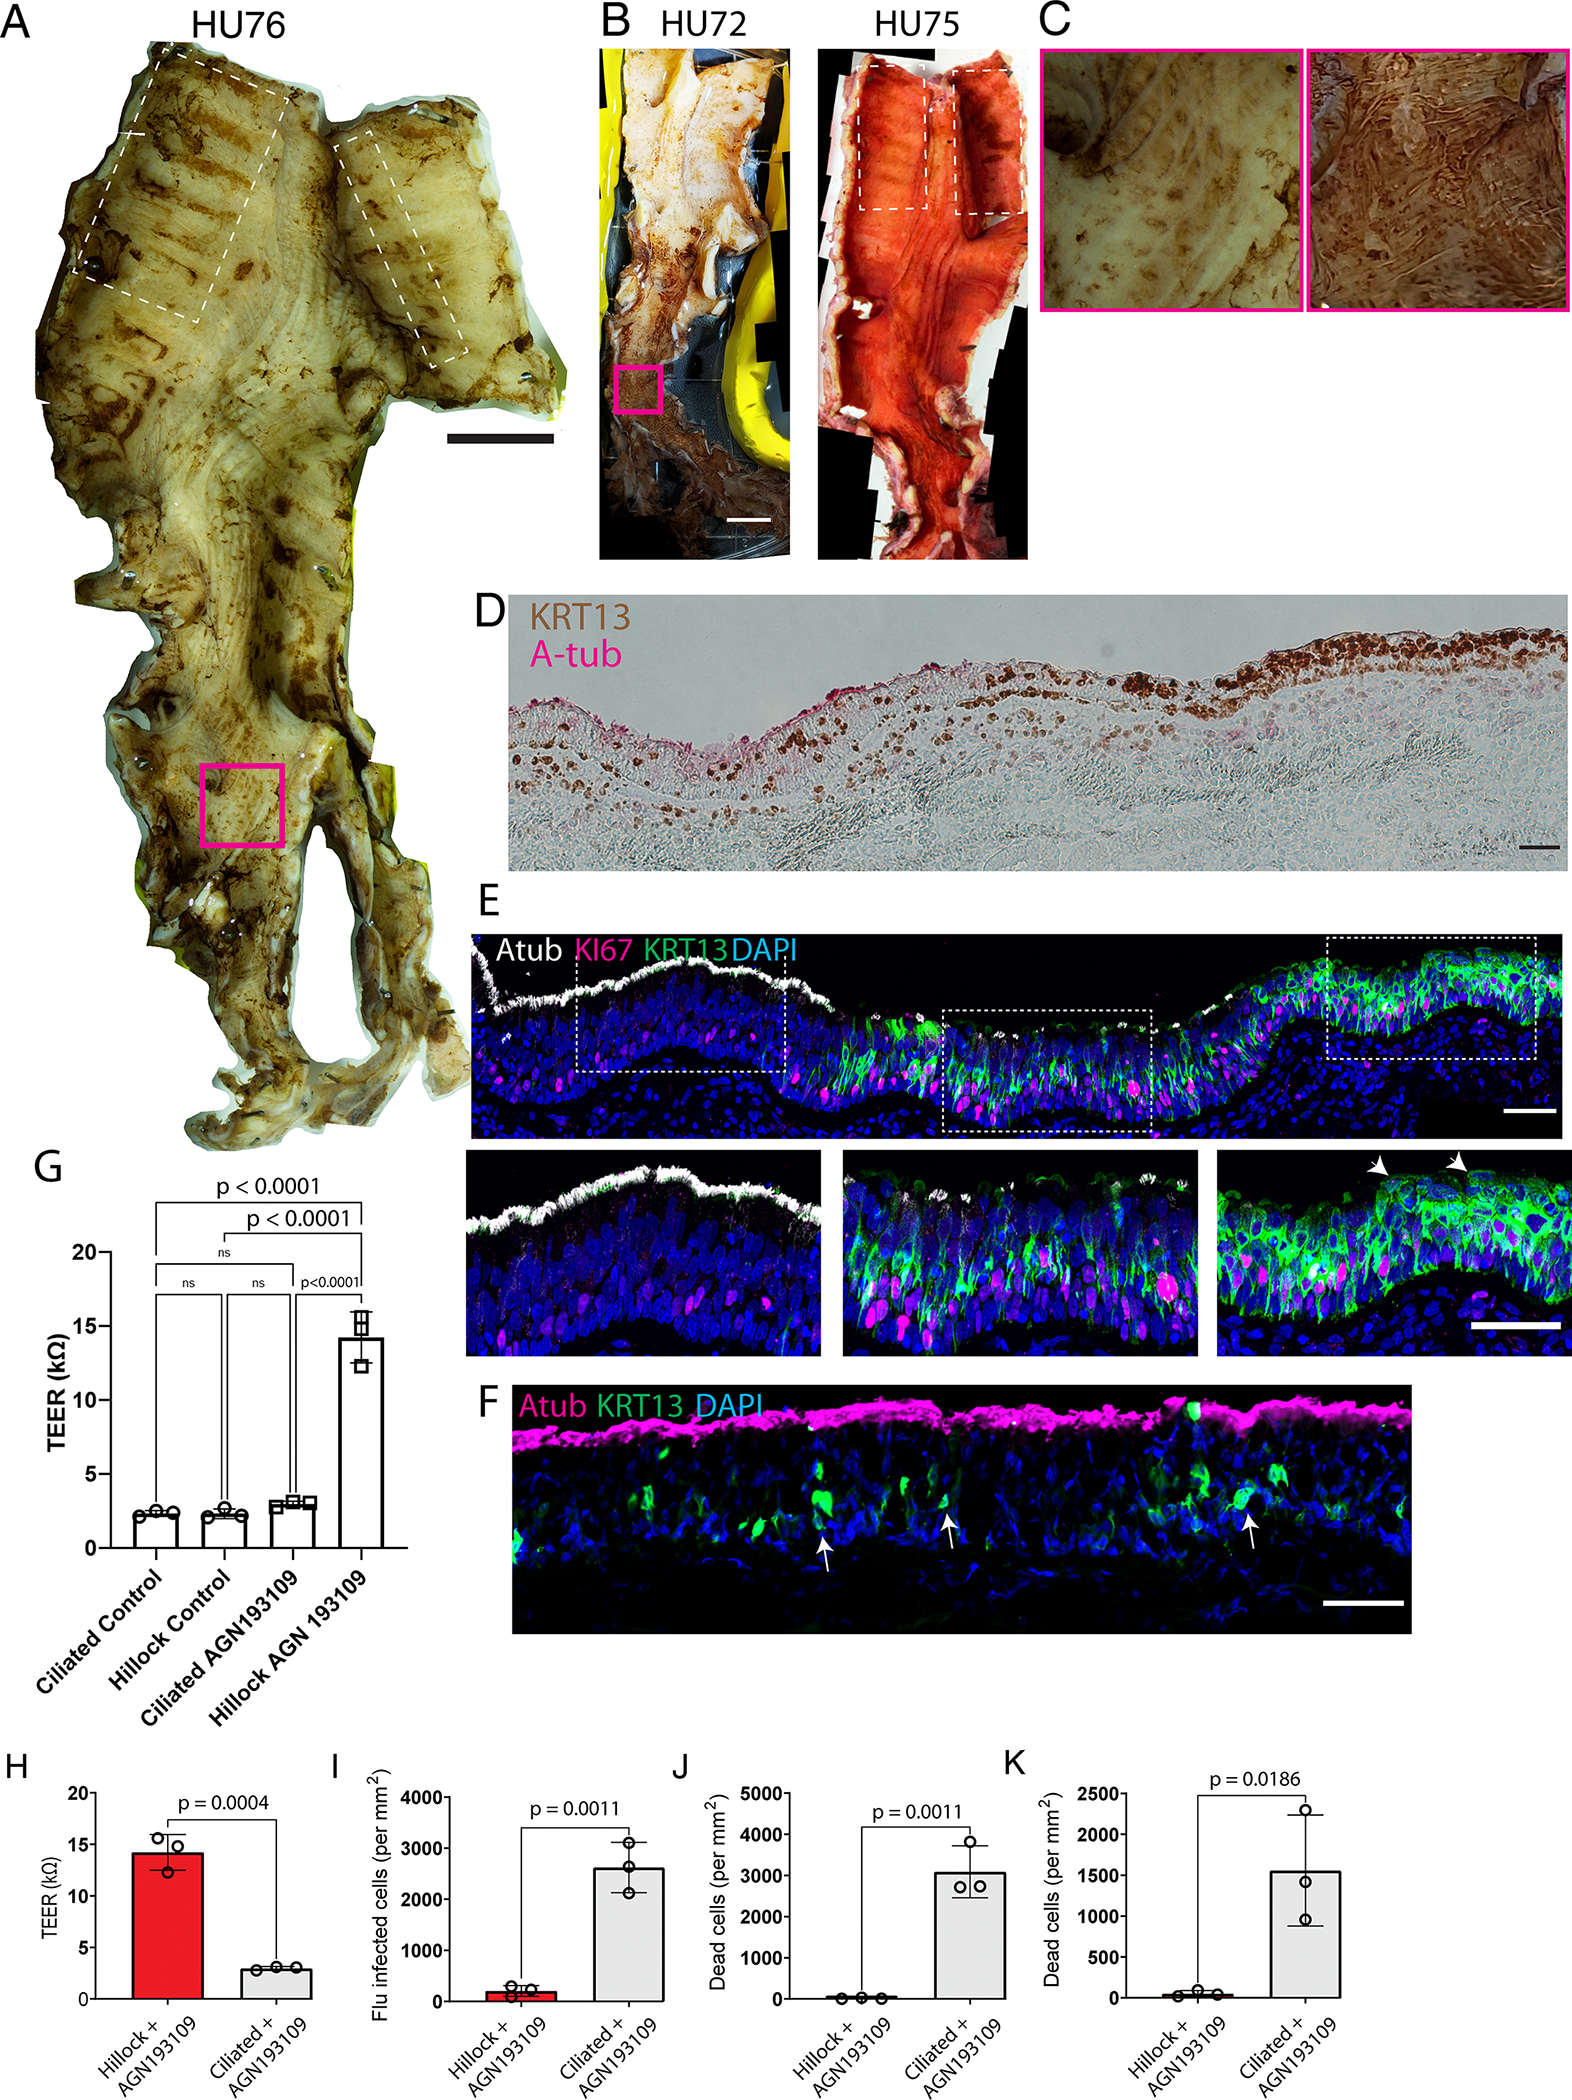
We next asked whether humans have airway hillocks. Although human KRT13+ “hillock-like” cells have been identified using single-cell RNAseq, bona fide hillocks based on morphologic criterion, characteristic anatomic location, structure, and function have not been described 18–23. Since the specific distribution of murine hillocks varies from mouse to mouse, we anticipated that the identification of human hillocks would be subject to sampling bias. To contend with this issue experimentally, we devised a step-wise method for immunohistochemical labeling of whole intact human airway trees, beginning at the primary bronchus and extending down to the small airways (<2 mm diameter) (Fig. 5A, Extended Data Fig. 10A–B). We identified KRT13-positive aciliate patches in 3 human donor lungs (Supplementary Table 1). The tracheal patches were reminiscent of their murine counterparts, characterized by stripe-like patches aligned to the axis of the cartilage rings or central patches near the cartilage-posterior membrane boundary (Fig. 5A–C, Extended Data Fig. 10A–B). Additionally, variable patches of KRT13+ staining were found outside the characteristic locations of hillocks. These patches of cells were distributed randomly and did not possess the characteristic surface pattern of KRT13 staining that is associated with murine hillocks (Extended Data Fig. 10C).
Fig. 5. Human hillocks.
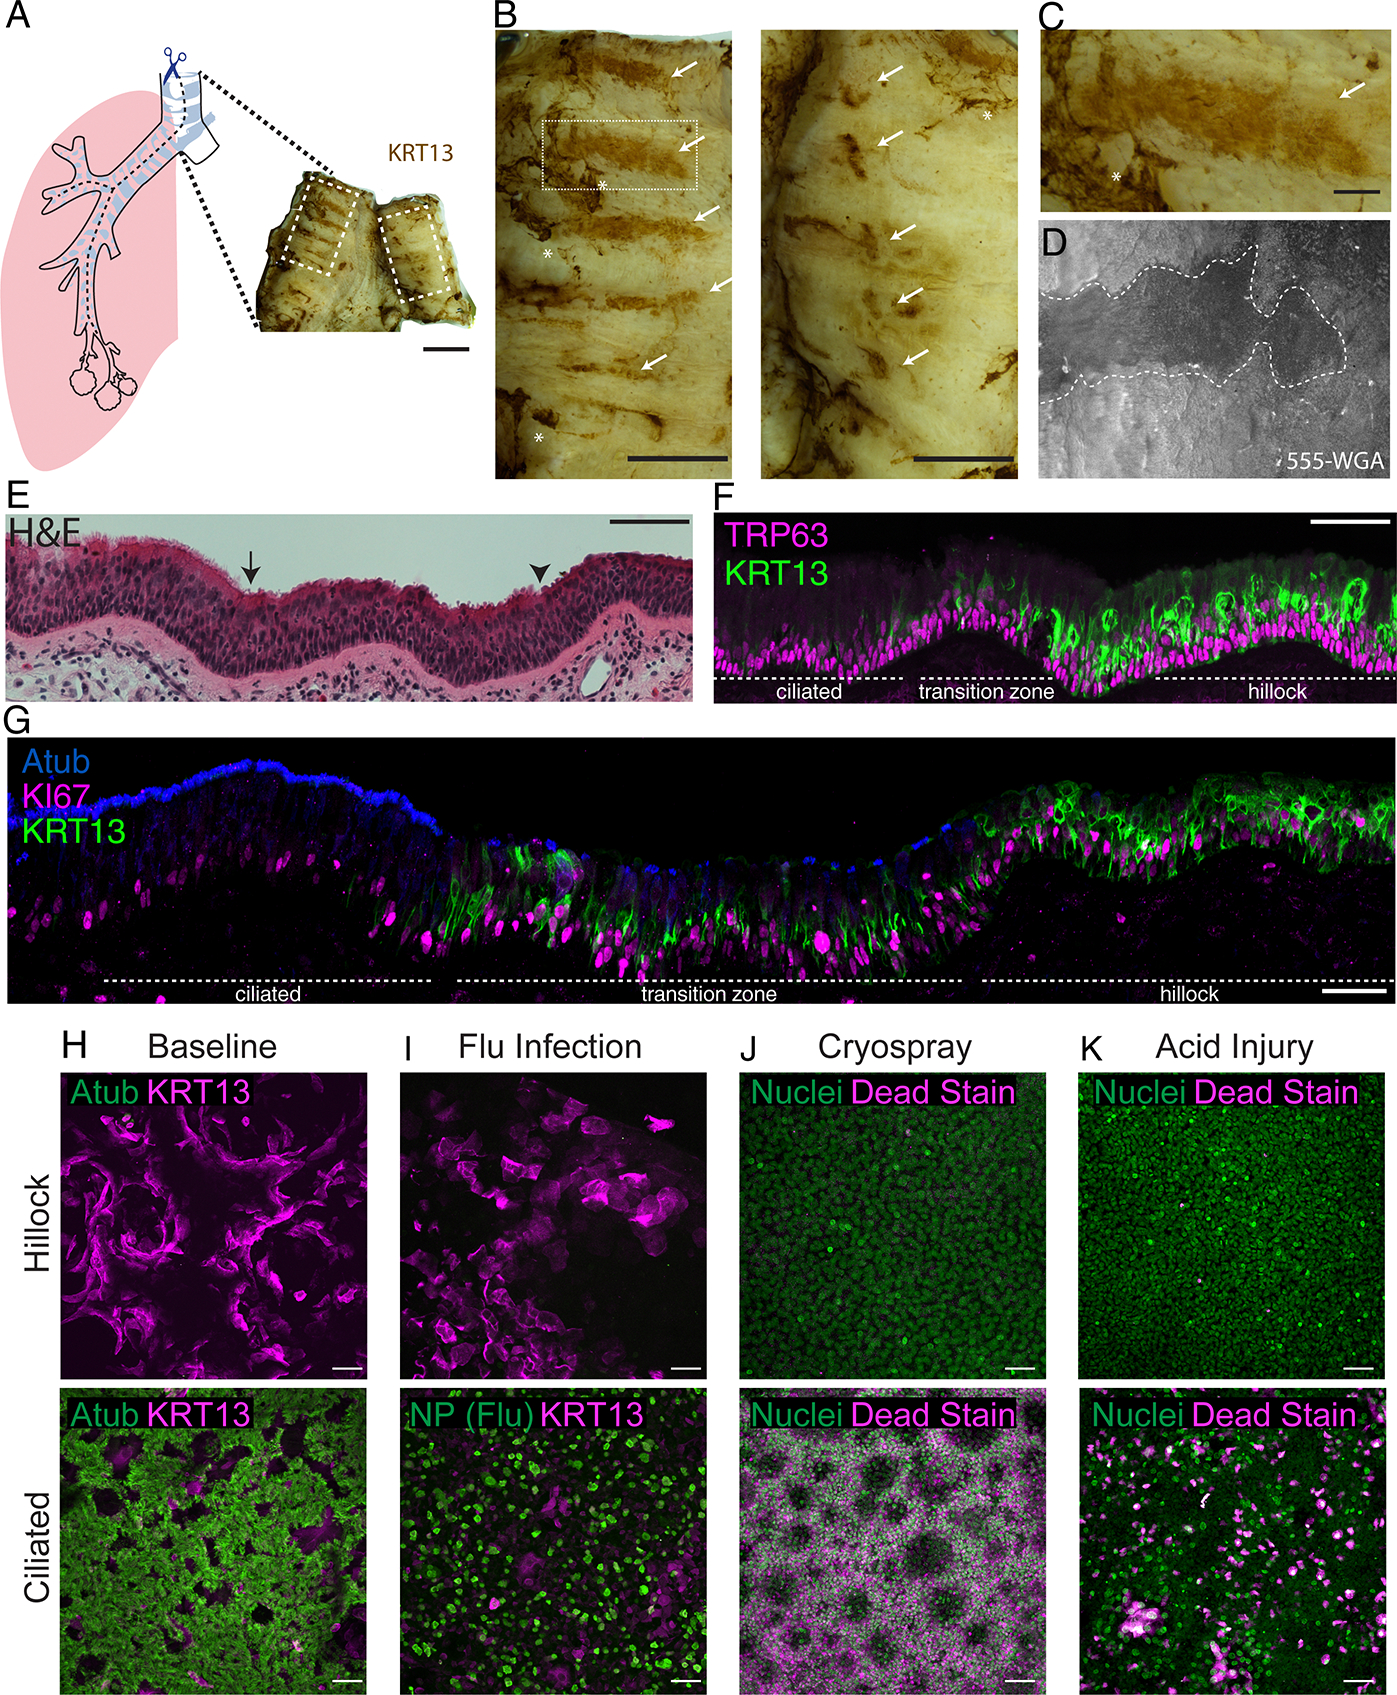
(A) Schematic for human wholemount staining. (B) High-mag images of areas marked by dotted lines in A. Arrows mark hillocks, while asterisks indicate background associated with mucous. (C) Further magnification of a hillock stripe from (B, left panel). (D) 555-WGA live staining of human trachea, dotted white line encircles a WGA low region that was then microdissected for subsequent staining in E-G. (E) H&E staining of the region dissected in (D). Arrow marks the boundary between ciliated and transition zones marked by intermittent ciliation. Arrowhead marks the boundary between the transition zone and hillock. (F) Immunostaining of the same region for KRT13 and TRP63. (G) Immunostaining for Atub, KI67, and KRT13 in the same area demonstrates a hillock epithelium with the cytologic and architectural features of a mouse hillock. (H) Representative air-liquid interface (ALI) cultures generated from either hillock basal stem cells or pseudostratified basal stem cells. (I) ALI culture immunostaining of hillock and pseudostratified epithelium after influenza infection, (J) cryospray injury, and (K) acid injury, demonstrating human hillock injury resistance. Scale bars 1 cm (A), 5 mm (B), 100 μm (C), 50 μm (E-K)
In order to selectively sample aciliate patches mirroring the aforementioned characteristics murine hillocks, we developed a methodology to prospectively identify human hillocks in living human airway explants using a fluorescently-tagged wheat germ agglutinin (WGA) that binds to cilia 24. Thus, presumptive hillocks were localized as WGA-low domains surrounded by epithelium that possessed actively beating fluorescently tagged cilia (Fig. 5D). These aciliate patches were found to be composed of stratified and squamous KRT13 positive cells overlying KRT13+ basal cells (Fig. 5E–G). Pathologic review of standard clinically-deployed H&E staining identified these patches as mild “reserve cell hyperplasia”, consistent with the higher rate of hillock basal cell proliferation (Fig. 5E–F). Due to this subtle histopathologic appearance, human hillocks would be overlooked by pathologists. Human hillocks are bordered by a transition zone, mirroring their murine counterparts. Just as in the mouse, transition zones were marked by lower levels of KRT13 expression, sparse ciliated cells, and increased rates of proliferation (Fig. 5G, Extended Data Fig. 10D–E). Unlike the mouse, however, the human pseudostratified ciliated epithelium contains scattered suprabasal cells that express low levels of KRT13 (Extended Data Fig. 10F). Notably, prior human single-cell lung atlases have described abundant KRT13+ cells that have been variously referred to as hillock-like, transitional, intermediate, and suprabasal 18–23. We speculate that these highly represented KRT13+ cells correspond to the abundant KRT13+ suprabasal cells found in pseudostratified epithelium (Extended Data Fig. 10F) 19,22,25,26. Indeed, given that hillocks are resistant to enzymatic dissociation (Extended Data Fig. 2), we would expect that bona fide hillock cells would be underrepresented in existing single-cell RNAseq datasets.
To functionally assess whether human hillocks are injury-resistant, we dissociated live hillock patches using our hillock-optimized dissociation procedure. We then performed in vitro culture using dual-SMAD inhibition followed by air-liquid interface culture. With the addition of AGN193109, hillock-derived cultures generated aciliate stratified structures, while those derived from pseudostratified epithelium generated thick lawns of ciliated epithelium (Fig. 5H). Hillock ALIs also exhibited higher TEER (Extended Data Fig. 10G–H), resisted influenza infection (Fig. 5I, Extended Data Fig. 10I), resisted cryospray injury (Fig. 5J, Extended Data Fig. 10J), and resisted acid injury (Fig. 5K, Extended Data Fig, 10K). Thus, humans possess hillocks that are defined by their characteristic anatomic locations, stereotyped morphology, structure, developmental responsiveness, and injury resistance.
Discussion:
In aggregate, our data demonstrate that murine hillocks are broadly injury-resistant reservoirs of unique and rare stem cells (2–4% of all basal cells) that can undergo massive clonal expansion and resurface the entire airway, create a temporary barrier epithelium, and then exhibit plasticity by differentiating into all 6 known cell types of the pseudostratified airway epithelium. Even at steady-state, hillock basal stem cells produce sufficient progeny to turnover the entire hillock squamous cell population within 3 weeks. These remarkable rates of turnover parallel those seen in the high-turnover skin epidermis which also serves a barrier function. At a much slower rate, hillock basal stem cells also give rise to bordering pseudostratified epithelium. These findings add to the body of literature concerning stem cell plasticity in which stem cells expressing markers of “mature differentiation”, such as in the intestine or stomach or airway glands, can act as reserve stem cell populations after injury 6,27,28.
Our findings tie together numerous prior reports concerning seemingly disparate phenomena. These finding include the presence of (1) heterogeneous populations of basal cells in the large airway, including a rare (3.3%) basal cell population that was thought to be committed to squamous cell differentiation29, (2) zonal cell proliferation in the airway epithelium 7,30, (3) the presence of aciliate epithelium in the proximity of cartilage31,32, (4) the observation of “unipotent” basal cells 33, (5) the tendency for dorsal airway epithelium to display squamous differentiation 8,18,29,34,35, and (6) possibly the propagation of basal cell clones that are dedicated to squamous differentiation 36,37.
We have defined the hillock based upon marker expression, anatomic location, squamous stratified structure, injury resistance, and the presence of a unique plastic stem cell population. In contrast to our explicit definition of the hillock, “squamous metaplasia” is a very broad pathologic descriptor and may encompass many distinct processes and cell types that carry distinct clinical implications 18,29. Here we have shown that the airway, in contrast to the textbook description, normally contains islands of stratified squamous epithelium in the absence of overt injury. In principle, this allows for tissue-level “metaplastic” change without the need for the transdifferentiation of pseudostratified epithelium. Indeed, in the setting of a vitamin A deficient diet, the presumptively metaplastic tissue arises from the expansion of pre-existing hillocks rather than the conversion of pseudostratified epithelium. Nonetheless, given the plasticity characteristic of epithelia, these findings do not rule out the possibility of transdifferentiation in the setting of pathologic inflammation or oncogenic transformation. We speculate that differing forms of squamous metaplasia may arise from multiple different sources, including hillocks, and that these disparate origins may have distinct functional or pathophysiologic implications. For example, others have identified dorsal squamous airway epithelial tissue and associated it with decreased, rather than increased, barrier function18. Additionally, “hillock-like” cells have been associated with childhood and adult asthma, although patches of these cells lack the characteristic attributes of hillocks 20,23. Indeed, it is unclear how these “hillock-like” cells are related to the human hillocks that we have now explicitly defined, or whether they reflect aspects of the biology of the Krt13+ suprabasal cells which are scattered throughout the human pseudostratified airway epithelium.
Pathologists have used the term “squamous metaplasia” to describe a wide variety of macroscopic tissue transformations ranging from influenza-associated bronchiolarization in the setting of diffuse alveolar damage to smoking-related metaplasia in COPD airways 38–41. Various biological mechanisms including transdifferentiation of Type 2 cells, plasticity of classic pseudostratified epithelium, and the expansion of rare metaplastic progenitors have been proposed in diverse murine and human models of squamous metaplasia 18,29,33,37,42,43. Indeed, we suggest that human “squamous metaplasia” could be sourced from 1) airway hillocks, 2) non-stereotyped KRT13+ aciliate airway patches, 3) KRT13+ suprabasal cells that likely represent the abundant KRT13+ cells found in human single cell atlases, 4) a frank conversion of normal pseudostratified epithelium, or 5) entirely distinct progenitor cells 40,42–45. A combination of spatially resolved transcriptomics and ex vivo functional assessments of regionally isolated tissue may help establish which forms of squamous metaplasia are reversible 18, which are protective, which may lead to pathologic squamous metaplasia, and perhaps clarify the elusive origins of squamous cell lung cancer.
Materials and Methods
Mouse Models
C57BL/6J mice (stock no. 000664), 129S1/SvImJ (stock no. 002448), MT-MG (stock no. 007676), nT-nG (stock no. 023035), and dominant negative RAR403 (stock no. 029812) mice were purchased from the Jackson Laboratory. CD1 mice were purchased from the Charles River Laboratories. Hillock distribution was assessed using F1 offspring from 1239S1/SvImJ and C57BL/6J crosses. KRT5-CreER 46, SCGB1A1-CreER 47, FOXJ1-CreER 48, FOXJ1-Cre 49, ifg-Mosaic 50 KRT6A-CreER 51, photoactivatable-GFP 4 lines were previously described. KRT13-CreER driver mouse was generated using CRISPR-Cas9 by Cyagen. The gRNA sequence used was CCGAAAGTATTAACTCAGCCTGG. No significant effect was found in heterozygous animals, however, homozygous KRT13-CreER mice exhibit diminished KRT13 protein staining, thus, all experiments were performed using heterozygous mice. A stable line of Membrane-GFP (mG) mice was generated by selecting GFP-positive pups of a FOXJ1-Cre-mTmG male parent (with mT to mG recombination in the sperm) and backcrossing to eliminate the Cre allele. The mG line without Cre was crossed to nT-nG to generate the “nT-mG” strain. Both male and female mice were used for initial characterization and sex was tested as an independent variable. Afterwards, mixed gender mice were used for all experiments. Tamoxifen was administered by intraperitoneal injection (150 mg/kg) for two consecutive days in adult (8–12 week old) mice to induce the Cre-mediated recombination, followed by a 1–2 week chase period before injury. Transgenic mice were maintained in a C57BL/6 background. These lines were outcrossed to hybrid strains to generate the intended allelic combinations. SNP analysis by Transnetyx indicated an outbred C57B/6 background. Occasional KRT13-CreER lineage trace mice exhibited diffuse non-specific labeling across the epithelium after tamoxifen induction. These mice were excluded from analyses. Mice were maintained in an Association for Assessment and Accreditation of Laboratory Animal Care-accredited animal facility at the Massachusetts General Hospital, and procedures were performed with Institutional Animal Care and Use Committee (IACUC)-approved protocols. Mice of all strains were housed in an environment with controlled temperature and humidity (temperature: 68–79F and the humidity: 30–70%), on 12-hour light:dark cycles and fed with regular rodent’s chow with the exception of mice fed with a vitamin A deficient chow (Teklad TD.08429 Vit A Defict Diet 9F). 2,3.
Transmission Electron Microscopy (TEM)
Upon harvest, the trachea was opened longitudinally and immersion-fixed with a solution of 2% paraformaldehyde/2.5% glutaraldehyde in 0.1M sodium cacodylate buffer (pH 7.4) for at least 2hr at room temperature, then transferred into fresh fixative & allowed to infiltrate in fixative overnight @ 4°C. Following fixation, the trachea was rinsed several times in cacodylate buffer then cut transversely (in between cartilage rings) to generate 5 smaller pieces of (W-shaped) tissue, which were returned to cacodylate buffer and rinsed again several times.
Specimens were infiltrated 1hr in 1% osmium tetroxide, rinsed several times again in cacodylate buffer, then dehydrated through a graded series of ethanols to 100%, followed by a brief (10min) dehydration in 100% propylene oxide. Samples were then allowed to pre-infiltrate 2–3hr in a 2:1 mix of propylene oxide and Eponate resin (Ted Pella, Redding, CA), then transferred into a 1:1 mix of propylene oxide and Eponate resin for overnight infiltration at room temperature on a gentle rotator.
The following day, specimens were placed into a 2:1 mix of Eponate/propylene oxide, allowed to infiltrate at least 2hr, then transferred into fresh 100% Eponate for several hours. Tissue was placed into flat molds with fresh 100% Eponate resin and allowed to polymerize in a 60°C oven (24–48hrs).
Thin (70nm) sections were cut using a Leica EM UC7 ultramicrotome, collected onto formvar-coated grids, stained with 2% uranyl acetate and Reynold’s lead citrate and examined in a JEOL JEM 1011 transmission electron microscope at 80 kV. Images were collected using an AMT digital imaging system with proprietary AMT Capture Engine software 7.00 (Advanced Microscopy Techniques, Danvers, MA).
Single Cell Sequencing
For the plate-based single cell RNA sequencing, distinct hillock vs pseudostratified epithelial structures were microdissected, then dissociated into single cells using papain. Single cells were then FACS sorted based on tdTomato fluorescence into each individual well of a 96 well plate. A plate-based, SMART-Seq2 full-length mRNA protocol for library construction was performed, and libraries sequenced on a HiSeq2500 with PE150 reads. Reads were trimmed and aligned to MM10 using STAR aligner 52, then processed using Cufflinks 53. Downstream analysis was performed using Seurat v4.0 or v 4.3.0 54. GO analysis was performed using EnrichR 55. Raw and processed data are deposited at GEO, under accession: GSE207479.
For 10x based single cell RNA sequencing of hillock-optimized dissociated cells, murine tracheas were dissected from 2 young (2-month) and 2 old (24-month) animals and dissociated to single cells in a two-step protocol. Tracheas were first incubated in 20 u/ml papain and 7.5 u/ml DNase I for 30min at 37°C with rotation, then triturated to release cells. Cells, debris and undissociated tracheal husks were pelleted and resuspended for a second enzymatic digestion in a mix of 350 u/ml collagenase I, 250 u/ml hyaluronidase, 60 u/ml dispase, 3.2 u/ml papain and 75 u/ml DNase I for 20min at 37°C with rotation. After the second digestion, the husks including the cartilaginous scaffold had been dissociated fully. Single cells were filtered through a 100μm filter and red blood cells were lysed using standard RBC lysis buffer. The single-cell suspensions were used for barcoding and library preparation with a Chromium Next GEM Single Cell 3’ Kit v3.1 according to the manufacturer’s protocol. Libraries were sequenced on NovaSeq 6000 S2 with paired-end reads. Reads were processed and aligned to the mm10 mouse genome reference using CellRanger. Downstream analysis was performed using Seurat 4.0 and RStudio. Differential gene expression (DGE) analysis of hillock basal, hillock luminal and pseudostratified epithelial clusters was performed with Seurat 4.0. DGE lists were prioritized by fold changes in mean RNA expression across clusters (X-axis of plots in Figure S5 B–E) and by prevalence score (Y-axis of plots in Figure S5 B–E), calculated according to the following formula:
. Raw and processed data are deposited at GEO, under accession GS244215.
For mouse bulk RNA/ATAC sequencing, cells from KRT13-CreER;LSL-TdTomato;TRP63-GFP/+ tracheas were dissociated and sorted. tdTomato+ GFP+ hillock basal cells and tdTomato- GFP+ pseudostratified basal cells were expanded in vitro for 10 days prior to sample collection for bulk RNA/ATAC sequencing. Total RNA samples or frozen cell pellets were provided to Novogene for processing according to standard protocols. Reads were mapped by Novogene to the genome build grcm38_p6_gca_000001635_8. Raw and processed data are deposited at GEO. RNA: GSE253021, ATAC: GSE253020.
Naphthalene Injury Model
Naphthalene or corn oil control were injected IP into female C57BL/6 mice at 12–13 weeks 12. Naphthalene was freshly dissolved in corn oil and was administered in a single intraperitoneal injection at 215 mg/kg or 275 mg/kg before 9 am.
Flu infection models
Mice were anesthetized using isoflurane and intranasally inoculated with influenza A (H1N1) virus (A/PR/8/34 strain, 1.5 × 10⁴ PFU). Tracheas were fixed two days later to characterize influenza infection. For ALI culture infection, 100 ul of 2 × 10⁷ PFU/ml of virus diluted in DMEM was applied to the top of the ALI culture for 2 hours before being removed. Cultures were fixed 24 hours after infection to characterize influenza infection.
HCl Injury Model
80 mM HCl was prepared in PBS to a final pH of 1.5. Freshly dissected whole trachea preparations or ALI culture were submerged in 80 mM HCl for 2 minutes. Samples were then washed in PBS with Biotium Live-or-Dye fixable viability solution (1:1000 dilution), washed three times in PBS and then fixed in 4% PFA for 15 minutes.
Freeze-Thaw Model
Freshly dissected whole trachea preparations were submerged in 500 ul of DMEM media, then placed in a −80 freezer for 20 minutes. Tubes were allowed to thaw at RT, then placed back in the −80 freezer for another 20 minutes. After the second thaw, tracheas were then washed in PBS with Biotium Live-or-Dye fixable viability solution (1:1000 dilution), washed three times in PBS and then fixed in 4% PFA for 15 minutes.
Liquid Nitrogen Cryospray
Freshly dissected whole trachea preparations were placed onto a gelatin sponge with the luminal surface exposed (Gelfoam, Pfizer). Using a Brymill handheld liquid nitrogen delivery system (CRY-BABY, 20-gauge straight spray nozzle), the luminal surface of the trachea or apical ALI culture surface was sprayed with liquid nitrogen until uniform frost formation occurred across the entire luminal surface. Subsequent experiments with explant culture or immediate staining were then performed.
Papain Dissociation
Freshly dissected whole trachea preparations were submerged in 500 ul of each enzyme dissociation cocktail for 30 minutes with gentle rocking at 37 C. Papain (13.3 u/ml or 10 u/ml) was dissolved in EBSS buffer prior to mixing with activation buffer consisting of 0.067 mM beta-mercaptoethanol, 1.1 mM EDTA, 5.5 mM Cystein-HCl in EBSS. Pronase was dissolved at 20 mg/ml in EBSS as a stock prior to dilution to a final concentration of 1 mg/ml. Dispase was dissolved as a stock concentration of 2.5U/ml in PBS prior to dilution to a final concentration of 0.06 u/ml. Enzyme mix used for dissociation protocol consisted of 25 ul of 70kU/ml Collagenase I, 25 ul of 50kU/ml hyaluronidase, 50 ul of 7.5kU/ml DNAse, 120 ul of 2.5U/ml dispase, 400 ul of 40 u/ml papain, to a final volume of 5 ml using regular ringer’s solution. In all cases, single enzyme incubations were done for 30 min at 37 C with gentle rocking, while the enzyme cocktail mix was incubated for 20 min at 37 C with gentle rocking.
Trypsin Dissociation
ALI membranes were cut using a scalpel and placed in a 1.5mL eppendorf tube containing 1mL of TryLE Express Enzyme with phenol red (Gibco, #12605010) and agitated for 20 minutes. ALI membranes were then fixed with 4% paraformaldehyde.
Murine in vitro model
Trachea from 12 week old KRT13-CreER;LSL-tdTomato or KRT6A-CreER;MTMG were dissociated using the hillock-optimized enzymatic cocktail described above. Tissue fragments were strained through a mesh filter prior to two washes in full growth media (described below) and then pelleted at 500g for 5 minutes at RT. Pellets were resuspended in 2 ml of growth media before plating onto a single well of a 6-well plate, coated with 804G conditioned media. After 2–3 days, cells were passaged onto a single well of a non-coated 6-well plate, prior to expansion and ALI culture. For ALI culture, 250k cells were plated onto 804G coated 24-well transwells (Corning, 6.5mm, #3470) in full growth media in both chambers. The next day, media was aspirated from the top chamber, while complete Pneumacult ALI differentiation media (#05001) was added to the bottom chamber. ALI cultures were grown for 14 days, with daily media changes, before adding 4% PFA to both top and bottom chambers for 5 minutes at RT. Staining was done in the chamber, prior to mounting on glass slides in Vectashield mounting media.
The growth media was comprised of Lonza SAGM (#CC-3118), with the full BulletKit supplements, 500 ul of 5 mM Y27632, 50 ul of 10 mM CHIR99021, 50 ul of 10 mM A8301, and 1x primocin, modified from published protocols 56,57.
To develop the in vitro hillock model, trachea were harvested from 8 week old K13-CreER;LSL-tdTomato mice after tamoxifen treatment as described. Both hillock and non-hillock basal cells were grown in mixed culture as denoted above. Upon transition to Pneumacult ALI differentiation media, AGN193019 was added to media at concentrations marked in the figure panel. 1uM DMSO was used in control cultures. ALI cultures were grown for 21 days, with media changes every other day. To separate hillock and non-hillock basal cells for AGN193019 treatment, cells dissociated from KRT13-CreER;LSL-mTmG trachea were stained with EpCAM-BV421 (BioLegend 118225) and GSIβ4-Alexa Fluor 647 (ThermoFisher Scientific I32450) on ice for 30 minutes before FACS as previously reported 58. Hillock basal cells were sorted as EGFP+, EpCAM+ and GSIβ4+ cells, while non-hillock basal cells were sorted as tdTomato+, EpCAM+ and GSIβ4+ cells.
Human in vitro hillock model
Donor lungs were received from New England Donor services. Airways were dissected to subsegmental bronchi and pinned open onto a 15cm cell culture dish (USA Scientific, #CC7682–3614) coated with Sylgard 184 silicone elastomer (EMS Catalog #24236–10). Live tissue was incubated in DMEM/F12 (Gibco, 11320033) with WGA-CF594 (Biotum, #29023, 10ug/mL) for 30 minutes at room temperature. Tissue was rinsed in DMEM/F12 for 20 minutes. Using a stereoscope (Nikon, SMZ745) with epifluorescence, aciliate areas were identified by the absence of WGA staining and a lack of beating cilia. A 15C surgical blade (Fischer, 22–079-694) was used to microdissect aciliate (possible hillock) and ciliated patches (control). The isolated regions were used for cross sectional staining or dissociated for basal cell culture. As described, a combination of enzymes optimized for hillock dissociation was utilized (70kU/ml Collagenase I, 50kU/ml hyaluronidase, 7.5kU/ml DNAse, 2.5U/ml dispase, 40 u/ml papain) and patches were dissociated for 30 minutes at 37C with agitation. Cells were spun down in PneumaCult-Ex Plus medium (StemCell Tech) containing 0.5 μM DMH-1 (Tocris #4126), 1μM CHIR 99021 (Tocris #4423), 1μM A-83–01 (Tocris #2939), 5μM Y-27632 (Selleckbio #S1049) and Primocin 500x (Invivogen #ant-pm-2). The resuspended cell pellet was subsequently plated onto dishes coated with 804G conditioned media and then expanded. For ALI culture, 150k cells were plated onto 804G coated transwells (Corning, 6.5mm, #3470) and placed into Pneumacult ALI differentiation media containing 10nM of Agn193109. Media was changed every other day until full differentiation 21–28 days later.
Human wholemount staining
Donor lungs were received from New England Donor Services with Mass General Brigham IRB approval and deemed “not human subjects research” as it was completely deidentified post-mortem tissue. New England Donor Services obtained informed consent. Airways were dissected from the alveolar mass and other connective tissue. A single incision was cut at the ventral side of the airways from the trachea down to the smallest visible airways. PBS was used to extensively wash the airway to remove mucus and other debris. Airways were then pinned to a soft silicone mat poured in a 15-cm petri plate to ensure that all surfaces had equal access. The plate was cooled on ice, and then a dam of modeling clay was used to outline the airway structure, and cooled 4% agarose was poured into the empty area to minimize reagent use. Tissue was then fixed with 4% PFA for 1 hour with gentle agitation. After 3 washes in PBS, the airway was permeabilized in 0.1% PBST (tween) for 1 hour with gentle agitation. Either 1:3000 acetylated tubulin antibody or 1:2000 KRT13 antibody was diluted in 1% BSA, 3% triton in PBS and incubated with the airway 1 hour (RT) or overnight (4 C). Sample was then washed 3x in PBST for a total of 1 hour. Alkaline phosphatase-anti-mouse (1:1000) or horseradish peroxidase-anti-rabbit (1:1000) was then incubated with the tissue in TNB block (0.1M Tris, pH7.5, 0.15M NaCl, 0.5% casein blocking reagent) for 1 hour at RT with gentle agitation. For alkaline phosphatase, ImmPACT Vector Red Substrate was used following the manufacturers instructions. For horseradish peroxidase, 2 mg/ml DAB dissolved in 0.1M citrate-HCL at pH5.1 was incubated with the tissue for 20 minutes at RT with gentle agitation. Tissue was then washed 5x in PBS for a total of 2 hours at RT. To image, a Rebel XT dSLR camera was attached to a dissecting scope camera mount, and imaged at 5x. Individual images were then stitched into a single wholemount image using PTGui 12.10.
Immunostaining
For frozen tissue sections, mouse tracheas were harvested and fixed in 4%PFA in PBS for 20 minutes at room temperature. Tracheas were washed twice in PBS for 15 min, followed by overnight incubation in 30% sucrose at 4°C, transferred to Optimal Cutting Medium (OCT) solution and frozen in OCT. Frozen blocks with tracheas were cryosectioned and stained as previously described 59.
For wholemount analysis, mouse tracheas were harvested, and the luminal surface was exposed by cutting vertically along the anterior tracheal wall. The tissue was fixed in 4%PFA in PBS for 20 min at room temperature, washed in PBS three times for a total of 1 hour, permeabilized in PBS-0.1%Tween (PBST) for 15 minutes, then stained with primary antibody either overnight at 4C or for 1 hour at room temperature, diluted in 1%BSA-0.3%PBST (triton-x100) with gentle inversion. Information on antibodies used are available in Supplementary Table 2. After the primary antibody incubation, the tracheas were washed in PBST for 1 hour, stained with a secondary antibody at RT for 60 min with gentle inversion, then washed in PBS for 1 hour and mounted on a regular glass slide using a mounting medium (Vectashield, Vector Laboratories or Fluoromount-G, Southern Biotech). To flatten the trachea, slides were compressed using a small magnet placed directly above the trachea on top of the coverslip, while the whole slide was placed on top of a metal surface. Mountant was allowed to cure overnight.
TUNEL staining was performed using the Invitrogen™ Click-iT™ Plus TUNEL Assay Kits for In Situ Apoptosis Detection (Cat# C10617), and performed according to supplier instructions.
Explants and sections were imaged on either an Olympus FV10i laser scanning confocal imaging system using either a 10X air or a 60X oil objective or a Leica SP8 laser scanning confocal with HyD detectors and a white-light laser source. Single optical section or maximum intensity projections are presented as specified in each figure, and signal from each channel was pseudocolored as specified in the figures.
For quantification of lineage labeling specificity, hillock regions were defined as characteristic aciliate KRT13+ patches using wholemount immunohistochemistry. Colocalization of TdTomato signal was established using Fiji 2.11.0.
For cryosectioning of archival wholemounts, tissue was previously coverslipped in Fluromount-G (SouthernBiotech) and stored at −20 for up to 4 years. Slides were soaked in PBS at 4C in a slide box with gentle agitation until coverslips either floated off or were easily removed. Wholemounts were washed in PBS for 5 minutes, cryoprotected in 30% sucrose in PBS at 4C overnight, embedded in OCT, and frozen. 12 um sections were cut on a Leica cryostat before standard slide immunostaining was performed.
Trachea Explant Culture
Tracheas were dissected, cleared of connective tissue and adjacent organ tissue, and opened longitudinally along the ventral tracheal wall. The tracheas were placed on a gelatin sponge (Gelfoam, Pfizer) on ice in DMEM/F-12 Media with Primocin (InVivoGen) and 15 mM HEPES until culture. Trachea explants were cultured in three different ways.
For standard, unperturbed long-term culture, including the daily time lapse imaging experiments, the trachea explant was cultured on a fully saturated gelatin sponge with the media (DMEM/F12/HEPES/Primocin) meniscus located below the top of the sponge, in a tissue culture dish inside a standard tissue culture incubator. The fluorescent tracheas were imaged on the sponge with upright microscopy or they were placed on the bottom of a dish attached to the sponge for imaging with inverted microscopy.
For short-term, real-time imaging with confocal and 2-photon microscopy, the trachea was sutured onto a silicone o-ring and placed in a custom-made tissue culture dish over an inverted air-liquid interface (ALI) insert secured by PDMS. This approach ensured stability during high resolution imaging. The media contacted the explant from below through the ALI membrane. The dish was placed in a physiological live imaging chamber (CO2 and temperature-controlled, TokaiHit) on the stage of the 2-photon microscope 60.
For studies involving regeneration with retinoic acid inhibitor modulation, cryo-injury was performed on tracheal explants as described. Explants were cultured on gelatin sponges (as above) with Pneumacult ALI differentiation media (Stem Cell Tech) with or without 1uM of Agn193109 for 14 days. Immunohistochemistry was performed as described.
For overnight EdU staining, 10uM EdU is added to the tracheal explant culture system described above 61.
2-Photon Microscopy
Live Imaging:
Trachea explant imaging was performed on an Olympus FVMPE-RS multiphoton laser scanning microscope equipped with a MaiTai HPDS-O IR pulsed laser (900 nm for GFP and SHG) and INSIGHT X3-OL IR pulsed laser (1100 nm for tdTomato), using a 25X water immersion lens (NA 1.05). Explants were imaged at time points as indicated in the figures. For orthogonal view reconstruction, we scanned the trachea with 0.5 μm Z steps; for maximum intensity projection view, we used 3 μm Z-steps. To reimage the same trachea at high resolution at different time points, landmarks such as cartilage rings and vascular patterns were used as fiduciary marks. These fiduciary marks were also used for 2D and 3D registration of different time points. For photoactivatable GFP imaging, cells were identified fluorescently with membrane tomato as above and individual cells were stimulated with a pulse of 780nm light at 10% laser power for 2 minutes to activate GFP as previously described 4.
Fixed Imaging:
Hillock AGN193109 treated ALI cultures and controls were fixed and mounted as described. En face images were obtained using an XLPLN25XWMP2 objective (water immersion). For imaging of Alexa 488, Draq5, Alexa 405, and DRAQ5, the MaiTai HPDS-O IR pulsed laser was set at 800 nm and for tdTomato, an INSIGHT X3-OL IR pulsed laser was set at 1000 nm. Optical cross sections were obtained using a 60x silicone immersion lens (UPLASAPO60XS2) with 0.5 μm Z steps.
TEER Measurements
ALI cultures were submerged in PBS. Using Millipore-ERS and MERS STX01 electrodes, trans epithelial electrical resistance was measured (TEER) in 3–6 technical replicates to obtain an average TEER per ALI (k-ohms). This was repeated for 3 biological replicates.
Statistical Analysis and Reproducibility
All representative images in main and extended data figures were demonstrated on at least three samples to ensure reproducibility. Each datapoint on a graph represents a single animal, with the exception of Extended Data Figure 5F and Extended Data Figure Fig 7C, where each section or 20x field of view is quantified. Data was compared among groups first with a Shapiro Wilk normality test and equal variance test. If both passed, an unpaired, two-tailed t-test was performed. If they failed the normality test, a Mann-Whitney Rank Sum test was performed. In each figure legend, p-values and n are reported. Analysis was performed with Graphpad Prism software (version 8.3.0 or 10) or SigmaPlot12, and then plotted using R (4.1.3). All error bars are standard deviations.
Extended Data
Extended Data Fig. 1: Phenotypic and molecular characterization of hillocks.
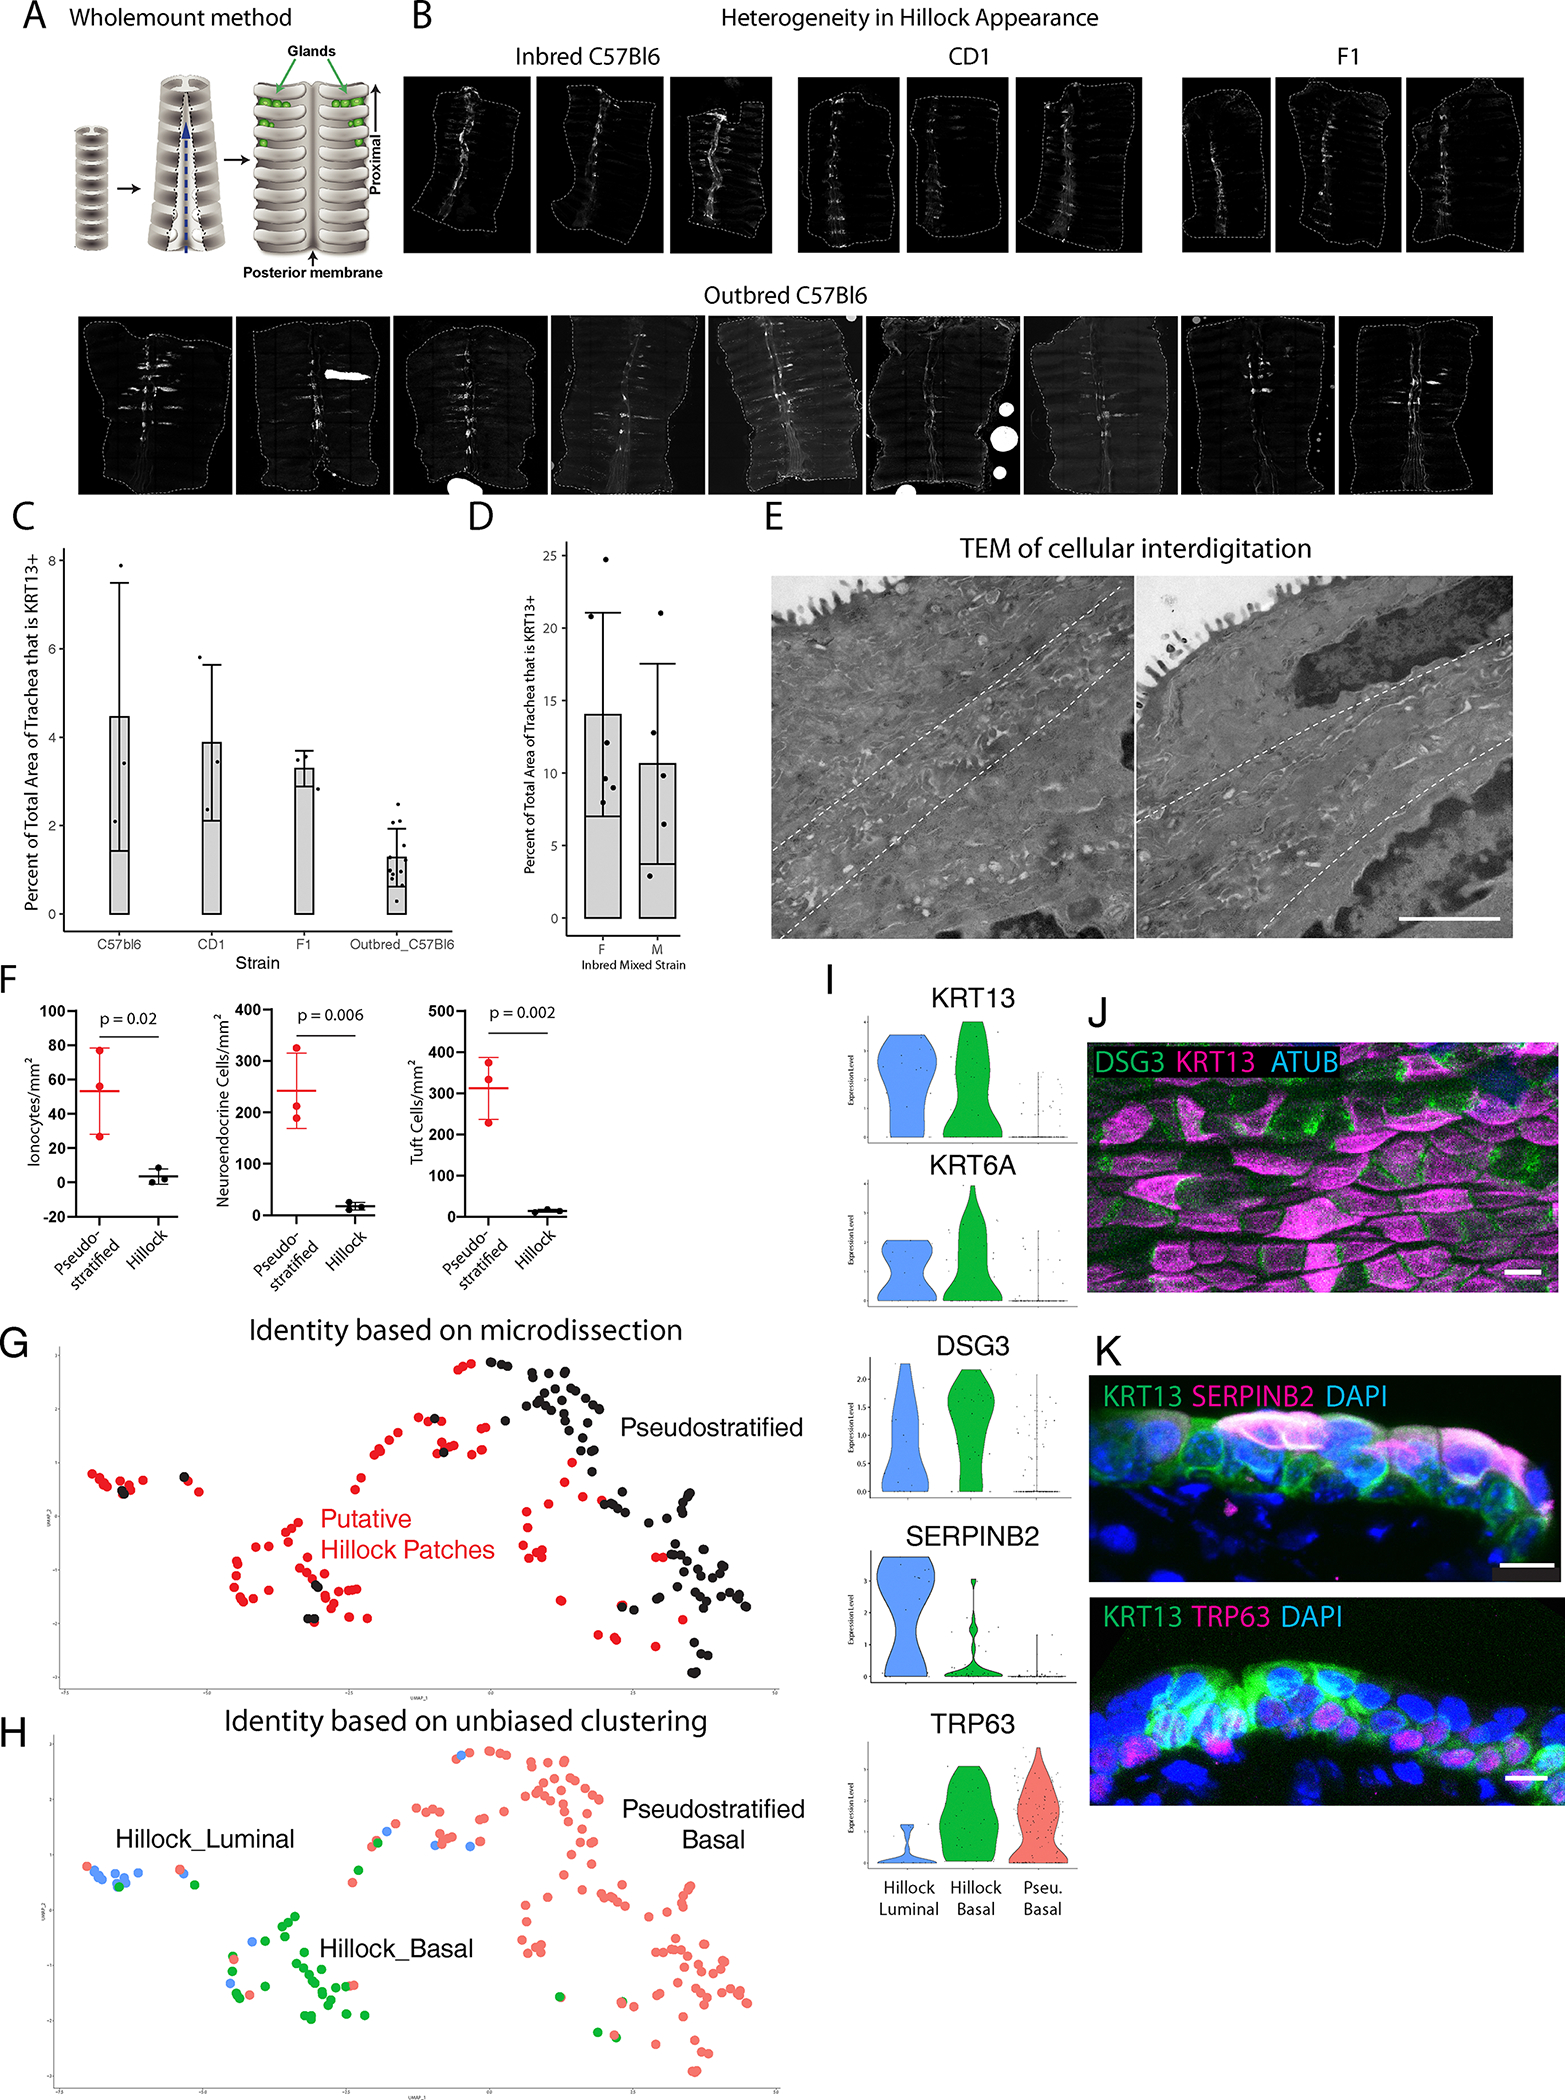
(A) Schematic of wholemount preparation. (B) Representative wholemount images of inbred C57Bl6, CD1, and outbred C57Bl6 mice (primary strain of mice used in this manuscript) showing variability of the characteristic pattern of hillock size and location. (C) Quantification of the percent tracheal surface area covered by hillocks in a variety of murine backgrounds at 10–12 weeks of age. Each dot represents a biologically independent mouse replicate. SD is marked. (D) Quantification of hillock size in 16 week old male and female mice on a mixed inbred background show no significant sex-dependent difference. Each dot represents a single wholemount trachea. (Female: n=6, male: n=5, Shapiro-Wilk normality test p=0.120, equal variance test p=0.774, two-tailed t-test p=0.441). Error bars are SD and mean is shown. (E) Representative transmission electron microscopy panels of the interface of two hillock cells showing interdigitation between the dotted lines. (F) Quantification of rare cells in hillocks (n=3 biologically independent animals). Mean is marked. (G) UMAP representation of single cell RNAseq profiles obtained using the SMART-seq protocol on microdissected regions of trachea. Black dots represent basal cells isolated from pseudostratified epithelium surrounding putative hillocks. Red dots represent cells isolated from microdissected putative hillock patches of tamoxifen induced TRP63-CreER;LSL-TdTomato mice. (H) Unbiased cluster assignment of single cell data, separates hillock luminal cells, hillock basal cells, and pseudostratified basal cells. Cells isolated from microdissected hillock patches are enriched for hillock luminal and basal cells. (I) Violin plots demonstrating that both hillock basal and luminal cell clusters specifically express Krt13, Krt6a, and Dsg3. Basal hillock cells additionally express Trp63 like their pseudostratified counterparts. Hillock luminal cells uniquely express Serpinb2. Basal cells of pseudostratified epithelium express Trp63 but not the hillock cytokeratins. (J) Wholemount immunostaining of DSG3 puncta. (K) Cryosection immunostaining of SERPINB2 and TRP63 within hillocks. Stain replicated on three trachea. Scale bar 20 μm (B), 300 nm (E), 50 μm (J), 10 μm (K)
Extended Data Fig. 2: Hillocks are resistant to papain dissociation.
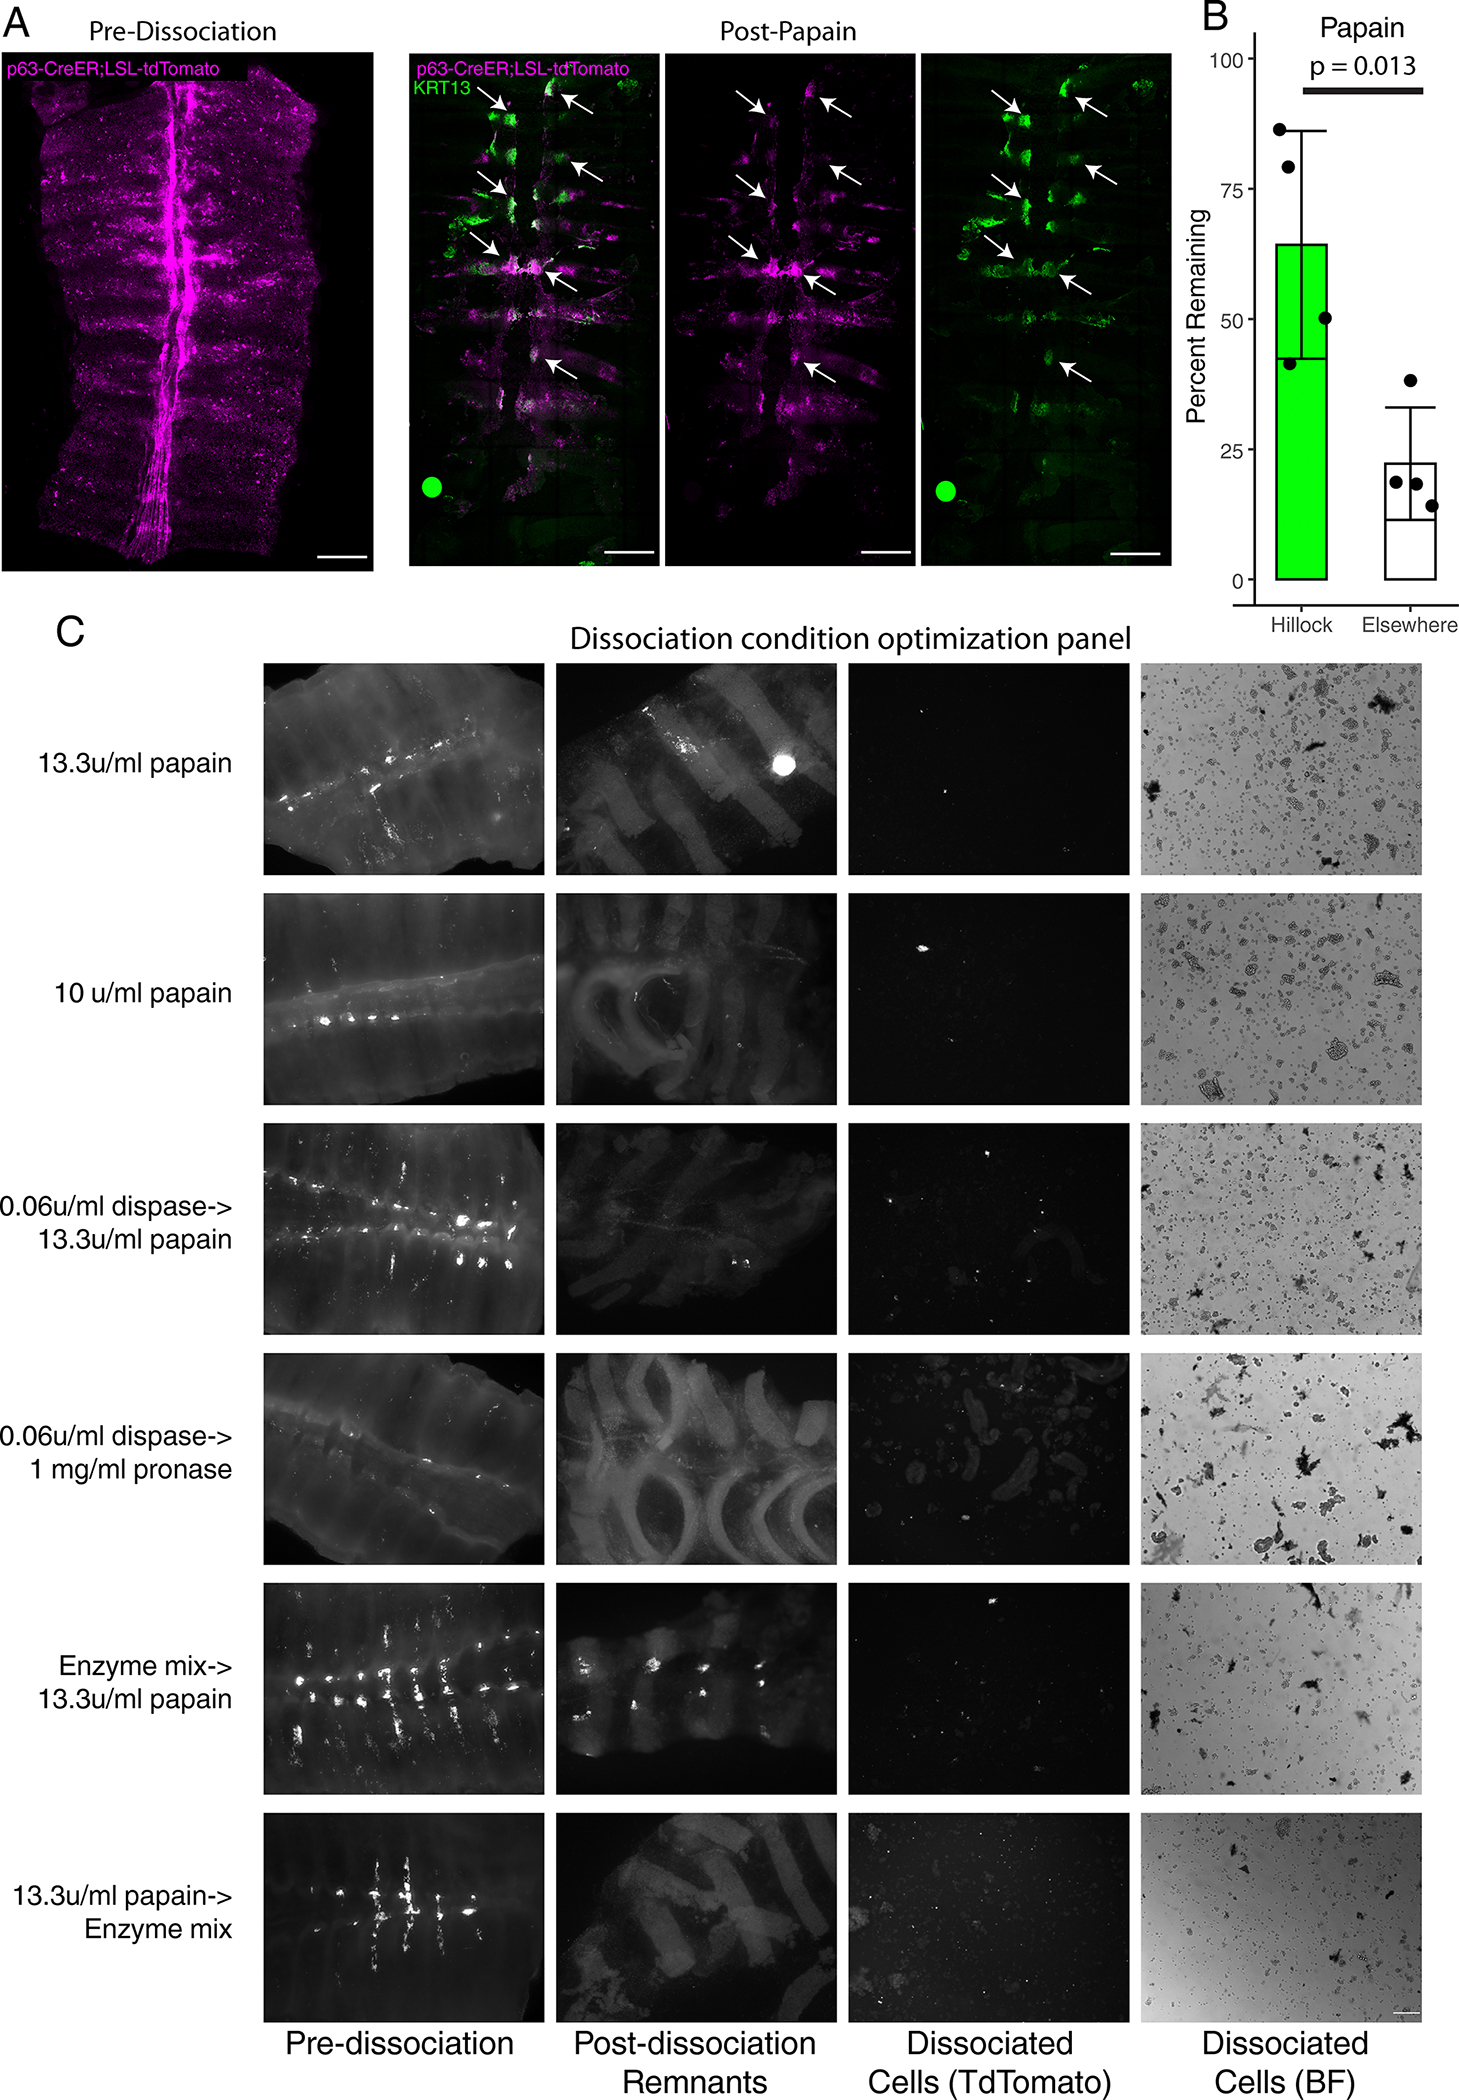
(A) Representative wholemount image of a tamoxifen induced TRP63-CreER;LSL-TdTomato trachea before (left panel) and after papain dissociation (right panels). Arrows point to regions of the trachea that are KRT13+, which are the only regions of the epithelium that have resisted dissociation. (B) Quantification of the percent of TdTomato signal remaining within hillocks vs surrounding pseudostratified epithelium. Each dot represents a single, biologically independent wholemount trachea. SD and mean are marked. (C) Matrix of dissociation conditions and their efficacy in dissociating hillocks into a single cell suspension. Only papain followed sequentially by an enzyme mix effectively dissociates hillocks to yield single cell suspensions. Scale bar 250 μm (A, C)
Extended Data Fig. 3: Single-cell sequencing of hillock-optimized dissociated trachea.
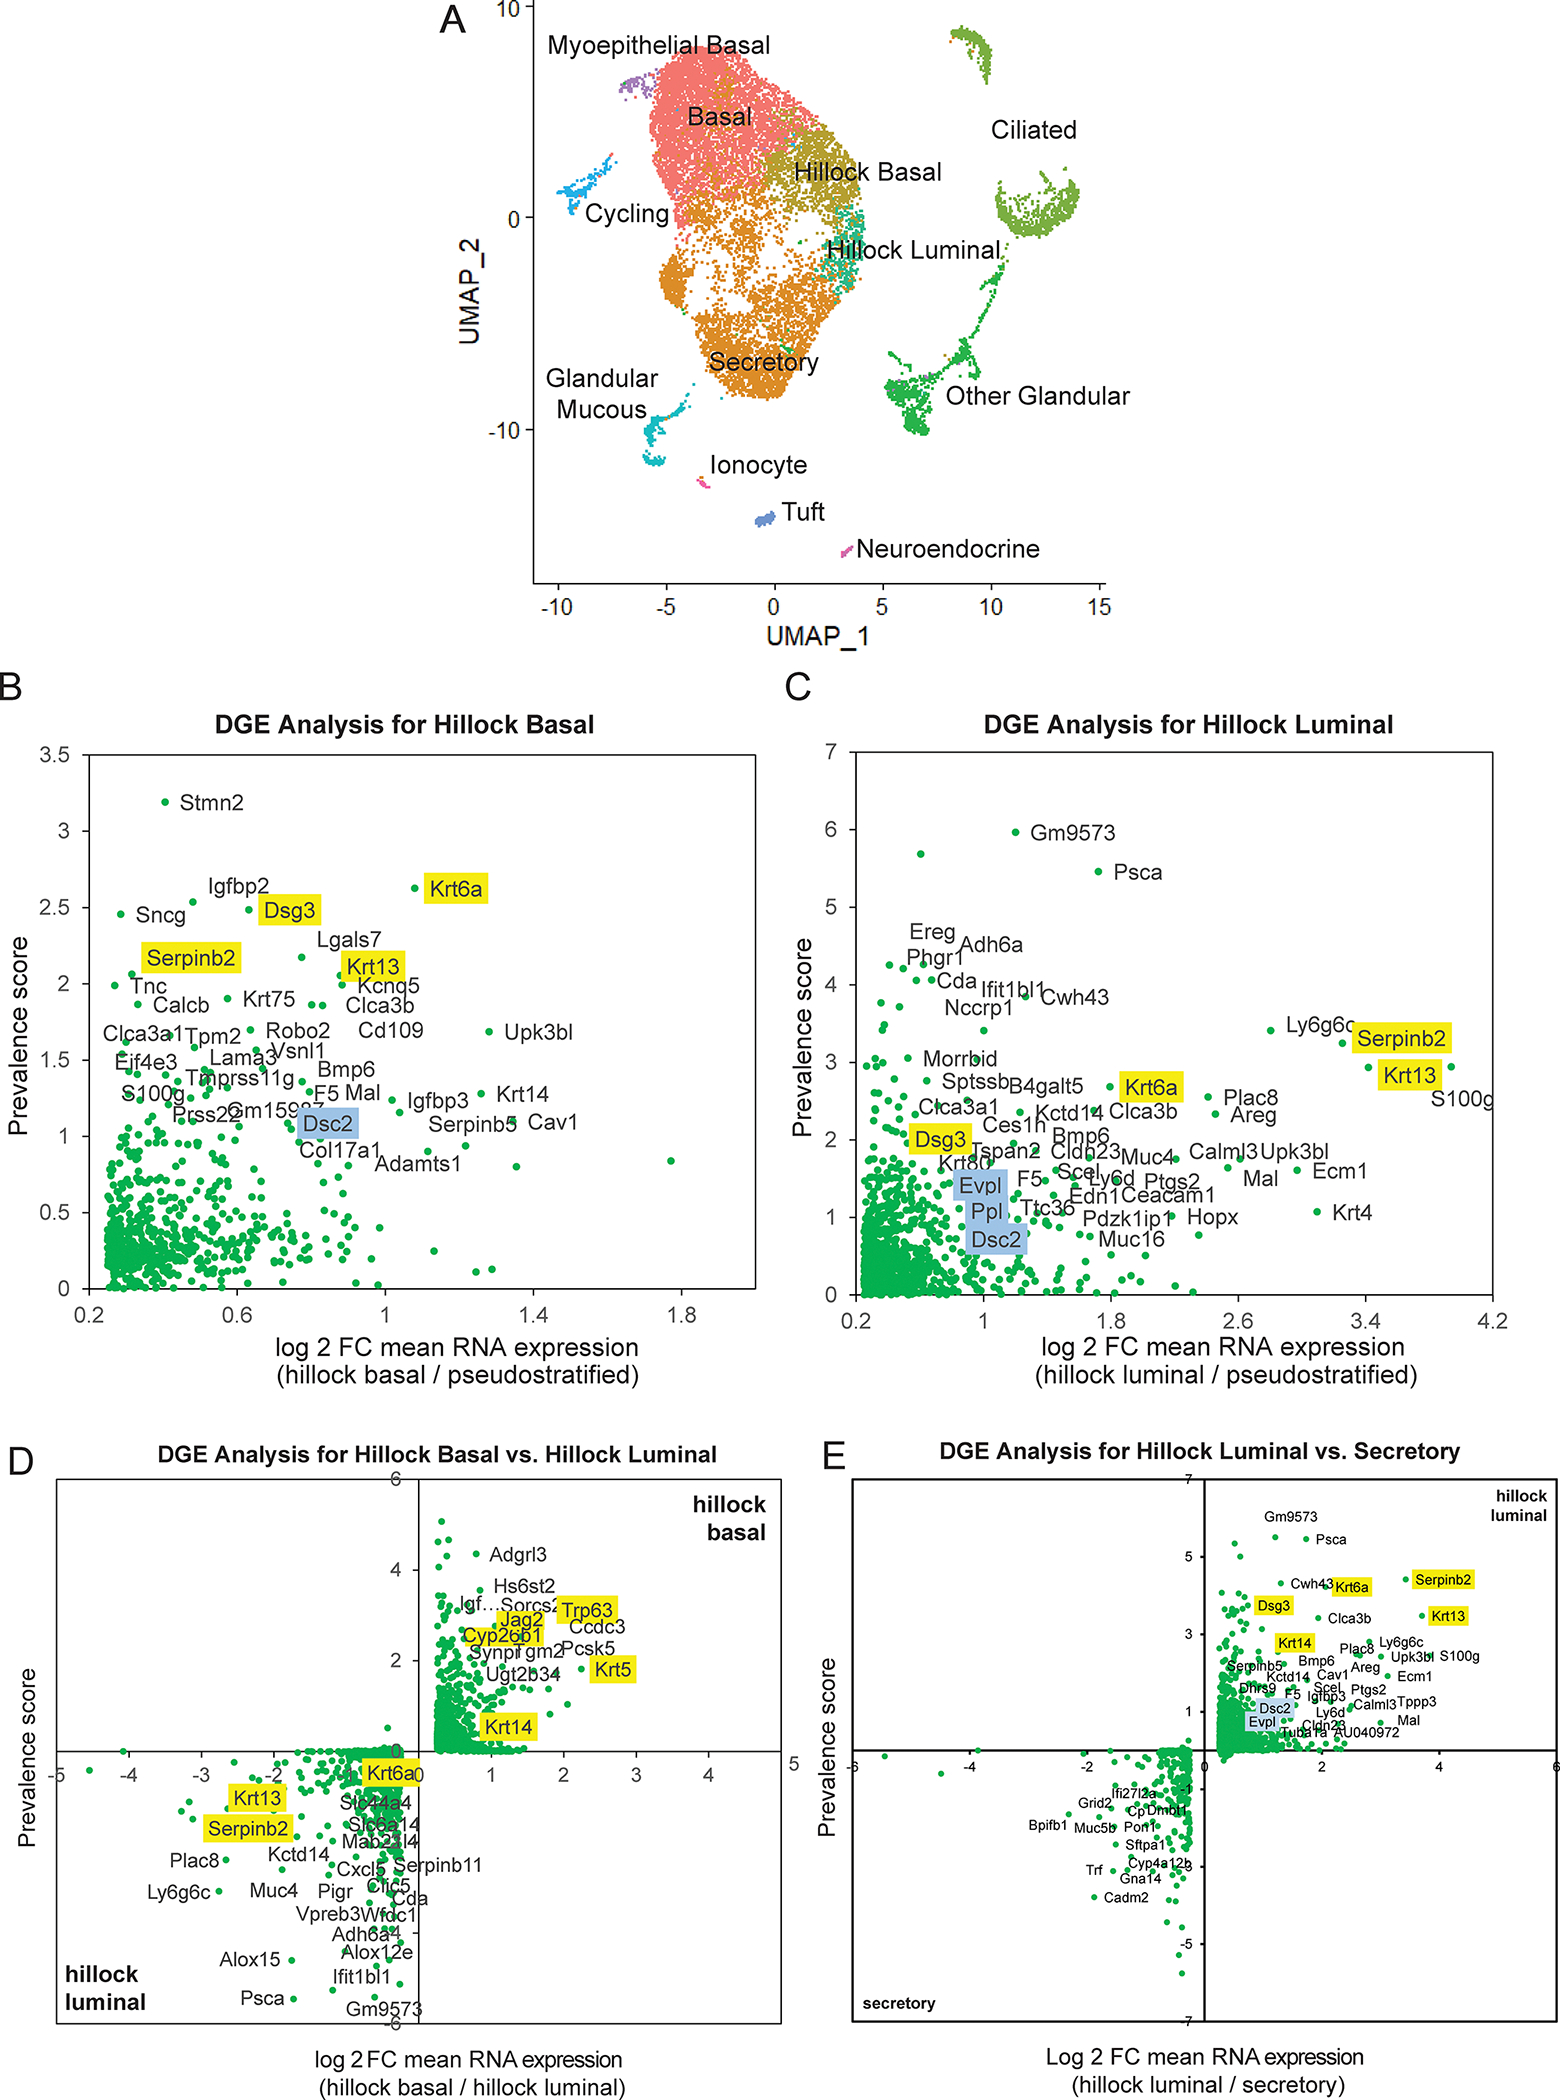
(A) UMAP representation of single-cell RNA-seq data from 4 trachea dissociated using an optimized enzymatic cocktail. (B) Differential gene expression (DGE) analysis of hillock basal cells compared to all pseudostratified cells. (C) DGE analysis of hillock luminal cells compared to all pseudostratified cells. (D) Direct DGE comparison of hillock basal vs hillock luminal cells. (E) Direct DGE comparison of hillock luminal cells vs secretory cells. In all DGE plots, yellow highlighted genes were identified in the previous SMART-seq based single-cell RNA-seq, and blue highlighted genes are unique adhesion-associated genes found using this new dataset.
Extended Data Fig. 4: Generation of a KRT13-CreER driver and demonstration that hillock luminal cells are not secretory cells.
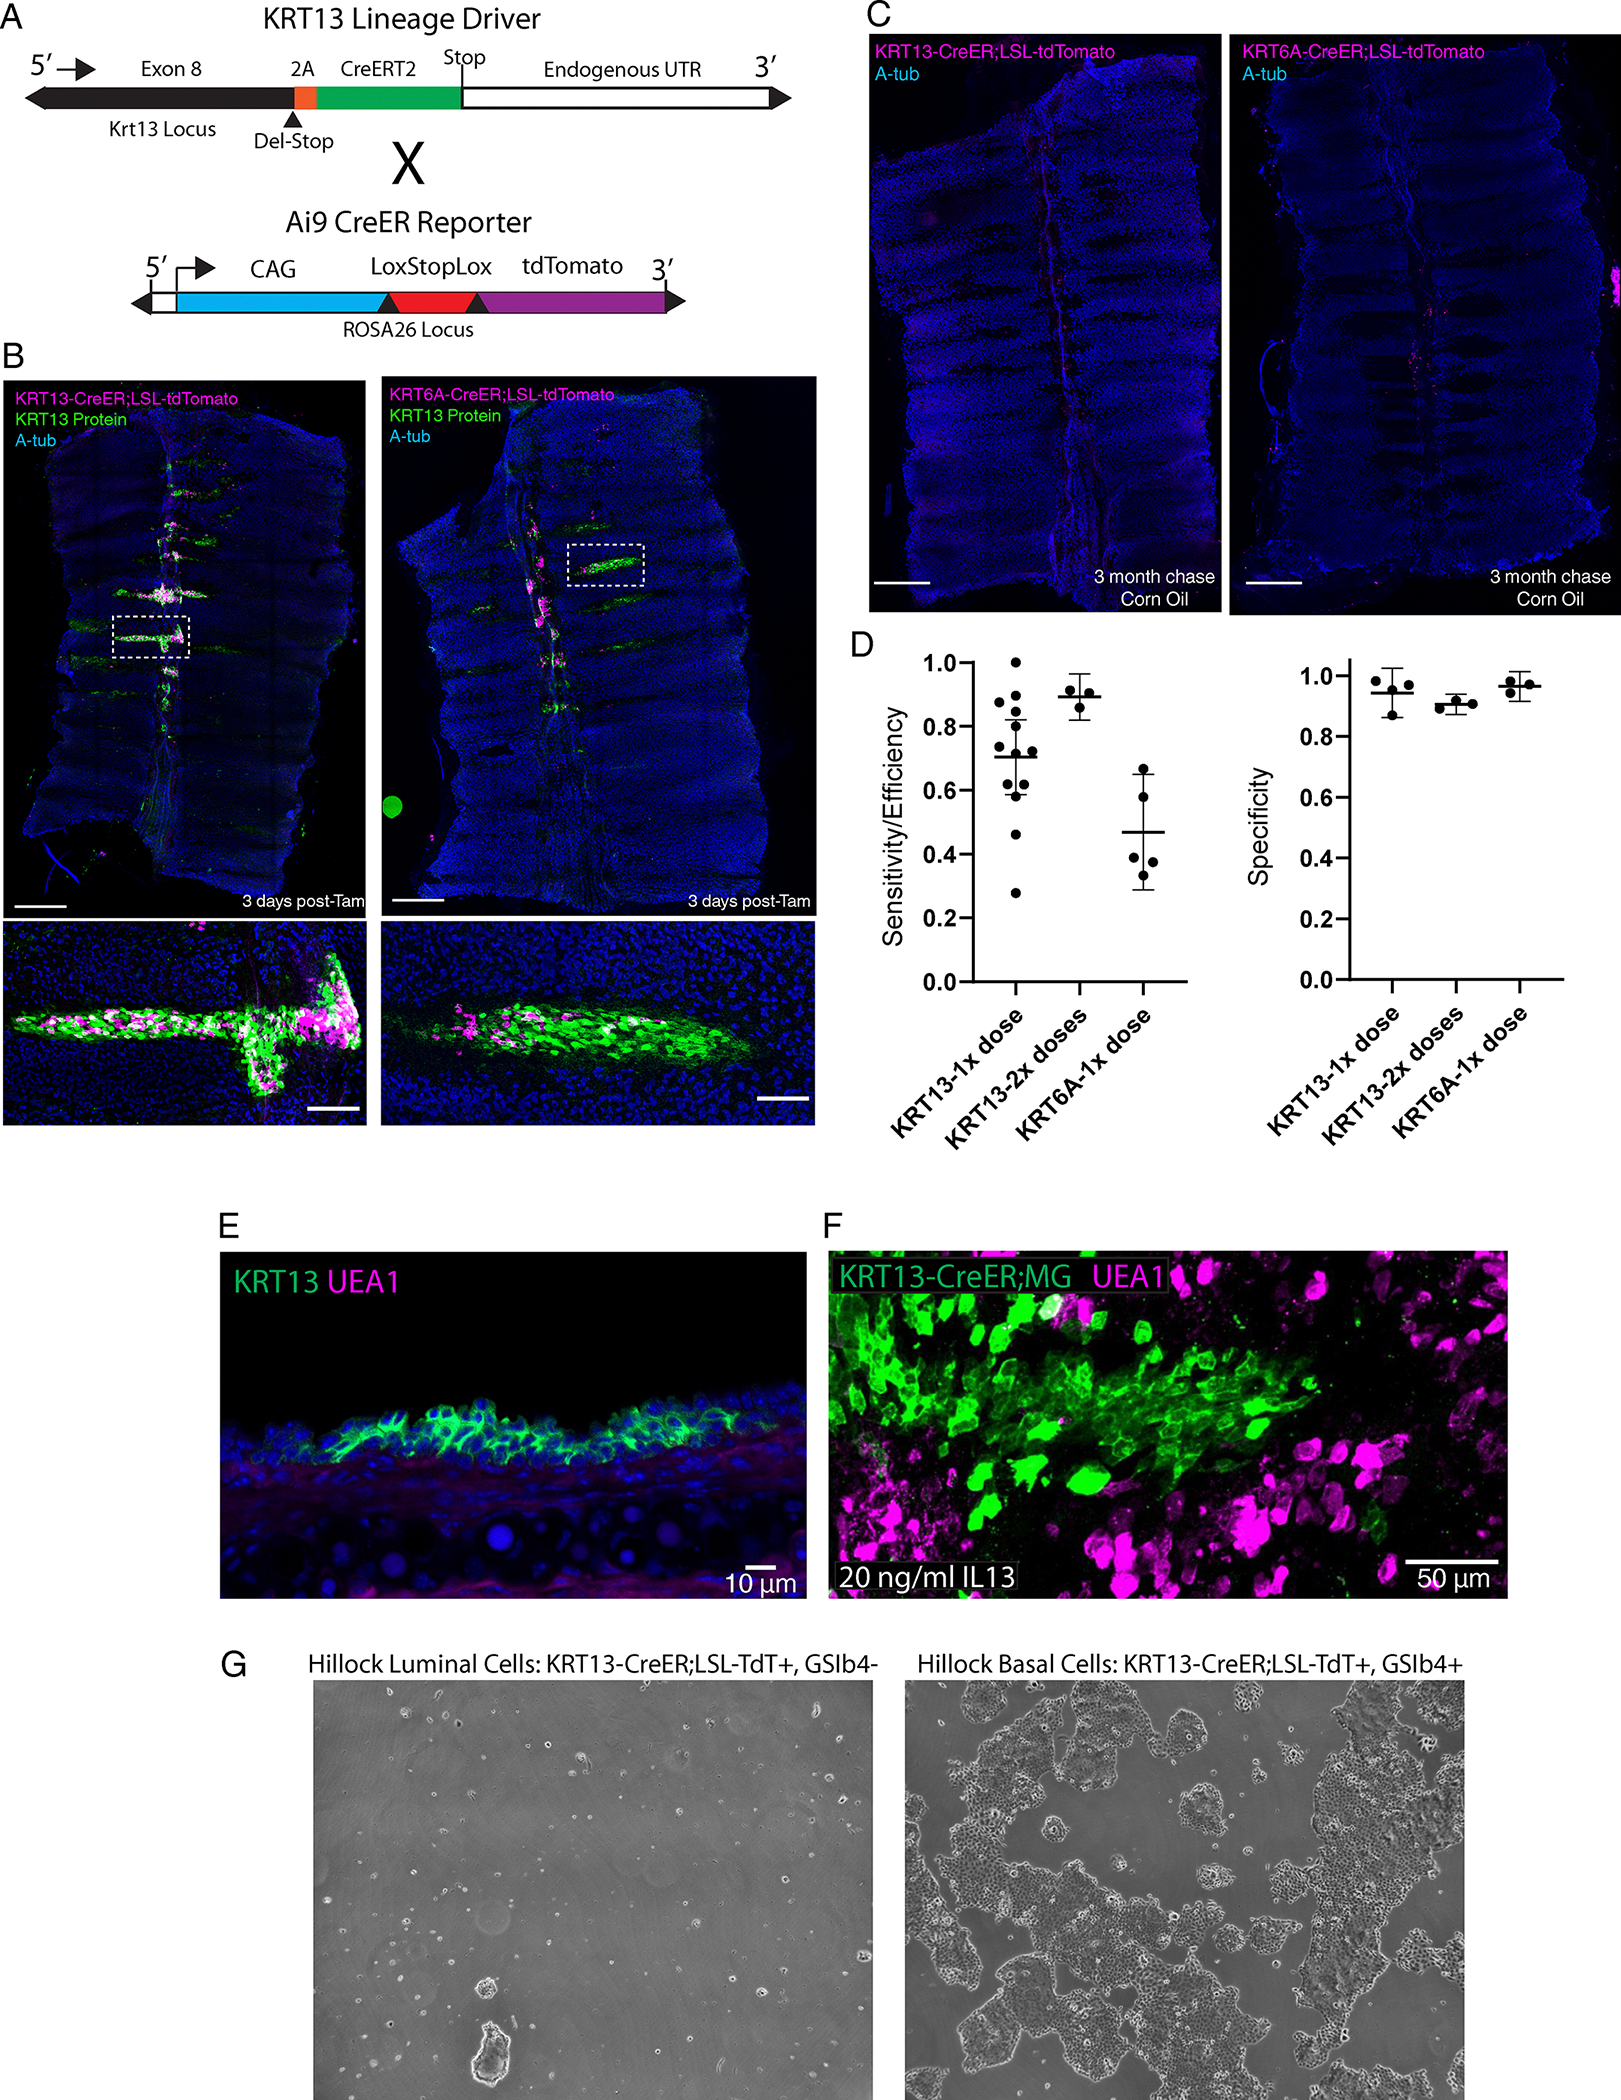
(A) Schematic of 2A-CreER cassette knocked into the native KRT13 locus via CRISPR-Cas9. (B) Representative wholemount stains with high-mag insets (below) of KRT13-CreER and KRT6-CreER lineage trace mice 3 days post-tamoxifen induction showing high hillock cell labeling specificity. (C) Representative wholemount stains of control KRT13-CreER and KRT6-CreER lineage trace trachea show no appreciable labeling in the absence of tamoxifen after 3 months. (D) Quantification of efficiency and specificity of the two hillock-specific drivers with either 1 or 2 doses of tamoxifen. (Left) Efficiency was measured using cryosections and manual counting of cells that were labeled using either KRT13-CreER or KRT6-CreER mice. 3 animals for each condition were sectioned, and each dot represents a single section (KRT13 1x dose: n=13, KRT13 2x dose: n=3, KRT6: n=5). (Right) Specificity was measured using confocal Z-slices through the entire airway. Each dot represents a single animal wholemount (KRT13 1x dose: n=4, KRT13 2x dose: n=3, KRT6: n=3) (E) A representative cryosection of a hillock in an unperturbed wildtype animal shows no UEA1+ goblet cells within the hillock. (F) A representative image of a cultured wholemount explant treated with 20 ng/ml of IL13 and dual-SMAD (10uM A8301 and 10uM DMH1) inhibition. Secretory cells outside of the hillock are now UEA1+, while hillocks remain UEA1 negative. (G) Hillock luminal cells sorted on the basis of KRT13-CreER;TdT+ and GSib4- do not dedifferentiate and expand following dual-SMAD inhibition. Experiment replicated on three trachea. SD and mean are shown. Scale bar 250 μm (top of B, C), 50 μm (bottom of B) and F, 10 μm (E)
Extended Data Fig. 5: Hillocks harbor a pool of active stem cells that continually generate pseudostratified epithelium during homeostasis.
(A) Clones of basal cells following a 3 month chase using the pan-basal TRP63-CreER driver. Asterisks mark two large clones in the hillock (left). Arrows mark single or two cell clones in pseudostratified ciliated epithelium (right). (B) Representative wholemount images of KRT13-CreER mice 2 days, 1 month, and 3 months after lineage labeling of homeostatic trachea. Boxes represent the insets in main Figure 1H. (C) Representative confocal images of cryosectioned trachea 2 days post-labeling shown in (B), stained for the basal cell marker TRP63 and the hillock marker KRT13. (D) Representative wholemount images of KRT6A-CreER mice 3 months after lineage labeling along with a high-mag image below. (E) Representative cryosections of the 3 month-long chase trachea shown in Figure 1H that was initially stained as a wholemount for basal stem cells (KRT5), secretory cells (CC10), and ciliated cells (Atub). Arrowheads mark lineage traced basal, secretory, and ciliated cells. (F) Quantification of the number of basal, secretory, and ciliated cells that are KRT13-CreER lineage labeled following a 3 month chase. Each dot represents data from a single sagittal section of the trachea counted in its entirety, evenly sampling 3 different animals. SD and mean are marked. (G) Summary schematic of a hillock flanked by sparsely ciliated transition zones and surrounded by pseudostratified epithelium. Scale bars 100 μm (A, bottom of D), 250 μm (B, top of D), 20 μm (C), 10 μm (E)
Extended Data Fig. 6: Characterization of naphthalene injury.
(A) Quantification of cell death after 80 mM HCl demonstrates decreased hillock cell death. (B) Quantification of EdU+ nuclei after 80 mM HCl reveals increased hillock cell proliferation. (C) Quantification of cell death after freeze-thaw with less death in the hillock. (D) Quantification of EdU+ replicating cells after freeze-thaw with more replication in the hillock. (E) Quantification of the percent area expressing influenza nuclear protein in pseudostratified vs hillock regions showing hillock resistance to flu infection. Each individual point represents a separate mouse trachea. Unpaired two-tailed t-tests were performed. Error bars represent SD, and mean is shown. Each dot represents an individual biological animal replicate. (F) Naphthalene injury results in variable injury, representative images shown here. (G) Quantification of the correlation of epithelial denudation with percent weight loss. Each dot represents a quantification based on a single wholemount trachea. (H) Experimental schematic for Fig. 2D. (I) Representative wholemount image of a trachea 3 days after naphthalene injury showing survival of KRT5/KRT13 double positive hillock regions. White box in top left demarcates KRT13- glands. (J) Representative image of a hillock region (top) vs gland region (bottom) showing that glands do not express KRT13 after injury. (K) Representative confocal image of a section of the trachea showing KRT13+ Foxj1+ double positive cells. (L) Quantification of the percent total surface area of the trachea that is KRT13+ after naphthalene injury. Each dot represents a biologically independent mouse replicate. SD and mean are marked. Two-tailed unpaired t-tests were performed. Scale bars 250 μm (F,I), 20 μm (J), 10 μm (K)
Extended Data Fig. 7: Hillocks regenerate the tissue after naphthalene injury.
(A) Representative wholemount images of control trachea subjected to naphthalene injury in the absence of tamoxifen induction show minimal lineage labeling. (B) High-mag images showing lack of leakiness following naphthalene exposure when tamoxifen is not administered despite high levels of KRT13 or KRT6A expression. Exceedingly rare labeled cell is shown as evidence of label detection. (C) Quantification of labeled and unlabeled basal, ciliated, secretory, tuft, neuroendocrine, and ionocyte cells in KRT13-CreER;LSL-TdTomato lineage traced animals after naphthalene. No pairwise comparisons were statistically different from each other (1-way ANOVA). Each dot represents a cryosection quantified in a 20x FOV, spread across three distinct biologically independent replicates. SD and mean are marked. (D) Representative KRT13-CreER ifgMosaic clonal lineage trace wholemounts after naphthalene injury showing large, single-clones contributing to tracheal regeneration. (E) Representative immunostaining of sections taken from clonal KRT13-CreER trachea after naphthalene injury, showing all cell lineages are represented and that clones contain multiple lineages. Scale bars 250 μm (A), 10 μm (B, E), 500 μm (D)
Extended Data Figure 8: Bulk RNA and ATAC-seq analysis of cultured mouse hillock and pseudostratified basal stem cells.
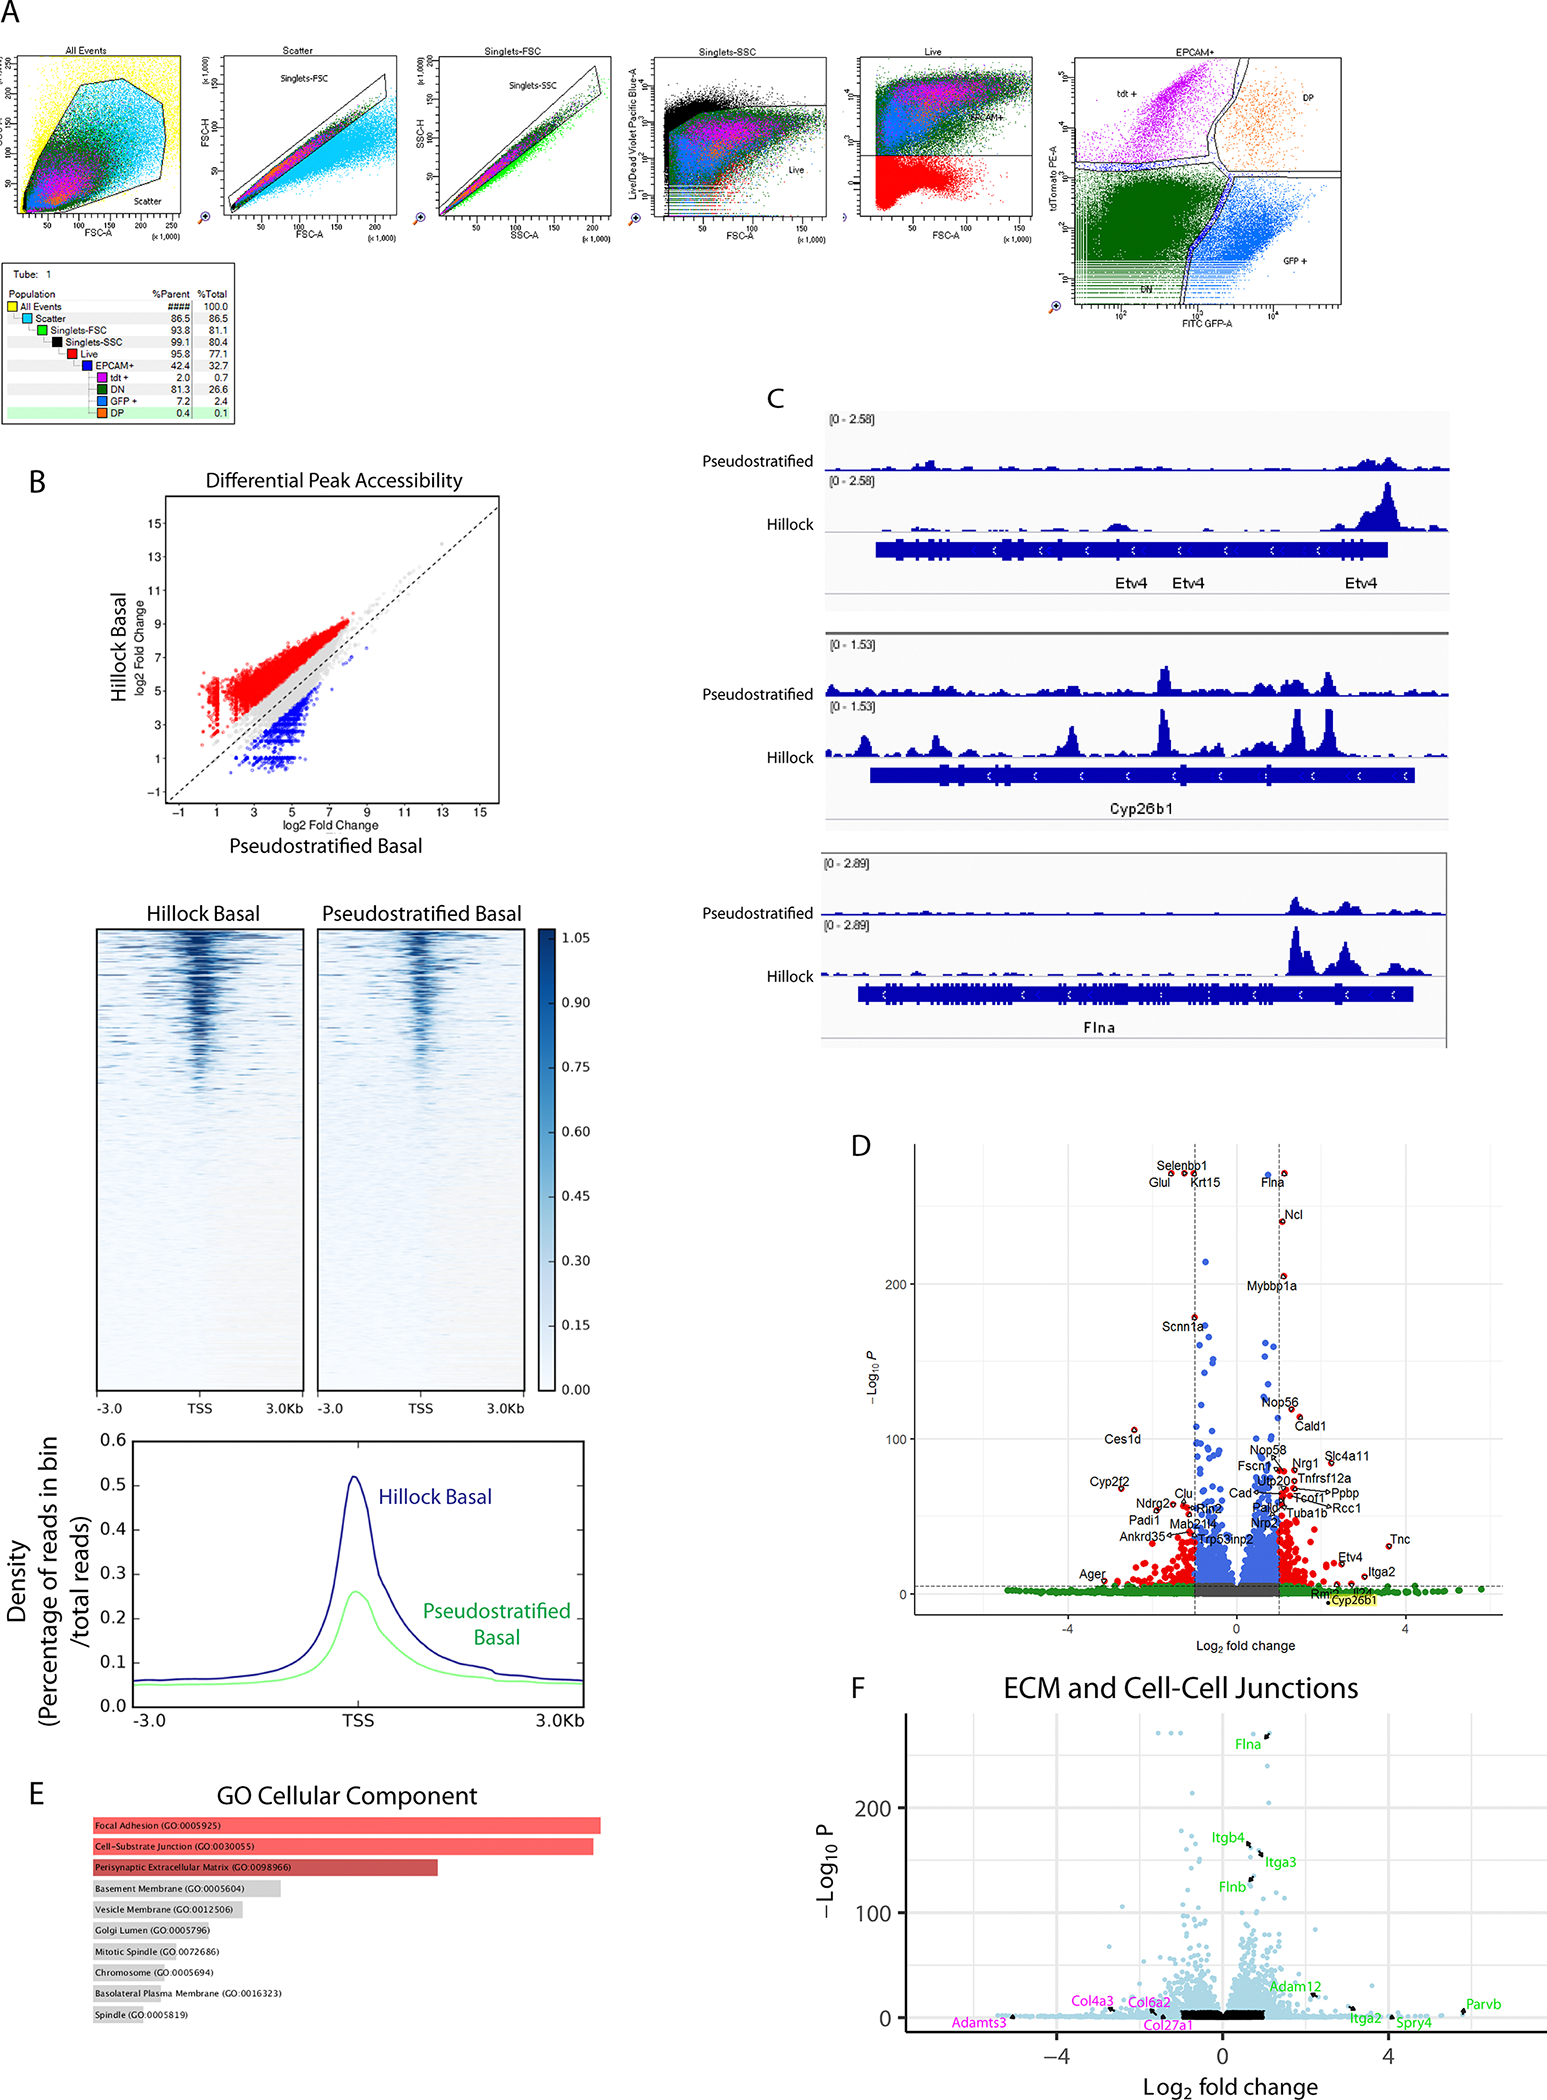
(A) Gating strategy and representative FACS plot for hillock basal cell vs pseudostratified basal cell sort from murine trachea. Hillock basal cells: EpCAM-APCCy7+, p63GFP+,tdTomato+; pseudostratified basal cells: EpCAM-APCCy7+, p63GFP+, tdTomato-. Percentages of each gate with respect to that panel and of the parent population are shown. Live cells were initially sorted on epithelial marker EpCAM, then p63 and hillock lineage reporter. (B) Analysis of ATAC-seq data showing that cultured hillock basal cells exhibit greater chromatin accessibility throughout the genome (top) and specifically at transcription start sites (middle and bottom). (C) Representative tracks of ATAC reads surrounding the Etv4, Cyp26b1 and Flna gene loci showing increased accessibility in hillock basal cells. (D) Volcano plot of all differentially expressed genes, cultured mouse hillock basal stem cells (right) vs pseudostratified basal stem cells (left). (E) GO analysis of DEGs (C) highlights an enrichment of pathways associated with focal adhesions and cell junctions. (F) Volcano plot of ECM and cell-cell junction genes demonstrates a selective enrichment of integrins and junctional proteins in hillock basal cells (green) vs pseudostratified basal cells (magenta).
Extended Data Fig. 9: Hillock basal cells respond to retinoic acid signaling inhibition by generating injury-resistant hillock structures that display features of keratinizing squamous metaplasia.
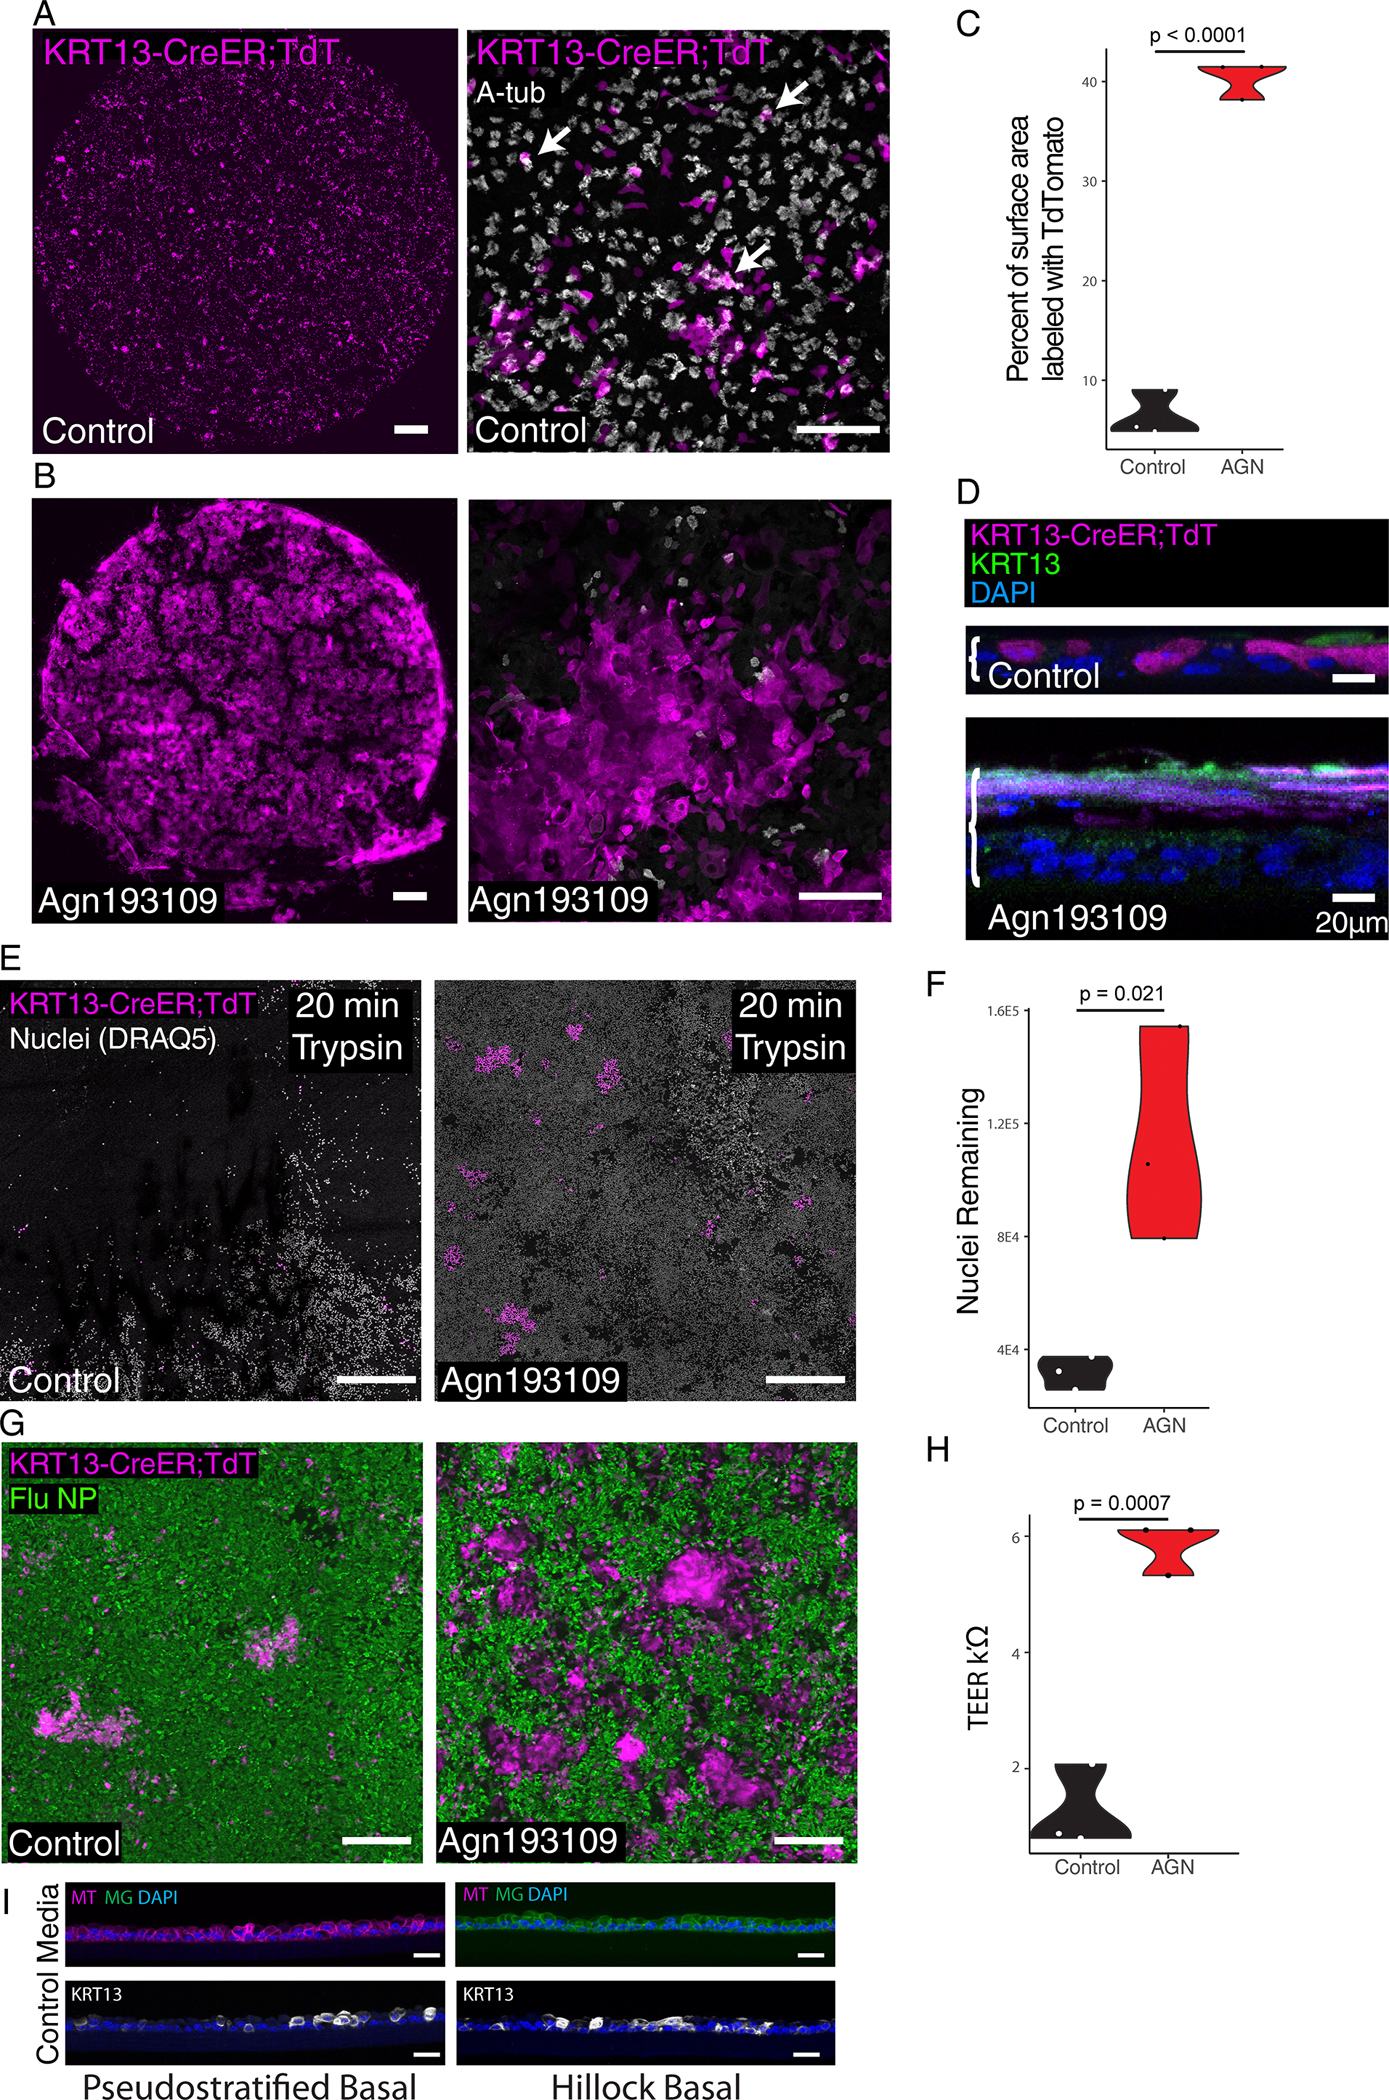
(A) 10X low mag (left) and 25x high mag (right) image of an air-liquid interface (ALI) epithelial culture derived from KRT13-CreER labeled hillock basal cells and lineage negative pseudostratified basal cells cultured in standard ALI conditions. Arrows mark lineage-labeled ciliated cells. (B) 10X low mag (left) and 25x high mag (right) image of an ALI culture derived from KRT13-CreER labeled hillock basal cells and lineage negative pseudostratified basal cells cultured with Agn193109 showing that hillock-derived epithelium is aciliate while unlabeled pseudostratified basal cells develop ciliated cells. (C) Quantification of area covered by hillock basal cell-derived cells shows that Agn193109 treatment induces significantly higher coverage of the ALI by hillock-lineage traced cells. (D) Optical slice reconstruction (60X) of ALIs seen in (B). Brackets demarcate the thickness of the epithelium. (E) Low magnification image of ALI cultures subjected to 20 minutes of trypsin dissociation condition. (F) Quantification of nuclei remaining after trypsin dissociation shows Agn193109 treated cultures resist dissociation. (G) Microscopy of ALI cultures infected with influenza and stained for influenza nucleoprotein (NP) shows that KRT13+ patches that expand after Agn193109 treatment selectively resist infection. (H) Transepithelial electrical resistance (TEER) measurements of ALI cultures shows significantly higher TEER after Agn193109 treatment. (I) Representative cryosections of purified pseudostratified vs hillock basal cells-derived ALI cultures in standard differentiation media. Scale bars 500 μm (left panels of A and B, E), 100 μm (right panels of A, and B), 20 μm (D, I), 250 μm (G)
Extended Data Fig. 10: Human hillocks exist.
(A) Image of an entire airway tree (donor HU76) stained for KRT13 using horseradish peroxidase and DAB substrate demonstrates the presence of KRT13+ patches of epithelium. (B) Images of the airway trees of donor HU72 and HU75 demonstrating aciliate, KRT13+ patches of epithelium marked by brown DAB stain. On HU75, Atub is additionally identified using alkaline phosphatase (red). (C) Insets of the magenta-boxed regions in A and B representing patchy KRT13 expression found outside of the characteristic locations of hillocks which do not possess the characteristic morphology associated with murine hillocks. (D) Section of a prospectively-identified and subsequently microdissected KRT13+ hillock patch demonstrates the characteristic histologic pattern associated with murine hillocks. (E) The same immunofluorescent image shown in Fig. 5G, counterstained with DAPI. Expanded insets in the lower panels highlighting the ciliated, transition, and hillock zones. Arrowheads mark squamous flat cells. (F) Representative cryosection of a normal human ciliated epithelium exhibiting scattered suprabasal KRT13+ cells marked by arrows. (G) TEER of human ALIs derived from ciliated vs hillock basal stem cells, with and without AGN193109 treatment. 1-way ANOVA was performed, followed by Tukey’s multiple comparisons test. (H) Increased TEER in hillock derived cultures. (I-K) Quantification of ALI cultures of hillock and pseudostratified epithelium after (I) influenza infection, (J) cryospray injury, (K) acid injury, demonstrating human hillock injury resistance. Unpaired two-tailed t-tests were performed. Each dot represents a distinct ALI membrane. SD and mean are marked. Scale bars, 1 cm (A,B), 50 μm (D-F)
Supplementary Material
Acknowledgments:
We thank the members of the Rajagopal laboratory for the critical review of this manuscript and discussions. We thank New England Donor Services (NEDS) for providing human airway samples as well as the generosity of the patients who agreed to donate their tissue to science. Electron microscopy was performed in the Microscopy Core of the Program in Membrane Biology, which is partially supported by an Inflammatory Bowel Disease Grant DK043351 and a Boston Area Diabetes and Endocrinology Research Center (BADERC) Award DK057521. We would like to thank Jason Griffith for providing influenza virus expressing GFP. We would like to thank the Single Cell Core and the BPF Genomics Core Facility (RRID:SCR_007175) at Harvard Medical School, Boston, MA for performing the barcoding and library preparation for 10x single cell RNA-Seq. We would like to thank Kwok Po Tse for her cryosectioning expertise.
Funding:
Cystic Fibrosis Foundation (LIN19F0): BL
National Institutes of Health (5T32 HL 116275-9):VS
Cystic Fibrosis Foundation (CFF003338L121):VS
National Institutes of Health (5U24HL148865-04/OS00000379):VS
National Institutes of Health (F31HL165736) CC
National Institutes of Health (K08HL124298-05): VV
National Institutes of Health (UG3CA268117 and UH3CA268117): ZD and JR
National Institutes of Health (R01HL118185-08): JR
National Institutes of Health (R01HL157221-01): JR
National Institutes of Health (R01HL142559-04): JR
Bernard and Mildred Kayden Endowed MGH Research Institute Chair: JR
Footnotes
Competing interests: Authors declare that they have no competing interests.
Supplementary Information is available for this paper
Data and material availability:
Plate-based single cell sequencing data are deposited to GEO: GSE207479. 10x-based single cell sequencing data are deposited to GEO: GSE244215. Bulk RNA and ATAC sequencing of mouse hillock and pseudostratified basal cells are deposited to GEO: RNA:GSE253021 ATAC:GSE253020. Source data are provided with this paper. High resolution images of human whole mounts are deposited to Harvard Dataverse at https://doi.org/10.7910/DVN/6JDXOP. The KRT13-CreER mouse line is deposited at Jax (#038257).
References and Notes
- 1.Montoro DT et al. A revised airway epithelial hierarchy includes CFTR-expressing ionocytes. Nature 560, 319–324 (2018). [DOI] [PMC free article] [PubMed] [Google Scholar]
- 2.Lancillotti F, Darwiche N, Celli G & De Luca LM Retinoid status and the control of keratin expression and adhesion during the histogenesis of squamous metaplasia of tracheal epithelium. Cancer Res. 52, 6144–6152 (1992). [PubMed] [Google Scholar]
- 3.Chopra DP Retinoid reversal of squamous metaplasia in organ cultures of tracheas derived from hamsters fed on vitamin A-deficient diet. Eur. J. Cancer Clin. Oncol. 19, 847–857 (1983). [DOI] [PubMed] [Google Scholar]
- 4.Peter M et al. Transgenic mouse models enabling photolabeling of individual neurons in vivo. PLoS One 8, e62132 (2013). [DOI] [PMC free article] [PubMed] [Google Scholar]
- 5.Feldman MB, Wood M, Lapey A & Mou H SMAD Signaling Restricts Mucous Cell Differentiation in Human Airway Epithelium. Am. J. Respir. Cell Mol. Biol. 61, 322–331 (2019). [DOI] [PMC free article] [PubMed] [Google Scholar]
- 6.Tata PR et al. Dedifferentiation of committed epithelial cells into stem cells in vivo. Nature 503, 218–223 (2013). [DOI] [PMC free article] [PubMed] [Google Scholar]
- 7.Watson JK et al. Clonal Dynamics Reveal Two Distinct Populations of Basal Cells in Slow-Turnover Airway Epithelium. Cell Rep. 12, 90–101 (2015). [DOI] [PMC free article] [PubMed] [Google Scholar]
- 8.Tadokoro T et al. Dorso-ventral heterogeneity in tracheal basal stem cells. Biol. Open 10, (2021). [DOI] [PMC free article] [PubMed] [Google Scholar]
- 9.Maclean H & Griffiths WJ The factors influencing the concentration of hydrochloric acid during gastric digestion. J. Physiol. 65, 63–76 (1928). [DOI] [PMC free article] [PubMed] [Google Scholar]
- 10.Garner JL et al. A prospective safety and feasibility study of metered cryospray for patients with chronic bronchitis in COPD. Eur. Respir. J. 56, (2020). [DOI] [PMC free article] [PubMed] [Google Scholar]
- 11.DiBardino DM, Lanfranco AR & Haas AR Bronchoscopic Cryotherapy. Clinical Applications of the Cryoprobe, Cryospray, and Cryoadhesion. Ann. Am. Thorac. Soc. 13, 1405–1415 (2016). [DOI] [PubMed] [Google Scholar]
- 12.Tata A et al. Myoepithelial Cells of Submucosal Glands Can Function as Reserve Stem Cells to Regenerate Airways after Injury. Cell Stem Cell 22, 668–683.e6 (2018). [DOI] [PMC free article] [PubMed] [Google Scholar]
- 13.Lynch TJ et al. Submucosal Gland Myoepithelial Cells Are Reserve Stem Cells That Can Regenerate Mouse Tracheal Epithelium. Cell Stem Cell 22, 779 (2018). [DOI] [PMC free article] [PubMed] [Google Scholar]
- 14.Isoherranen N & Zhong G Biochemical and physiological importance of the CYP26 retinoic acid hydroxylases. Pharmacol. Ther. 204, 107400 (2019). [DOI] [PMC free article] [PubMed] [Google Scholar]
- 15.Rajaii F, Bitzer ZT, Xu Q & Sockanathan S Expression of the dominant negative retinoid receptor, RAR403, alters telencephalic progenitor proliferation, survival, and cell fate specification. Dev. Biol. 316, 371–382 (2008). [DOI] [PubMed] [Google Scholar]
- 16.Srinivasan B et al. TEER measurement techniques for in vitro barrier model systems. J. Lab. Autom. 20, 107–126 (2015). [DOI] [PMC free article] [PubMed] [Google Scholar]
- 17.Nettesheim P et al. Pathways of differentiation of airway epithelial cells. Environ. Health Perspect. 85, 317–329 (1990). [DOI] [PMC free article] [PubMed] [Google Scholar]
- 18.Zhang Y et al. Human Airway Basal Cells Undergo Reversible Squamous Differentiation and Reshape Innate Immunity. Am. J. Respir. Cell Mol. Biol. (2023) doi: 10.1165/rcmb.2022-0299OC. [DOI] [PMC free article] [PubMed] [Google Scholar]
- 19.Deprez M et al. A Single-Cell Atlas of the Human Healthy Airways. Am. J. Respir. Crit. Care Med. 202, 1636–1645 (2020). [DOI] [PubMed] [Google Scholar]
- 20.Kersten ETG et al. Childhood-onset asthma is characterized by airway epithelial hillock-to-squamous differentiation in early life. bioRxiv 2023.07.31.549680 (2023) doi: 10.1101/2023.07.31.549680. [DOI] [Google Scholar]
- 21.Yoshida M et al. Local and systemic responses to SARS-CoV-2 infection in children and adults. Nature 602, 321–327 (2022). [DOI] [PMC free article] [PubMed] [Google Scholar]
- 22.Vieira Braga FA et al. A cellular census of human lungs identifies novel cell states in health and in asthma. Nat. Med. 25, 1153–1163 (2019). [DOI] [PubMed] [Google Scholar]
- 23.Alladina J et al. A human model of asthma exacerbation reveals transcriptional programs and cell circuits specific to allergic asthma. Sci Immunol 8, eabq6352 (2023). [DOI] [PMC free article] [PubMed] [Google Scholar]
- 24.Nakamura R et al. A novel method for live imaging of human airway cilia using wheat germ agglutinin. Sci. Rep. 10, 14417 (2020). [DOI] [PMC free article] [PubMed] [Google Scholar]
- 25.Travaglini KJ et al. A molecular cell atlas of the human lung from single-cell RNA sequencing. Nature 587, 619–625 (2020). [DOI] [PMC free article] [PubMed] [Google Scholar]
- 26.Sikkema L et al. An integrated cell atlas of the lung in health and disease. Nat. Med. 29, 1563–1577 (2023). [DOI] [PMC free article] [PubMed] [Google Scholar]
- 27.Kim T-H et al. Broadly permissive intestinal chromatin underlies lateral inhibition and cell plasticity. Nature 506, 511–515 (2014). [DOI] [PMC free article] [PubMed] [Google Scholar]
- 28.Stange DE et al. Differentiated Troy+ chief cells act as reserve stem cells to generate all lineages of the stomach epithelium. Cell 155, 357–368 (2013). [DOI] [PMC free article] [PubMed] [Google Scholar]
- 29.Zhou Y et al. Airway basal cells show regionallydistinct potential to undergo metaplastic differentiation. Elife 11, (2022). [DOI] [PMC free article] [PubMed] [Google Scholar]
- 30.Aros CJ et al. Distinct Spatiotemporally Dynamic Wnt-Secreting Niches Regulate Proximal Airway Regeneration and Aging. Cell Stem Cell 27, 413–429.e4 (2020). [DOI] [PMC free article] [PubMed] [Google Scholar]
- 31.Oliveira MJR et al. Zonation of Ciliated Cells on the Epithelium of the Rat Trachea. Lung vol. 181 275–282 Preprint at 10.1007/s00408-003-1030-1 (2003). [DOI] [PubMed] [Google Scholar]
- 32.Borthwick DW, Shahbazian M, Todd Krantz Q, Dorin JR & Randell SH Evidence for Stem-Cell Niches in the Tracheal Epithelium. American Journal of Respiratory Cell and Molecular Biology vol. 24 662–670 Preprint at 10.1165/ajrcmb.24.6.4217 (2001). [DOI] [PubMed] [Google Scholar]
- 33.Hong KU, Reynolds SD, Watkins S, Fuchs E & Stripp BR In vivo differentiation potential of tracheal basal cells: evidence for multipotent and unipotent subpopulations. Am. J. Physiol. Lung Cell. Mol. Physiol. 286, L643–9 (2004). [DOI] [PubMed] [Google Scholar]
- 34.Tilston-Lunel A et al. Aberrant epithelial polarity cues drive the development of precancerous airway lesions. Proc. Natl. Acad. Sci. U. S. A. 118, (2021). [DOI] [PMC free article] [PubMed] [Google Scholar]
- 35.Szymaniak AD, Mahoney JE, Cardoso WV & Varelas X Crumbs3-Mediated Polarity Directs Airway Epithelial Cell Fate through the Hippo Pathway Effector Yap. Dev. Cell 34, 283–296 (2015). [DOI] [PMC free article] [PubMed] [Google Scholar]
- 36.Kumar PA et al. Distal airway stem cells yield alveoli in vitro and during lung regeneration following H1N1 influenza infection. Cell 147, 525–538 (2011). [DOI] [PMC free article] [PubMed] [Google Scholar]
- 37.Rao W et al. Regenerative Metaplastic Clones in COPD Lung Drive Inflammation and Fibrosis. Cell vol. 181 848–864.e18 Preprint at 10.1016/j.cell.2020.03.047 (2020). [DOI] [PMC free article] [PubMed] [Google Scholar]
- 38.Taylor MS et al. Delayed Alveolar Epithelialization: A Distinct Pathology in Diffuse Acute Lung Injury. Am. J. Respir. Crit. Care Med. 197, 522–524 (2018). [DOI] [PMC free article] [PubMed] [Google Scholar]
- 39.Taylor MS et al. A Conserved Distal Lung Regenerative Pathway in Acute Lung Injury. Am. J. Pathol. 188, 1149–1160 (2018). [DOI] [PMC free article] [PubMed] [Google Scholar]
- 40.Cassandras M et al. Gli1+ mesenchymal stromal cells form a pathological niche to promote airway progenitor metaplasia in the fibrotic lung. Nat. Cell Biol. 22, 1295–1306 (2020). [DOI] [PMC free article] [PubMed] [Google Scholar]
- 41.Wang S et al. Inflammatory Activity of Epithelial Stem Cell Variants from Cystic Fibrosis Lungs Is Not Resolved by CFTR Modulators. Am. J. Respir. Crit. Care Med. 208, 930–943 (2023). [DOI] [PMC free article] [PubMed] [Google Scholar]
- 42.Vaughan AE et al. Lineage-negative progenitors mobilize to regenerate lung epithelium after major injury. Nature 517, 621–625 (2015). [DOI] [PMC free article] [PubMed] [Google Scholar]
- 43.Kathiriya JJ et al. Human alveolar type 2 epithelium transdifferentiates into metaplastic KRT5+ basal cells. Nat. Cell Biol. 24, 10–23 (2022). [DOI] [PMC free article] [PubMed] [Google Scholar]
- 44.Ray S et al. Rare SOX2+ Airway Progenitor Cells Generate KRT5+ Cells that Repopulate Damaged Alveolar Parenchyma following Influenza Virus Infection. Stem Cell Reports 7, 817–825 (2016). [DOI] [PMC free article] [PubMed] [Google Scholar]
- 45.Planer JD & Morrisey EE After the Storm: Regeneration, Repair, and Reestablishment of Homeostasis Between the Alveolar Epithelium and Innate Immune System Following Viral Lung Injury. Annu. Rev. Pathol. 18, 337–359 (2023). [DOI] [PMC free article] [PubMed] [Google Scholar]
- 46.Van Keymeulen A et al. Distinct stem cells contribute to mammary gland development and maintenance. Nature 479, 189–193 (2011). [DOI] [PubMed] [Google Scholar]
- 47.Rawlins EL et al. The Role of Scgb1a1 Clara Cells in the Long-Term Maintenance and Repair of Lung Airway, but Not Alveolar, Epithelium. Cell Stem Cell vol. 4 525–534 Preprint at 10.1016/j.stem.2009.04.002 (2009). [DOI] [PMC free article] [PubMed] [Google Scholar]
- 48.Rawlins EL & Hogan BLM Ciliated epithelial cell lifespan in the mouse trachea and lung. Am. J. Physiol. Lung Cell. Mol. Physiol. 295, L231–4 (2008). [DOI] [PMC free article] [PubMed] [Google Scholar]
- 49.Zhang Y et al. A transgenic FOXJ1-Cre system for gene inactivation in ciliated epithelial cells. Am. J. Respir. Cell Mol. Biol. 36, 515–519 (2007). [DOI] [PMC free article] [PubMed] [Google Scholar]
- 50.Pontes-Quero S et al. Dual ifgMosaic: A Versatile Method for Multispectral and Combinatorial Mosaic Gene-Function Analysis. Cell 170, 800–814.e18 (2017). [DOI] [PMC free article] [PubMed] [Google Scholar]
- 51.Lu Z et al. Hair follicle stem cells regulate retinoid metabolism to maintain the self-renewal niche for melanocyte stem cells. Elife 9, (2020). [DOI] [PMC free article] [PubMed] [Google Scholar]
- 52.Dobin A et al. STAR: ultrafast universal RNA-seq aligner. Bioinformatics vol. 29 15–21 Preprint at 10.1093/bioinformatics/bts635 (2013). [DOI] [PMC free article] [PubMed] [Google Scholar]
- 53.Trapnell C et al. Differential gene and transcript expression analysis of RNA-seq experiments with TopHat and Cufflinks. Nat. Protoc. 7, 562–578 (2012). [DOI] [PMC free article] [PubMed] [Google Scholar]
- 54.Hao Y et al. Integrated analysis of multimodal single-cell data. Cell 184, 3573–3587.e29 (2021). [DOI] [PMC free article] [PubMed] [Google Scholar]
- 55.Chen EY et al. Enrichr: interactive and collaborative HTML5 gene list enrichment analysis tool. BMC Bioinformatics 14, 128 (2013). [DOI] [PMC free article] [PubMed] [Google Scholar]
- 56.Levardon H, Yonker LM, Hurley BP & Mou H Expansion of Airway Basal Cells and Generation of Polarized Epithelium. Bio Protoc 8, (2018). [DOI] [PMC free article] [PubMed] [Google Scholar]
- 57.Mou H et al. Dual SMAD Signaling Inhibition Enables Long-Term Expansion of Diverse Epithelial Basal Cells. Cell Stem Cell 19, 217–231 (2016). [DOI] [PMC free article] [PubMed] [Google Scholar]
- 58.Zhao R et al. Yap tunes airway epithelial size and architecture by regulating the identity, maintenance, and self-renewal of stem cells. Dev. Cell 30, 151–165 (2014). [DOI] [PMC free article] [PubMed] [Google Scholar]
- 59.Pardo-Saganta A et al. Parent stem cells can serve as niches for their daughter cells. Nature 523, 597–601 (2015). [DOI] [PMC free article] [PubMed] [Google Scholar]
- 60.Shah VS et al. Autofluorescence imaging permits label-free cell type assignment and reveals the dynamic formation of airway secretory cell associated antigen passages (SAPs). Elife 12, (2023). [DOI] [PMC free article] [PubMed] [Google Scholar]
- 61.Salic A & Mitchison TJ A chemical method for fast and sensitive detection of DNA synthesis in vivo. Proc. Natl. Acad. Sci. U. S. A. 105, 2415–2420 (2008). [DOI] [PMC free article] [PubMed] [Google Scholar]
Associated Data
This section collects any data citations, data availability statements, or supplementary materials included in this article.
Supplementary Materials
Data Availability Statement
Plate-based single cell sequencing data are deposited to GEO: GSE207479. 10x-based single cell sequencing data are deposited to GEO: GSE244215. Bulk RNA and ATAC sequencing of mouse hillock and pseudostratified basal cells are deposited to GEO: RNA:GSE253021 ATAC:GSE253020. Source data are provided with this paper. High resolution images of human whole mounts are deposited to Harvard Dataverse at https://doi.org/10.7910/DVN/6JDXOP. The KRT13-CreER mouse line is deposited at Jax (#038257).