

Abstract
Objective: Proteasome activation by the cAMP-dependent protein kinase (PKA) was long suggested and recent studies using both cell cultures and genetically engineered mice have established that direct phosphorylation of RPN6/PSMD11 at Serine14 (pS14-RPN6) mediates the activation of 26S proteasomes by PKA. Genetic mimicry of pS14-RPN6 has been shown to be benign at baseline and capable of protecting against cardiac proteinopathy in mice. Here we report the results from a comprehensive baseline characterization of the Rpn6S14A mice (S14A), the first animal model of genetic blockade of the activation of 26S proteasomes by PKA. Method: Wild type and homozygous S14A littermate mice were subjected to serial M-mode echocardiography at 1 through 7 months of age, to left ventricular (LV) catheterization via the carotid artery for assessment of LV mechanical performance, and to cardiac gravimetric analyses at 26 weeks of age. Mouse mortality and morbidity were monitored daily for up to one year. Males and females were studied in parallel. Results: Mice homozygous for S14A were viable and fertile and did not show discernible developmental abnormalities or increased mortality or morbidity compared with their Rpn6 wild type littermates by at least one year of age, the longest cohort observed thus far. Neither serial echocardiography nor hemodynamic assessments detected a remarkable difference in cardiac morphometry and function between S14A and wild type littermate mice. No cardiac gravimetric difference was observed. Conclusion: The findings of the present study indicate that genetic blockade of the activation of 26S proteasomes by PKA is well tolerated by mice at baseline. Therefore, the S14A mouse provides a desirable genetic tool for further investigating the in vivo pathophysiological and pharmacological significance of pS14-RPN6.
Keywords: 26S proteasomes, cAMP-dependent protein kinase, Ser14-RPN6 phosphorylation, genetic mouse model
Introduction
In eukaryotes, most intracellular proteins are degraded by the ubiquitin-proteasome system (UPS). UPS-mediated proteolysis is pivotal to regulation of virtually all cellular processes and to protein quality control (PQC), by targeted degradation of normal but no longer needed proteins and of terminally misfolded proteins, respectively [1]. Substrate ubiquitination, which entails covalent conjugation of a substrate protein to a polyubiquitin chain, determines the specificity of UPS-mediated protein degradation and has been assumed to be the rate-limiting step. A typical 26S proteasome is composed of a hollow cylindrical 20S core particle (CP) and a 19S regulatory particle (RP) at one or both ends. The 20S CP or the 20S proteasome harboring the proteolytic activity in its interior chamber is formed by an axial stack of four rings; two α-rings flank the two β-rings that constitute a proteolytic chamber. The α-rings serve as the gate to control the entry of the unfolded peptide chain into the proteolytic chamber. Each α or β ring is formed by seven unique subunit proteins (α1 through α7 or β1 through β7). The proteasomal peptidases reside in the β5, β2, and β1 subunits. The 19S RP contains a base and a lid that are primarily formed by AAA-type ATPase (RPT) and non-ATPase (RPN) subunits, respectively. Key functions exerted by the 19S RP include recognizing and binding to the ubiquitinated substrate protein, removing the polyubiquitin chain (i.e., deubiquitination), unfolding the substrate, and translocating the substrate peptide chain into the proteolytic chamber of the 20S CP by opening the gated channel (the α-ring of the 20S CP) in an ATP-dependent manner [2]. Recent advances in cell biology unravel that the degradation of at least a subset of proteins, such as misfolded proteins and short-lived regulatory proteins, by the UPS is governed by the functionality of the 26S proteasome that, in turn, can be regulated by post-translational modifications such as phosphorylation of the proteasome [3-6]. In other words, the proteasomal step rather than the ubiquitination step is rate-limiting for the UPS-mediated degradation of at least a subset of proteins in the cell.
Defects in the UPS including proteasome functional insufficiency (PFI) have been implicated in various forms of human disease, including cardiovascular diseases (e.g., hypertrophic and ischemic cardiomyopathies, heart failure) [7-9], neurodegenerative disorders (e.g., Huntington’s disease, Alzheimer’s disease [10,11], Parkinson’s disease [12]), age-associated disorders [13], and chronic liver diseases [14,15]. All these diseases share one common histopathological feature in autopsy: the presence of aberrant protein aggregates. Hence, altered protein homeostasis is widely believed to play a key role in their pathogenesis, and the improvement of proteasome function has the potential to become a new therapeutic strategy for their treatment. Therefore, looking for effective pharmacological strategies to improve proteasome function is a logical current focus in the field; to this end, better understanding of the mechanisms that regulate proteasome functioning is extremely important.
There is growing evidence showing that site-specific phosphorylation of 19S subunits, such as Thr25-RPT3 [16], Ser120-RPT6 [17], Ser14-RPN6 [18,19], and Ser361-RPN1 [20], may play a vital role in the regulation of 26S proteasomes. Among them, Goldberg’s team conducted a comprehensive study in cultured cells, which convincingly demonstrates that RPN6 is phosphorylated specifically at Ser14 by cAMP-dependent protein kinase (PKA), resulting in marked increases in the proteolytic function of the 26S proteasome [18]. They further unveiled in various cell types and isolated organs that Ser14-phosphorylated RPN6 (pS14-RPN6 hereafter) and 26S proteasome peptidase activities were remarkably elevated when intracellular cAMP is increased by pharmacological treatment, physiological hormones (epinephrine, glucagon, and antidiuretic hormone [ADH]), or physical activity (strenuous exercise) [19]. Despite compelling in vitro evidence, only a few studies have addressed the in vivo relevance of proteasome phospho-regulations and have so far only been associative in nature [19,21,22]. None of the identified proteasome phosphosites, including pS14-RPN6, had been tested genetically in animals for their physiological requirement and pathophysiological significance until the publication of our most recent study [23].
To address the critical gaps identified above, we created two germline knock-in mouse models using CRISPR/Cas9, in which Ser14 of the endogenous Rpn6 is mutated to either Ala (Rpn6S14A) or Asp (Rpn6S14D) to respectively block or mimic pS14-Rpn6. Heterozygous and homozygous Rpn6S14A and Rpn6S14D mice are viable and fertile; and compared with wild type (WT) littermate mice, neither model displays abnormal cardiac morphometry and function, gross abnormality, or increased mortality in early age. Data from the baseline characterization of the S14D mice were included in our recent publication [23]. Here we report the detailed baseline characterization of the S14A mice. Together, these baseline data show that these genetic modifications are benign in mice for at least the early age and confer desirable in vivo tools for studying the pathophysiological and pharmacological significance of pS14-RPN6.
Materials and methods
Animals
Methods used for the creation and genotype determination of the Rpn6S14A (S14A) knock-in mice were recently reported [23]. The S14A mice were originally created in the C57BL/6J inbred background. In the S14A mice, the codon for Ser14 of the endogenous Rpn6/Psmd11 gene was mutated via CRISPR/Cas9 to encode Ala to block the phosphorylation of Rpn6 at Ser14. Mice harboring the S14A allele were confirmed genetically by sequencing the targeted segment of the Psmd11 gene (Figure 1A). To eliminate any potential off-target mutations resulting from the genetic manipulations, the S14A breeders used by the present study had undergone more than six generations of back-cross into the C57BL/6J inbred background.
Figure 1.

Representative DNA sequencing histograms of genotyping PCR products of the genomic region harboring the coding sequence for Ser14 of Rpn6 in mice (A) and representative images of western blot analyses for myocardial Rpn6 and Ser14-phosporylated Rpn6 (pS14-Rpn6) in adult WT and homozygous Rpn6S14A (S14A) mice (B). WT, wild type; Het, heterozygous S14A (i.e., Rpn6S14A/+); Hom, homozygous S14A (i.e., Rpn6S14A/S14A). # in (B) denotes a non-specific band detected by the anti-pS14-Rpn6 antibody.
Two cohorts of homozygous S14A and littermate wild type (WT) mice were used in this study. One cohort was in a mixed background resulting from crossbreeding between C57BL/6J and FVB/N inbred backgrounds and was used for serial echocardiography and Kaplan-Meier survival analyses; the other cohort was in the C57BL/6J inbred background only and used for left-ventricular (LV) mechanical performance and cardiac gravimetric analyses. The protocols for animal care and use in this study have been approved by the University of South Dakota Institutional Animal Use and Care Committee. The animals were given ad lib access to food and water and housed in specific pathogen free rooms with optimal temperature (22-24°C) and 12-hour light/12-hour dark cycle.
Western blot analysis
Western blot analysis was performed as previously described [24]. In brief, total proteins extracted from ventricular myocardium of adult WT and homozygous S14A littermate mice were fractionated with SDS-PAGE and electrically transferred onto PVDF membranes for immunoblotting for pS14-Rpn6 and native Rpn6. The rabbit polyclonal primary antibodies against pS14-RPN6 and RPN6 were custom made and generously donated by Dr. Alfred Goldberg of Harvard Medical School [19]. The bound horseradish peroxidase (HRP)-conjugated secondary antibodies (Jackson ImmunoResearch Laboratories, 111-035-003) were detected using enhanced chemiluminescence (ECL) detection reagents (Thermofisher Scientific, 34580). Blots were imaged using the ChemiDoc MP Imaging System (Bio-Rad Laboratories) and quantified using the ImageLab software (Bio-Rad Laboratories). In-lane total proteins imaged with the stain-free protein imaging technology were used as the loading control [21].
Echocardiography
Serial echocardiography was performed as previously reported [21]. In brief, mice were kept in light anesthesia with inhalation of isoflurane (4% for induction and 1.5% for maintenance) via a face mask. Transthoracic echocardiography was performed using the VisualSonics Vevo 2100 or 3100 system and a 40-MHz probe (FUJIFILM VisualSonics, Toronto, ON, Canada). Two-dimensional image guided M-mode echocardiograms were acquired through the left ventricular (LV) anterior and posterior walls at the short axis view. Parameters of LV were derived from primary measurements using the Vevo LAB software (FUJIFILM VisualSonics) as described [23].
LV mechanical performance analyses
LV pressure curves were recorded as previously described with minor modifications [25]. In the terminal experiment, the mice were anesthetized with 2% isoflurane in medical grade oxygen. Subsequently, they were intubated and subjected to mechanical ventilation using the Hallowell EMC Microvent-1 ventilator. The closed-chest approach for LV catheterization was employed where the right common carotid artery was isolated and cannulated with the Mikro-Tip ultraminiature 1F-PV loop catheter (Millar Instruments, PVR-1035). This catheter was then carefully advanced into the left ventricle (LV) and allowed a 10-minute period for stabilization. Changes in left ventricular pressure (LVP) were continuously monitored and recorded using the PowerLab data acquisition system (ADInstruments, Colorado Springs, CO). Subsequently, various crucial parameters, including heart rate (HR), end-systolic and end-diastolic left ventricular pressures, dp/dt max, dp/dt min, and tau, were extracted and calculated from the recorded data employing LabChart 8 software (ADInstruments).
Statistical methods
GraphPad Prism software (GraphPad Software, San Diego, CA) was used. All continuous variables are presented as Mean ± SD unless indicated otherwise. All data were examined for normality with the Shapiro Wilk’s test prior to application of parametric statistical tests. Tests used for evaluation of statistical significance are specified in figure legends or the footnote of the table. In brief, unless otherwise indicated, differences among genotypes and sexes were evaluated by two-way ANOVA followed by Sidak’s test for pairwise comparisons. Serial echocardiographic data were evaluated by three-way repeated measures ANOVA followed by Tukey’s multiple comparisons. A p value or adjusted p value <0.05 is considered statistically significant.
Results
The S14A mice show no discernible gross abnormalities and live at least 358 days
To create an essential tool for in vivo studies on the physiological and pathophysiological requirement of pS14-RPN6 and, by extension, for in vivo investigation of the significance of the activation of 26S proteasomes by PKA, we sought to make two knock-in mouse models using the CRISPR/Cas9 technology. In the genome of these knock-in mice, the codon for Ser14 of the endogenous Rpn6/Psmd11 gene was mutated to encode either Ala (S14A) or Asp (S14D) to block or mimic pS14-Rpn6, respectively [23]. Mice carrying the Rpn6S14A (referred as S14A) allele were successfully created in the C57BL/6J inbred background and were confirmed genomically by sequencing the targeted segment of the Psmd11 gene (Figure 1A). Moreover, our western blot analyses revealed that myocardial pS14-Rpn6 is detectable in WT mice but not in homozygous S14A mice (Figure 1B).
Heterozygous and homozygous S14A mice are born in the expected Mendelian ratio and are viable; and both males and females are fertile. Postnatal daily observation of the survival of a cohort of littermate WT mice (n=30; 15 males and 15 females) and homozygous S14A mice (n=24; 13 males + 11 females) in the C57BL/6J and FVB/N mixed background for 358 consecutive days, the longest duration studied, revealed that no gross abnormalities or increased mortality were detected between the two genotypes under the baseline condition in a specific pathogen-free facility.
Mouse body weight (BW) was measured at 1, 3, 4, 5, 6, and 7 months of age (Figure 2A; Tables 1, 2, 3, 4, 5 and 6), as well as 10 months (Figure 2J), and no statistically significant differences were observed between S14A and WT littermate mice of the same sex at any of the time points, although as expected, females displayed a significantly smaller BW than males when the area under curve (AUC) of the time course of changes in BW during the first 7 months of age is compared in either genotype (Figure 2A). Notably, when compared at individual time points, the sex difference in BW became less apparent in 6, 7 (Tables 5, 6), and 10 months (Figure 2J) of age, especially in S14A mice; the BW variation of S14A mice tended to be greater than their WT littermates at these later time points.
Figure 2.
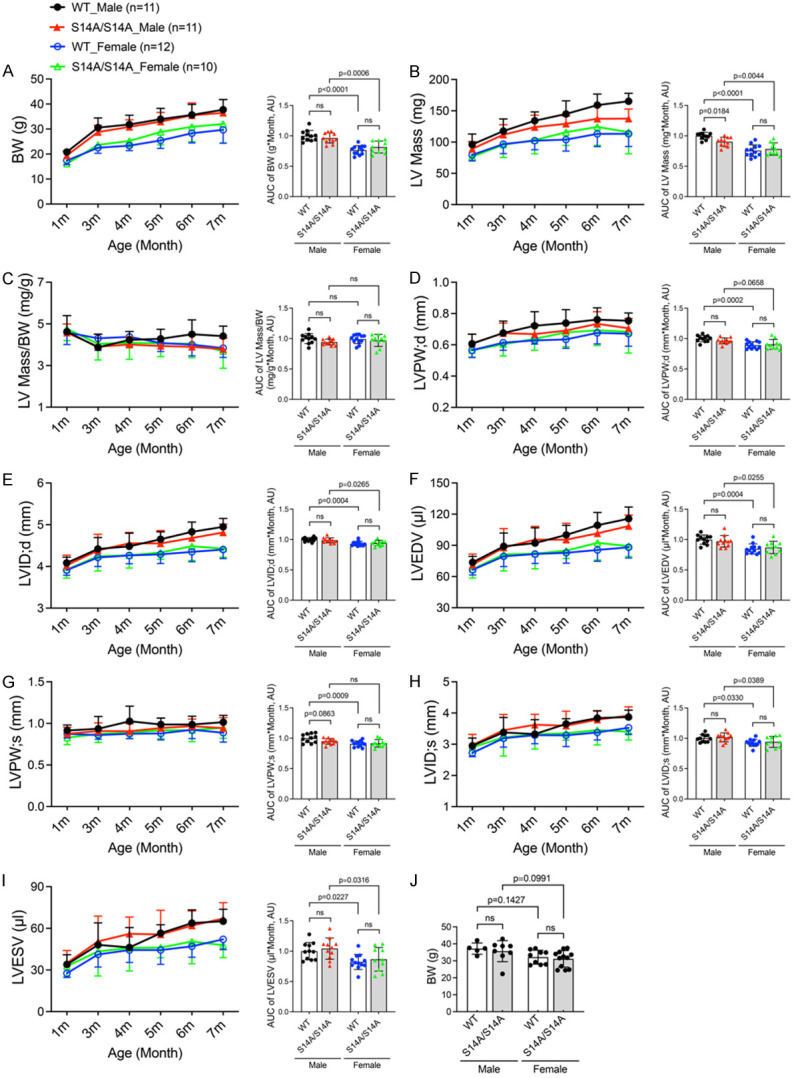
Time course of changes in body weight and cardiac morphometry in WT and S14A mice. A-I. Littermate mice of the indicated genotypes were subjected to serial echocardiography at 1, 3, 4, 5, 6, and 7 months (m) of age. Left ventricular (LV) morphometric parameters derived from the M-mode echocardiography are presented. The stacked line chart of each panel summarizes the time course of changes in the indicated parameter. The detailed values of echocardiographic parameters are listed and statistical significance between genotypes or sexes at the same time point are indicated in Tables 1, 2, 3, 4, 5 and 6. The bar graph with scattered dots of each panel presents the Area Under Curve (AUC) of the indicated parameter versus time obtained with the trapezoidal rule. J. Body weight of mice with indicated genotypes at ~10 m. Each dot represents an individual mouse; Mean ± SD; repeated three-way ANOVA followed by Tukey’s test for the time-course curves, and two-way ANOVA followed by Sidak’s test for the bar graphs; BW, body weight; LV, left ventricle; LVPW;d/LVPW;s, LV posterior wall thickness at end-diastole/end-systole; LVID;d/LVID;s, LV internal dimension at end-diastole/end-systole; LVEDV/LVESV, LV volume at end-diastole/end-systole; ns, not significant.
Table 1.
Parameters from serial echocardiography on WT and S14A mice at 1 month
| WT | S14A/S14A | |||
|---|---|---|---|---|
|
|
|
|||
| Male (n=11) | Female (n=12) | Male (n=11) | Female (n=10) | |
| BW (g) | 20.8±1.4 | 17.4±1.7** | 19.4±1.8 | 16.1±1.0 |
| LV mass (mg) | 96.2±16.8 | 79.4±9.4 | 89.1±11.9 | 76.5±6.7 |
| LV mass/BW (mg/g) | 4.63±0.77 | 4.59±0.58 | 4.58±0.42 | 4.76±0.57 |
| HR (bpm) | 425±43 | 428±40 | 459±31 | 453±41 |
| EF (%) | 54.16±7.04 | 58.39±3.35 | 51.41±9.31 | 51.41±8.22 |
| FS (%) | 27.83±4.47 | 30.41±2.27 | 26.19±6.03 | 26.04±5.10 |
| SV (μl) | 39.72±4.52 | 38.83±3.72 | 36.47±6.85 | 34.27±5.92 |
| CO (ml/min) | 16.90±2.56 | 16.65±2.68 | 16.57±2.29 | 15.39±2.15 |
| LVPW;d (mm) | 0.607±0.061 | 0.566±0.047 | 0.609±0.060 | 0.565±0.044 |
| LVPW;s (mm) | 0.914±0.066 | 0.874±0.050 | 0.875±0.079 | 0.830±0.085 |
| LVID;d (mm) | 4.085±0.137 | 3.912±0.123 | 4.027±0.243 | 3.921±0.204 |
| LVID;s (mm) | 2.951±0.248 | 2.722±0.120 | 2.977±0.338 | 2.903±0.281 |
| LVEDV (μl) | 73.70±5.74 | 66.49±4.93 | 71.47±10.19 | 67.03±8.45 |
| LVESV (μl) | 33.98±7.00 | 27.66±3.05 | 35.01±9.07 | 32.76±7.47 |
| LVAW;d (mm) | 0.724±0.102 | 0.653±0.074 | 0.672±0.054 | 0.619±0.088 |
| LVAW;s (mm) | 1.002±0.111 | 0.971±0.105 | 0.955±0.083 | 0.884±0.102 |
Mean ± SD; BW, body weight; LV, left ventricle; HR, heart rate; EF, ejection fraction; FS, fractional shortening; SV, stroke volume; CO, cardiac output per minute; LVPW;d, end-diastolic LV posterior wall thickness; LVPW;s, end-systolic LV posterior wall thickness; LVID;d, end-diastolic LV internal dimension; LVID;s, end-systolic LV internal dimension; LVEDV, LV end-diastolic volume; LVESV, LV end-systolic volume; LVAW;d, end-diastolic LV anterior wall thickness; LVAW;s, end-systolic LV anterior wall thickness; repeated three-way ANOVA followed by Tukey’s test.
P<0.01 vs. male mice with same genotype.
Table 2.
Parameters from serial echocardiography on WT and S14A mice at 3 months
| WT | S14A/S14A | |||
|---|---|---|---|---|
|
|
|
|||
| Male (n=11) | Female (n=12) | Male (n=11) | Female (n=10) | |
| BW (g) | 30.6±3.9 | 22.5±2.2** | 28.8±2.7 | 23.7±1.5* |
| LV mass (mg) | 117.6±19.4 | 96.8±15.1 | 111.8±16.0 | 95.7±20.4 |
| LV mass/BW (mg/g) | 3.87±0.63 | 4.31±0.58 | 3.91±0.61 | 4.04±0.77 |
| HR (bpm) | 435±44 | 429±38 | 473±32 | 457±29 |
| EF (%) | 47.22±10.92 | 48.53±6.69 | 43.92±8.93 | 48.49±14.11 |
| FS (%) | 23.84±6.55 | 24.34±4.07 | 21.72±4.97 | 24.79±8.71 |
| SV (μl) | 40.94±5.37 | 38.30±4.98 | 37.30±4.41 | 37.90±7.17 |
| CO (ml/min) | 17.76±2.50 | 16.35±2.00 | 17.68±2.62 | 17.19±2.74 |
| LVPW;d (mm) | 0.676±0.076 | 0.614±0.049 | 0.674±0.065 | 0.604±0.075 |
| LVPW;s (mm) | 0.936±0.147 | 0.859±0.050 | 0.908±0.098 | 0.874±0.102 |
| LVID;d (mm) | 4.419±0.272 | 4.214±0.214 | 4.384±0.388 | 4.244±0.353 |
| LVID;s (mm) | 3.379±0.477 | 3.192±0.285 | 3.447±0.509 | 3.214±0.587 |
| LVEDV (μl) | 89.04±12.84 | 79.48±9.83 | 87.88±18.32 | 81.29±15.94 |
| LVESV (μl) | 48.09±15.86 | 41.18±9.05 | 50.57±18.26 | 43.39±17.73 |
| LVAW;d (mm) | 0.730±0.094 | 0.672±0.113 | 0.693±0.067 | 0.653±0.083 |
| LVAW;s (mm) | 1.042±0.135 | 0.955±0.118 | 0.965±0.110 | 0.919±0.126 |
Mean ± SD; repeated three-way ANOVA followed by Tukey’s test.
P<0.05 vs. male mice with same genotype.
P<0.01 vs. male mice with same genotype.
Table 3.
Parameters from serial echocardiography on WT and S14A mice at 4 months
| WT | S14A/S14A | |||
|---|---|---|---|---|
|
|
|
|||
| Male (n=11) | Female (n=12) | Male (n=11) | Female (n=10) | |
| BW (g) | 31.8±3.7 | 23.4±2.0** | 30.8±2.9 | 25.2±2.4 |
| LV mass (mg) | 134.1±14.1 | 102.2±14.4* | 123.9±19.0 | 103.1±21.8 |
| LV mass/BW (mg/g) | 4.23±0.40 | 4.38±0.48 | 4.01±0.37 | 4.09±0.79 |
| HR (bpm) | 442±50 | 428±28 | 471±43 | 452±29 |
| EF (%) | 50.82±10.02 | 46.03±6.54 | 41.58±8.29# | 45.34±9.97 |
| FS (%) | 26.07±6.41 | 22.85±3.85 | 20.44±4.61 | 22.57±5.79 |
| SV (μl) | 45.93±6.93 | 37.33±4.82 | 39.45±8.52 | 36.16±4.63 |
| CO (ml/min) | 20.18±3.45 | 15.96±2.35 | 18.29±2.72 | 16.37±2.52 |
| LVPW;d (mm) | 0.722±0.090 | 0.628±0.023 | 0.668±0.063 | 0.638±0.073 |
| LVPW;s (mm) | 1.025±0.181 | 0.875±0.060 | 0.905±0.091 | 0.889±0.068 |
| LVID;d (mm) | 4.481±0.315 | 4.264±0.200 | 4.554±0.263 | 4.265±0.304 |
| LVID;s (mm) | 3.326±0.464 | 3.293±0.273 | 3.626±0.331 | 3.315±0.467 |
| LVEDV (μl) | 92.16±14.66 | 81.67±9.10 | 95.49±12.73 | 82.04±14.63 |
| LVESV (μl) | 46.23±14.33 | 44.34±8.88 | 56.05±12.10 | 45.89±16.62 |
| LVAW;d (mm) | 0.812±0.096 | 0.691±0.076 | 0.737±0.096 | 0.684±0.070 |
| LVAW;s (mm) | 1.170±0.173 | 0.979±0.104 | 1.023±0.141 | 0.942±0.102 |
Mean ± SD; repeated three-way ANOVA followed by Tukey’s test.
P<0.05 vs. male mice with same genotype;
P<0.01 vs. male mice with same genotype;
P<0.05 vs. WT mice of same sex.
Table 4.
Parameters from serial echocardiography on WT and S14A mice at 5 months
| WT | S14A/S14A | |||
|---|---|---|---|---|
|
|
|
|||
| Male (n=11) | Female (n=12) | Male (n=11) | Female (n=10) | |
| BW (g) | 33.9±4.3 | 25.4±3.2* | 33.0±3.7 | 28.8±5.2 |
| LV mass (mg) | 145.0±21.0 | 103.9±18.3 | 129.2±12.4 | 115.7±21.0 |
| LV mass/BW (mg/g) | 4.28±0.46 | 4.08±0.41 | 3.94±0.36 | 4.06±0.63 |
| HR (bpm) | 458±33 | 452±24 | 463±25 | 462±28 |
| EF (%) | 43.34±5.64 | 46.98±8.92 | 42.85±9.65 | 45.72±5.88 |
| FS (%) | 21.42±3.33 | 23.59±5.86 | 21.21±5.42 | 22.68±3.43 |
| SV (μl) | 43.54±8.42 | 38.47±5.34 | 39.91±6.03 | 38.64±4.88 |
| CO (ml/min) | 20.00±4.33 | 17.34±2.09 | 18.42±2.64 | 17.87±2.73 |
| LVPW;d (mm) | 0.739±0.086 | 0.634±0.057 | 0.691±0.051 | 0.680±0.092 |
| LVPW;s (mm) | 0.987±0.077 | 0.879±0.077 | 0.945±0.121 | 0.917±0.099 |
| LVID;d (mm) | 4.651±0.178 | 4.289±0.220** | 4.550±0.312 | 4.334±0.162 |
| LVID;s (mm) | 3.653±0.165 | 3.284±0.359 | 3.596±0.463 | 3.353±0.223 |
| LVEDV (μl) | 100.07±9.16 | 82.86±9.98** | 95.49±15.75 | 84.81±7.48 |
| LVESV (μl) | 56.53±6.08 | 44.39±10.30 | 55.58±17.46 | 46.17±7.39 |
| LVAW;d (mm) | 0.808±0.116 | 0.690±0.088 | 0.769±0.096 | 0.742±0.135 |
| LVAW;s (mm) | 1.107±0.169 | 0.998±0.079 | 1.044±0.165 | 1.052±0.208 |
Mean ± SD; repeated three-way ANOVA followed by Tukey’s test.
P<0.05 vs. male mice with same genotype.
P<0.01 vs. male mice with same genotype.
Table 5.
Parameters from serial echocardiography on WT and S14A mice at 6 months
| WT | S14A/S14A | |||
|---|---|---|---|---|
|
|
|
|||
| Male (n=11) | Female (n=12) | Male (n=11) | Female (n=10) | |
| BW (g) | 35.7±4.2 | 28.3±3.9 | 35.5±5.0 | 30.9±6.0 |
| LV mass (mg) | 159.0±17.7 | 113.1±20.4* | 137.3±20.4 | 124.2±29.4 |
| LV mass/BW (mg/g) | 4.50±0.69 | 4.00±0.54 | 3.90±0.55 | 4.05±0.67 |
| HR (bpm) | 416±53 | 446±31 | 464±27 | 450±22 |
| EF (%) | 41.74±5.33 | 45.11±5.08 | 39.22±7.52 | 46.39±9.27 |
| FS (%) | 20.54±3.04 | 22.30±2.98 | 19.12±4.17 | 23.29±5.76 |
| SV (μl) | 45.63±7.90 | 38.51±5.92 | 39.64±7.06 | 41.87±5.32 |
| CO (ml/min) | 18.81±3.15 | 17.13±2.61 | 18.35±3.20 | 18.82±2.28 |
| LVPW;d (mm) | 0.761±0.075 | 0.676±0.071 | 0.735±0.077 | 0.692±0.097 |
| LVPW;s (mm) | 0.987±0.100 | 0.924±0.107 | 0.967±0.084 | 0.918±0.138 |
| LVID;d (mm) | 4.829±0.234 | 4.348±0.235* | 4.682±0.154 | 4.485±0.340 |
| LVID;s (mm) | 3.837±0.239 | 3.379±0.241* | 3.789±0.268 | 3.453±0.474 |
| LVEDV (μl) | 109.39±12.30 | 85.60±10.92* | 101.60±7.94 | 92.42±16.56 |
| LVESV (μl) | 63.76±9.56 | 47.09±7.92* | 61.96±10.57 | 50.55±15.98* |
| LVAW;d (mm) | 0.822±0.105 | 0.714±0.107 | 0.731±0.073 | 0.736±0.096 |
| LVAW;s (mm) | 1.107±0.129 | 1.009±0.116 | 0.988±0.094 | 1.070±0.149 |
Mean ± SD; repeated three-way ANOVA followed by Tukey’s test.
P<0.05 vs. male mice with same genotype.
Table 6.
Parameters from serial echocardiography on WT and S14A mice at 7 months
| WT | S14A/S14A | |||
|---|---|---|---|---|
|
|
|
|||
| Male (n=11) | Female (n=12) | Male (n=11) | Female (n=10) | |
| BW (g) | 37.7±4.0 | 29.7±5.3 | 36.5±5.2 | 32.0±7.7 |
| LV mass (mg) | 165.2±12.7 | 113.2±20.3*** | 137.3±15.3# | 115.7±34.4 |
| LV mass/BW (mg/g) | 4.41±0.48 | 3.84±0.44 | 3.79±0.53 | 3.69±0.83 |
| HR (bpm) | 435±39 | 443±25 | 473±17 | 445±21 |
| EF (%) | 43.74±5.01 | 40.71±6.76 | 38.49±6.12 | 46.57±6.12 |
| FS (%) | 21.74±2.87 | 19.84±3.87 | 18.71±3.32 | 23.24±3.72 |
| SV (μl) | 50.55±7.37 | 36.04±8.53* | 41.47±5.63 | 41.35±5.32 |
| CO (ml/min) | 21.93±3.32 | 15.96±3.72 | 19.65±2.91 | 18.47±3.07 |
| LVPW;d (mm) | 0.754±0.050 | 0.671±0.080 | 0.705±0.063 | 0.684±0.136 |
| LVPW;s (mm) | 1.014±0.082 | 0.888±0.112 | 0.944±0.125 | 0.949±0.129 |
| LVID;d (mm) | 4.948±0.203 | 4.403±0.215** | 4.815±0.201 | 4.427±0.207 |
| LVID;s (mm) | 3.873±0.218 | 3.527±0.205 | 3.917±0.282 | 3.401±0.266 |
| LVEDV (μl) | 115.67±11.22 | 88.11±10.28** | 108.54±10.59 | 89.23±9.86 |
| LVESV (μl) | 65.12±8.67 | 52.07±7.43 | 67.07±11.40 | 47.88±9.00 |
| LVAW;d (mm) | 0.825±0.082 | 0.697±0.088* | 0.710±0.066 | 0.686±0.099 |
| LVAW;s (mm) | 1.139±0.114 | 0.944±0.131* | 0.958±0.078 | 0.970±0.114 |
Mean ± SD; repeated three-way ANOVA followed by Tukey’s test.
P<0.05 vs. male mice with same genotype;
P<0.01 vs. male mice with same genotype;
P<0.001 vs. male mice with same genotype;
P<0.05 vs. WT mice of same sex.
Data from serial echocardiography
To discern whether genetic blockade of pS14-Rpn6 would yield an impact on cardiac morphometry and function, we recorded 2D-guided M-mode echocardiograms of the same cohort of homozygous S14A mice and their littermate WT control mice at 1, 3, 4, 5, 6, and 7 months of age (Tables 1, 2, 3, 4, 5 and 6; Figures 2B-I and 3). From the echocardiograms, we directly measured heart rate (HR; Figure 3E), the end-diastolic (;d) and end-systolic (;s) LV posterior wall thicknesses (LVPW;d, LVPW;s; Figure 2D, 2G), and LV internal diameters at the end of diastole and the end of systole (LVID;d, LVID;s; Figure 2E, 2H). From the directly measured parameters, LV volumes (LVEDV, LVESV; Figure 2F, 2I) at both end-diastole and end-systole, as well as LV mass (Figure 2B) and LV mass-to-body weight ratio (LV mass/BW; Figure 2C) were calculated. Taking all six time points together as depicted by the AUC of the entire time course, essentially no statistically significant difference in LV morphometry was discerned between S14A and WT littermate mice of the same sex, with the only exception of estimated LV mass in male mice where AUC in the S14A group is modestly but statistically significantly smaller than their WT counterpart (P=0.018; Figure 2B). This small difference is likely due to a variation in BW because no statistically significant difference was found in the LV mass to BW ratio between the same two groups (Figure 2C). When compared at individual time points, only at 7 months did male S14A mice show a statistically significant lower LV mass than male WT littermate mice (P=0.0444, Table 6).
Figure 3.

Time courses of changes in cardiac functional characteristics in WT and S14A mice. A-E. LV echocardiographic functional parameters from the same cohort of mice used for Figure 2 are presented. The stacked line chart of each panel summarizes the time course of changes in the indicated parameter. The detailed values of echocardiographic parameters are listed and statistical significance between genotypes or sexes at the same time point are presented in Tables 1, 2, 3, 4, 5 and 6. The bar graph with scattered dots of each panel presents the area under curve (AUC) of the indicated parameter versus time obtained with the trapezoidal rule. Each dot represents an individual mouse; Mean ± SD; repeated three-way ANOVA followed by Tukey’s test for the time-course curves, and two-way ANOVA followed by Sidak’s test for AUC; EF, ejection fraction; FS, fractional shortening; SV, stroke volume; CO, cardiac output per minute; HR, heart rate; ns, not significant.
AUC analyses revealed that, as expected, female mice overall also had thinner LVPW;d (P<0.0001) and LVPW;s (P=0.0009), smaller LV chamber (LVID;d, P<0.0001; LVID;s, P=0.0012; LVEDV, P<0.0001; LVESV, P=0.0007) than male mice (Figure 2D-I, right panels), although individual time point analyses did not show significant sex differences in these parameters. Notably, sex differences in LVPW;s (Figure 2G, right panel) were obtained only in WT mice.
Moving on from the morphometric data, cardiac functional parameters including ejection fraction (EF; Figure 3A), fractional shortening (FS; Figure 3B), stroke volume (SV; Figure 3C), and cardiac output (CO; Figure 3D) were further derived and compared between sexes and between genotypes. Comparing the AUC of the first 7 months, S14A mice showed slightly greater HR than WT littermates, especially in males (P=0.0006; Figure 3E); this led to a smaller stroke volume (SV) in male S14A mice than male WT mice, as a result, cardiac output of the two genotype groups are comparable. It should be noted that the AUC-revealed differences in SV and HR between male S14A and WT mice (Figure 3C, 3E) are not discerned when SV and HR are compared at individual time points (Tables 1, 2, 3, 4, 5 and 6). When compared at individual time points, the S14A males displayed lower EF than WT males only at 4 months (4 m) (P=0.0469, Table 3). Moreover, we found that female WT mice had smaller LV chamber size than male WT mice, but the sex differences were not observed in S14A mice at individual time points. This is in agreement with the lower body weight and/or LV mass of female WT mice than male ones (Figure 2A, 2B, 2E, 2F, left panels; Tables 1, 2, 3, 4, 5 and 6). Notably, sex differences in SV (Figure 3C, right panel) and CO (Figure 3D, right panel) were observed only in WT mice.
These data strongly suggest that, despite the pS14-Rpn6 blockade, our S14A mice have equivalent cardiac morphology and function to WT mice for at least the first 7 months, and normal gross phenotypes and survival for at least the first 12 months. Therefore, our S14A mice represent valuable tools for studying the physiological and pathological significance of pS14-Rpn6.
LV mechanical performance is comparable between WT and S14A mice
A separate cohort of S14A and WT littermate mice in the C57BL/6 inbred background at 14 weeks of age were subjected to sham control surgery for the transverse aortic constriction procedure. Serial echocardiography performed on this cohort immediately before and 1, 2, 3, 4, 6, 8, 10, and 12 weeks after the surgery showed no statistically significant difference in cardiac morphometry and functioning between the S14A and WT littermate mice (data not shown). Here we would like to report the LV mechanical data collected 12 weeks after the sham surgery (i.e., mice at 26 weeks of age). LV catheterization via the right carotid artery was employed to monitor changes in LV pressure under anesthesia at the terminal experiment. As depicted in Figure 4, no significant difference in the hemodynamic parameters including heart rate (HR), LV end-systolic pressure (Pes) and end-diastolic pressure (Ped), the maximal rate of pressure increase (dP/dtmax), the maximal rate of pressure decrease (dP/dtmin), and relaxation time constant (Tau) was detected between S14A and WT mice, indicating that LV systolic and diastolic function are comparable between S14A and WT littermate mice even 12 weeks after the sham surgery.
Figure 4.

Hemodynamic assessments of WT and S14A mice at 26 weeks of age. WT and S14A mice at 14 weeks of age were subject to sham surgery. Parameters presented were derived from left ventricular (LV) catheterization via the carotid artery retrograde route conducted 12 weeks after the sham surgery. Pes, LV end systolic pressure; Ped, LV end diastolic pressure; dP/dtmax, the maximal rate of LV pressure rise; dP/dtmin, the maximal rate of LV pressure decline; Tau, the time constant of relaxation. Each dot represents an individual mouse; mean ± SEM; unpaired Student’s t test; shown above the bracket are p-values.
Gravimetric analyses at terminal experiments for LV P-V loop analyses
With the same cohort used for the hemodynamic measurements shown in Figure 4, we conducted cardiac gravimetric measurements at 26 weeks of age. As presented in Figure 5, a sex difference in body weight (BW) and heart weight (HW) was evident at this time point (P=0.0045, 0.0003) but no such difference was detected in tibial length (TL). Importantly, when compared either within each sex or with both sexes combined, no statistically significant differences between S14A and WT mice were detected in any of the parameters, including HW, BW, TL, HW/BW ratios, and HW/TL ratios. These data indicate that no cardiac hypertrophy takes place in S14A mice under these conditions.
Figure 5.

Gravimetric measurements of WT and S14A mice at 26 weeks of age. The same cohort of WT and S14A littermate mice as described in Figure 4 were used for gravimetric analyses at terminal experiments. Body weight (BW), tibia length (TL), and heart weight (HW) were collected 12-week after sham surgery (i.e., 26 weeks of age). Old mice. HW/BW ratio and HW/TL ratio were calculated. Each dot represents an individual mouse; mean ± SEM; two-way ANOVA followed by Tukey’s test for (A-C), and unpaired Student’s t test for (D, E). Shown above the brackets are the p-value.
Discussion
PFI is implicated in the pathogenesis of a broad spectrum of human disease with increased proteotoxic stress (IPTS), including a large subset of cardiovascular diseases, neurodegenerative disorders, diabetes, and liver diseases [14,15,26,27]. A recent advance in the protein degradation field is the discovery that the proteasome step can also be a rate-limiting step in the UPS-mediated protein degradation pathway, because both genetically and pharmacologically priming or enhancing the proteasome has been found to be capable of expediting the degradation of at least misfolded proteins in the cell [18,28-31]. This is highly significant because it has provided a new direction for the search for effective methods to enhance UPS-mediated proteolysis and thereby development of potentially new strategies to prevent or more effectively treat diseases with IPTS [4]. To this end, phosphorylation of the proteasome by a few kinases have been found to activate or prime the proteasome [3]. Late professor Dr. Goldberg and his team have elegantly demonstrated in cultured cells and isolated organs that 19S proteasome subunit RPN6 is specifically phosphorylated at Ser14 by PKA, which mediates PKA-induced proteasome activation [18,19]. In a more recent study, we have been able to confirm genetically that pS14-RPN6 is solely responsible for the activation of 26S proteasomes by PKA in mice [23]. This effort involved the creation of two knock-in mouse models (S14A and S14D) using the CRISPR/Cas9 technique. The baseline characterization of the S14D mice has demonstrated genetic mimicry of pS14-Rpn6 is benign and, when crossed into a mouse model of proteinopathy, S14D further increases myocardial proteasome activities and protects against the progression of cardiac proteinopathy in mice [23]. Here we report that genetic blockade of pS14-RPN6 is well tolerated by mice at baseline conditions, providing a valuable mouse model for further defining the (patho)physiological significance of pS14-RPN6 and its potential as a novel therapeutic target.
Proteomics coupled with treatments of isolated proteasomes with kinases or phosphatases in test tubes had identified hundreds of phosphorylation sites on many proteasome subunits in the 19S and 20S proteasomes; however, data from biochemical analyses of proteasomes isolated from cultured cells suggest only a handful of the phosphosites might be physiologically relevant [3,19,23,28,32]. Several kinases were shown to regulate proteasome activities; most of them positively influence proteasome functioning (e.g., PKA, PKG) [18,28,31,33,34], but there are opposite examples as well [35]. Cell culture studies have unveiled the proteasome subunit sites associated with kinase-mediated proteasome regulations. In vitro studies have been using site-directed mutagenesis to test the biochemical importance of phosphosites. Golberg’s team used site-directed mutagenesis to generate “phospho-dead” and “phosphomimetic” RPN6 mutants by replacing Ser14 by Ala (S14A) and Asp (S14D) to block or mimic pS14-Rpn6, respectively [18]. In HEK293 cells and purified proteasomes, S14A mutation repressed the 26S proteasome peptidase activities, and overexpression of S14D mutant stimulated the proteasomal degradation of aggregation-prone proteins [18]. A similar strategy was applied to test the importance of other identified proteasome phosphosites as well. For example, Guo’s team used the CRISPR/Cas system to substitute endogenous Rpt3 with the phospho-dead T25A mutant or phosphomimetic T25D mutant to demonstrate that phosphorylation of Rpt3 at Thr25 during S through M phases of the cell cycle in actively proliferating cells mediates dual tyrosine receptor kinase 2 (DYRK2)-induced proteasome hydrolytic function, which may be involved in tumorigenesis [16]; Ser120-phosphorylation of Rpt6 was reported to mediate calcium/calmodulin-dependent protein kinase II α (CaMKIIα)-stimulated proteasome enrichment at the dendrite of neurons and proteasome activation in HEK293T cells [17]. Rpt6-S120D mutation was further shown to upregulate synaptic strength and to be more resistant to detergent extraction in hippocampal neurons, whereas the Rpt6-S120A mutant had opposite effects and led to defects of memory and learning in rodents [36,37]. More recently, Guo’s team introduced an Rpn1-S361A mutant into human cell lines to demonstrate that Ser361-phosphorylated Rpn1 is required for 26S proteasome assembly and functioning, cellular metabolism, and redox homeostasis [20]. After publishing the comprehensive cell culture study that identified pS14-Rpn6 as the specific target of PKA to prime the 26S proteasome, Goldberg’s group has further demonstrated that augmentation of cAMP/PKA signaling by a variety of factors, such as hormones, intense exercise, or fasting can increase the phosphorylation of Ser14-Rpn6 and elevate proteasome activities in hepatocytes, skeletal muscles, and isolated working hearts [19], and that pharmacologically increasing cAMP could prevent proteasome impairment and cognitive dysfunction in an animal model of tauopathy [22]. However, there has been no in vivo report confirming that proteasomes are activated by PKA via pS14-Rpn6 in intact animals before our recent report that demonstrates unequivocally that pS14-RPN6 mediates the activation of 26S proteasomes by PKA in mice [23]. The latter study also has generated two mouse models for clean genetic blockade and mimicry of pS14-RPN6 by gene-editing of the endogenous Rpn6/Psmd11 gene of the mouse genome. Hence, a comprehensive characterization of these mice especially the S14A mice at baseline conditions not only unveils if there is any physiological requirement for pS14-Rpn6 during mouse development but also lays a foundation for future use of this model to study the pathophysiological and pharmacological significance of pS14-RPN6.
Baseline characterizations presented here indicate that, compared with their WT littermates, S14A mice do not display remarkable gross abnormalities or physiological alterations, though sex differences were detected as expected (Figures 2, 3, 4 and 5; Tables 1, 2, 3, 4, 5 and 6). Interestingly, male mice seem to be a bit more sensitive to S14A knock-in than females. For example, when monthly echocardiographic data of the first 7 months are combined (AUC) for comparisons, LV mass (Figure 2B) and SV (Figure 3C) were statistically smaller in male S14A mice than in male WT littermates, but this difference was not observed in females. The modest difference in estimated LV mass vanished when normalized by body weight although the body weight difference did not reach statistical significance (Figure 2A). The difference in SV can be explained by the difference in heart rate as male S14A mice tended to have a higher heart rate than male WT littermates (Figure 3E) and CO are comparable between S14A and WT mice (Figure 3D). We did not observe significant changes in mouse body weight between S14A and WT mice during at least the first 10 months (Figure 2A, 2J). S14A mice did not exhibit either cardiac hypertrophy or chamber dilatation because no statistically significant differences in LV posterior wall thicknesses, chamber diameters, or end-diastolic volume were observed between S14A and WT littermates in either sex (Figure 2D-I). Moreover, S14A mice did not display apparent alterations in functional parameters such as EF, FS and CO (Figure 3). As indicated earlier, the serial echocardiographic data discussed above were from a cohort of littermate mice with a mixed genetic background (C57BL/6 mixed with FVB/N), the variations of body weight and heart rate are likely greater in this mixed background.
It is worthy to point out that we have also done serial echocardiography on a cohort of S14A and WT mice in the pure C57BL/6J inbred background starting at 14 weeks of age (i.e., immediately before sham transverse aortic constriction [TAC] surgery) and 1, 2, 3, 4, 6, 8, 10 and 12 weeks after the sham surgery. We detected no statistically significant differences in any of the echocardiographic parameters (data not shown) and, more importantly, hemodynamic assessments (Figure 4) and gravimetric measurements (Figure 5) conducted at 26 weeks of age (i.e., 12 weeks post sham surgery) have not detected significant difference between S14A and WT mice. The study on how S14A mice respond to systolic overload induced by TAC is still ongoing, and its preliminary results are exciting but premature to report at this time.
The sensitive indicator of cardiac contractile function: the maximum rate of LV pressure rise (dP/dtmax) and the two indicators of LV relaxation property: the maximum rate of LV pressure decline (dP/dtmin) and the time constant of relaxation (Tau) were all comparable between the S14A and WT groups. The heart weight to body weight ratios as well as heart weight to tibial length ratios were also comparable between S14A and WT mice (Figure 5), confirming the echocardiographic findings that genetic blockade of pS14-RPN6 does not cause discernible morphological and functional abnormalities in mice at baseline. Consistent with the cardiac morphometric and functional data, the daily survival watch showed no increases in the mortality of S14A mice compared with WT littermates. Although the survival analyses were performed for only the first 1 year of age so far for S14A mice, our mouse maintenance and breeder inventories show that these mice have a life span much longer than the period of survival watch.
The findings from the basal characterization of S14A mice are somewhat surprising but may be explained by: (1) the basal phosphorylation level of Ser14-Rpn6 is very low in normal healthy mice [23], but it will be more phosphorylated to activate the proteasome when cAMP/PKA pathway is stimulated; (2) changes in pS14-Rpn6 were shown to primarily impact the degradation of short-lived proteins (not of long-lived proteins) in cultured cells [18]; hence, a minor change if any in the degradation efficiency of these short-lived proteins might not yield a discernible consequence until a longer term than the duration observed in the present study; (3) 26S proteasomes are tightly regulated by an intricate and sophisticated network of mechanisms to maintain protein homeostasis in the cell such that the loss of endogenous pS14-Rpn6 might be compensated by mobilizing other proteasome regulatory pathways.
The S14A mouse was created through germline knock-in; hence, all cells in the body are affected. Although we did not observe gross abnormality, there is still a possibility that other organs/systems than the heart/cardiovascular system may display subtle abnormalities that are not detected by the present study.
In summary, the observation of the current study indicates that genetically blocking pS14-Rpn6 is well tolerated by mice at baseline and alterations of endogenous pS14-Rpn6 have no adverse health consequences at baseline. Along with our prior report where S14D mice have been comprehensively characterized, findings reported here suggest that both S14D and S14A mouse models are desirable to test the molecular basis of PKA-elicited proteasome activation in intact animals and they provide valuable tools for determining the significance of pS14-Rpn6-mediated proteasome regulation in the pathophysiology and potentially pharmacology of various organs/systems.
Acknowledgements
This work is in part supported by NIH grants HL072166, HL153614, and AG072510 (to X.W.).
Disclosure of conflict of interest
None.
References
- 1.Wang X, Robbins J. Heart failure and protein quality control. Circ Res. 2006;99:1315–28. doi: 10.1161/01.RES.0000252342.61447.a2. [DOI] [PubMed] [Google Scholar]
- 2.Finley D. Recognition and processing of ubiquitin-protein conjugates by the proteasome. Annu Rev Biochem. 2009;78:477–513. doi: 10.1146/annurev.biochem.78.081507.101607. [DOI] [PMC free article] [PubMed] [Google Scholar]
- 3.Collins GA, Goldberg AL. The logic of the 26S proteasome. Cell. 2017;169:792–806. doi: 10.1016/j.cell.2017.04.023. [DOI] [PMC free article] [PubMed] [Google Scholar]
- 4.Wang X, Wang H. Priming the proteasome to protect against proteotoxicity. Trends Mol Med. 2020;26:639–648. doi: 10.1016/j.molmed.2020.02.007. [DOI] [PMC free article] [PubMed] [Google Scholar]
- 5.Kors S, Geijtenbeek K, Reits E, Schipper-Krom S. Regulation of proteasome activity by (post-)transcriptional mechanisms. Front Mol Biosci. 2019;6:48. doi: 10.3389/fmolb.2019.00048. [DOI] [PMC free article] [PubMed] [Google Scholar]
- 6.Cui Z, Scruggs SB, Gilda JE, Ping P, Gomes AV. Regulation of cardiac proteasomes by ubiquitination, SUMOylation, and beyond. J Mol Cell Cardiol. 2014;71:32–42. doi: 10.1016/j.yjmcc.2013.10.008. [DOI] [PMC free article] [PubMed] [Google Scholar]
- 7.Predmore JM, Wang P, Davis F, Bartolone S, Westfall MV, Dyke DB, Pagani F, Powell SR, Day SM. Ubiquitin proteasome dysfunction in human hypertrophic and dilated cardiomyopathies. Circulation. 2010;121:997–1004. doi: 10.1161/CIRCULATIONAHA.109.904557. [DOI] [PMC free article] [PubMed] [Google Scholar]
- 8.Weekes J, Morrison K, Mullen A, Wait R, Barton P, Dunn MJ. Hyperubiquitination of proteins in dilated cardiomyopathy. Proteomics. 2003;3:208–16. doi: 10.1002/pmic.200390029. [DOI] [PubMed] [Google Scholar]
- 9.Sanbe A, Osinska H, Saffitz JE, Glabe CG, Kayed R, Maloyan A, Robbins J. Desmin-related cardiomyopathy in transgenic mice: a cardiac amyloidosis. Proc Natl Acad Sci U S A. 2004;101:10132–6. doi: 10.1073/pnas.0401900101. [DOI] [PMC free article] [PubMed] [Google Scholar]
- 10.Keller JN, Hanni KB, Markesbery WR. Impaired proteasome function in Alzheimer’s disease. J Neurochem. 2000;75:436–9. doi: 10.1046/j.1471-4159.2000.0750436.x. [DOI] [PubMed] [Google Scholar]
- 11.Thibaudeau TA, Anderson RT, Smith DM. A common mechanism of proteasome impairment by neurodegenerative disease-associated oligomers. Nat Commun. 2018;9:1097. doi: 10.1038/s41467-018-03509-0. [DOI] [PMC free article] [PubMed] [Google Scholar]
- 12.Bi M, Du X, Jiao Q, Chen X, Jiang H. Expanding the role of proteasome homeostasis in Parkinson’s disease: beyond protein breakdown. Cell Death Dis. 2021;12:154. doi: 10.1038/s41419-021-03441-0. [DOI] [PMC free article] [PubMed] [Google Scholar]
- 13.Tomaru U, Takahashi S, Ishizu A, Miyatake Y, Gohda A, Suzuki S, Ono A, Ohara J, Baba T, Murata S, Tanaka K, Kasahara M. Decreased proteasomal activity causes age-related phenotypes and promotes the development of metabolic abnormalities. Am J Pathol. 2012;180:963–972. doi: 10.1016/j.ajpath.2011.11.012. [DOI] [PubMed] [Google Scholar]
- 14.Donohue TM, Osna NA, Kharbanda KK, Thomes PG. Lysosome and proteasome dysfunction in alcohol-induced liver injury. Liver Research. 2019;3:191–205. [Google Scholar]
- 15.Otoda T, Takamura T, Misu H, Ota T, Murata S, Hayashi H, Takayama H, Kikuchi A, Kanamori T, Shima KR, Lan F, Takeda T, Kurita S, Ishikura K, Kita Y, Iwayama K, Kato K, Uno M, Takeshita Y, Yamamoto M, Tokuyama K, Iseki S, Tanaka K, Kaneko S. Proteasome dysfunction mediates obesity-induced endoplasmic reticulum stress and insulin resistance in the liver. Diabetes. 2013;62:811–24. doi: 10.2337/db11-1652. [DOI] [PMC free article] [PubMed] [Google Scholar]
- 16.Guo X, Wang X, Wang Z, Banerjee S, Yang J, Huang L, Dixon JE. Site-specific proteasome phosphorylation controls cell proliferation and tumorigenesis. Nat Cell Biol. 2016;18:202–12. doi: 10.1038/ncb3289. [DOI] [PMC free article] [PubMed] [Google Scholar]
- 17.Djakovic SN, Schwarz LA, Barylko B, DeMartino GN, Patrick GN. Regulation of the proteasome by neuronal activity and calcium/calmodulin-dependent protein kinase II. J Biol Chem. 2009;284:26655–65. doi: 10.1074/jbc.M109.021956. [DOI] [PMC free article] [PubMed] [Google Scholar]
- 18.Lokireddy S, Kukushkin NV, Goldberg AL. cAMP-induced phosphorylation of 26S proteasomes on Rpn6/PSMD11 enhances their activity and the degradation of misfolded proteins. Proc Natl Acad Sci U S A. 2015;112:E7176–85. doi: 10.1073/pnas.1522332112. [DOI] [PMC free article] [PubMed] [Google Scholar]
- 19.VerPlank JJS, Lokireddy S, Zhao J, Goldberg AL. 26S proteasomes are rapidly activated by diverse hormones and physiological states that raise cAMP and cause Rpn6 phosphorylation. Proc Natl Acad Sci U S A. 2019;116:4228–4237. doi: 10.1073/pnas.1809254116. [DOI] [PMC free article] [PubMed] [Google Scholar]
- 20.Liu X, Xiao W, Zhang Y, Wiley SE, Zuo T, Zheng Y, Chen N, Chen L, Wang X, Zheng Y, Huang L, Lin S, Murphy AN, Dixon JE, Xu P, Guo X. Reversible phosphorylation of Rpn1 regulates 26S proteasome assembly and function. Proc Natl Acad Sci U S A. 2020;117:328–336. doi: 10.1073/pnas.1912531117. [DOI] [PMC free article] [PubMed] [Google Scholar]
- 21.Zhang H, Pan B, Wu P, Parajuli N, Rekhter MD, Goldberg AL, Wang X. PDE1 inhibition facilitates proteasomal degradation of misfolded proteins and protects against cardiac proteinopathy. Sci Adv. 2019;5:eaaw5870. doi: 10.1126/sciadv.aaw5870. [DOI] [PMC free article] [PubMed] [Google Scholar]
- 22.Myeku N, Clelland CL, Emrani S, Kukushkin NV, Yu WH, Goldberg AL, Duff KE. Tau-driven 26S proteasome impairment and cognitive dysfunction can be prevented early in disease by activating cAMP-PKA signaling. Nat Med. 2016;22:46–53. doi: 10.1038/nm.4011. [DOI] [PMC free article] [PubMed] [Google Scholar]
- 23.Yang L, Parajuli N, Wu P, Liu J, Wang X. S14-phosphorylated RPN6 mediates proteasome activation by PKA and alleviates proteinopathy. Circ Res. 2023;133:572–587. doi: 10.1161/CIRCRESAHA.123.322887. [DOI] [PMC free article] [PubMed] [Google Scholar]
- 24.Pan B, Li J, Parajuli N, Tian Z, Wu P, Lewno MT, Zou J, Wang W, Bedford L, Mayer RJ, Fang J, Liu J, Cui T, Su H, Wang X. The calcineurin-TFEB-p62 pathway mediates the activation of cardiac macroautophagy by proteasomal malfunction. Circ Res. 2020;127:502–518. doi: 10.1161/CIRCRESAHA.119.316007. [DOI] [PMC free article] [PubMed] [Google Scholar]
- 25.Tian Z, Zheng H, Li J, Li Y, Su H, Wang X. Genetically induced moderate inhibition of the proteasome in cardiomyocytes exacerbates myocardial ischemia-reperfusion injury in mice. Circ Res. 2012;111:532–42. doi: 10.1161/CIRCRESAHA.112.270983. [DOI] [PMC free article] [PubMed] [Google Scholar]
- 26.Zheng Q, Huang T, Zhang L, Zhou Y, Luo H, Xu H, Wang X. Dysregulation of ubiquitin-proteasome system in neurodegenerative diseases. Front Aging Neurosci. 2016;8:303. doi: 10.3389/fnagi.2016.00303. [DOI] [PMC free article] [PubMed] [Google Scholar]
- 27.Wang X, Robbins J. Proteasomal and lysosomal protein degradation and heart disease. J Mol Cell Cardiol. 2014;71:16–24. doi: 10.1016/j.yjmcc.2013.11.006. [DOI] [PMC free article] [PubMed] [Google Scholar]
- 28.Ranek MJ, Terpstra EJ, Li J, Kass DA, Wang X. Protein kinase g positively regulates proteasome-mediated degradation of misfolded proteins. Circulation. 2013;128:365–76. doi: 10.1161/CIRCULATIONAHA.113.001971. [DOI] [PMC free article] [PubMed] [Google Scholar]
- 29.Li J, Powell SR, Wang X. Enhancement of proteasome function by PA28α overexpression protects against oxidative stress. FASEB J. 2011;25:883–93. doi: 10.1096/fj.10-160895. [DOI] [PMC free article] [PubMed] [Google Scholar]
- 30.Li J, Horak KM, Su H, Sanbe A, Robbins J, Wang X. Enhancement of proteasomal function protects against cardiac proteinopathy and ischemia/reperfusion injury in mice. J Clin Invest. 2011;121:3689–700. doi: 10.1172/JCI45709. [DOI] [PMC free article] [PubMed] [Google Scholar]
- 31.VerPlank JJS, Tyrkalska SD, Fleming A, Rubinsztein DC, Goldberg AL. cGMP via PKG activates 26S proteasomes and enhances degradation of proteins, including ones that cause neurodegenerative diseases. Proc Natl Acad Sci U S A. 2020;117:14220–14230. doi: 10.1073/pnas.2003277117. [DOI] [PMC free article] [PubMed] [Google Scholar]
- 32.Ranek MJ, Kost CK Jr, Hu C, Martin DS, Wang X. Muscarinic 2 receptors modulate cardiac proteasome function in a protein kinase G-dependent manner. J Mol Cell Cardiol. 2014;69:43–51. doi: 10.1016/j.yjmcc.2014.01.017. [DOI] [PMC free article] [PubMed] [Google Scholar]
- 33.VerPlank JJS, Gawron J, Silvestri NJ, Feltri ML, Wrabetz L, Goldberg AL. Raising cGMP restores proteasome function and myelination in mice with a proteotoxic neuropathy. Brain. 2022;145:168–178. doi: 10.1093/brain/awab249. [DOI] [PMC free article] [PubMed] [Google Scholar]
- 34.VerPlank JJS, Goldberg AL. Exploring the regulation of proteasome function by subunit phosphorylation. Methods Mol Biol. 2018;1844:309–319. doi: 10.1007/978-1-4939-8706-1_20. [DOI] [PMC free article] [PubMed] [Google Scholar]
- 35.VerPlank JJS, Goldberg AL. Regulating protein breakdown through proteasome phosphorylation. Biochem J. 2017;474:3355–3371. doi: 10.1042/BCJ20160809. [DOI] [PMC free article] [PubMed] [Google Scholar]
- 36.Djakovic SN, Marquez-Lona EM, Jakawich SK, Wright R, Chu C, Sutton MA, Patrick GN. Phosphorylation of Rpt6 regulates synaptic strength in hippocampal neurons. J Neurosci. 2012;32:5126–31. doi: 10.1523/JNEUROSCI.4427-11.2012. [DOI] [PMC free article] [PubMed] [Google Scholar]
- 37.Jarome TJ, Kwapis JL, Ruenzel WL, Helmstetter FJ. CaMKII, but not protein kinase A, regulates Rpt6 phosphorylation and proteasome activity during the formation of long-term memories. Front Behav Neurosci. 2013;7:115. doi: 10.3389/fnbeh.2013.00115. [DOI] [PMC free article] [PubMed] [Google Scholar]