

Abstract
Epstein-Barr virus (EBV) is an etiologic risk factor for the development of multiple sclerosis (MS). However, the role of EBV infected B cells in the immunopathology of MS is not well understood. Here, we characterized spontaneous lymphoblastoid cell lines (SLCLs) isolated from MS patients and healthy controls (HC) ex vivo to study EBV and host gene expression in the context of an individual’s endogenous EBV. SLCLs derived from MS patient B cells during active disease had higher EBV lytic gene expression than SLCLs from MS patients with stable disease or HCs. Host gene expression analysis revealed activation of pathways associated with hypercytokinemia and interferon signaling in MS SLCLs and upregulation of forkhead box protein 1 (FOXP1), which contributes to EBV lytic gene expression. We demonstrate that antiviral approaches targeting EBV replication decreased cytokine production and autologous CD4+ T cell responses, in this ex vivo model. These data suggest that dysregulation of intrinsic B-cell control of EBV gene expression drives a pro-inflammatory, pathogenic B cell phenotype that can be attenuated by suppressing EBV lytic gene expression.
Keywords: Multiple Sclerosis, Epstein-Barr Virus, latency, lytic gene expression, spontaneous lymphoblastoid cell lines (LCLs)
INTRODUCTION
Epstein-Barr virus (EBV) is a ubiquitous human γ-herpesvirus that can transform resting B lymphocytes into long-lived memory B cells where the viral genome resides as a latent episome 1–3. Sporadic reactivation from latently infected cells enables the production of progeny virus and a reinfection cycle that persists for the life of the host. Although most EBV infections are well-controlled by T-cell immunity, genetic susceptibilities, immune-deficiencies, environmental exposures, and life-history events can enable various pathogenic outcomes, including diverse lymphoid and epithelial cancers and autoimmune disorders, such as multiple sclerosis (MS)4,5.
MS is a heterogeneous demyelinating disorder with a complex etiology involving the interplay between the immune system and the environment in genetically susceptible individuals6. Studies linking EBV to the etiology of MS began nearly forty years ago 7;a preponderance of epidemiologic, immunologic, and virologic evidence has strengthened this association 5,8. Known abnormalities in the immune response to EBV in MS, include increased titers of EBNA1-specific antibodies (particularly in HLA DRB1*1501), deficient cytotoxic T cell (CTL) control of EBV infection, and evidence of molecular mimicry between EBV-encoded proteins and CNS antigens3,9,10. However, the precise mechanisms by which EBV may act as a trigger and/or driver of disease pathogenesis in MS are poorly defined 4.
The role of B cells in the pathobiology of MS has been underscored by the clinical success of anti-CD20+ and other B cell depleting therapies 11. Memory B cells and plasmablasts are predominantly detected in the CSF of MS patients12. Furthermore, studies have identified an inflammatory B cell subpopulation secreting elevated levels of GM-CSF and IL-6 in MS patients 13,14. These studies reveal the complexity of MS and suggest that there is an inflammatory B cell population that specifically contributes to the pathobiology of MS, potentially the same B cell population that serves as the primary reservoir of latent EBV infection.
Although B cells play a key role in disease pathogenesis and are the source of latent EBV infection, little is known about how host-virus interactions may differ in EBV infected B cells of MS patients compared to healthy individuals. Lymphoblastoid cell lines (LCLs) are immortalized human B cell lines obtained by infecting B cells in vitro with an exogenous, laboratory strain of EBV (typically B95.8). LCLs are commonly used to study EBV immortalization and latency, but do not represent all latency types nor viral variants that contribute to EBV biology and pathogenesis 15,16. Previous studies have described the generation of spontaneous lymphoblastoid cell lines (SLCLs) from MS, IM, and healthy controls by extended culture of PBMCs in the presence of cyclosporin A or anti-CD3 antibodies to eliminate T cells (Fig 1a) 17,18. We have reported on the generation of SLCLs from healthy controls and MS patients derived from PBMC obtained during both “active” and “stable” disease, as defined by MRI19. Here, we show that these SLCLs have fundamental differences in gene expression and immune phenotype from LCLs. Our data further suggest that SLCLs derived from MS patients during the active phase of their disease are different than SLCLs from HCs and fail to establish stable EBV latency. We identify cellular factors that control EBV latency and show that treatment with antivirals that decrease EBV lytic gene expression attenuates inflammatory markers in MS patient SLCLs. Our study suggests that SLCLs are an important experimental model to understand the molecular basis for aberrant B cell control of EBV latency, and further supports a role for EBV infected B cells in the pathobiology of MS.
Figure 1. Generation and growth properties of SLCLs from the PBMC of MS patients and healthy controls (HC).

(a) SLCLs were generated from PBMCs isolated from MS patients (n=11) and healthy controls (n=4) by extended culture of PBMCs without addition of exogenous, lab strain EBV. Three weeks after ex vivo culture, cyclosporin A was added to eliminate residual T -cells. In contrast, LCLs were generated by ex vivo infection with EBV laboratory strain B95.8 and immediate incubation with cyclosporin A. (b) Age of individuals from whom SLCLs were (+) or were not (−) generated (HC n=26; AMS n=11; SMS n=11). The healthy controls from whom we were able to obtain SLCLs were significantly older than the MS patients whose PBMCs yielded SLCLs (one way ANOVA followed by Tukey’s multiple comparison test). (c) EBV DNA copies/cell by (Mann-Whitney test) (HC SLCL n=4; AMS SLCL n=5; SMS SLCL n=6; HC LCL n=8; MS LCL n=8; EBV− n=1). (d) Viability of long-term culture of AMS SLCLs compared to HC and SMS SLCLs, LCLs (B95.8), and EBV (−) BJAB cells (*P<.05, Log-rank Mantel-Cox test) (HC SLCLn=4; AMS SLCL n=5; SMS SLCL n=6; HC LCL n=8; MS LCL n=8; EBV− n=1). All data points represent distinct samples tested in triplicate. (e) Western blot of EBV latent (EBNA1, EBNA2, LMP1, EBNA3C) and lytic (Zta and EA-D) genes relative to β-actin in SLCLs. (f) qRT PCR analysis of EBV lytic gene expression (Zta, EA-D, LF3, and BLLF1) in SLCLs and LCLs (B95.8) from MS patients and controls (HC SLCLn=4; AMS SLCL n=5; SMS SLCL n=6; HC LCL n=8; MS LCL n=8; EBV− n=1). Data are mean ± SD. All data points represent distinct samples.
RESULTS
Growth Defects in SLCLs from MS patients
We previously described the generation of SLCLs from healthy controls (HCs) or MS patients with either active (AMS) or stable (SMS) disease, as defined by MRI19 (Figure 1a and S1 Table). The current study includes an expanded cohort of 48 individuals: 26 healthy controls and 22 MS patients (S1 Table), from whom we propagated SLCLs from 19% of HCs and 50% of MS patients: Notably, SLCLs were only obtained from healthy controls aged 49 or older, while half of the SMS SLCLs and all of the AMS SLCLs were obtained from patients under the age of 49 (S1 Table and Figure 1b). The increased yield of SLCLs from patients with MS compared to healthy controls is consistent with previous reports 20 21.
We first compared SLCLs with LCLs (EBV laboratory strain B95.8 transformed) from 8 healthy controls and 8 MS patients for their EBV viral loads. EBV DNA copy number per cell was more variable among SLCLs compared to LCLs with SLCLs from AMS having significantly higher viral loads compared to LCLs from either healthy controls or MS patients (Figure 1c). In addition, EBV viral loads trended higher in SLCLs derived from patients with active MS than SLCLs derived from healthy controls or patients with stable disease. To evaluate the growth characteristics of SLCLs compared to LCLs and the EBV (−) cell line BJAB, we performed a CFSE cell proliferation assay (Extended Figure 1a). Cell growth was markedly slower in SLCLs derived from AMS compared to HC SLCLs, SMS SLCLS, and LCLs. Moreover, when we maintained extended cultures of SLCLs, LCLs and BJABs (up to one year), we noted that SLCLs derived from AMS patients were more difficult to maintain in culture than SLCLs from SMS patients or HC and four out of five of the AMS lines could not be sustained for one year (Figure 1d and Extended Figure 1b).
Increased EBV lytic gene expression in AMS SLCLs
The increased EBV viral loads and decreased proliferation and viability was suggestive of active EBV replication in these cell lines. Therefore, we next examined EBV lytic gene expression (EA-D and Zta) by flow cytometry (Extended Figure 1c–d) and found elevated expression of lytic genes in AMS SLCLs compared to HC and SMS SLCLs and LCLs generated exogenously with lab strain EBV (B95.8 or Mutu virus). Next, we confirmed these findings by Western blot, which demonstrated that the lytic proteins EA-D and Zta were more highly expressed in AMS SLCLs compared to HC or SMS SLCLs, LCLs (B95.8) or BJABs (Figure 1e and Extended Figure 1e). Additionally, AMS4 demonstrated markedly decreased expression of the EBV latency membrane protein 1 (LMP1), Epstein-Barr nuclear antigen 3C (EBNA3C), and EBNA2 (Figure 1f). This contrasts with the expected EBV gene expression pattern of LCLs (EBV latency III), which typically express all latency genes, including EBNA1, EBNA2, EBNA3C, and LMP1 (Extended Figure 1e). RNAseq analysis of SLCLs revealed that several EBV lytic genes, including A73, LF3, BGLF4, BRRF1, and BXLF1 are increased in active MS SLCLs, while BWRF1 transcripts encoding EBNA-LP were elevated in HC and SMS SLCLs (Extended Figure 1f). RT-qPCR analysis of EBV genes also revealed that AMS cell lines have elevated expression of lytic genes, such as Zta, EA-D, LF3 and BLLF1, compared to HC SLCLs or LCLs (Figure 1f). During the lytic cycle, LF3 RNAs are among the most abundant EBV transcripts expressed 22. In contrast, latency transcripts LMP1 and EBNA1 RNA were decreased in SLCLs compared to B95.8 transformed LCLs (Extended Figure 1g).
Whole genome sequencing of endogenous EBV from SLCLs
To identify potential genomic differences in the endogenous EBV of SLCLs, we performed whole genome sequencing on SLCLs from HC1,2, SMS 1–3, and AMS 1–4. In agreement with the viral load data, DNA-seq read counts revealed an increased copy number of EBV relative to cellular reads in AMS SLCLs (Figure 2a). In addition, the degree of heterogeneity was increased in AMS SLCLs (Figure 2b and c), which may reflect a higher amount of EBV replication in these samples or EBV superinfection of the MS patients from whom AMS SLCLs were derived. Sequence analysis of the entire EBV genomes from SLCLs did not reveal clustering with MS or known ethnogeographic distributions (Extended Figure 2a–b). However, specific regions of increased variation within the EBNA3A gene (Figure 2d) and the oriP locus (Figure 2e–f) correlated with MS status. Several polymorphisms of EBNA3A were observed in three of the seven MS patients (Figure 2d), and common polymorphisms in EBNA1 were detected, but did not strictly correlate with MS (Figure 2g). EBNA1 protein sequences from the AMS SLCLs cluster with each other and the SMS SLCLs samples, along with two reference samples, including one from HC (Figure 2g lower panel).
Figure 2. Whole genome NGS sequencing of endogenous EBV in SLCLs from AMS, SMS, and HC.

(a) Copies of EBV genome per 1 M reads. (b) Heterogeneity of EBV sequences found within samples from AMS (n=4), SMS (n=3), and HC (n=2). (c) AMS, SMS, and HC endogenous EBV aligned to the wild-type EBV genome (NC_007605.1). (d) Protein coding variations in EBNA3A identified in MS patients. (e) Heterogeneity in oriP visualized by the number of variations compared to the reference. (f) Sequence alignment comparing variations in region 7780–7816 in oriP. (g) Phylogenetic analysis of EBNA1 from SLCLs and other EBV associated diseases, including: infectious mononucleosis (IM), diffuse large B cell lymphoma (DLBL), NK/T lymphoma, chronic active EBV (CAEBV), eBL (endemic Burkitt’s lymphoma), nasopharyngeal carcinoma (NPC), gastric cancer (EBVaGC), post-transplant lymphoproliferative disorder (PTDL), post-transplant B lymphoma (PTBL). The EBNA1 protein sequences for each category are shown in the upper panel. (h) ChIP assay for EBNA1 binding to the DS, Qp, and cellular HLA locus (CLIC1 gene) in SLCLs. P values were determined for three biological replicates (Two-way ANOVA); AMS (n=3), SMS (n=3), and HC (n=2). Immunoprecipitation was performed with IgG as a control (not shown). All data points represent distinct samples tested in triplicate. Data are mean ± SD.
EBNA1 binding to viral DNA is compromised in MS SLCLs
We next assayed whether any of these polymorphisms in EBNA1 or heterogeneity in oriP may compromise EBNA1 binding to its essential regulatory elements in the viral genome. Previous studies demonstrated that some EBNA1 polymorphisms destabilize EBV latency23 and EBNA1 depletion leads to lytic reactivation24. Therefore, we tested whether MS-associated EBNA1 may be compromised for binding to essential binding sites in the viral and host genome using chromatin immunoprecipitation (ChIP) assay (Figure 2h). We found that EBNA1 binding to FR and DS elements of oriP, as well as the Qp element regulating EBNA1 mRNA expression, were reduced in MS patient derived SLCLs. In contrast, EBNA1 binding to the cellular HLA locus was not altered, suggesting that the EBNA1 binding to EBV genomes may be compromised in MS patient SLCLs.
SLCL are distinct B-cell type from LCLs
During transformation with lab strain EBV, B cells expand rapidly in size in the first four days of infection and then shrink slightly as they become stable LCLs 25. Flow cytometry revealed that established SLCLs were smaller than stable LCLs (Figure 3a). Flow cytometry analysis confirmed that all SCLs were CD19+ (Figure 3b), but had significant differences in the expression profiles for CD21, CD11c, and HLA Class II (Figure 3b). Of interest, CD21, which is the B cell entry receptor for EBV infection, was downregulated in cells from AMS SLCLs (Figure 3b). EBV has been shown to downregulate CD21 in immature thymocytes 26 and other viruses are known to downregulate their receptors27,28. CD11c, which has been reported to be increased in autoimmune disease was elevated in both AMS and SMS SLCLs. We also observed the downregulation of HLA Class II, but not HLA class I or CD45 in AMS compared to HC and SMS SLCLs, and LCLs (Extended Figure 3a). Both LCLs and SLCLs were further characterized as a mixture of memory B (CD19+CD24+CD38lo) and plasmablasts (CD19+ CD24−CD38high) phenotypes with no evidence of B regs (CD19+CD24+Cd28high) (Figure 3c).
Figure 3. Cell size, surface marker expression and gene expression analysis in SLCLs compared to LCLs.

(a) Cell size as estimated by forward scatter (FSC-A) using flow cytometry in SLCLs (AMS (n=5), SMS (n=6), and HC (n=2)), LCLs (n=16) and Burkitt’s lymphoma cells (Mutu-I and BJAB). (b) Flow cytometry quantitation of CD19, CD21, CD11c, and HLA Class II expression in B cell lines (one-way ANOVA followed by Tukey’s multiple comparison test), Expression measured by mean fluorescence intensity (MFI). (c) Flow cytometry immunophenotyping of B cell memory and plasmablasts using CD24 and CD38 markers (top panel). Quantification of immunophenotyping for LCLs (green) and SLCLs (red) (lower panel). (d) Heatmap cluster analysis of RNA-seq showing top cellular genes that are upregulated (red) or downregulated (blue) in SLCLs vs LCLs (e) Ingenuity pathway analysis (IPA) showing top pathways that are upregulated or downregulated in SLCLs compared to LCLs. (f) IPA showing top regulators that are activated (red) or inactivated (blue) in SLCLs compared to LCLs across select categories of interest. (g) Gene expression (Log2 normalized counts) for notable significantly differentially regulated genes in LCLs (green) compared to SLCLs (red) Statistics generated using the DESeq Wald test (LCL n=15, SLSL n=9). All data points represent distinct samples. Data are mean ± SD.
RNAseq transcriptomics revealed significant differences in host gene expression between SLCLs and LCLs. Heatmap clustering (Figure 3d) and principal component analysis (PCA) (Extended Figure 3b) demonstrate that SLCLs cluster distinctly from LCLs, independently of MS status. Ingenuity pathway analysis (IPA) identified innate immune responses (ISGlyation, interferon signaling, and hypercytokinemia) as the top pathways upregulated in SLCLs compared to LCLs, while some pathways of interest in MS, including neuroinflammation and IL17A signaling, are paradoxically downregulated (Figure3e). IPA also identified interferon α2 (IFNA2), interferon λ1 (IFNL1), Non-POU domain-containing octamer binding protein (NONO), and interferon regulatory factor 7 (IRF7) as top regulators activated in SLCL relative to LCL, and immune related GTPaseM (IRGM), three prime repair exonuclease1 (TREX1), ETV6-RUNX1 as regulators inactivated in SLCL relative to LCL (Figure 3f). Of interest, several transcription factors including T box transcription factor T(TBXT), B cell leukemia/lymphoma 11B (BCL11B) and FOXP1 (among others) and immune regulatory factors CD180, cytidine/uridine monophosphate kinase 2 (CMPK2), immunoglobulin superfamily 3(IGSF3) and membrane associated ring CH-type figure 1 (MARCHF1) (Figure 3g, Extended Figure 3c–d) were differentially expressed in SLCLs compared to LCLs. Collectively, these data show fundamental differences in cell morphology, cell surface markers, and gene expression between SLCLs and LCLs.
Inflammatory markers associated with AMS SLCLs
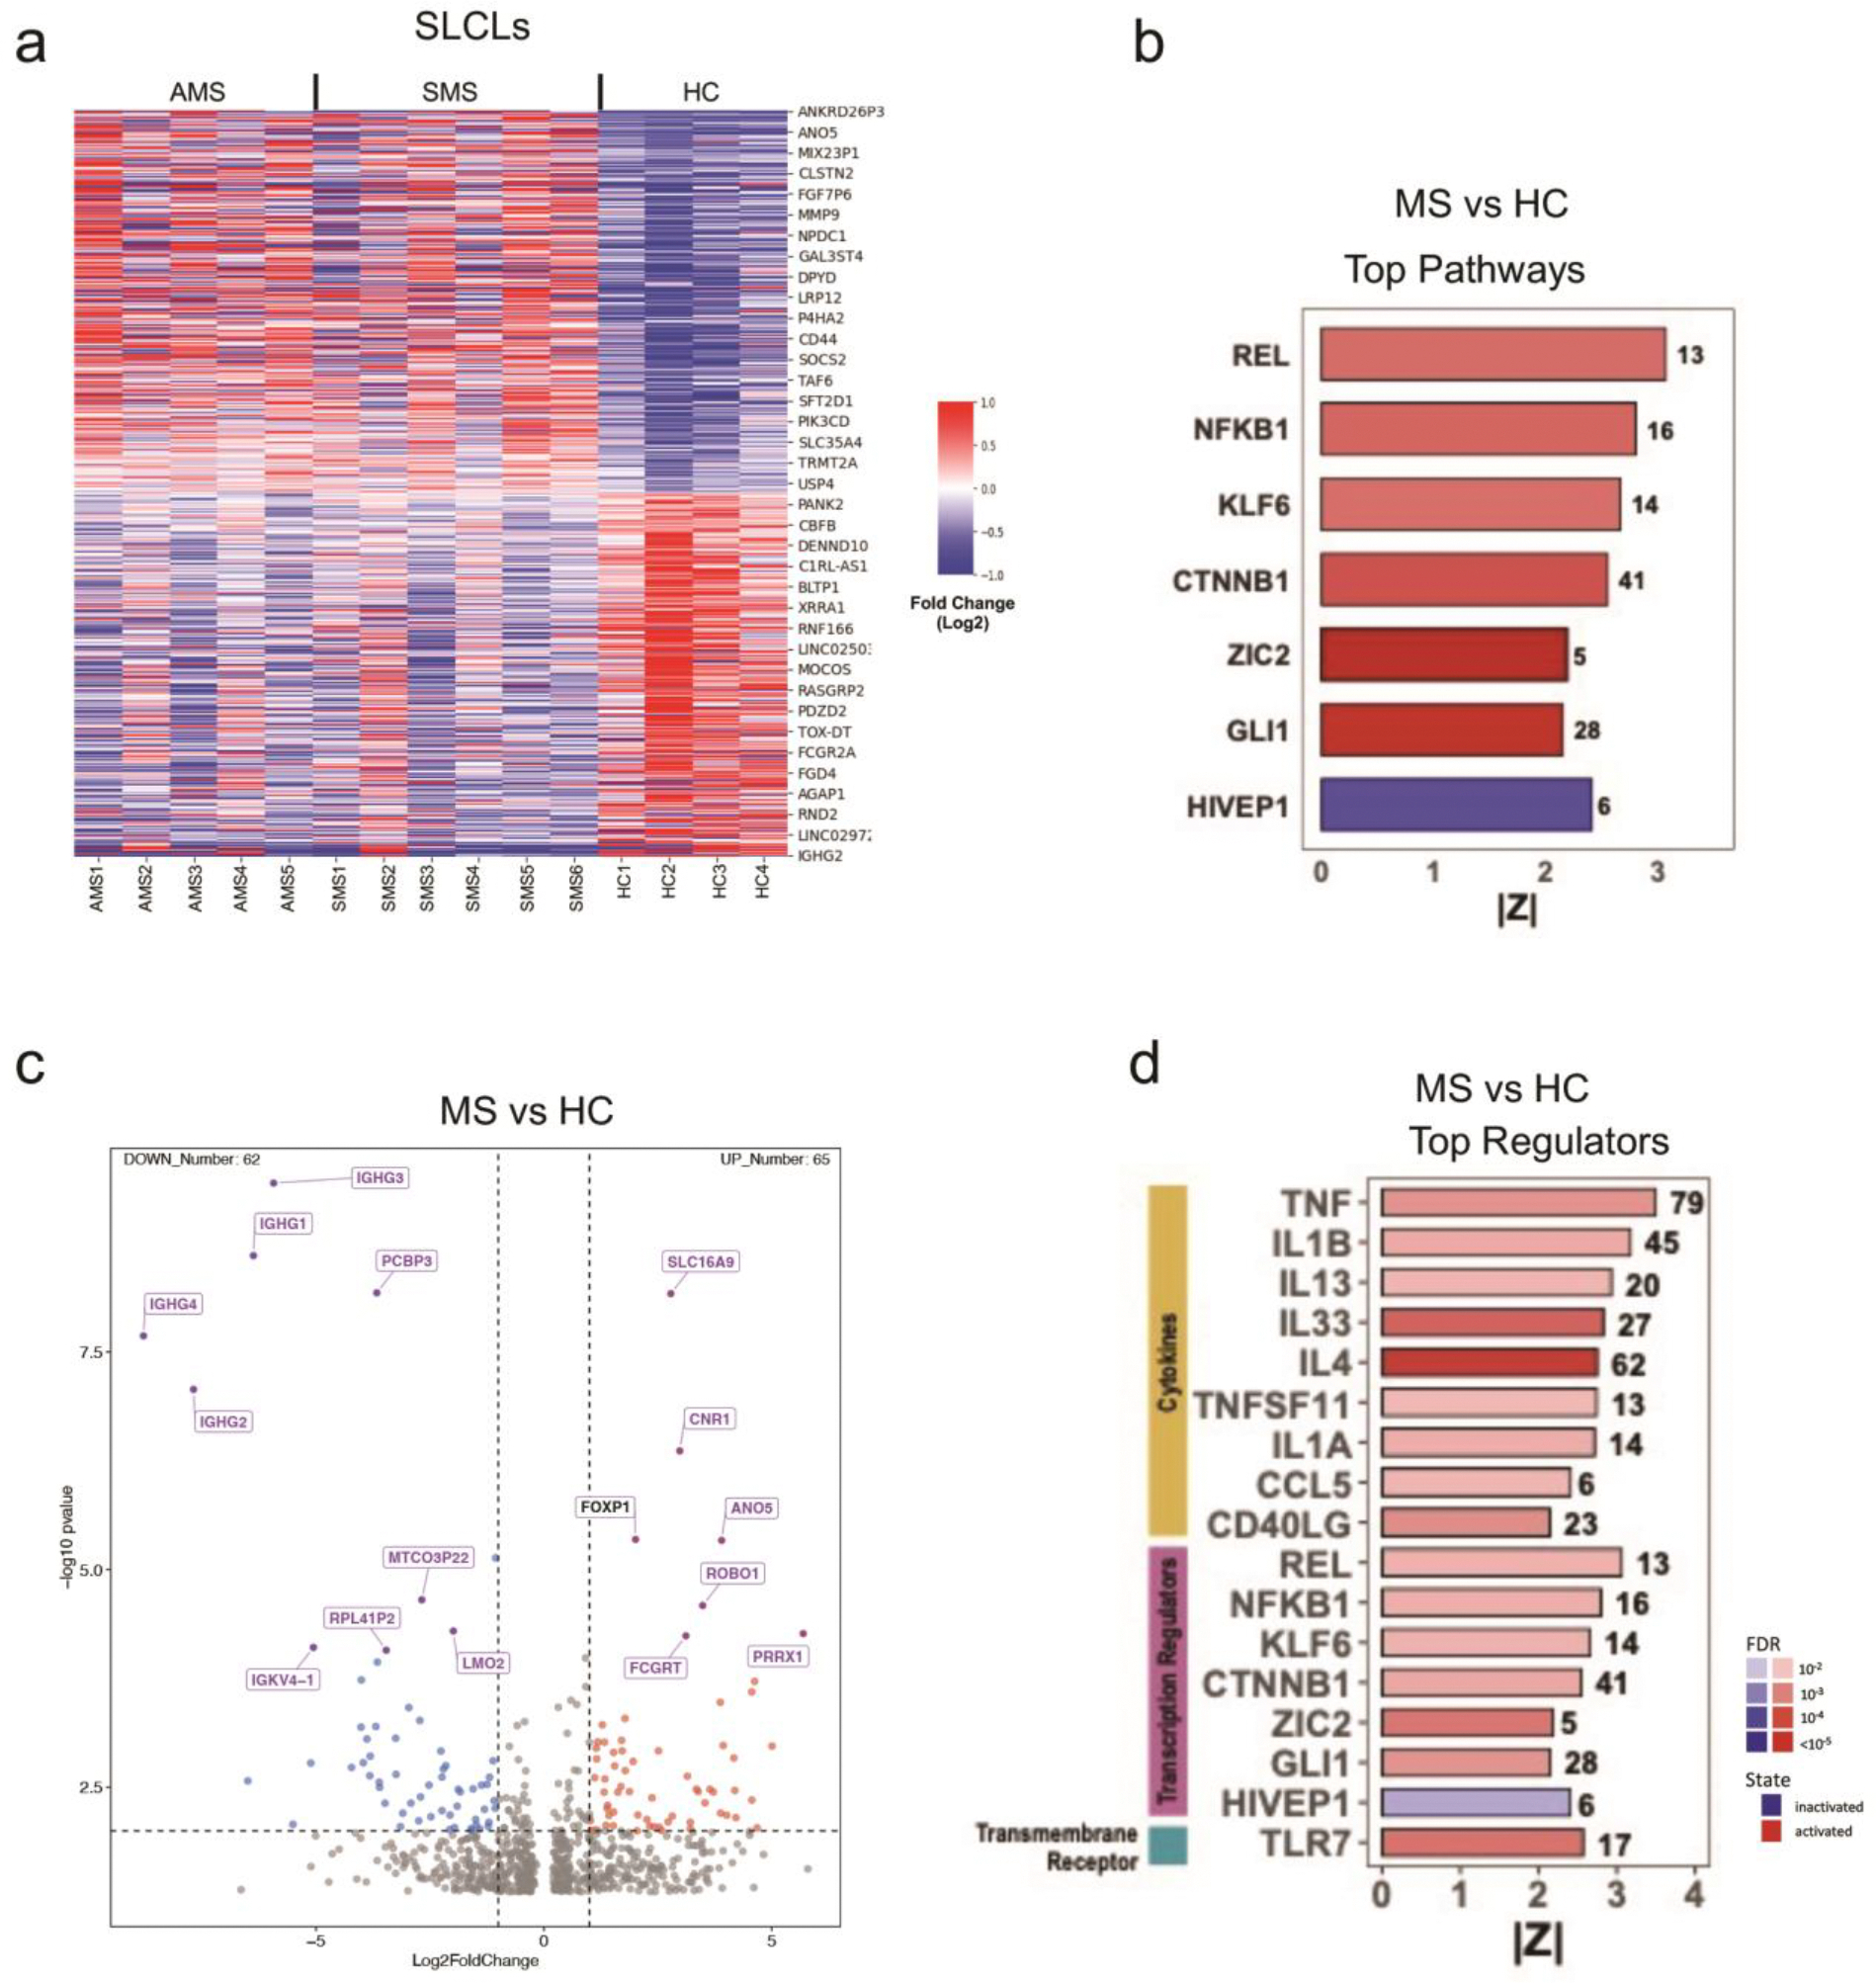
RNA-seq transcriptomics identified many cellular genes that were differentially expressed in SLCLs generated from AMS relative to HC and SMS SLCLs (Extended Figure 4a–d). Relative to HC and SMS, AMS SLCLs expressed higher levels of CD44 and lower levels hepatitis A virus cellular receptor 2 (HAVCR2) (Figure 4b), which we validated by flow cytometry (Figure 4c). HAVCR2/TIM-3 is also implicated in preventing autoimmunity through regulation of Treg17 cell function29. IPA identified IL-12 signaling, pyroptosis, TH1 and Th2 signaling as the top activated pathways, and IL-10 signaling as the top inactivated pathway in AMS SLCLs relative to HCs (Figure 4e). IPA also identified NFκB, IL1-β, and TLR4 as top regulators activated in AMS relative to HCs, and immunity related GTPase M (IRGM), ETV6-RUNX1, three primer repair exonuclease 1 (TREX1) and CDK19 as top regulators inactivated in AMS SLCLs relative to HCs (Figure 4f). Related pathways of interest were implicated when we compared SLCLs from all MS patients to those obtained from HCs (Extended Figure. 4) as well as by comparing AMS to SMS SLCLs (Extended Figure 5). We highlight IL12B, a subunit of IL12 and IL23 with polymorphisms linked to disease course in MS30 and Zinc finger MIZ-type containing 1 (ZMIZ1), a vitamin D responsive coregulator protein that interacts with the androgen receptor and has been identified as a risk factor for autoimmune disorders, including MS31(Extended Figure 5d). Interestingly, when we compared longitudinal EBV viral loads and gene expression profiles in AMS and SMS lines generated from the same individuals we observed increased lytic gene expression (increased viral loads and LF3 expression) (Extended Figure 6a and b) and many differentially regulated genes, including increase IgK and IL-6, and decrease HLA DR and DP genes in active relative to stable conditions for the same patient (Extended Figure 6c–d).
Figure 4. Gene expression in SLCLs from AMS, SMS, and HC.

(a) Heat map summary of RNA-seq data showing top cellular genes that are upregulated (red) or downregulated (blue) in HC (n=4), SMS (n=6), and AMS (n=5) SLCLs. (b) Box plot of CD44 and HAVCR2 normalized counts from RNA-seq for SLCLs from HC, SMS, and AMS (DESeq Wald test). (c) CD44 and HACVR2 cell surface expression by flow cytometry (one-way ANOVA followed by Tukey’s multiple comparison test) AMS (n=5), SMS (n=6), and HC (n=4) SLCL. (d) Volcano plot comparing host gene expression in AMS vs HC SLCLs. (e-f) IPA showing top pathways (e) and regulators (f) that are activated or inactivated in AMS compared to HC SLCLs. All data points represent distinct samples. Data are mean ± SD.
FOXP1 regulates lytic EBV in MS patient SLCLs
FOXP1 was among the most significantly upregulated genes in AMS SLCLs compared to nonactive SLCLs (HC and SMS) (Figure 5a). To test the functional role of FOXP1, we transduced shRNA into AMS4 SLCLs (Figure 5b and Extended Figure 7a–b) and Mutu-I cells, a Burkitt’s lymphoma cell line known to have a leaky latency phenotype similar to AMS LCLs (Figure 5c–e and Extended Figure 5a–d). In both AMS4 SLCLs and Mutu-I cells, FOXP1 knockdown was confirmed by RT-PCR and Western blot (Figure 5b and c). For both cell lines, decreased expression of FOXP1 was associated with decreased expression of ZTA by RT-qPCR (Figure 5b and d), Western blot, and flow cytometry (Extended Figure 5b–d). Further, we found that FOXP1 knockdown also decreased EA-D expression (Figure 5d) and EBV viral load (Figure 5e) in Mutu-I cells, indicating that FOXP1 positively regulates lytic gene expression and DNA replication in B cells with leaky latency.
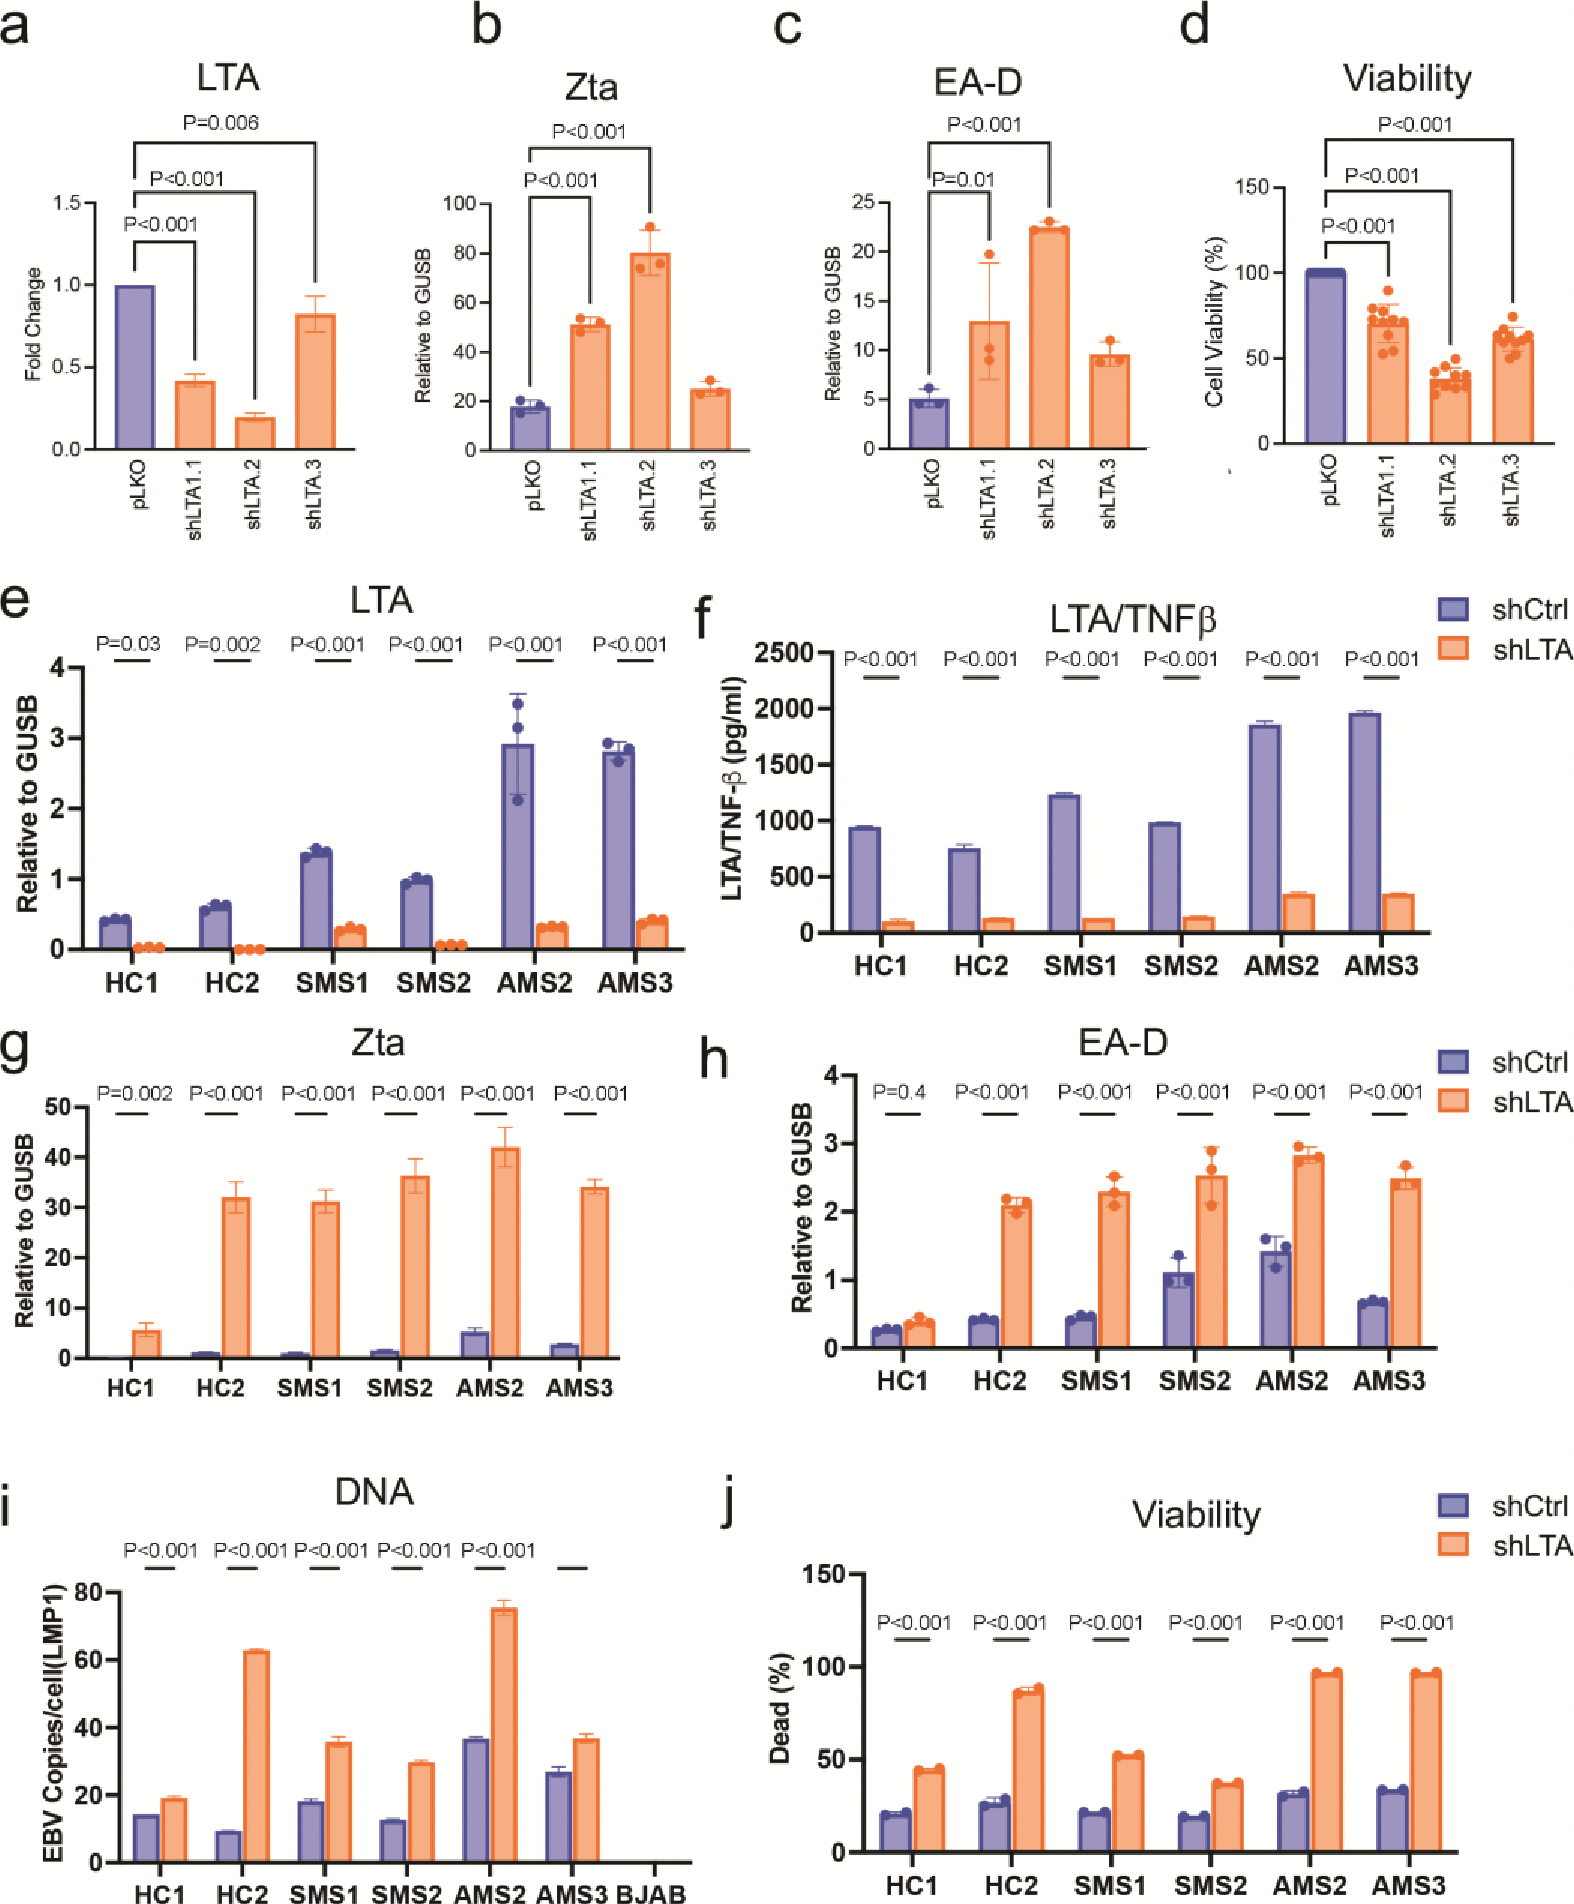
Figure 5. shRNA depletion of FoxP1 or LTA affect EBV latency and SLCL viability.

(a) FOXP1 expression (normalized counts) in SLCLs from HC (blue), SMS (green), and AMS (red) (DESeq Wald test) AMS (n=5), SMS (n=6), and HC (n=4) SLCL. (b) RT-qPCR for FOXP1 and Zta in AMS4 SLCL treated in biological triplicates with shCtrl or shFOXP1 (one-way ANOVA followed by Tukey’s multiple comparison test). (c) Western blot for FOXP1, EA-D, ZTA, and β-actin in Mutu-I cells treated with shCtrl and shFOXP1. (d) Quantification of FOXP1, Zta, and EA-D Western blot for FOXP1, EA-D, ZTA, and β-actin in Mutu-I cells treated with control and FOXP1 shRNA (one-way ANOVA followed by Tukey’s multiple comparison test). (e) EBV viral load (copies per cell) in Mutu-I cells treated with control and FOXP1 shRNA ( one-way ANOVA followed by Tukey’s multiple comparison test) (f) LTA expression (normalized counts) in SLCLs from (HC (blue), SMS (green), and AMS (red) AMS (n=5), SMS (n=6), and HC (n=4) SLCL (g) RT-qPCR for Zta and EA-D in Mutu-I cells treated with shCtrl and shFOXP1 ( one-way ANOVA followed by Tukey’s multiple comparison test). (h) EBV viral load (copies per cell) in Mutu-I cells treated with shCtrl or shLTA (p<0.001; one-way ANOVA followed by Tukey’s multiple comparison test). (i) Flow cytometry for Zta in Mutu-I cells treated with shCtrl or shLTA (one-way ANOVA followed by Tukey’s multiple comparison test). (j) Live dead stain (Zombie-NIR) in SLCLs cells treated with shCtrl and shLTA flow histogram (left) and increase (%) in cell death of shLTA compared to shCtrl (right). All data points represent distinct samples tested in triplicate. Data are mean ± SD.
LTA/TNF-β supports SLCL viability
LTA/TNF-β is an important inflammatory cytokine in MS pathogenesis32,33, and as an autocrine growth factor regulated by EBV LMP1 via canonical and noncanonical NFκB and JAK-STAT activation34. LTA/TNF-β was upregulated in SLCLs (2 HC, 3 SMS, and 4 AMS), although this difference did not meet statistical significance among the expanded cohort, perhaps due to the relative contributions of individual outliers (Figure 5f). Nevertheless, we were interested in determining how LTA/TNF-β may contribute to SLCL control of EBV latency and B cell viability. LTA specific shRNAs were used to knockdown LTA expression in 6 SLCLs (2 AMS, 2 SMS, 2HC) as well as in Mutu-I cells (Figure 5f–j, Extended Figure 8a–j). Knockdown of LTA was confirmed by RT-PCR and ELISA from cell supernatant (Extended Figure 8a, e and f) and resulted a significant increase in Zta and EA-D expression, an increase in EBV viral load (Fig 5h, Extended Figure 8i) and a sharp increase in cell death (Figure 5i and j, Extended Figure 8j). These results underscore the importance of LTA/TNFβ in control of EBV latency and EBV+ B-cell survival.
Antiviral treatments reduce SLCL inflammatory activity
To investigate the role of EBV lytic gene expression on SLCL viability and inflammatory activity, we assayed antiviral compounds known to target EBV lytic infection (ganciclovir, GCV, Foscarnet, Fos; and tenofovir alenfenamide, TAF). All three compounds are known to inhibit viral DNA polymerase, but through different mechanisms of action35. We first assessed the effect of these antivirals on viral lytic cycle gene expression (Zta) and viral DNA load SLCLs (HC1–4, SMS1–6, and AMS 2–5), as well as in B95.8 transformed LCLs (type III latency,), Mutu-I cells (type I latency) and lytically induced (TPA/NaB) Mutu-I cells (Fig. 6a–c). We found that after five days of treatment FOS and TAF significantly reduced Zta expression (Figure 6a) and DNA copy number (Figure 6b) in AMS SLCs, as well as in the lytic induced Mutu-I control cells. The failure of GCV to reduce EBV lytic gene expression and replication could be attributed to the cytotoxicity of GCV for active lytic cells. As expected, GCV and to a lesser extent FOS induced cell death in AMS and lytic induced Mutu-I cells (Figure 6c). In contrast, TAF had no significant effects on cell viability (Figure 6c). These data indicate that there is ongoing lytic replication in the AMS cell lines, and that TAF reduces this lytic activity without inducing cell death.
Figure 6. Tenofovir alanfenamide (TAF) decrease EBV lytic activity and inflammation in SLCLs from MS patients.

GCV (12.5μM), FOS (100μg/ml), and TAF (5μM) were added to SLCLs and LCLs (B95.8) for five days with medium changed daily in HC SLCLs (n=4), SMS LCLs (n=6), AMS LCLs (n=4), B95.8 transformed LCLs (n=3), Burkitt’s lymphoma cells (Mutu-I), and NaB+TPA induced Mutu-I cells. (a) Zta expression by RT-qPCR EBV (% decrease compared to DMSO treated control) in cells treated with GCV or TAF. (b) Viral load in LCLs and SLCLs treated with TAF (% decrease compared to DMSO treated control). (c) Cell death (% dead compared to DMSO treated control) in cells treated with GCV or TAF. (d) IL-6, GM-CSF, LTA/TNFβ, and IL-10 LTA expression by intracellular cytokine stain for AMS, SMS, and HC SLCLs. (e) IL-6 and LTA/TNF-β expression in SLCLs from two AMS patients and two HC treated with TAF. (f) IFNγ production from autologous CD4+ T cells to SLCLs treated with TAF for five days (one-way ANOVA followed by Tukey’s multiple comparison test). All data points represent distinct samples tested in triplicate. Data are mean ± SD.
To assess the effect of EBV lytic replication on the inflammatory phenotype, we measured inflammatory cytokine responses by intracellular cytokine staining in SLCLs (Figure 6d). We found that IL-6 and LTA correlated significantly with lytic activity associated with AMS and SMS SLCLs, while GM-CSF trended to increase and IL-10 did not show correlation (Figure 6d). These findings are consistent with RNA-seq data shown in Fig. 5 correlating AMS with more inflammatory phenotypes. Because TAF reduced both EBV lytic gene expression and EBV viral loads without inducing cell death, we tested whether TAF also reduced inflammatory signaling in these cells. Intracellular cytokine staining of two AMS and HC SLCLs treated with TAF demonstrated a significant reduction in IL-6 expression in both AMS lines and LTA in AMS4 only (Figure 6e). We next performed an autologous T cell ELISpot assays and demonstrated that IFN-γ T cell responses were decreased by addition of TAF to AMS2 and SMS3, but not HC1 (Figure 6f). GCV also reduced autologous T-cell response to AMS2 (Extended Figure 9a). Additionally, TAF treatment reduced AMS4 induction of IFN-γ production in T cells from three separate non-autologous donors in a mixed T cell ELISpot assay (Extended Figure 9b). Taken together, these findings indicate the active MS SCLs have T-cell inflammatory activity that can be reduced by treatment with inhibitors of EBV lytic replication and gene expression.
DISCUSSION
The disease-modifying effects of B cell depletion therapies have underscored the importance of inflammatory B cells in the pathogenesis of MS, but do not elucidate the role of EBV in driving disease pathogenesis. Here, we use a rare collection of SLCLs to characterize host-virus interactions in the context of an individual’s endogenous EBV infection and reveal fundamental differences between SLCLs and LCLs, suggesting that these are distinct models of EBV B cell infection and immortalization. We also find that SLCLs from MS patients have increased production of inflammatory cytokines relative to HCs and that treatment with TAF, an antiviral that inhibits EBV replication and lytic gene expression in AMS SLCLs without inducing cell death, reduced B cell inflammatory gene expression and T cell activation. Collectively, these data suggest that a population of EBV+ B cells that fails to control EBV latency and consequently drive B and T cell inflammation is expanded during periods of active disease in MS patients.
EBV immortalized B cells (LCLs) typically establish a stable type III latency in vitro, although there are high-levels of cell-state plasticity during EBV immortalization 36. Our findings suggest that SLCLs, especially those derived from active MS patients, have distinct features from ex vivo transformed LCLs, despite each being derived from PBMCs, and may reflect a more transitional EBV+ B cell type with relaxed control of the lytic cycle. SLCLs may be transformed by virus present in circulation, either as free viral particles or produced by lytically active B cells in culture, they may also reflect a rare circulating EBV+ B cell that expands efficiently ex vivo. Indeed, the increased likelihood of generating SLCLs from MS patients supports previous reports suggesting poor T cell control of lytic EBV infection in MS and increased CD8+ T cell responses to EBV during AMS37,38. Others have shown that SLCLs generated from patients with IM and transplant recipients have variable proliferation rates, with higher rates of proliferation correlating with higher levels of viral mirBHRF1 expression 39. Importantly, PBMC-derived SLCLs may not be reflective of all B cells, and B cells derived from other compartments or developmental stages may also be relevant to the pathobiology of MS 40. Some SLCLs derived from AMS patients may share features with atypical B-cells41 or age-associated B cells (ABCs; CD11chigh, CD21low)42, a population of B cells known to be driven by gammaherpesvirus infection that have been implicated in MS disease relapses.43
Defects in the control of EBV latency have been considered as potential mechanisms in MS. We recently reported that the frequency of EBV detection in primary CD19+ cells isolated from AMS was increased compared to the HC and SMS groups19. These data may reflect increased EBV replication in MS or, alternatively, suggest that there is diminished immune control of latently infected, proliferating B cells during periods of disease relapse. Poor control of EBV latency in MS is also suggested by previous reports that demonstrated EBV lytic and latent transcripts in MS lesions, with one study showing that, while EBV latent antigens are present in both MS and non-MS brains, EBV lytic antigens were restricted to chronic MS lesions, providing CNS specific evidence of abnormal EBV reactivation in MS44,45.
In addition to variations in the infected B cell phenotype and EBV gene expression, we identified some minor variations in the viral genomes derived from the MS patient SLCLs and an overall increased genomic heterogeneity in SLCL from active MS consistent with increased lytic activation and virus replication in these cells. We identified variants in the EBNA3A gene and the oriP locus in our cohort of MS SLCLs. EBNA3A is essential for EBV immortalization of B cells and binds to transcriptional regulatory elements implicated as MS-risk alleles 46,47. While EBNA1 sequence variations have not been well-correlated with MS-risk, a recent study identified sequence polymorphisms that map to the HLA-DRB1 binding sites, potentially effecting inflammatory and autoreactive T cell responses48. Our findings suggest sequence variations in oriP may compromise EBNA1-DNA binding and control of episomal maintenance. ChIP analysis of EBNA1 binding showed reduced EBNA1 binding in SLCLs derived from MS patients. Variants of EBNA1 that may associate with increased risk of NPC have been reported to have defects in the control of EBV latency 23 and loss of EBNA1 function is known to induce lytic cycle reactivation 49. We suggest that compromised EBNA1-DNA binding may contribute to the deregulation of type III latency, and consequent increase in lytic gene expression.
In search of B cell regulators of EBV lytic activation, we identified FOXP1 as a gene that was upregulated in AMS SLCLs and functionally important for maintaining EBV lytic gene expression. FOXP1 has been reported to block the B cell germinal center reaction 50 and control mature B cell survival in follicular and B-1 B cell subtypes51. Recently, it has been demonstrated in EBV-associated NPC and gastric carcinoma cell lines that EBV miRNAs bind to the 3’UTR of FOXP1 and inhibit its expression, which results in enhanced transcription of PDL1 and immune escape52. Collectively, these findings implicate FOXP1 as a regulator of EBV gene expression, B cell development, and immune signaling in cancer and autoimmunity.
While increased inflammatory responses are well described in B cells from MS patients, it is unclear if EBV further exacerbates these responses in the infected memory B cells. Here, we have shown increased inflammatory cytokine expression and increased transcription of genes and transcriptional pathways involved in B cell inflammation, migration, maturation, and survival in AMS compared to SMS and HC SLCLs. The role of EBV lytic activity in B-cell inflammation was tested by treatment with TAF, a nucleoside analogue that inhibits EBV lytic gene expression without inducing B-cell death35. TAF is used clinically as a reverse-transcriptase inhibitor to block the replication of the HIV and hepatitis B virus, and MS patients are reported to benefit from anti-retroviral therapy that includes TAF 53. Our data indicates that TAF treatment of AMS SLCLs decreased viral lytic gene expression along with the inflammatory cytokines and reduced induction of IFN-γ in T cells exposed to treated SLCLs in an autologous T cell ELISpot assay (Figure 6e). These data indicate that the abnormal EBV lytic activation in AMS SLCLs is capable of driving inflammation in both memory B cells and T cells, suggesting that EBV infected B cells may be a source of pathologic immune responses in both B and T cells, which can be suppressed by inhibiting lytic activation. This study provides support for developing therapies that specifically target EBV infected memory B cells in MS.
There are several limitations to our study. Our cohort numbers are relatively small and are not perfectly age matched, reflecting the difficulty in in generating SLCLs from young healthy donors (Figure 1b). Our study relies extensively on ex vivo expanded SLCLs that may not fully reflect the B-cell populations in vivo. We did not compare SLCLs from other neuroinflammatory and autoimmune disorders, which have also been associated with EBV, to determine which effects are MS specific and which are more broadly associated with proinflammatory conditions. Finally, while TAF inhibits EBV lytic gene expression and replication, it may also inhibit expression of endogenous retroviruses which are known to be activated in B cells from MS patients and after EBV infection54, and could contribute to the inflammatory phenotype. In light of these limitations, we propose that SLCLs are a valuable tool to explore potential differences in the intrinsic control of EBV latency by rare B-cell subtypes. These findings suggest that aberrant B-cell control of EBV latency can drive inflammatory responses implicated in MS pathogenesis and potentially other autoimmune disease.
METHODS
Patient information
Twenty-six healthy controls (HC), eleven MS patients with stable disease (SMS), and eleven MS patients with active disease (AMS) were enrolled in this study. AMS was defined as the presence of at least one cerebral enhancing lesion (CEL) at the time of blood collection; patients with stable disease (SMS) had no CEL at the time of sampling (Table 1). Blood from HC was collected from volunteers at the Transfusion Medicine Blood Bank of the National Institutes of Health (Bethesda, MD). All MS patients were enrolled in an IRB-approved natural history study. Both HC and MS patients signed informed consent prior to participation. We have complied with all relevant ethical regulations and protocols for these studies were reviewed by Institutional Review Boards at the National Institutes of Health (FWA00005897) and The Wistar Institute. Donors for the mixed lymphocyte reaction experiments were obtained from The Wistar Institute’s blood donation program with informed consent.
Generation of Spontaneous Lymphoblastoid Cell lines (SLCLs) and tissue culture conditions
Peripheral blood mononuclear cells (PBMCs) from HC donors and MS patients were isolated from whole blood by ficoll-hypaque density centrifugation and cryopreserved in freezing media containing 20% DMSO. SLCLs were generated by spontaneous expansion from PBMCs in the presence of cyclosporin A to eliminate T cells 55. Briefly, PBMCs were thawed in growth medium [RPMI-1640 medium (Gibco, Gaithersburg, MD) with 10% fetal bovine serum (FBS; Gibco, Gaithersburg, MD), 1% gentamicin (50mg/ml; Quality Biological, Gaithersburg, MD), and 1% L-Glutamine (200mM; Quality Biological, Gaithersburg, MD)] and then plated in 96-well round bottom plates at a density of 1×10⁶/well in a total volume of 200μl. Once per week, 100μl medium was removed and replaced with fresh growth medium. After 3 weeks, a final concentration of 2μg/mL of cyclosporin A (Sigma-Aldrich, St. Louis, MO) was added to each well. Three to six weeks later, clusters of B lymphoblastoid cells (i.e., spontaneous lymphoblastoid cell lines; SLCLs) emerged and were transitioned into progressively larger tissue culture wells until they were robust and numerous enough to be cultured in T25 flasks. Once established, SLCLs were maintained in growth medium and incubated at 37°C under a 5% CO2 humidified atmosphere.
Sixteen B95.8 LCLs (eight from MS patients, eight from healthy blood donors) were generated as described previously19. Healthy control LCLs were generated either at the NIH or The Wistar Institute. MS LCLs were either generated at NIH or purchased from The Coriell Institute for Biomedical Research (Camden, NJ).
Carboxyfluoresein succinimidyl ester (CFSE) Proliferation Assay
SLCLs were labeled with 1.5 μM CFSE (Invitrogen, Waltham, MA) and incubated for seven days. CFSE dilution was measured by flow cytometry using a BD-LSR II (BD Biosciences; Bedford, MA) and proliferation indices were calculated using FlowJo software (Ashland, OR).
Digital Droplet PCR (ddPCR) measure of EBV DNA
DNA was extracted from PBMCs, isolated CD19+ cells and SLCL cell lines using the QIAamp MiniElute Virus Kit (Qiagen, Hilden, Germany) according to the manufacturer’s instructions. All DNA samples were eluted in 25μL of elution buffer. For the duplex ddPCR, the housekeeping gene, Ribonuclease P protein subunit 30 (RPP30) primers and VIC/MGB probe 56 was used to determine the cellular quantities. EBV-LMP1 and BamHI-W primers and FAM/MGB probes (Fwd:AAGGTCAAAGAACAAGGCCAG; Rvs: GCATCGGGAGTCGGTGG; Probe: 6FAM AGCGTGTCCCGTGGAGG MGBNFQ) were designed for ddPCR using NCBI Primer Blast and Primer3Plus57.
Extracellular staining for cell surface markers and intracellular staining for EBV lytic genes
For flow cytometry staining, cells were stained with Zombie-NIR live/dead stain (Biolegend) and treated with a human Fc blocker antibody mix (BioLegend, San Diego, CA) for 20 min. Cells were then washed with FACS buffer (PBS, 5% FBS, 0.1% NaN3 sodium azide) and centrifuged at 400 × g for 5 minutes before staining for 30 minutes at 4°C with the appropriate cocktail containing antibodies to one or more of the following: CD19 (clone HIB19), CD21 (clone Bu32), CD11c (clone Bu15), CD45, HLA class I (HLA A,B,C, clone W6/32, and HLA class II (HLA DR, DP, DQ, clone Tü39). After incubation with antibodies for cell surface markers, cells were washed with FACS buffer, centrifuged at 400 × g for 5 minutes, and then resuspended in 500 μl FACS buffer for immediate analysis by flow cytometry using a BD-LSR II (BD Biosciences, Bedford, MA) or BD Symphony A3 (BD Biosciences, Bedford, MA). For experiments staining for EBV lytic antigens EA-D or Zta (in house rabbit anti-Zta), samples were fixed and permeabilized using an Intracellular Fixation and Permeabilization kit (eBioscience) per manufacturer’s instructions. Compensation was determined using CompBeads (BD Biosciences, Bedford, MA) and single stained fluorescent samples. Doublet discrimination (FSC-H: FSC-A) was performed, and dead cells were excluded using the live/dead discrimination dye Zombie IR (BioLegend, San Diego, CA) before analysis using FlowJo software (Ashland, OR).
Western blots
Cell lysates were prepared in radioimmunoprecipitation assay (RIPA) lysis buffer (50 mM Tris-HCl, pH 7.4, 150 mM NaCl, 0.5% sodium deoxycholate, 0.1% SDS,1 IGEPAL, 10mM glycero-phosphate, 1mM sodium phosphate, 1mM sodium orthovanadate, 1 mM EDTA) supplemented with phenylmethysolfonyl fluoride, benzonase, and 1× protease inhibitor cocktail (Thermo Scientific, Waltham, MA). Protein extracts were obtained by centrifugation at 3,000 × g for 10 min at 4°C. Protein concentrations were equalized using a bicinchoninic acid (BCA) protein assay (Pierce, Appleton, WI) and lysates were subsequently boiled with 2× Laemmli sample buffer (Bio-Rad, Berkley, CA) with 2.5% β-mercaptoethanol (Sigma-Aldrich, St. Louis, MO). Proteins were resolved by gel electrophoresis on an 8–16% Tris-glycine precast gel (Invitrogen, Waltham, MA) and transferred to an Immobilon-P membrane (Millipore, Burlington, MA). Membranes were blocked in 5% milk in PBS-T for 1 h at room temperature and incubated overnight at 4°C with primary antibodies against EBNA1 (1:10,000, rabbit home grown), EBNA2 (1:2,000) MABE8; Millipore, Burlington, MA), LMP1 (1:2,000 M0897; Dako, Santa Clara, CA), EBNA3C (1:2,000 LS-C14045; LS Bio, Seattle, WA), EA-D (ab30541; Abcam, Cambridge, United Kingdom), FOXP1(1:5,000, ab16645; Abcam, Cambridge, United Kingdom) and β-actin (A3854; Sigma-Aldrich, St. Louis, MO) as recommended per the manufacturer. Anti-Zta antibody was generated in-house. Membranes were washed, incubated for 1 h with the appropriate secondary antibody (1:1,000), either goat anti-rabbit IgG-HRP, rabbit anti-mouse IgG-HRP, or anti-sheep IgG. Membranes were then washed and detected by enhanced chemiluminescence. Stripping reagent (Biorad) was used to strip membranes between primary antibody detection for different antigens Densitometry for EBV genes relative to β-actin was performed on ImageJ.
EBV and host gene expression analysis
RNA was isolated from SLCLs using the RNeasy Mini Kit (Qiagen, Hilden, Germany) and treated with deoxyribonuclease (Qiagen, Hilden, Germany). Reverse transcription followed by real-time quantitative PCR (RT-qPCR) was used to measure EBV gene expression levels. Primers used for qPCR of EBV genes include: EBNA1 F (5’-GGTCGTGGACGTGGAGAAAA-3’), EBNA1 R (5’-GGTGGAGAC CCGGATGATG-3’); Zta F (5- TCTGAACTAGAAATAAAGCGATACAAGAA-3’), Zta R (TTGGGCACATCTGCTTCAAC); EA-D F (5’- TTGGGCAGGTGCTGTTGAT-3’), EA-D R (5’- TGCCCACTTCTGCAACGA-3’); LMP1 F (5’-TCCAGAATTGACGGAAGAGGTT-3’), LMP1 R (5’-GCCACCGTCTGTCATCGAA-3’); LF3 F(5’-GCCAATAACTACCTGCCCCT); LF3 R(5’-AGACTTTCGGGGCATTGGTG-3’); and BLLF1 F(5’-AACACAATGTTGCACTGAATGCA), BLLF1 R (5’TCTGCCCGGAGACAACAAAT). Primers used for qPCR of host genes include: FOXP1 F(5’-GTGGCAAGACAGCTCCTTCT-3’), FOXP1 R (5’-ATAGCCACTGACACGGGAAC-3’; LTA F(5’-CTACCGCCCAGCAGTGTC-3’), LTA R(5’-GGTGGTGTCATGGGGAGA-3’). Glucuronidase beta (GUSB) was used as a cellular control: GUSB (5’-CGCCCTGCCTATCTGTATTC and 5’-TCCCCACAGGGAGTGTGTAG-3’). The average cycle threshold (CT) was determined by three independent samples. Template-negative (quantitative PCR reaction mixtures without cDNA) and RT-negative (RNA after genomic DNA elimination) conditions were used as controls. All data were normalized to the housekeeping gene GUSB.
Whole genome sequencing and analysis
DNA was extracted from SLCLs using the DNeasy Blood and Tissue Kit (Qiagen, Hilden, Germany). The Illumina DNA preparation kit was used for sequencing library preparation according to the manufacturer’s instructions. Sequencing was done with an Illumina NextSeq 500 system in high-output mode to generate a total of ~4 × 10⁸ paired-end 75-bp reads. Fastq reads were aligned against the EBV genome (accession NC_007605.1) using the BWA algorithm 58. Analysis of heterogeneous sites was performed following the procedure described by Čejková et al. 59. The consensus EBV genome for each sample was extracted using samtools60. Circus plots were generated using the R BioCircos package. Proteins were translated from nucleotide sequences using Geneious prime 2022.2 (https://www.geneious.com). Nucleotide and protein sequences were aligned using MAFFT v7.407 61 and visualized using Geneious prime 2022.2. Reference EBNA1 regions, in addition to the sequence from NC_007605.1, were obtained by querying each SLCL-derived sequence against NCBI non-redundant nucleotide data base using tblastn and taking differentially occurring sequences between matches for the three groups of samples (HC, AMS, SMS). One representative for each of three groups of identical sequences was kept. A phylogenetic tree of the 13 resulting sequences (9 samples, 4 reference) was constructed using PhyML with default parameters and visualized using iTOL62,63.
Phylogenetic Analysis
A Maximum Likelihood tree (Extended Figure 2A) was built using all available complete genomes and the study consensus sequences. After performing a quality control check, genomes were aligned by MAFFT using NC 007605 as a reference. A maximum likelihood phylogeny was inferred using RAxML v8.2.4 using a GTR substitution model accounting for among-site rate heterogeneity using the Γ distribution and four rate categories (GTRGAMMA model)64 for 100 individual searches with maximum parsimony random-addition starting trees. Node support was evaluated with 100 nonparametric bootstrap pseudoreplicates. The initial ML newick tree and the whole-genome alignment, were used as input for ClonalframeML to infer recombination using 100 pseudo-bootstrap replicates65 For better visualization, the tree was edited using iTol website (v4.2.3) and Microreact (v214)66.
Chromatin immunoprecipitation (ChIP) assay
We previously described a chromatin immunoprecipitation (ChIP) assay to measure EBNA1 protein binding to viral and cellular DNA elements in AMS, SMS, and HC SLCLs 67. Briefly, SLCLs were harvested and cells were crosslinked in 1% formaldehyde for 15 min, followed by quenching for 5 min with 0.125 M glycine, and then lysed in 1 ml SDS lysis buffer (1% SDS, 10 mM EDTA, and 50 mM Tris-HCl, pH 8.0) containing 1 mM PMSF and protease inhibitor cocktails (Sigma-Aldrich, St. Louis, MO), and kept on ice for 10 min. Lysates were sonicated with a Diagenode Bioruptor, cleared by centrifugation to remove insoluble materials, diluted 10-fold into IP Buffer (0.01% SDS, 1.1% Triton X-100, 1.2mM EDTA, 16.7mM Tris pH 8.0, 167mM NaCl, 1 mM PMSF, and protease inhibitors cocktail), and incubated with rabbit anti-EBNA1 antibody (2 μg/reaction) or IgG control for immunoprecipitation overnight at 4°C before washing five times in wash buffer at 4°C and eluting with 150 μl Elution buffer (10mM Tris, pH 8.0, 5mM EDTA, and 1% SDS) at 65°C for 30 min. The elutes were then incubated at 65°C overnight to reverse cross-linking, and further treated with Proteinase K in a final concentration of 100 μg/ml at 50°C for 2 hrs. ChIP DNA was purified by Quick PCR Purification Kit (Life Technologies, Waltham, MA) following the manufacturer’s instruction. Real-time quantitative PCR (ABI 7900HT Fast Real-Time PCR System; Applied Biosystems, Waltham, MA) was performed on ChIP DNA to quantitate two EBV loci (DS50 and Qp) and one cellular locus (CLIC1), which have been reported to associate with EBNA1. Results were quantified as % input. Primer sets used for ChIP were as follows: DS50 F (5’- ATGTAAATAAAACCGTGACAGCTCAT-3’), DS50 R (5’- TTACCCAACGGGAAGCATATG-3); QP F (5’- AAATTGGGTGACCACTGAGGGAGT-3’), QP R (5’- ATAGCATGTATTACCCGCCATCCG-3’); CLIC1 F (5’- CCTAAGCTGAGGGTGATTCATCTC-3’), CLIC1 R (5’- CCCCACATCCTTGACAGGAA-3’).
RNA Seq
Total RNA was isolated from 2 × 10⁶ cells using the RNeasy Mini Kit (Qiagen, Germany) and treated with deoxyribonuclease (Qiagen, Hilden, Germany), following the manufacturer’s protocol. RNA samples were submitted to the Wistar Institute genomics core facility for initial analysis of RNA quality, with each sample having an RNA integrity number (RIN) value greater than 8.5 (TapeStation; Agilent Technologies, Santa Clara, CA). Sequencing library preparation for SLCLs was completed using the ScriptSeq RNA-seq library preparation kit. Sequencing was performed with an Illumina NextSeq 500 system in high-output mode to generate ~140 × 106 reads (2 × 75 bp) across three multiplexed and pooled samples. The QuantSeq 3′-mRNA kit (Lexogen) was used to generate Illumina-compatible sequencing libraries according to the manufacturer’s instructions. Sequencing was done with an Illumina NextSeq 500 system in high-output mode to generate ~4 × 10⁸ reads (1 × 75 bp) across 12 multiplexed and pooled samples. Additional paired-end RNASeq was performed on matched RNA samples from patients from who SLCLs were generated during both active and stable disease (patient A= SMS2 and AMS5; patient B= SMS6 and AMS2).
RNA-seq data was aligned using the bowtie2 68 algorithm against the hg19 human reference genome and RSEM v1.2.12 software 69 was used to estimate read counts and RPKM values using gene information from Ensemble transcriptome version GRCh37.p1370. DESeq2 was used on raw counts to estimate significance of expression differences between any two experimental groups and generate normalized counts. Batch correction was conducted using the removeBatchEffect function embedded in the limma package for downstream analysis71. Heatmaps were generated utilizing the Seaborn Python data visualization library in matplotlib. Volcano plots were generated using online tool from Graphbio 72. Gene set enrichment analysis was done using QIAGEN’s Ingenuity Pathway Analysis software (IPA; QIAGEN, Redwood City, CA; www.qiagen.com/ingenuity) using “Canonical pathways” and “Upstream regulators” option. Top significant results with at least 4 genes and with predicted activation state Z-score of at least |Z|>1 and FDR <5% were reported. Additional pathway analysis was performed using Enrich R 73 and volcano plots generated with GraphBio72.
Cell viability assay
SLCLs, LCLs (B95.8 transformed), and an EBV (−) cell line (BJABS) were plated in growth medium at 8 × 10³ cells (in 100 μl) per well in an opaque 96-well plate. The Cell Titer-Glo® Cell luminescent Cell Viability Assay (Promega, Madison, WI) was used as per kit instructions. Briefly, Cell Titer-Glo® substrate and buffer were combined and 100 μl of this mixture (1:1 ratio of Cell Titer-Glo®: cell mixture) was added to each well and mixed. The plates were then incubated for 20 minutes (for cell lysis to occur), and luminescence was measured on a CLARIOstarPlus (BMG Labtech, Ortenberg, Germany) multilabel plate reader to determine cell viability; the generation of a luminescent signal is proportional to the amount of ATP present. This assay was performed on Day 2 and Day 4 after plating and the percent increase in luminescence in 48 hours (between Days 2 and 4) was calculated.
shRNA knockdown for FOXP1 and LTA
Lentiviruses were generated by co-transfecting pLKO.1 based shRNA expression plasmids with plasmids pMD2.G and pSPAX2 in HEK-293T cells. The shRNA expression plasmids were obtained from The Wistar Institute Molecular Screening Facility. Three days after transfection, supernatant containing the lentivirus was collected and centrifuged to remove cell debris. It was filtered through 0.45 micron filter, aliquoted and stored at −80 C until use.
For gene knockdown, cells were resuspended in the lentivirus along with polybrene at a final concentration of 8 μg/ml followed by spinoculation at 450 g at room temperature for 1.5 h. After spinoculation, the lentivirus was removed and cells were resuspended in fresh medium. After 48 h, puromycin was added to cells at a final concentration of 2.5 μg/ml. Fresh medium containing puromycin was added to cells every 3 days until harvest.
Intracellular Cytokine Staining
Phorbol myristate acetate (PMA; 20 ng/ml, Sigma-Aldrich), Ionomycin (500 ng/ml, Sigma-Aldrich), and Golgi stop (Monensin, BD Bioscience, East Rutherford, NJ) were added to 1×10⁶ cells four hours prior to staining with live/dead reagent to exclude dead cells (Zombie/NIR, Biolegend, San Diego, CA) and anti CD19(BD Biosciences, East Rutherford, NJ). Cells were subsequently fixed and permeabilized with fixation/permeabilization buffer (BD Bioscience, East Rutherford, NJ). Antibodies for IL-6 (clone MQ2–13A5), LTA (clone 359–81-11), GM-CSF (clone BVD2–21C11), TNFα (clone Mab11), and IL-10 (clone JES-12G8) (Biolegend, San Diego, CA) were added and incubated for 30 min on ice. Samples were then washed twice and analyzed by flow cytometry with a BD-LSR II (BD Biosciences, Bedford, MA).
LTA/TNF-β ELISA.
Cell supernatants from SLCLs were harvested 5 days post knockdown with shLTA or control, diluted 1:10 in PBS and tested in biological triplicates with the Human lymphotoxin alpha/TNF-beta DuoSet ELISA (RD Systems, Minneapolis, MN).
IFNγ ELISPOT assay
CD4+ T cells were isolated from PBMC using Dynabeads Untouched Human CD4 T cells kit following the manufacturer’s protocol (Invitrogen, Waltham, MA). and diluted such that 25,000 cells were added per 100 μl in each well of a 96-well plate. Autologous SLCLs (from HC1, AMS2, and SMS3) were treated with 50 μg/ml mitomycin C (Sigma-Aldrich, St. Louis, MO) for 20 min at 37 °C, washed three times, and diluted such that 5,000 cells were added per 100 μl in each well of a 96-well plate. The use of mitomycin C prevented SLCLs from overgrowing the culture. For the mixed lymphocyte reaction, three separate donor CD4T cells were incubated with mitomycin C treated HC1 and AMS4 SLCLs (Extended Figure 8A). CD4 T cells were cultured alone or with 5,000 autologous SLCLs in RPMI medium −/+ TAF for 6 days. Then CD4 T cells were isolated from each group using Dynabeads Untouched Human CD4 T cells kit following the manufacturer’s protocol (Invitrogen, Waltham, MA) and seeded at a density of 100,000 cells/well to 96-well ELISpot-plates (Millipore, Burlington, MA) pre-coated with either TNF-α ELISpot Development Module (SEL210, R&D Systems, Inc.) or IFN-γ ELISpot Development Module (SEL285, R&D Systems, Inc.). Cells were incubated at 37 °C for 24h, after which cells were removed and proceeded to color development with ELISpot Blue Color Module following the manufacturer’s protocol (SEL002, R&D Systems, Inc., Minneapolis, MN). Color development was stopped with a water wash and the plate was air-dried overnight at RT away from light. Spots were enumerated using an automated spot counter (ImmunoSpot® CTL S6 Micro Analyzer; Cellular Technology Limited, Shaker Heights, OH).
Statistical analysis
Sample sizes were not predetermined statistically, but dependent on the ability to generate SLCLs (approximately 10% of healthy blood donors yield SLCLs, with a greater frequency of success from those aged 49+). Technical and biological replicates are included in the figure legends. We assumed normal data distribution for all experiments, but this was not formally tested. Prism v 9.0 (GraphPad) was used for statistical analysis, unless otherwise noted. All Wald, Mann-Whitney and Tukey’s post hoc tests were two tailed. Data collection and analysis were not performed blind to the conditions of the experiments.
Extended Data
Extended Figure 1. Characterization of SLCLs.

(a) Proliferation index in SLCLs and LCLs (B95.8), and EBV (−) BJAB cells measured by CFSE (one-way ANOVA followed by Tukey’s multiple comparison test: (HC SLCL, n=4; SMS SLCL, n=6; AMS SLCL n=5; HC LCL, n=8 MS LCL, n=7). (b) Viability of long-term culture of AMS SLCLs compared to HC and SMS SLCLs, LCLs (B95.8), and EBV (−) BJAB cells (Log-rank Mantel-Cox test). (HC SLCL, n=4; SMS SLCL, n=6; AMS SLCL n=5; HC LCL, n=8 MS LCL, n=8). (c) Flow cytometry analysis of EA-D and Zta expression in AMS and SMS and (d) quantitation of flow cytometry using FlowJo software (one-way ANOVA followed by Tukey’s multiple comparison test (HC SLCL, n=4; SMS SLCL, n=6; AMS SLCL n=5; LCL, n=8). (e) Western blot of EBV latent (EBNA1, EBNA2, LMP1, EBNA3C) and lytic (Zta and Ea-D) genes relative to β-actin in EBV B95.8 strain transformed LCLs (HC LCL n=4 MS LCL n=4). (f) RNA-seq summary heatmap showing top EBV lytic genes that are upregulated (red) or downregulated in AMS SLCLs compared to those from HC or SMS SLCLs. (g) RT-qPCR analysis of EBNA1 and LMP1 gene expression in SLCLs compared to LCLs (one-way ANOVA followed by Tukey’s multiple comparison test: (HC SLCL, n=4; SMS SLCL, n=6; AMS SLCL n=5). All data points represent distinct samples tested in triplicate. Data are mean ± SD (DSeq2 Wald Test).
Extended Figure 2. Overlap between population and phylogenetic groups of masked genomes.

(a) The top phylogenetic tree is midpoint rooted and ignores branch lengths. (b) The bottom tree is unrooted, emphasizing branch lengths. Branches are colored according to geographic isolation. (HC SLCL, n=4; SMS SLCL, n=6; AMS SLCL n=5). All data points represent distinct samples.
Extended Figure 3. Host protein and gene expression in SLCLs compared to LCLs.

(a) Flow cytometry analysis of CD20, Ki67, HLA Class I, and CD45 expression in SLCL HC, SMS, AMS, LCL (B95.8), LCL (Mutu-I), and BJAB. (HC SLCL, n=4; SMS SLCL, n=6; AMS SLCL n = 5, LCL n=16). (b) Principal Component Analysis (PCA) of RNA-Seq comparing SLCLs (green) and LCLs(orange). (c) Volcano plot comparing host gene expression in LCLs vs SLCLs. (d) Gene expression (normalized counts) in LCLs (green) vs SLCLs (red) (DESeq Wald test) (HC SLCL, n=4; SMS SLCL, n=6; AMS SLCL, n = 5; LCL n=15).. All data points represent distinct samples. Stattistical analysis performed using DSeq2 Wald test. Data are mean ± SD.
Extended Figure 4. Host gene expression comparing SLCLs between MS and HCs.
(a) Heat map analysis of RNA-seq showing top cellular genes that are upregulated (red) or downregulated (blue) in HC, SMS, and AMS SLCLs (HC SLCL, n=4; SMS SLCL, n=6; AMS SLCL, n = 5,). (b) IPA showing top pathways that are activated (red) or inactivated (blue) in MS SLCLs compared to HC SLCLs (HC SLCL, n=4; SMS SLCL, n=6; AMS SLCL, n = 5,). (c) Volcano plot highlighting differentially regulated host genes in MS SLCLs vs HC SLCLs (HC SLCL, n=4; SMS SLCL, n=6; AMS SLCL n = 5). (d) IPA showing top regulators that are activated (red) or inactivated (blue) in MS SLCLs compared to HC LCLs (HC SLCL, n=4; SMS SLCL, n=6; AMS SLCL n = 5,). Statistical analysis performed using DSeq2. All data points represent distinct samples.
Extended Figure 5. Host gene expression comparing Active MS SLCLs to Non-Active SLCLs (SMS SLCLs+ HC SLCLs).

(a) Volcano plot comparing top differentially regulated genes in AMS SLCLs vs non-active SLCLs(HC SLCL, n=4; SMS SLCL, n=6; AMS SLCL, n = 5) DSeq2 Wald Test. (b) Ingenuity pathway analysis showing top pathways that are activated (red) or inactivated (blue) in MS SLCLs compared to HC LCLs (HC SLCL, n=4; SMS SLCL, n=6; AMS SLCL n = 5). (c) IPA showing top regulators that are activated (red) or inactivated (blue) in AMS SLCLs vs non-active SLCLs (HC SLCL, n=4; SMS SLCL, n=6; AMS SLCL, n = 5). (d) Gene expression (normalized counts) in AMS (red), SMS (green) and HC (blue) SLCLs for IL12B and ZMIZ1 (DESeq Wald test) (HC SLCL, n=4; SMS SLCL, n=6; AMS SLCL n = 5). Stattistical analysis performed using DSeq2 Wald Test. All data points represent distinct samples tested. Data for (d) are mean ± SD.
Extended Figure 6. Longitudinal analysis and overall comparison of Active MS SLCLs (AMS) with Stable SLCLs (SMS).

(a) Comparison of viral DNA load by ddPCR and (b) EBV LF3 transcript levels by RT-qPCR for SMS2 vs AMS5 (Patient A) and SMS5 vs AS2 (Patient B) (two patients, two timepoints per patient). (c) Heat map comparing all AMS vs SMS showing top 930 differentially regulated genes with p<.05. The gene expression values were log2 normalized and mean-centered to highlight relative changes (SMS n=6; AMS n=5). (d) Gene expression (normalized counts) for all AMS (red) or SMS (green) SLCLs for light chain/immunoglobulin κ, MHC class II DP, MHC class II DR, and IL-6 ((SMS n=6; AMS n=5, DESeq Wald test). All data points represent distinct samples tested from paired-end RNA-seq data set. Data for (d) are mean ± SD.
Extended Figure 7. FOXP1 knockdown downregulates EBV lytic gene expression in AMS SLCLs and Mutu-I Burkitt’s lymphoma cells.

(a) RT-qPCR expression of FOXP1 expression relative to GUSB in AMS4 SLCLs treated with 3 individual shRNAs specific for FOXP1 and control shRNA (n=3 per siRNA treatment). (b) Western blot showing of EBV latent (EBNA1 and LMP1) and lytic (EA-D and Zta) genes, and FOXP1 in shRNA control and FOXP1 shRNA treated cells (n=3 per siRNA treatment, TTEST). (c) Western blot showing three biological replicates of shFOXP1 and shCtrl treated Mutu-I cells probed for expression of FOXP1 and EBV lytic gene Zta and EA-D (n=3 per siRNA treatment, TTEST). (d) Zta expression (mean fluorescence intensity) in Mutu-I cells treated with shFOXP1 or shCtrl ((n=3 per siRNA treatment, one-way ANOVA followed by Tukey’s multiple comparison test). All data points represent distinct samples tested in triplicate. Data are mean ± SD.
Extended Figure 8. LTA knockdown decreases viability and increases EBV lytic gene expression in SLCLs.
(a-c) AMS2 SLCLs were treated with 3 individual shRNAs specific for LTA or control shRNA (pLKO) and assayed for (a) fold change in LTA RNA expression by RT-qPCR, (b) expression of Zta or (c) EA-D by RT-qPCR, and (d) cell viability. (e-j) HC SLCLs (n=2, triplicate samples per treatment for each cell line); SMS SLCLs (n=2, triplicate samples per treatment for each cell line; and AMS SLCLs (n=2); triplicate samples per treatment for each cell line) treated with shLTA1.1 or shCtrl and assayed for (e) LTA RNA expression by RT-qPCR, (f) LTA/TNFβ protein expression in cell supernatant by ELISA (g) Zta expression by RT-pPCR (h) EA-D expression by RT-qPCR, (i) EBV DNA copies per cell by ddPCR, and (j) cell viability by CellTitreGlo. BJAB used as negative control cell line. (one-way ANOVA followed by Tukey’s multiple comparison test). All data points represent distinct samples tested in triplicate. Data are mean ± SD.
Extended Figure 9. Mixed lymphocyte reaction analysis.

(a) IFNγ expression (EliSpot) in CD4+ T cells (1HC SLCL, 1 SMS SLCL, 1AMS SLCL, n=3 for each treatment group) co cultured with autologous SLCLs treated with GCV or DMSO. (one-way ANOVA followed by Tukey’s multiple comparison test). (b) EliSpot analysis of cytokine production during a mixed lymphocyte reaction with three different donor T-cells incubated with HC1 or AMS4 n=3 for each treatment group, one-way ANOVA followed by Tukey’s multiple comparison test). All data points represent distinct samples tested in triplicate. Data are mean ± SD.
Supplementary Material
S1 Table. Patient information. CEL= cerebral enhancing lesion; HC=healthy control; AMS=MS (active); SMS (stable); N/A= not applicable; DMT= disease modifying therapy; M= male; F= female; EDSS= expanded disability status scale; WC=white/Caucasian; A=Asian; B/ AA= black/African American; H= Hispanic; # = line generated, but failed to expand, ^ SMS2 and AMS5 are the same patient sampled at different times; Ψ SMS6 and AMS2 are the same patient sampled at different times; *X2(1, N=48\5.0169, P= .024, Chi-Square Test.
Acknowledgements
We thank the Wistar Core Facilities in Genomics, Bioinformatics and Flow Cytometry for their expert assistance. This work was supported by grants from NIH (R01 CA093606, R01 AI153508, R01 DE017336 to PML, the Wistar Cancer Center Core Grant P30 CA010815, and the DOD (HT9425–23-1–1049 Log#MS220073). The funders had no role in study design, data collection and analysis, decision to publish or preparation of the manuscript.
Funding:
This work was supported by grants from NIH (R01 CA093606, R01 AI153508, R01 DE017336 to PML, the Wistar Cancer Center Core Grant P30 CA010815, and the DOD (HT9425–23-1–1049 Log#MS220073). The funders had no role in study design, data collection and analysis, decision to publish or preparation of the manuscript.
Footnotes
Competing Interest Statement
PML is a founder and advisor to Vironika, LLC. PML has served as consultant for GSK and Sanofi. All other authors declare no competing interests.
Biological materials
Inquiries for obtaining SLCL biological materials should be sent to Dr. Steven Jacobson, NIH, NINDS (jacobsons@ninds.nih.gov). Responses expected within 2 weeks on inquiry.
Data availability
Sequence data, including quantSeq and DNA Seq studies, are accessible through GEO accession (GSE221624; GSE244312, GSE244313, and GSE244314). All source data is provided with the study. No specialty codes were generated for the processing of these data.
References
- 1.Young LS, Yap LF & Murray PG Epstein-Barr virus: more than 50 years old and still providing surprises. Nat Rev Cancer 16, 789–802, doi: 10.1038/nrc.2016.92 (2016). [DOI] [PubMed] [Google Scholar]
- 2.Thorley-Lawson DA EBV Persistence--Introducing the Virus. Curr Top Microbiol Immunol 390, 151–209, doi: 10.1007/978-3-319-22822-8_8 (2015). [DOI] [PMC free article] [PubMed] [Google Scholar]
- 3.Taylor GS, Long HM, Brooks JM, Rickinson AB & Hislop AD The immunology of Epstein-Barr virus-induced disease. Annu Rev Immunol 33, 787–821, doi: 10.1146/annurev-immunol-032414-112326 (2015). [DOI] [PubMed] [Google Scholar]
- 4.Soldan SS & Lieberman PM Epstein-Barr Virus Infection in the Development of Neurological Disorders. Drug Discov Today Dis Models 32, 35–52, doi: 10.1016/j.ddmod.2020.01.001 (2020). [DOI] [PMC free article] [PubMed] [Google Scholar]
- 5.Soldan SS & Lieberman PM Epstein-Barr virus and multiple sclerosis. Nat Rev Microbiol, doi: 10.1038/s41579-022-00770-5 (2022). [DOI] [PMC free article] [PubMed] [Google Scholar]
- 6.Dobson R & Giovannoni G Multiple sclerosis - a review. Eur J Neurol 26, 27–40, doi: 10.1111/ene.13819 (2019). [DOI] [PubMed] [Google Scholar]
- 7.Bray PF, Bloomer LC, Salmon VC, Bagley MH & Larsen PD Epstein-Barr virus infection and antibody synthesis in patients with multiple sclerosis. Arch Neurol 40, 406–408, doi: 10.1001/archneur.1983.04050070036006 (1983). [DOI] [PubMed] [Google Scholar]
- 8.Bjornevik K et al. Longitudinal analysis reveals high prevalence of Epstein-Barr virus associated with multiple sclerosis. Science 375, 296–301, doi: 10.1126/science.abj8222 (2022). [DOI] [PubMed] [Google Scholar]
- 9.Lanz TV et al. Clonally expanded B cells in multiple sclerosis bind EBV EBNA1 and GlialCAM. Nature 603, 321–327, doi: 10.1038/s41586-022-04432-7 (2022). [DOI] [PMC free article] [PubMed] [Google Scholar]
- 10.Sundstrom P, Nystrom M, Ruuth K & Lundgren E Antibodies to specific EBNA-1 domains and HLA DRB1*1501 interact as risk factors for multiple sclerosis. J Neuroimmunol 215, 102–107, doi: 10.1016/j.jneuroim.2009.08.004 (2009). [DOI] [PubMed] [Google Scholar]
- 11.Cencioni MT, Mattoscio M, Magliozzi R, Bar-Or A & Muraro PA B cells in multiple sclerosis - from targeted depletion to immune reconstitution therapies. Nat Rev Neurol 17, 399–414, doi: 10.1038/s41582-021-00498-5 (2021). [DOI] [PubMed] [Google Scholar]
- 12.Enose-Akahata Y et al. Immunophenotypic characterization of CSF B cells in virus-associated neuroinflammatory diseases. PLoS Pathog 14, e1007042, doi: 10.1371/journal.ppat.1007042 (2018). [DOI] [PMC free article] [PubMed] [Google Scholar]
- 13.Li R et al. Dimethyl Fumarate Treatment Mediates an Anti-Inflammatory Shift in B Cell Subsets of Patients with Multiple Sclerosis. J Immunol 198, 691–698, doi: 10.4049/jimmunol.1601649 (2017). [DOI] [PubMed] [Google Scholar]
- 14.Matsushita T et al. Characteristic cerebrospinal fluid cytokine/chemokine profiles in neuromyelitis optica, relapsing remitting or primary progressive multiple sclerosis. PLoS One 8, e61835, doi: 10.1371/journal.pone.0061835 (2013). [DOI] [PMC free article] [PubMed] [Google Scholar]
- 15.Mandage R et al. Genetic factors affecting EBV copy number in lymphoblastoid cell lines derived from the 1000 Genome Project samples. PLoS One 12, e0179446, doi: 10.1371/journal.pone.0179446 (2017). [DOI] [PMC free article] [PubMed] [Google Scholar]
- 16.SoRelle ED et al. Single-cell RNA-seq reveals transcriptomic heterogeneity mediated by host-pathogen dynamics in lymphoblastoid cell lines. Elife 10, doi: 10.7554/eLife.62586 (2021). [DOI] [PMC free article] [PubMed] [Google Scholar]
- 17.Sculley TB, Moss DJ, Hazelton RA & Pope JH Detection of Epstein-Barr virus strain variants in lymphoblastoid cell lines ‘spontaneously’ derived from patients with rheumatoid arthritis, infectious mononucleosis and normal controls. J Gen Virol 68 (Pt 8), 2069–2078, doi: 10.1099/0022-1317-68-8-2069 (1987). [DOI] [PubMed] [Google Scholar]
- 18.Lewin N et al. Characterization of EBV-carrying B-cell populations in healthy seropositive individuals with regard to density, release of transforming virus and spontaneous outgrowth. Int J Cancer 39, 472–476, doi: 10.1002/ijc.2910390411 (1987). [DOI] [PubMed] [Google Scholar]
- 19.Monaco MCG et al. EBNA1 Inhibitors Block Proliferation of Spontaneous Lymphoblastoid Cell Lines From Patients With Multiple Sclerosis and Healthy Controls. Neurol Neuroimmunol Neuroinflamm 10, doi: 10.1212/NXI.0000000000200149 (2023). [DOI] [PMC free article] [PubMed] [Google Scholar]
- 20.Munch M et al. B-lymphoblastoid cell lines from multiple sclerosis patients and a healthy control producing a putative new human retrovirus and Epstein-Barr virus. Mult Scler 1, 78–81, doi: 10.1177/135245859500100204 (1995). [DOI] [PubMed] [Google Scholar]
- 21.Christensen T, Tonjes RR, zur Megede J, Boller K & Moller-Larsen A Reverse transcriptase activity and particle production in B lymphoblastoid cell lines established from lymphocytes of patients with multiple sclerosis. AIDS Res Hum Retroviruses 15, 285–291, doi: 10.1089/088922299311466 (1999). [DOI] [PubMed] [Google Scholar]
- 22.Gao Y, Smith PR, Karran L, Lu QL & Griffin BE Induction of an exceptionally high-level, nontranslated, Epstein-Barr virus-encoded polyadenylated transcript in the Burkitt’s lymphoma line Daudi. J Virol 71, 84–94, doi: 10.1128/jvi.71.1.84-94.1997 (1997). [DOI] [PMC free article] [PubMed] [Google Scholar]
- 23.Dheekollu J et al. Carcinoma-risk variant of EBNA1 deregulates Epstein-Barr Virus episomal latency. Oncotarget 8, 7248–7264, doi: 10.18632/oncotarget.14540 (2017). [DOI] [PMC free article] [PubMed] [Google Scholar]
- 24.Sivachandran N, Wang X & Frappier L Functions of the Epstein-Barr virus EBNA1 protein in viral reactivation and lytic infection. J Virol 86, 6146–6158, doi: 10.1128/JVI.00013-12 (2012). [DOI] [PMC free article] [PubMed] [Google Scholar]
- 25.Mrozek-Gorska P et al. Epstein-Barr virus reprograms human B lymphocytes immediately in the prelatent phase of infection. Proc Natl Acad Sci U S A 116, 16046–16055, doi: 10.1073/pnas.1901314116 (2019). [DOI] [PMC free article] [PubMed] [Google Scholar]
- 26.Fischer EM et al. Expression of CD21 is developmentally regulated during thymic maturation of human T lymphocytes. Int Immunol 11, 1841–1849, doi: 10.1093/intimm/11.11.1841 (1999). [DOI] [PubMed] [Google Scholar]
- 27.Schneider-Schaulies J, Dunster LM, Kobune F, Rima B & ter Meulen V Differential downregulation of CD46 by measles virus strains. J Virol 69, 7257–7259, doi: 10.1128/jvi.69.11.7257-7259.1995 (1995). [DOI] [PMC free article] [PubMed] [Google Scholar]
- 28.Santoro F et al. CD46 is a cellular receptor for human herpesvirus 6. Cell 99, 817–827, doi: 10.1016/s0092-8674(00)81678-5 (1999). [DOI] [PubMed] [Google Scholar]
- 29.Sun H et al. Tim3(+) Foxp3 (+) Treg Cells Are Potent Inhibitors of Effector T Cells and Are Suppressed in Rheumatoid Arthritis. Inflammation 40, 1342–1350, doi: 10.1007/s10753-017-0577-6 (2017). [DOI] [PubMed] [Google Scholar]
- 30.Miteva L, Trenova A, Slavov G & Stanilova S IL12B gene polymorphisms have sex-specific effects in relapsing-remitting multiple sclerosis. Acta Neurol Belg 119, 83–93, doi: 10.1007/s13760-018-01066-3 (2019). [DOI] [PubMed] [Google Scholar]
- 31.Parnell GP et al. The latitude-dependent autoimmune disease risk genes ZMIZ1 and IRF8 regulate mononuclear phagocytic cell differentiation in response to vitamin D. Hum Mol Genet 28, 269–278, doi: 10.1093/hmg/ddy324 (2019). [DOI] [PubMed] [Google Scholar]
- 32.McWilliam O, Sellebjerg F, Marquart HV & von Essen MR B cells from patients with multiple sclerosis have a pathogenic phenotype and increased LTalpha and TGFbeta1 response. J Neuroimmunol 324, 157–164, doi: 10.1016/j.jneuroim.2018.09.001 (2018). [DOI] [PubMed] [Google Scholar]
- 33.Maltby VE et al. Genome-wide DNA methylation changes in CD19(+) B cells from relapsing-remitting multiple sclerosis patients. Sci Rep 8, 17418, doi: 10.1038/s41598-018-35603-0 (2018). [DOI] [PMC free article] [PubMed] [Google Scholar]
- 34.Thompson MP, Aggarwal BB, Shishodia S, Estrov Z & Kurzrock R Autocrine lymphotoxin production in Epstein-Barr virus-immortalized B cells: induction via NF-kappaB activation mediated by EBV-derived latent membrane protein 1. Leukemia 17, 2196–2201, doi: 10.1038/sj.leu.2403130 (2003). [DOI] [PubMed] [Google Scholar]
- 35.Drosu NC, Edelman ER & Housman DE Tenofovir prodrugs potently inhibit Epstein-Barr virus lytic DNA replication by targeting the viral DNA polymerase. Proc Natl Acad Sci U S A 117, 12368–12374, doi: 10.1073/pnas.2002392117 (2020). [DOI] [PMC free article] [PubMed] [Google Scholar]
- 36.SoRelle ED et al. Time-resolved transcriptomes reveal diverse B cell fate trajectories in the early response to Epstein-Barr virus infection. Cell Rep 40, 111286, doi: 10.1016/j.celrep.2022.111286 (2022). [DOI] [PMC free article] [PubMed] [Google Scholar]
- 37.Pender MP, Csurhes PA, Burrows JM & Burrows SR Defective T-cell control of Epstein-Barr virus infection in multiple sclerosis. Clin Transl Immunology 6, e126, doi: 10.1038/cti.2016.87 (2017). [DOI] [PMC free article] [PubMed] [Google Scholar]
- 38.Angelini DF et al. Increased CD8+ T cell response to Epstein-Barr virus lytic antigens in the active phase of multiple sclerosis. PLoS Pathog 9, e1003220, doi: 10.1371/journal.ppat.1003220 (2013). [DOI] [PMC free article] [PubMed] [Google Scholar]
- 39.Delecluse S et al. Identification and Cloning of a New Western Epstein-Barr Virus Strain That Efficiently Replicates in Primary B Cells. J Virol 94, doi: 10.1128/JVI.01918-19 (2020). [DOI] [PMC free article] [PubMed] [Google Scholar]
- 40.Weisel NM et al. Comprehensive analyses of B-cell compartments across the human body reveal novel subsets and a gut-resident memory phenotype. Blood 136, 2774–2785, doi: 10.1182/blood.2019002782 (2020). [DOI] [PMC free article] [PubMed] [Google Scholar]
- 41.SoRelle ED, Reinoso-Vizcaino NM, Horn GQ & Luftig MA Epstein-Barr virus perpetuates B cell germinal center dynamics and generation of autoimmune-associated phenotypes in vitro. Front Immunol 13, 1001145, doi: 10.3389/fimmu.2022.1001145 (2022). [DOI] [PMC free article] [PubMed] [Google Scholar]
- 42.Yang R et al. Human T-bet governs the generation of a distinct subset of CD11c(high)CD21(low) B cells. Sci Immunol 7, eabq3277, doi: 10.1126/sciimmunol.abq3277 (2022). [DOI] [PMC free article] [PubMed] [Google Scholar]
- 43.Mouat IC et al. Gammaherpesvirus infection drives age-associated B cells toward pathogenicity in EAE and MS. Sci Adv 8, eade6844, doi: 10.1126/sciadv.ade6844 (2022). [DOI] [PMC free article] [PubMed] [Google Scholar]
- 44.Veroni C, Serafini B, Rosicarelli B, Fagnani C & Aloisi F Transcriptional profile and Epstein-Barr virus infection status of laser-cut immune infiltrates from the brain of patients with progressive multiple sclerosis. J Neuroinflammation 15, 18, doi: 10.1186/s12974-017-1049-5 (2018). [DOI] [PMC free article] [PubMed] [Google Scholar]
- 45.Moreno MA et al. Molecular signature of Epstein-Barr virus infection in MS brain lesions. Neurol Neuroimmunol Neuroinflamm 5, e466, doi: 10.1212/NXI.0000000000000466 (2018). [DOI] [PMC free article] [PubMed] [Google Scholar]
- 46.Hong T et al. Epstein-Barr virus nuclear antigen 2 extensively rewires the human chromatin landscape at autoimmune risk loci. Genome Res 31, 2185–2198, doi: 10.1101/gr.264705.120 (2021). [DOI] [PMC free article] [PubMed] [Google Scholar]
- 47.Harley JB et al. Transcription factors operate across disease loci, with EBNA2 implicated in autoimmunity. Nat Genet 50, 699–707, doi: 10.1038/s41588-018-0102-3 (2018). [DOI] [PMC free article] [PubMed] [Google Scholar]
- 48.Ramasamy R, Mohammed F & Meier UC HLA DR2b-binding peptides from human endogenous retrovirus envelope, Epstein-Barr virus and brain proteins in the context of molecular mimicry in multiple sclerosis. Immunol Lett 217, 15–24, doi: 10.1016/j.imlet.2019.10.017 (2020). [DOI] [PubMed] [Google Scholar]
- 49.Mansouri S, Pan Q, Blencowe BJ, Claycomb JM & Frappier L Epstein-Barr virus EBNA1 protein regulates viral latency through effects on let-7 microRNA and dicer. J Virol 88, 11166–11177, doi: 10.1128/JVI.01785-14 (2014). [DOI] [PMC free article] [PubMed] [Google Scholar]
- 50.Sagardoy A et al. Downregulation of FOXP1 is required during germinal center B-cell function. Blood 121, 4311–4320, doi: 10.1182/blood-2012-10-462846 (2013). [DOI] [PMC free article] [PubMed] [Google Scholar]
- 51.Patzelt T et al. Foxp1 controls mature B cell survival and the development of follicular and B-1 B cells. Proc Natl Acad Sci U S A 115, 3120–3125, doi: 10.1073/pnas.1711335115 (2018). [DOI] [PMC free article] [PubMed] [Google Scholar]
- 52.Wang J et al. EBV miRNAs BART11 and BART17–3p promote immune escape through the enhancer-mediated transcription of PD-L1. Nat Commun 13, 866, doi: 10.1038/s41467-022-28479-2 (2022). [DOI] [PMC free article] [PubMed] [Google Scholar]
- 53.Torkildsen Ø, Myhr KM, Skogen V, Steffensen LH & Bjørnevik K Tenofovir as a treatment option for multiple sclerosis. Mult Scler Relat Disord 46, 102569, doi: 10.1016/j.msard.2020.102569 (2020). [DOI] [PubMed] [Google Scholar]
- 54.Latifi T, Zebardast A & Marashi SM The role of human endogenous retroviruses (HERVs) in Multiple Sclerosis and the plausible interplay between HERVs, Epstein-Barr virus infection, and vitamin D. Mult Scler Relat Disord 57, 103318, doi: 10.1016/j.msard.2021.103318 (2022). [DOI] [PubMed] [Google Scholar]
- 55.Kubuschok B et al. Gene-modified spontaneous Epstein-Barr virus-transformed lymphoblastoid cell lines as autologous cancer vaccines: mutated p21 ras oncogene as a model. Cancer Gene Ther 7, 1231–1240, doi: 10.1038/sj.cgt.7700236 (2000). [DOI] [PubMed] [Google Scholar]
- 56.Hindson BJ et al. High-throughput droplet digital PCR system for absolute quantitation of DNA copy number. Anal Chem 83, 8604–8610, doi: 10.1021/ac202028g (2011). [DOI] [PMC free article] [PubMed] [Google Scholar]
- 57.Lin CT, Leibovitch EC, Almira-Suarez MI & Jacobson S Human herpesvirus multiplex ddPCR detection in brain tissue from low- and high-grade astrocytoma cases and controls. Infect Agent Cancer 11, 32, doi: 10.1186/s13027-016-0081-x (2016). [DOI] [PMC free article] [PubMed] [Google Scholar]
- 58.Li H & Durbin R Fast and accurate short read alignment with Burrows-Wheeler transform. Bioinformatics 25, 1754–1760, doi: 10.1093/bioinformatics/btp324 (2009). [DOI] [PMC free article] [PubMed] [Google Scholar]
- 59.Čejková D, Strouhal M, Norris SJ, Weinstock GM & Šmajs D A Retrospective Study on Genetic Heterogeneity within Treponema Strains: Subpopulations Are Genetically Distinct in a Limited Number of Positions. PLoS Negl Trop Dis 9, e0004110, doi: 10.1371/journal.pntd.0004110 (2015). [DOI] [PMC free article] [PubMed] [Google Scholar]
- 60.Danecek P et al. Twelve years of SAMtools and BCFtools. Gigascience 10, doi: 10.1093/gigascience/giab008 (2021). [DOI] [PMC free article] [PubMed] [Google Scholar]
- 61.Katoh K & Standley DM MAFFT multiple sequence alignment software version 7: improvements in performance and usability. Mol Biol Evol 30, 772–780, doi: 10.1093/molbev/mst010 (2013). [DOI] [PMC free article] [PubMed] [Google Scholar]
- 62.Guindon S et al. New algorithms and methods to estimate maximum-likelihood phylogenies: assessing the performance of PhyML 3.0. Syst Biol 59, 307–321, doi: 10.1093/sysbio/syq010 (2010). [DOI] [PubMed] [Google Scholar]
- 63.Letunic I & Bork P Interactive Tree Of Life (iTOL) v5: an online tool for phylogenetic tree display and annotation. Nucleic Acids Res 49, W293–W296, doi: 10.1093/nar/gkab301 (2021). [DOI] [PMC free article] [PubMed] [Google Scholar]
- 64.Felsenstein J Confidence Limits on Phylogenies: An Approach Using the Bootstrap. Evolution 39, 783–791, doi: 10.1111/j.1558-5646.1985.tb00420.x (1985). [DOI] [PubMed] [Google Scholar]
- 65.Zanella L et al. A reliable Epstein-Barr Virus classification based on phylogenomic and population analyses. Sci Rep 9, 9829, doi: 10.1038/s41598-019-45986-3 (2019). [DOI] [PMC free article] [PubMed] [Google Scholar]
- 66.Argimon S et al. Microreact: visualizing and sharing data for genomic epidemiology and phylogeography. Microb Genom 2, e000093, doi: 10.1099/mgen.0.000093 (2016). [DOI] [PMC free article] [PubMed] [Google Scholar]
- 67.Messick TE et al. Structure-based design of small-molecule inhibitors of EBNA1 DNA binding blocks Epstein-Barr virus latent infection and tumor growth. Sci Transl Med 11, doi: 10.1126/scitranslmed.aau5612 (2019). [DOI] [PMC free article] [PubMed] [Google Scholar]
- 68.Langmead B, Trapnell C, Pop M & Salzberg SL Ultrafast and memory-efficient alignment of short DNA sequences to the human genome. Genome Biol 10, R25, doi: 10.1186/gb-2009-10-3-r25 (2009). [DOI] [PMC free article] [PubMed] [Google Scholar]
- 69.Li B & Dewey CN RSEM: accurate transcript quantification from RNA-Seq data with or without a reference genome. BMC Bioinformatics 12, 323, doi: 10.1186/1471-2105-12-323 (2011). [DOI] [PMC free article] [PubMed] [Google Scholar]
- 70.Love MI, Huber W & Anders S Moderated estimation of fold change and dispersion for RNA-seq data with DESeq2. Genome Biol 15, 550, doi: 10.1186/s13059-014-0550-8 (2014). [DOI] [PMC free article] [PubMed] [Google Scholar]
- 71.Ritchie ME et al. limma powers differential expression analyses for RNA-sequencing and microarray studies. Nucleic Acids Res 43, e47, doi: 10.1093/nar/gkv007 (2015). [DOI] [PMC free article] [PubMed] [Google Scholar]
- 72.Zhao T & Wang Z GraphBio: A shiny web app to easily perform popular visualization analysis for omics data. Front Genet 13, 957317, doi: 10.3389/fgene.2022.957317 (2022). [DOI] [PMC free article] [PubMed] [Google Scholar]
- 73.Afrasiabi A et al. Genetic and transcriptomic analyses support a switch to lytic phase in Epstein Barr virus infection as an important driver in developing Systemic Lupus Erythematosus. J Autoimmun 127, 102781, doi: 10.1016/j.jaut.2021.102781 (2022). [DOI] [PubMed] [Google Scholar]
Associated Data
This section collects any data citations, data availability statements, or supplementary materials included in this article.
Supplementary Materials
S1 Table. Patient information. CEL= cerebral enhancing lesion; HC=healthy control; AMS=MS (active); SMS (stable); N/A= not applicable; DMT= disease modifying therapy; M= male; F= female; EDSS= expanded disability status scale; WC=white/Caucasian; A=Asian; B/ AA= black/African American; H= Hispanic; # = line generated, but failed to expand, ^ SMS2 and AMS5 are the same patient sampled at different times; Ψ SMS6 and AMS2 are the same patient sampled at different times; *X2(1, N=48\5.0169, P= .024, Chi-Square Test.
Data Availability Statement
Sequence data, including quantSeq and DNA Seq studies, are accessible through GEO accession (GSE221624; GSE244312, GSE244313, and GSE244314). All source data is provided with the study. No specialty codes were generated for the processing of these data.