

Abstract

Pyrophosphate is widely used as an iron supplement because of its excellent complexation and hydrolysis ability; however, there are few reports on the use of pyrophosphate in active ionophores for bone repair. In this research, we proposed a simple and efficient ultrasonic method to prepare magnesium–calcium (pyro)phosphate aggregates (AMCPs). Due to strong hydration, AMCPs maintain a stable amorphous form even at high temperatures (400 °C). By changing the molar ratio of calcium and magnesium ions, the content of calcium and magnesium ions can be customized. AMCPs had surface negativity and complexing ability that realized the controlled release of ions (Ca2+, Mg2+, and P) and drugs (such as doxorubicin) over a long period. Pyrophosphate gave it an excellent bacteriostatic effect. Increasingly released Mg2+ exhibited improved bioactivity though the content of Ca2+ decreased. While Mg2+ content was regulated to 15 wt %, it performed significantly enhanced stimulation on the proliferation, attachment, and differentiation (ALP activity, calcium nodules, and the related gene expression of osteogenesis) of mouse embryo osteoblast precursor cells (MC3T3-E1). Furthermore, the high content of Mg2+ also effectively promoted the proliferation, attachment, and migration of human umbilical vein endothelial cells (HUVECs) and the expression of angiogenic genes. In conclusion, pyrophosphate was an excellent carrier for bioactive ions, and the AMCPs we prepared had a variety of active functions for multiscenario bone repair applications.
1. Introduction
Pyrophosphate is widely used in electroplating, batteries, luminescent materials, and food because of its good complexing properties. Iron pyrophosphate, as an FDA-approved iron supplement, uses the complexing ability of pyrophosphate to improve the availability of iron. However, there are few reports on the preparation of materials with excellent bone repair properties by utilizing the strong ion complexation ability of pyrophosphate.
The great demand for bone materials continuously stimulated a surge of enthusiasm for the preparation and modification of bone repair materials.1 The main mineral composite of human bone is carbonate-substituted hydroxyapatite accompanied by partial substitution of reactive ions, such as Mg2+, Zn2+, and Sr2+.2,3 Pure hydroxyapatite (HA) is biocompatible with excellent stability in a physiological environment, which is equivalent to poor absorbability.4 Now, more studies still focus on HA and TCP. Though different CaPs have been prepared to obtain increased dissolution performance, such as β-calcium phosphate (β-CaP), which has been commercialized, it still suffered from insufficient activity and poor degradation. At the same time, it has also been proposed to prepare ion-doped CaPs by active ion substitution to obtain improved biological activity and degradability. Mg2+ is the fundamental component of the human body that can, directly and indirectly, promote osteogenesis and angiogenesis and exert protective effects on articular cartilage.5,6 Mg-doped HA could improve the solubility of CaPs,7 but due to the limitation of ion substitution sites, only a small amount of Mg ions can be substituted (usually around 5 wt %).8,9 Subsequently, it has been found that MgP cement had better osteogenic ability; however, pure MgP always conducted rapid degradation that hardly matched the speed of new bone growth. A combination of CaPs and MgPs would be an ideal osteogenic material, as it neutralized the degradation rate of both materials and added Mg2+ also increased the biological activity.
The concept of magnesium–calcium phosphate is proposed in this work, in which the products are in the form of aggregates to achieve long-term stable release of Mg2+ and Ca2+ in the physiological environments, thereby continuously stimulating the proliferation and differentiation of osteoblasts.10,11 Pyrophosphates are impressive for their strong complexation effect, so they are excellent carriers for metal ions,12,13 such as Fe3+, Ca2+, and Mg2+. As a result, pyrophosphates are possible ion carriers for Ca2+ and Mg2+ to achieve a long-time stable ion supply for defective bones. Though two polymorphs of hydrated calcium pyrophosphates (CaPP: monoclinic and triclinic phases) present a high inflammatory potential,14 active osteoblasts can eliminate the side effects by promoting the hydrolysis of pyrophosphate,15 and CaP bone cement mixed with CaPP is found to be extremely positive for bone formation and growth.16,17 Random complexation of Ca2+ and Mg2+ increases the probability to form calcium–magnesium phosphate and make the as-prepared phosphate amorphous, and the extra Mg2+ also speeds up the process. The special structure will expose multiple binding sites to increase the load concentration of metal ions and realize dynamic load and release of ions. Furthermore, the main skeleton with pyrophosphate is easily hydrolyzed in vivo, which overcomes the problem that traditional calcium phosphate is difficult to degrade.
In our previous research,18 we successfully synthesized magnesium–calcium (pyro)phosphate with two Ca/Mg ratios and found the products all displayed good osteogenic activity. When the Ca/Mg molar ratio was at 2, it conducted the best bioactivity. As the previous study did not show a large difference in released Mg2+ concentration, the cell activity depended more on the total active ion concentration. In this study, the same preparation method was adopted to prepare amorphous magnesium–calcium (pyro)phosphate aggregates (AMCPs), of which the content of Mg and Ca could be customized. AMCPs were determined amorphous by XRD, and the agglomerate and complex morphologies were observed via SEM and TEM. TGA and DSC results demonstrated that AMCPs had a large amount of adsorption water and structural water, while Mg2+ had a stronger hydration ability and indicated high amorphous stability. Furthermore, the measurement and monitoring of Ca2+, Mg2+, and P suggested the ability to release ions stably in the long term. Bacteriostatic experiments indicated that AMCPs had a better antibacterial effect than HA. The results of the CCK8 and scratch test showed that AMCPs significantly promoted the proliferation and migration of MC3T3-E1 cells and HUVECs by regulating Ca2+ and Mg2+ content. Alizarin red staining (ARS) and alkaline phosphatase (ALP) staining/activity showed the promoting effect of AMCPs on bone differentiation. The results of PCR demonstrated that AMCPs could increase the expression of genes related to osteogenesis (Runx2, Col-I, Opn, and Ocn) and angiogenesis (VEGF and bFGF). In general, AMCPs had better ion loading/release performance with selectable and adjustable content of active ions, and customized AMCPs can significantly improve osteogenic and angiogenic activity, so they are promising as bone defect repair materials. Notably, the ion regulatory properties of pyrophosphate can not only be used in bone repair but also maintain the stable release of ions to achieve specific biological activity through the selection and concentration customization of active ions.
2. Materials and Methods
2.1. Reagents and Materials
Potassium pyrophosphate (K4P2O7), sodium pyrophosphate (Na4P2O7), hydroxyapatite (HA), deuteroxide (D2O), and doxorubicin (DOX) were purchased from Macklin Biochem (Shanghai, China). Magnesium chloride (MgCl2) was obtained from Bidepharm, and calcium hydroxide (Ca(OH)2) was from Sinopharm Chemical Reagent (Shanghai, China). α-Minimum essential medium (α-MEM), Dulbecco’s modified eagle medium (DMEM), fetal bovine serum (FBS), and antibiotics (penicillin and streptomycin) were bought from Thermo Fisher Scientific (Gibco, New York). Ascorbic acid and sodium β-glycerophosphate were purchased from Sigma-Aldrich (Shanghai, China), and dexamethasone was obtained from Solarbio (Beijing, China). Cell Counting Kit 8 (CCK8), BCIP/NBT Alkaline Phosphatase Color Development Kit (ALP staining, C3206), Alizarin Red S Staining Kit for Osteogenesis (ARS staining, C0148S), Actin-Tracker Green-488 (FTIC, C2201S), and antifade mounting medium with diamidinophenyl indole (DAPI, P0131) were all acquired from Beyotime. Escherichia coli (E. coli), mouse embryo osteoblast precursor cells (MC3T3-E1), and human umbilical vein endothelial cells (HUVECs) were provided by Nanjing Medical University.
2.2. Preparation of AMCPs
All the AMCPs were prepared at a constant molar ratio of (Ca + Mg)/P = 1, with varied Ca/Mg ratios, by ultrasonic processing. First, 3.3 g of K4P2O7 was dissolved in 150 mL of deionized water. MgCl2 and Ca(OH)2 were successively uniformly mixed in the solution above according to the ratio. MgCl2 was added first to form a magnesium pyrophosphate precursor. Ca(OH)2 was then introduced and stirred under ultrasound for 4 h. The reaction process is shown in Figure 1, and the specific amounts of MgCl2 and Ca(OH)2 and their simple names are shown in Table 1. When the reaction was finished, the suspension was filtered, washed with distilled water until neutral, and dried at 50 °C overnight.
Figure 1.
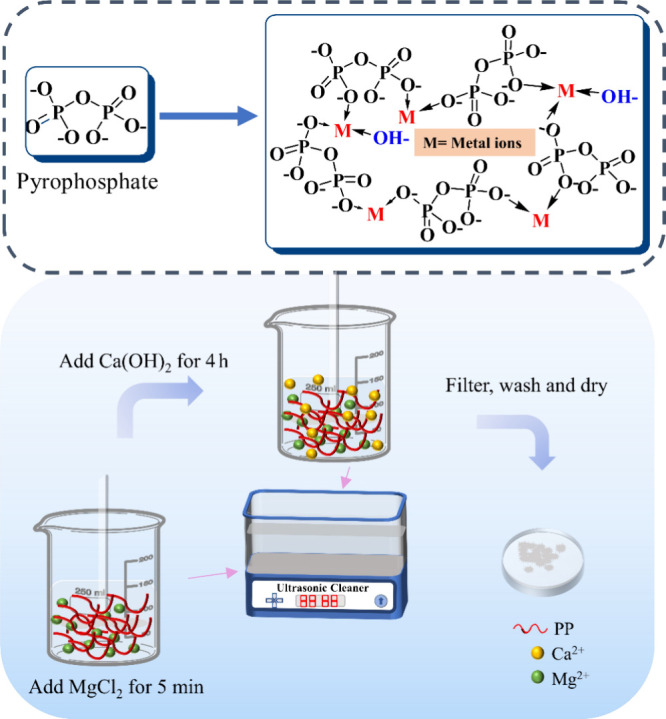
Chemical formula of pyrophosphate and the possible formula of AMCPs and the preparation procedure.
Table 1. Amount of the Reaction Reagents and Mg/Ca Molar Ratio.
| name | K4P2O7/g | MgCl2/g | Ca(OH)2/g | DI water/mL | Mg/Ca molar ratio |
|---|---|---|---|---|---|
| ACP | 3.3 | 0 | 1.48 | 150 | |
| A1M3CP | 3.3 | 0.425 | 1.11 | 150 | 1/3 |
| A2M2CP | 3.3 | 0.95 | 0.74 | 150 | 1 |
| A3M1CP | 3.3 | 1.475 | 0.37 | 150 | 3 |
| AMP | 3.3 | 1.90 | 0 | 150 |
2.3. Characterization
The samples were ground to a particle size of 10–80 μm and then tested by X-ray powder diffraction (XRD, D8-Discover, Bruker, Germany) at a scanning speed of 0.15 s/step within two theta angles from 10° to 80°. Fourier transform infrared spectrometry (FTIR, Nicolet iS10, Thermo Scientific, USA) was conducted to identify the chemical reaction groups with the wavelength of 4000–400 cm–1. A high-resolution confocal Raman rapid imaging system (Raman, WiTec Alpha300 Access) was used to measure the Raman spectra of the samples. The laser wavelength was 532 nm, the output power of the laser beam was 1 mW, and the spectral range was 200–1800 cm–1. 31P NMR was recorded using Bruker ARX 400 and 500 spectrometers, and spectra were recorded in ppm (δ) downfield of TMS (δ = 0) in a deuterated solvent. The morphology of the as-prepared samples was observed by scanning electron microscopy (SEM, Sirion, FEI, USA) at an acceleration voltage of 20 kV and transmission electron microscopy (TEM, Talos F200X, Thermo Fisher, USA). The constituents and contents of the elements with stacking and single states were determined by energy-dispersive X-ray spectroscopy (EDS, Sirion/Talos). The thermal stability and phase transition of the product were determined by synchronous thermal analyzer (STA 449F5, NETZSCH, German). The zeta potentials of powders were determined using a zeta potential analyzer (DT310, DTI).
2.4. In Vitro Bioactivity
Approximately 0.2 g of the AMCPs was tableted into Φ 10 mm × 1 mm and immersed into simulated body fluid (SBF) at 37 °C for 3 weeks with daily SBF refreshing for in vitro bioactivity study. The formulation of the SBF used was described previously.19 The samples were dried at 37 °C for 2 h and weighed each week. SEM and FTIR were performed to observe the surface morphology transition and the functional group changes of the dried samples while the experiment was finished.
2.5. In Vitro DOX Adsorption and Release
DOX standard curve setting: DOX (0.0005, 0.001, 0.0025, 0.005, 0.01, 0.025, 0.05, and 0.1 mg/mL) was prepared with phosphate buffered saline (PBS) to measure the absorbance via ultraviolet–visible spectroscopy (UV-2450) at a fixed wavelength of 480 nm to make an absorption value–concentration trend line for concentration conversion.
Adsorption
About 10 mg of AMCPs was weighed and immersed into 10 mL of DOX (0.1 mg/mL) aqueous solution (PBS, pH 7.4) with a rotational speed of 180 rpm/min at 37 °C for 20 h. After centrifugation, 5 mL of the supernatant was obtained periodically for the analysis of the residual concentration of DOX in the solution and refilled with 5 mL of fresh PBS. Each set of samples was repeated three times. DOX loading was converted by eq 1, where Xt represents the concentration of DOX with different adsorption times.
| 1 |
Release
The DOX-loaded AMCPs were resoaked in 10 mL of PBS with pH 7.4 and pH 4.5. DOX from AMCPs was released via ultraviolet–visible spectroscopy at different time points. About 5 mL of supernatant was removed for DOX concentration analysis, and 5 mL of fresh PBS was replenished each time. The release of DOX in PBS with pH 7.4 and pH 4.5 was calculated by eq 2, where Xt′ means the concentration of DOX with different release times.
| 2 |
2.6. Ion Release
The suspension of AMCPs was prepared with PBS (pH 7.4) to the concentration of 3 mg/mL, and the pH and the concentration of released Ca2+ and Mg2+ were studied at 37 °C for 1, 3, 5, 7, 14, and 21 d. Specifically, the materials were centrifuged to remove all the supernatants for analysis and then added with fresh PBS. The concentration of the released Ca2+ and Mg2+ was measured by inductively coupled plasma atomic emission spectrometry (ICP-AES; iCAP 6000 Series, Thermo, USA). Three replicate samples were prepared, and the whole experiment cycle lasted 21 d.
2.7. Antibacterial Activity
Each 0.2 g sample was weighed and pressed into discs (Φ 10 mm × 0.5 mm) by using a tablet machine (YP-2) under 25 MPa. After being sterilized by 75% ethanol and UV irradiation for 30 min, they were soaked in 10 mL of sterile PBS for 2 h to remove residual ethanol. About 3 mL of fresh PBS was replaced and injected with 100 μL (1 × 10⁷ CFU/mL) of activated E. coli for coculture for 12 h. Discs with attached bacteria were removed and immersed in 3 mL of fresh PBS. A vortex oscillator was used to shake off the bacteria attached to the surface, and 100 μL was removed for gradient dilution. When diluted to a 10–4 gradient, 100 μL of bacterial suspension was obtained for coating with three repeated groups. After 12 h of culture, the number of bacterial colonies on the plate was observed and statistically analyzed.
2.8. Cell Proliferation
About 5 mg of powder was weighed separately into a 15 mL centrifuge tube. Once sterilized by UV irradiation, they were dipped into 10 mL of α-MEM with 10% FBS and 1% antibiotic to prepare the sample extraction solution with a concentration of 0.5 mg/mL. MC3T3-E1 cells and HUVECs were separately digested, counted, and added to a 96-well plate at a concentration of 3000 per well, with each group comprising six parallel pairs. The cells were cultured with sample extraction solution after adherence, and activity tests were performed at 1, 3, and 5 days with the CCK8 method. In brief, the cells were continued to be cultured for 1 h after the addition of 20 μL of CCK8 operating fluid, and the OD value was determined at 450 nm by using a microplate reader (TECAN Infinite M200Pro). The results were processed via statistical analysis.
2.9. Cell Attachment and Morphology
MC3T3-E1 cells and HUVECs were separately digested and cultivated in confocal dishes with 2000 cells, and each group was repeated three times. When cells were attached to the wall, the material extract was replaced for incubation. After being cultivated by the material extract for 24 h, cells were fixed by immunol staining fix solution (P0098, Beyotime), cleaned by immunol staining wash buffer (P0106, Beyotime), and stained with FTIC followed by the guidance of a fluorescent staining kit. After washing twice with immunol staining wash buffer for 5 min per session, cells were sealed with an antifade mounting medium with DAPI. The morphology of the cells was observed by laser confocal microscopy (Zeiss, LSM 700).
2.10. Cell Repair and Migration
To explore the repair and migration ability of HUVECs, 20 000 cells in each well were dispersed in a 12-well plate, and each sample was established with three replicate groups. When cell fusion reached 80%, a 1 mL gun head was used to scratch the bottom of the culture dish, cell fragments were cleaned with PBS, and the material extract was exchanged for incubation. The migration and coverage of HUVECs at the scratch site were pictured within 2 days, and coverage was calculated with image J.
2.11. ALP Staining
MC3T3-E1 cells were digested and seeded in a 12-well plate with a density of 20 000 cells/well with three replicate groups. The material extract was prepared when the cell growth density reached 80%. The culture medium was changed every 2 days until the seventh day of incubation. ALP staining and ALP activity were performed by following the instructions of the ALP staining kit and ALP activity kit from Beyotime.
2.12. ARS for Osteogenesis
MC3T3-E1 cells were grown in 12-well plates at a concentration of 20 000/well. The material extract was prepared when cell growth density reached 80%. Osteogenic differentiation-inducing fluid consisted of 50 μg/mL ascorbic acid, 10 mM sodium β-glycerophosphate, and 10 nM dexamethasone with or without material extract. The induction solution was changed every 3 days, and each set was repeated three times. After 7 days, ARS staining was carried out according to the kit instructions, and the samples were observed and photographed under a microscope.
2.13. Osteogenic and Angiogenic Gene Expression
MC3T3-E1 and HUVECs were cultured in 6-well plates at a concentration of 50 000/well. The material extract was prepared when cell growth density reached 80%. After Trizol cleavage, RNA extraction, reverse transcription, the expression of osteogenic (runt-related transcription factor 2 (Runx2), collagen-I (Col-I), osteopontin (Opn), and osteocalcin (Ocn)) and angiogenic genes (vascular endothelial growth factor (VEGF) and basic fibroblast growth factor (bFGF)) was detected by real-time RT-PCR on 1 and 7 d, respectively. Here, Gapdh (glyceraldehyde-3-phosphate dehydrogenase) was used as the home gene of MC3T3-E1. GAPDH (glyceraldehyde-3-phosphate dehydrogenase) was used as the home gene of HUVECs. The primer sequences are shown in Table S3.
2.14. Statistical Analysis
The values shown are the mean ± SD of at least three replicates. Statistical significance was assessed by one-way ANOVA or two-way ANOVA, followed by multiple comparison tests. All statistical analyses were performed using GraphPad Prism, and P < 0.05 was thought to be significant.
3. Results
3.1. Characteristic Analysis
First, the XRD result showed that products obtained from the reaction with different Ca/Mg molar ratios were amorphous and were similar to those of Leeuwen et al.20 (Figure 2a). A crystalline peak of CaCO3 (PDF# 72-1937) appeared and gradually weakened with increasing Mg2+ concentration, and it disappeared when the Mg/Ca molar ratio was 3. It was related to the reaction of Ca(OH)2 and carbon dioxide in air.
Figure 2.

Qualitative analysis of AMCPs. (a) XRD curves and (c) Raman spectrum of AMCPs and (d) Raman spectrum of A3M1CP at three random locations; (e) 31P NMR of AMCPs dissolved in deuterium oxide.
Figure 2b shows the active group of the as-prepared samples. The peak around 3400 cm–1 was classified as the stretching vibration of H2O and −OH of the samples, whereas the wide range of 2000–2500 cm–1 was the composite vibration of H2O and from 1600 to 2000 cm–1 was the plane bending vibration of −OH.21,22 The typical stretching vibrations of P–O–P and P–O can be found at 400–1000 and 1000–1300 cm–1, respectively.23,24 Especially, P–O vibration peaks were broadened and could be attributed to the overlap of PO3 at 1143 cm–1 and PO43– at 1090 cm–1. A peak at around 1480 cm–1 may be due to the stretching vibration of CO32– that dissolved from the air and was involved in the reaction.25 With the increase of Mg2+, the −OH peak became stronger, and the P–O–P peak of pyrophosphate gradually became sharp, which was due to the weakened influence of the Ca–O bond and surface hydrogen bond formed with reduced particle size.
Figure 2c is the Raman spectrum, and all the samples showed similar Raman bands. The wide symmetric PO2 stretching vibrations were observed at around 1083, 1076, 1073, and 1072 cm–1, respectively. It was the characteristic spectrum of amorphous pyrophosphate.23 The stretch P–O–P bridge vibration was observed at around 788, 783, 775, and 768 cm–1, respectively.26 The peaks at 1423 and 1486 cm–1 were the stretching vibrations of CO32–. A blending −OH vibration appeared at 1549 cm–1. Three randomly selected positions of A3M1CP showed a uniform Raman spectrum as can be seen in Figure 2d, indicating that the product was homogeneous.
Figure 2e detects the phosphate types in the leached liquid, and the 31P NMR result exhibits two peaks, which are attributed to pyrophosphate and orthophosphate.27,28 Compared with potassium pyrophosphate and potassium orthophosphate, the peak position was deviated and was mainly caused by the binding metal ions.29 According to Table 2, despite the 31P NMR difference in the peak intensity, the pyrophosphate peak integrated area is larger than that of orthophosphate (about 3–4 times). In addition, the content of orthophosphate was increased when the Ca/Mg molar ratio increased, which was also consistent with the variation of intensity and width of P–O peaks. To sum up, the products were amorphous pyrophosphates with few phosphates.
Table 2. Integral Area of Orthophosphate and Pyrophosphate and Their Ratios Calculated by 31P NMR.
| name | pyrophosphate (P) | orthophosphate (O) | P/O |
|---|---|---|---|
| ACP | 3.01 | 0.99 | 3.04 |
| A1M3CP | 3.08 | 0.92 | 3.35 |
| A2M2CP | 3.91 | 1.09 | 3.59 |
| A3M1CP | 3.95 | 1.09 | 3.62 |
3.2. Microstructure and Morphology
Next, the microstructure and morphology of products were explored. Pyrophosphates always form insoluble colloid complexes in water in combination with most multivalent cations and improve the solubility of metal ions.13,30 As shown in Figure 3a, the products exhibited a gelatinous shape. The additional Mg2+ changed the morphology of the products, making a more obvious colloidal appearance. Ca2+ and Mg2+ were dispersed uniformly (Figure 3b and Figure S1). The Mg2+ concentration was controllable (5, 10, and 15 wt %) by adjusting the Ca/Mg molar ratio. When the molar value of Mg2+ was three times as abundant as that of Ca2+, the content of Mg2+ reached about 15 wt %. In Table S1, the Ca/P molar ratio was not more than 1 and ACP and A1M3CP had similar Ca/P values, but the molar ratios of total cations to P (other than ACP) were over 1. The molar ratio of O/P was slightly greater than the sum of the phosphate (P2O74– and PO43–) and Ca/P, indicating the reaction of Ca2+ was mainly in the form of a Ca–O bond and bonding to water molecules. Furthermore, Ca(OH)2 would preferentially bind to the phosphate skeleton, and Mg2+ bound either covalently or by adsorption. So they exhibited incremental negative potential as shown in Figure 5a.
Figure 3.

Microstructure and morphology of AMCPs. (a) SEM of AMCPs and (b) EDS of A3M1CP; (c) TEM of AMCPs and (d) EDS of an A3M1CP single agglomerated particle.
Figure 5.

DOX loading and release of AMCPs. (a) Zeta potential of AMCPs; (b) DOX-load percent within 20 h and (c) TG-DSC results of DOX-loaded AMCPs; (d) DOX release ability of AMCPs (converted to adsorption percent) at pH 7.4 and (e) pH 4.5.
Based on the high-resolution morphology images in Figure 3c, AMCPs exhibited lamellar stacking and cross-linking, so they were hardly observed as a single particle. The elemental distribution and content of a single agglomerated particle (A3M1CP) in Figure 3d were consistent with those of the aggregates (Figure 3b). EDS results of a single agglomerated particle verified Ca2+ and Mg2+ were successfully uniformly loaded on the nanoparticles.
3.3. Thermal Stability of AMCPs
The thermal stability of AMCPs was tested with TG-DSC, as shown in Figure 4a, and the weight change mainly underwent four stages. The first stage was at 0–200 °C; AMCPs all lost about 20 wt % of weight, which was due to the removal of large amounts of surface-adsorption water.31 The second stage happened at 200–400 °C with about 3 wt % weightlessness; it corresponded to the loss of some internal bound water.32 The third stage was during 400–700 °C, and it mainly resulted from the decomposition of calcium carbonate.33 There was no mass loss in the fourth stage so that the process was a phase transformation process, and the opposite thermal transition of ACP and AMCP was mainly due to the phase transition of calcium phosphate and magnesium phosphate. While the AMCPs can be dehydrated at 400 °C, the samples after calcination were tested by XRD and FTIR. The XRD results in Figure 4b showed that AMCPs still maintained an amorphous form at high temperature, and a small number of weak crystal peaks appeared in ACP. FTIR results (Figure 4c) showed the water absorption peaks of AMCPs disappeared after calcination. ACP, A1M3CP, and A2M2CP also had a small number of carbonate peaks at 1400–1500 cm–1, but a single peak at 550 cm–1 indicated that the products were still exhibiting a pyrophosphate skeleton.
Figure 4.

Thermal stability of AMCPs. (a) TG-DSC curves; (b) XRD and (c) FTIR results of products sintered at 400 °C.
3.4. Controlled Release of DOX and Ions (Ca2+, Mg2+, and P)
Then the controlled release ability of AMCPs was studied as they had been found to have negative potential as shown in Figure 5a. In addition, pyrophosphate had the complexation property of metal ions, so it may also have the ability of ion regulation. DOX was a positive drug and was selected to explore the drug-loading ability of AMCPs. Bioactive ions (Ca2+, Mg2+, and P) were monitored to assess the ion regulation ability of AMCPs.
3.4.1. Drug Load and Release Ability
By reading the absorbance value measured at 0.5 h, the standard curve was drawn based on 0.0005, 0.001, 0.0025, 0.005, and 0.01 mg/mL. The standard curve of absorbance–concentration is expressed as Y = 21.854X – 0.0052 (R2 = 0.9996).
AMCPs all showed negative potential in Figure 5a, so they displayed promising drug loading and release ability. In factually, AMCPs also have a mesoporous structure. From the SEM results, the particles showed an irregular topography with many voids on the surface, and the TEM results indicated that the surface of the particles appeared to be mesoporous. According to the BET results in Figure S2, AMCPs all have a mesoporous structure. A3M1CP had a larger specific surface area and a large number of mesopores, ACP was with a smaller specific surface area, and A1M3CP owned the smallest specific surface area, but both ACP and A1M3CP showed macropores. The macropores in ACP were mainly due to the accumulation between particles, and A1M3CP was more due to the accumulation of layered particles. The specific surface area of A2M2CP was smaller, and its mesoporous amount was also less, which may have the problem of weak drug adsorption. As the adsorption curves show in Figure 5b, all the samples facilitated instant adsorption of DOX within 0.5 h (A1M3CP and A3M1CP realized higher instant adsorption) and started to enter a dynamic process where the release was greater than the adsorption. The ACP demonstrated fairly stable adsorption activity with the lowest drug load. After 20 h of shaking at 37 °C, the DOX load on A3M1CP reached 74.8%. TG-DSC results of DOX-loaded AMCPs are shown in Figure 5c; the weight loss curve was similar to that of the drug adsorption behavior. The mass of the ACP-DOX group decreased slightly compared with the ACP group, which was mainly due to the loss of DOX; the weight loss of the A2M2CP–DOX group was smaller, which was related to the weak adsorption capacity between A2M2CP and DOX. After the adsorption of DOX by AMCPs, deionization was used for cleaning; in this process, a large amount of drug was released in the A2M2CP–DOX group, so the mass change was smaller. A1M3CP–DOX and A3M1CP–DOX groups experienced obvious weight loss changes with similar behavior of DOX, indicating that the two groups adsorbed more DOX. The sudden drop in mass at 300 °C is mainly due to the decomposition of DOX and the removal of structural water. However, the rapid weight loss temperature of A3M1CP–DOX increased correspondingly, which may be due to the fact that A3M1CP was dominated by magnesium phosphate, which had a lower thermal decomposition temperature and contained more pyrophosphate, which may chemically bind to DOX during the heating process, so the weight loss temperature increased. The release curves at pH 7.4 and pH 4.5 are shown in Figure 5d and 5e. At pH 7.4, A3M1CP presented a rapid release in the first 2 h, whereas rapid release was completed within 0.5 h at pH 4.5. A3M1CP maintained a stable and effective release for a long time, which was better than the release of ACP, A1M3CP, and A2M2CP (the release was small and slow).
3.4.2. Ion Release of Ca2+, Mg2+, and P
Figure 6a–6c showed that Ca2+, Mg2+, and P could be stably released from AMCPs under the combined effect of strong negativity and complexation. A1M3CP and A3M1CP released greater amounts of Ca2+ and Mg2+, respectively, and A3M1CP released the most phosphate groups. Moreover, Figure 6d shows the pH regulation ability of AMCPs to keep the solution slightly alkaline with immersion in PBS (pH 7.4) for every 7 d, which indicated that the materials exhibited degradation behavior.
Figure 6.
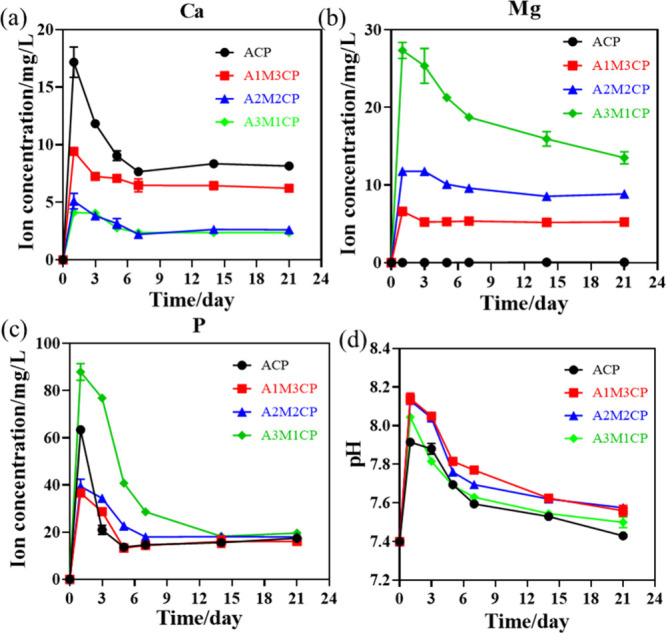
Ion release of AMCPs. (a) Release of Ca2+, (b) Mg2+, and (c) P at pH 7.4; (d) pH variety at different points when immersed in PBS at pH 7.4.
3.5. In Vitro Mineralization and Degradation Ability
Subsequently, the in vitro induced mineralization and degradation abilities of AMCPs were investigated. AMCPs had a strong attraction to metal ions and could provide more nucleation sites. Spherical nanoparticles were observed in Figure 7a, which hinted at the excellent mineralization. A partial enlargement in the red wire frame verified the in situ ion-trapping capacity such that, in addition to precipitation in combination with the released Ca2+ and Mg2+ with phosphate groups in solution, mineral particles also grew on the surface of AMCPs.34,35
Figure 7.

Induced mineralization precipitation of AMCPs in vitro. (a) SEM of deposits for AMCPs and elemental map of A3M1CP in (b); (c) XRD and (d) FTIR of mineral products; (e) weight changes of AMCPs in SBF (pH 7.4) at 7, 14, and 21 d.
The elemental distribution of the deposition product of A3M1CP in Figure 7b indicated that the sedimentary products were dispersed with C and Mg. According to Table S3, the concentration of C of the mineral products was about 9 wt %, which was higher than that reacted from air, so it was from the CO32– in SBF solution, indicating it may be a product with carbonate and redeposited Mg2+. According to the XRD results in Figure 7c, the products after mineralization were sustained as amorphous with several weak crystal peaks. After calibration, the main components of the weak crystal peak were determined as carbonated hydroxyapatite and hydroxyapatite and contained some calcium carbonate. When the concentration of Mg2+ increased, more magnesium hydrogen phosphate hydrate was produced. Furthermore, FTIR results in Figure 7d also exhibited intensive PO43– absorption peaks of apatite and the enhanced stretching vibration of CO32–. Mass fluctuations were not noticeable for 21 d in Figure 7e. The mass changes of A2M2CP and A3M1CP occurred in a wavelike manner, A1M3CP increased from 14 d, and a mass increase was observed only in 21 d for ACP. The fluctuating weight may be an indication of the good degradability of amorphous calcium phosphate and the inequality of degradation versus mineralization rates,11,36 but the rate of mineral growth could generally complement the rate of degradation of the materials, deepening its significance in the medical field.
3.6. Antimicrobial Activity
Figure 8 shows that AMCPs all exhibited excellent antibacterial activity compared with commercial HA, but A1M3CP almost achieved a bactericidal effect. When the concentration of Mg2+ further increased, the bacteriostasis began to weaken. The statistical difference in colony number is striking in Figure 8b.
Figure 8.

Antimicrobial activity of AMCPs. (a) Photographs of the bacterial colony; (b) statistical results of the colony number (**: P < 0.01, ****: P < 0.0001).
3.7. The Osteogenic Ability of AMCPs
Ca2+ and Mg2+ are two main elements for bone health that will inevitably promote the proliferation of osteoblasts.18,37 We found that AMCPs could release Ca2+ and Mg2+ for a long time, which would provide long-term effective stimulation on cells. In addition, the microalkaline environment created by the as-prepared particles was also a possible factor for cell viability and migration.38 In order to better fit the in vitro cell experiment, we also measured the concentration of additional active ions released in the material extract at the concentration of 0.5 mg/mL. By collecting the extract daily for ion concentration testing, it can be seen from Figure S3 that A3M1CP released more Mg2+ and P, maintaining a daily Mg2+ concentration of about 0.5–1 mM. Although its Ca2+ were less released, after 3 days, the Ca2+ released by all groups maintained a small difference. The as-prepared samples exhibited excellent compatibility with MC3T3-E1 cells from Figure 9a. Compared with the control, AMCPs could contribute to the growth of cells at 1, 3, and 5 d. With the addition of magnesium ions, the proliferative activity of the cells improved, and A3M1CP presented better proliferation for MC3T3-E1. In Figure 9b, after 24 h of incubation with the material extract, MC3T3-E1 cells grew in clusters with a spindle shape and showed a natural adhesion state with many pseudopods. We observed more cells and more lamellipodia than filopodia for A3M1CP.
Figure 9.

Evaluation of osteogenic bioactivity of AMCPs. (a) Cell proliferation at 1, 3, and 5 d cultured by material extraction medium; (b) confocal images of cell fluorescence staining treated for 24 h by material extraction medium (63× oil, the scale bar is 10 μm).
AMCPs also exhibited excellent promotion of osteogenic differentiation. Compared with the control, the sustained release of Ca2+ and Mg2+ could significantly increase the activity of ALP and promote osteoblast differentiation. After 7 d of culture, ALP staining in Figure 10a showed that cells treated with AMCPs all increased ALP activity, and the staining area of A3M1CP was darker and larger, which represented better ALP activity and was consistent with the quantitate results of ALP activity in Figure S4. ARS is an indicator of osteogenic mineralization, and more calcium deposition reflected by calcium nodules demonstrated a higher potential to stimulate bone growth in vivo.39 The results in Figure 10b showed that calcium nodules formed after 14 d by AMCPs induction solution treatment. Many dark nodules were observed in the control group, ACP and A1M3CP showed deep colors, A2M2CP had dense calcium nodules, but A3M1CP exhibited larger nodules.
Figure 10.

Evaluation of osteogenic differentiation promoting of AMCPs. (a) ALP staining. (b) ARS results and mineralized nodules appeared orange or purplish red. All the images were obtained at the same multiple sites. (c) Expression of genes associated with osteogenesis at 1 and 7 d (ns: no significance, *: P < 0.05, **: P < 0.01, ***: P < 0.001, ****: P < 0.0001).
Runx2, Col-I, Opn, and Ocn are important markers of osteogenic differentiation.40 Runx2 is an important gene for osteogenic differentiation and bone formation expressed at the early stage of mesenchymal cell differentiation.41 Opn is a noncollagenous protein produced by osteoblasts and osteoclasts, which is not required for the normal development of bones.42 Ocn mainly reflects the formation of mineralized nodules, and Col-I is the main index for osteogenesis.43
MC3T3-E1 cultured for 1 and 7 d was extracted for real-time PCR detection. At 1 and 7 d, AMCPs could promote the expression of osteogenesis-related genes as shown in Figure 10c. The promotion effect of A3M1CP on Col-I expression significantly surpassed that of other groups, and the acceleration on Runx2 and Ocn was also obviously better than that of the control group. The expression of Opn was boosted on 1 d and inhibited on 7 d, but A3M1CP still showed the best induction ability, indicating the excellent potential for bone repair.
3.8. The Angiogenic Ability of AMCPs
It seemed that AMCPs also displayed good angiogenesis ability such that AMCPs would contribute to the proliferation of HUVECs (A3M1CP showed the best) as shown in Figure 11b, which may be a contribution of Mg2+. HUVECs cultured with material extract could aggregate and grow, protrude many filopodia, and gradually form a network structure (Figure 11a). The narrow gap between scratches indicated the self-repair ability of cells, and the crawling distance and number of cells in the middle of the scratch represented the migration ability of cells. As shown in Figure 11c, the red dotted line represents the initial width of the scratch, and the yellow dotted line represents the width of the remaining scratch after repair. Compared with the control, AMCPs had a better ability to promote the migration of MC3T3-E1, but only A3M1CP induced rapid migration of HUVECs in the scratched part (Figure 11c and Figure S5). However, from the stacking of cells in the picture, AMCPs could promote the proliferation of HUVECs.
Figure 11.

Evaluation of angiogenesis capacity. (a) Confocal images of cell fluorescence staining treated for 24 h by material extraction medium (63× oil, the scale bar is 10 μm). (b) Cell proliferation at days 1, 3, and 5 cultured by material extraction medium. (c) Cell repair and migration within 2 days (10× , the scale bar is 100 μm); all the images were obtained at the same multiple sites. (d) Expression of genes associated with osteogenesis at 1 and 7 days (*: P < 0.05, **: P < 0.01, ***: P < 0.001, ****: P < 0.0001).
VEGF and bFGF are two key factors involved in angiogenesis, and bFGF can induce the migration, proliferation, and differentiation of endothelial cells and promote the expression of VEGF.44,45 VEGF is a highly specific vascular endothelial cell growth factor that increases cell migration, proliferation, and angiogenesis of HUVECs. The expression of VEGF and bFGF increased after 7 d, and A3M1CP was still higher than that of other groups, as shown in Figure 11d. A3M1CP promoted the expression of angiogenesis-related factors VEGF and bFGF distinctly advantageous over other groups, implying a positive promotion of angiogenesis. In brief, AMCPs promoted the rapid release of magnesium ion after hydrolysis and accelerated the regeneration process of blood vessels.
4. Discussion
4.1. The Characteristics, Microstructures, and Components of AMCPs
According to the XRD result, amorphous calcium–magnesium pyrophosphate was synthesized by the ultrasonic method. Kegel et al.20 reported the preparation and morphological differences of several pyrophosphate metal salts. They found trivalent metal ions tended to be amorphous and additional metal ions would change the morphology of products. We introduced divalent metal ions (Ca2+ and Mg2+) to synthesize the amorphous phosphate and found the reaction of simple calcium hydroxide with pyrophosphate could also form amorphous products. Gelli et al.46 found that increased Mg2+ content and pH value could both modify the crystal-phase transformation of AMCP. The presence of Mg2+ and alkaline solution may be the reason for stable AMCPs. FTIR results exhibited similar peaks, and peaks at 550 cm–1 were considered to be a prediction of calcium phosphate crystallization.47 It gradually split into two peaks as the CaP crystallized, where a single peak here confirmed a stable amorphous structure. Then, the morphology of products was observed by SEM and TEM. All the products had uniform morphology, and additional Mg2+ increased the degree of agglomeration. The Raman results also showed that the products were homogeneous. In addition, the as-prepared AMCPs remained amorphous even when sintered at 400 °C, indicating excellent biological activity as amorphous CaP has been reported to have better osteogenic activity.17,48 The identification of phosphate species using liquid-phase 31P NMR has been reported previously. Cade-Menun et al.49 summarized the chemical shifts of various inorganic and organic phosphates and pointed out that the chemical shift of pyrophosphate is −4 to −5 ppm, the chemical shift of orthophosphate is 5–7 ppm, and only these two inorganic phosphates may exist in the relevant shift range. 31P NMR tested the chemical shifts of potassium pyrophosphate and potassium orthophosphate respectively to be −6.67 and 7.08 ppm and predicted the products with different Ca/Mg molar ratios had similar phosphate skeletons, which were pyrophosphate-dominated aggregates with a small amount of orthophosphate. The small amount of phosphate may come from the hydrolysis of a small amount of pyrophosphate inside the product caused by the ultrasonic process of sample preparation.
To explore the possible reaction process, three comparison groups were set up. One group was CaCl2 instead of Ca(OH)2 with the final solution pH being more than 10 to investigate the influence of Ca2+, one group was CaCl2 instead of Ca(OH)2 without pH regulation to consider the effect of alkaline environment, and another group was pure MgCl2 without Ca2+ to study the role of Mg2+. All the samples were prepared at the molar ratio of Ca/Mg = 1–3, (Ca + Mg)/P = 1, and with the same process as the AMCPs. As shown in Figure S6a and Figure S6b, when other reaction conditions were consistent, CaCl2 resulted in amorphous products with smaller aggregates and lower degrees of cross-linking, its elements were evenly distributed, and the molar ratio of O/P was close to P2O74– as shown in Figure S6c; when the ambient pH was not adjusted (the reaction pH was neutral), the reaction product of CaCl2 was a mixture with few weak crystal peaks; when reacted with pure MgCl2, it was a large cross-linked block, and its XRD result was similar to neutral CaCl2. These comparative experiments indicated that a stable alkaline environment was a key condition for the reaction, and Mg2+ preferred to form crystal sediments in neutral solution. However, Ca(OH)2 provided a continuous alkaline condition to maintain the stable reaction process. In addition, poor solubility and alkaline environment made Ca2+ chelate with pyrophosphate ions mainly as a format of Ca–O,50 so products reacted from Ca(OH)2 achieved a greater concentration of O.
Medusa software51 was further used to predict the products of the entire reaction process. Since the database cannot fully reflect the complex reaction process, it can only refer to the tended products under corresponding conditions. By fixing the pyrophosphate concentration and adjusting the Mg2+ concentration and the environmental pH value, the generation trend diagram of magnesium pyrophosphate was obtained (Figure S7a), which was used to simulate the main existence form of the product after adding MgCl2 for 5 min. In a reaction range of pH 7–9, as the concentration of Mg2+ increased, the product existed from HP2O73– to MgP2O72–. During the actual reaction process, by monitoring the pH of the reaction process, it was found that after adding MgCl2, the pH of the solution system was stable at 8. Therefore, after adding Mg2+ of different concentrations, its main form was as the ions. Subsequently, the reaction product of calcium hydroxide alone reacted with pyrophosphate was calculated as shown in Figure S7b. After adding calcium hydroxide, due to the strong alkalinity of Ca(OH)2, the pH of the reaction system directly rose to 13–14. The combination product with Ca2+ was calculated through the software that the products were calcium hydroxide conjugates of pyrophosphate at higher Ca2+ concentration, which once again confirmed that Ca(OH)2 mainly participated in the reaction in the form of a compound. When calculating the presence of Ca2+ and Mg2+ at the same time in Figure S7c, the pH of the reaction system was tested to be mainly at 13.8. By fixing the concentration of pyrophosphate and the pH value of the reaction solution, the reaction products were calculated to exist as Ca(OH)P2O73– with some Ca(OH)2 solid, indicating that Ca2+ would precipitate preferentially. Meanwhile, the electronegativity of the product increased in an alkaline solution possibly due to the addition of Ca(OH)2, which was also consistent with the results of the Zeta potential.
After continuous monitoring of the types of phosphate ions in the solution in the reaction system, it was found in Figure S8a that after adding Mg2+ for 5 min, as the amount of additional Mg2+ increased, the peak position gradually shifted to a lower field. It was consistent with the metal complex theory and was due to the positively charged Mg2+. The ions reduce the electron density of the central phosphorus element. Since the reactions were all carried out at the same pyrophosphate ion concentration, the peak intensity can also be used to reflect the level of ion concentration. When the Mg2+ concentration increased, the pyrophosphate concentration in the solution decreased and then increased. Combined with the calculation results of Medusa, it can be predicted that when the Mg2+ concentration gradually increased, the product was mainly the ionic form of magnesium pyrophosphate, and the pyrophosphate ions in the solution were mostly complex, resulting in a decrease in the pyrophosphate concentration in the solution. As the Mg2+ concentration continued to increase, the product gradually crystallized out, releasing part of the pyrophosphate ions, and its pyrophosphate ion concentration gradually increased. The peak position only appeared at the negative displacement, indicating that pyrophosphate was not hydrolyzed to phosphate in a short period.
After adding a fixed amount of calcium hydroxide and reacting for 4 h, the concentration and the type of phosphate in the reaction solution were detected. The peak position of pyrophosphate shifted collectively to a higher field, and the shift amount of A2M2CP was smaller, ACP had a similar offset to A1M3CP (Figure S8b). At the same time, ACP had more pyrophosphate residues, which was about 1/4 of the original pyrophosphate concentration, indicating that only about three shares of Ca2+ were involved in the reaction. After gradually decreasing the concentration of Ca(OH)2, the residual pyrophosphate concentration in the solution gradually decreased and the pyrophosphate peak of A3M1CP disappeared, indicating that the pyrophosphate solution in this system participated in the reaction. However, the ion concentration detection in the reaction process in Figure S9 and the optical diagram of the reaction solution in Figure S11 show that the soluble magnesium pyrophosphate in the solution may account for 1–2 shares of the Mg2+ concentration (between 1 Mg and 2 Mg), as the reaction solution of 1 Mg to 2 Mg changed from clear to milky suspension. When gradually increasing the Mg2+ concentration, magnesium pyrophosphate mainly existed in the form of precipitation. This was also reflected in the addition amounts of 1 Mg and 2 Mg, which had little effect on the concentration of pyrophosphate ions, but at the reaction amount of 3 Mg, the unreacted pyrophosphate ions in the solution decreased sharply (Figure S9a). After the addition of Ca(OH)2, the concentration of Ca2+ in the solution gradually decreased over time, while the concentration of Mg2+ in the solution decreased significantly and remained basically stable, indicating that the addition of Ca(OH)2 promoted the precipitation of complexed magnesium pyrophosphate in the solution. When the reaction process reached 4 h, the ion concentration of the solution tended to be stable. A1M3CP and A2M2CP, A3M1CP, and AMP had similar Mg2+ concentrations in their solutions before adding Ca(OH)2. While more Ca(OH)2 was added to A1M3CP, the Mg2+ concentration in their solution was subsequently lower than that of A2M2CP, but in their solution, the Ca2+ concentrations were similar. The Mg2+ concentrations of A2M2CP, A3M1CP, and AMP were still similar, and the overall Mg2+ concentration decreased, indicating that the complexes in the solution would gradually form larger agglomerates with the precipitated products. In addition, pyrophosphate itself had a stronger complexing effect on Mg2+, and Ca(OH)2 as a reactant also had lower solubility. Therefore, in theory, Mg2+ was more likely to be in the form of complexes in the solution. In actual reactions, during the process, it was found that while the concentration of Ca2+ in the solution was decreasing, the concentration of Mg2+ in the solution was also decreasing, indicating that the product was produced in the form of coprecipitation, and the product was mainly calcium–magnesium pyrophosphate agglomerates. In addition, during the test process, there was a slight error in the results of NMR and ICP. This was mainly due to the difference between the two pieces of detection equipment. The NMR results showed rapid changes in pyrophosphate, mainly because NMR did not detect complexed pyrophosphate, but ICP detected the ion concentration of complexed pyrophosphate.
To verify the main functional structure of the reaction product clearly, XRD tests were conducted on the reaction products collected at different time points (Figure S10). The results were similar to the calculation results of Medusa. After adding MgCl2, Figure S10a and Figure S10f show that the product was mainly a variety of hydrate crystals of magnesium pyrophosphate and remained stable in the solution. When pure Ca(OH)2 participated in the reaction, the product gradually reacted from various hydrate crystals of calcium pyrophosphate to a uniform amorphous product. As the reaction time was prolonged, a small amount of calcium carbonate crystals appeared (Figure S10b), where we also found the stretch vibration of CO32– in FTIR. When Ca2+ and Mg2+ jointly participated in the reaction (Figure S10c–e), a small amount of calcium and magnesium pyrophosphate peaks appeared in the product and then gradually disappeared, indicating that the product gradually reacted to uniformity, especially in Figure S10e, where it is shown that completely amorphous products can be formed after 4 h of reaction. When the product collected after 4 h of reaction was dissolved in D2O, 31P NMR was tested after ultrasonic for 10 min. ACP, A1M3CP, A2M2CP, and A3M1CP detected pyrophosphate and phosphate at the same time, and pyrophosphate was 3–3.6 times phosphate. While in the entire reaction process there was no phosphate detected in the solution, and the XRD results of the products showed pyrophosphate skeletons, FTIR results predicted possible phosphate groups, so the product had excellent hydrolysis ability and the hydrolysis process may initially occur inside the particle. Through the 31P NMR test of the precipitated ions of AMP products in Figure S12, AMP all showed complete phosphate hydrolysis, so in the absence of Ca2+, magnesium pyrophosphate was gradually hydrolyzed into phosphate. While Ca(OH)2 was added, the interaction of Ca2+ and Mg2+ can coordinate the hydrolysis speed of each other and produce phosphate and pyrophosphate at the same time, which can achieve better biological effects. As a result, the prepared AMCPs all showed excellent hydrolysis ability, indicating excellent medical application prospects.
Actually, the similar Ca/P value of ACP and A1M3CP in Table S1 also indicated the maximum loading of Ca2+ was 75% and the priority replacement of Ca(OH)2. It is well-known that the bond length of Mg–O–P is smaller than that of Ca–O–P, Mg–O–P could be wrapped by Ca–O–P,52 and few unreacted metal ions can be adsorbed on the particle surface. While Mg2+ was increased and Ca(OH)2 decreased, more M–O–P bonds formed and facilitated the agglomeration of particles. When Ca/Mg = 1–3, refined particles accumulated to form a larger specific surface area and obtained more Mg2+ content indicating a better drug-carrying capacity and osteogenic activity. A3M1CP showed superior DOX adsorption and release ability at pH 7.4 and 4.5, which may be due to the high surface area and relatively weak electronegativity leading to a more suitable release rate. ACP had the worst drug release ability but had a similar DOX-loading ability and a longer DOX function duration compared to our previous study.19 This may be because AMCPs exchanged cations adsorbed on the surface with the positive DOX to achieve a better drug-carrying capacity. CaPP was reported to act as a trap for foreign ions to exchange with Ca2+ and incorporate inside the granules, and the random network structure enabled ion release into the solution and vice versa.53 AMCPs were confirmed to preserve the pyrophosphate skeleton, and this contributed to a long-term stable release of Ca2+ and Mg2+ and could continuously capture active ions from solution. Interestingly, Chen et al.54 found calcium phosphate and calcium pyrophosphate could form stable amorphous nanowires in an independent and tightly connected manner. The phosphate group interacted with the pyrophosphate group, which was indispensable, so the high stability of AMCP may have an important role in a small amount of the phosphate group, and this part of the mechanism may need to be further studied in the future.
4.2. Antibacterial Properties of AMCPs
In the application of implant materials, antibacterial property is a key indicator, which is related to the service cycle and repair effect of the material, and now it is mainly involved in drug antibacterials and metal ion antibacterials.55 AMCPs were aggregates of calcium and magnesium pyrophosphate hydration and had stable ion regulation ability of pyrophosphate. They had better antibacterial properties, and the ability of pyrophosphates to chelate cations was thought to be responsible for the bacteriostatic effect.56,57 AMCPs released more pyrophosphate that would dope the cations from the cell membrane and impose an electrostatic force on the cell structure to kill the bacteria directly,58 so AMCPs displayed better antibacterial behavior. Additionally, AMCPs could adjust alkaline environments; they released lots of OH– originally and high OH– in the outer cell membrane causing DNA damage, blocking respiratory proteins, and eventually causing bacterial death.59 AMCPs all released the pyrophosphate, so they behaved better with regard to antibacterial ability than HA. Interestingly, A1M3CP owned the best bacterial property as it only provided moderate ion release. The possible reason was that A1M3CP had lower potential, and while it released pyrophosphate to chelate metal ions on the membrane surface of bacteria, the product itself could also absorb metal cations. In addition, A1M3CP could adjust the solution environment to be alkane; as a result, the pH of the solution was larger than the bacteria isoelectric point and E. coli showed increased electronegativity,60,61 which increased the repulsion between the material and bacteria and decreased the adhesion of bacteria on the surface of the material.62 Though ACP, A2M2CP, and A3M1CP all provided similar properties, and A1M3CP released less pyrophosphate, the superior antibacterial ability was attributed to the combination function of lower surface potential and a more alkaline pH environment.
4.3. Osteogenic Activity of AMCPs
The stable ions regulation of Ca2+ and Mg2+ endowed AMCPs with potential osteogenic activity. A3M1CP had a daily Mg2+ release concentration of about 0.5–1 mM. The cell feeding time was generally 2–3 days, so the release concentration of Mg2+ in this extract was more than 1 mM, which had obvious cell activity.63 We did not find the inhibitory effect of pyrophosphate on osteogenic differentiation as the literature reported before, which may be because the calcium phosphate we prepared is a complex cyclic macromolecule that retains part of the pyrophosphate but does not cause inflammation. It is also possible that as described in eq 3,17 living cells can produce ATP, which promotes the hydrolysis of pyrophosphate, increasing the concentration of surrounding phosphate, thereby promoting mineralization.
| 3 |
A3M1CP regulated a higher concentration of Mg2+, so it exhibited the best contribution to cell proliferation and differentiation. Furthermore, it could adjust the surrounding alkaline microenvironment, which was considered to facilitate cell proliferation. Meanwhile, magnesium phosphate is more easily hydrolyzed, which promotes the production of more phosphate ions and also accelerates the differentiation of bone.
4.4. Potential Angiogenic Activity of AMCPs
Factually, rapid vascularization is a major challenge for critical-sized bone defects, and stable release of Mg2+ is thought to improve angiogenesis significantly.64 The ingrowth of blood vessels is crucial for the transport of oxygen and nutrients,65 which can prevent osteocyte necrosis from hypoxia and create a more suitable environment for bone repair. A3M1CP loaded Mg2+ of about 15 wt % and realized a dynamic load of Mg2+ in the physiological environment to prolong the action time.
5. Conclusion
Through ultrasonic agitation, amorphous calcium–magnesium pyrophosphate was successfully synthesized. The whole reaction process could be finished within 4 h, and the as-prepared products all behaved as stable amorphous under high temperatures. A3M1CP achieved higher Mg2+ concentration loading and negative potential that not only realized high absorption and effective release of drugs but also obtained the long-term release of Ca2+ and Mg2+. It also had an alkaline microenvironment regulation ability, which was beneficial to antibacterial activity and cell proliferation. A comprehensive comparison revealed that A3M1CP had better antibacterial activity than commercial HA. Moreover, the release of Ca2+ and Mg2+ continued to stimulate the proliferation and mineralization of osteoblasts. It could also contribute to the hydrolysis of pyrophosphate, and the increased phosphate further facilitated osteogenic differentiation. Additionally, the presence of Mg2+ accelerated the proliferation and migration of endothelial cells, suggesting a superior angiogenic ability. To sum up, A3M1CP possessed stable amorphous morphology and displayed excellent mineralization ability and conducted superior osteogenic and angiogenic activity; it also possessed antibacterial ability, so it could be a candidate material to apply in multiscene bone defect treatment. However, due to experimental design, this project did not involve in vivo studies. In our future work, A3M1CP will be used as bioactive substance, together with a polymer binder, to prepare a porous bone repair scaffold and explore its efficiency of bone healing and angiogenesis in vivo.
Acknowledgments
This work was supported by the National Natural Science Foundation of China (81871756), National Orthopedics and Sports Rehabilitation Clinical Medicine Research Center Innovation Fund (2021-NCRC-CXJJ-ZH-13), National Natural Science Foundation of China (51971062), the Science and Technology Project of Jiangsu Province (BE2019679), National Natural Science Foundation of China (52171236), and the Open Research Fund of Jiangsu Key Laboratory for Advanced Metallic Materials (MM2021A01).
Supporting Information Available
The Supporting Information is available free of charge at https://pubs.acs.org/doi/10.1021/acsomega.4c01660.
Element distribution and content and BET results of AMCPs; concentrations of Ca2+, Mg2+, and P ions in the extracts used for in vitro cell work; ALP activity; repair rate of HUVECs cultured by AMCP extraction medium; characteristics and morphology of comparative samples; Medusa calculation results; test of phosphate species by 31P NMR in the reaction system; change of ion concentration in solution during the reaction; XRD results of products; optical diagram of the reaction solution; 31P NMR results; elemental molar ratios of as-prepared AMCPs; mass percentage content and the molar ratio of Ca/P and (Ca+Mg)/P of the minerals induced by AMCPs in SBF; primer sequence used for RT-PCR (PDF)
The authors declare no competing financial interest.
Supplementary Material
References
- Dong Q.; Li Y.; Jiang H.; Zhou X.; Liu H.; Lu M.; Chu C.; Xue F.; Bai J. 3D-cubic interconnected porous Mg-based scaffolds for bone repair. J. Magnes. Alloy. 2021, 9 (4), 1329–1338. 10.1016/j.jma.2020.05.022. [DOI] [Google Scholar]
- Maleki-Ghaleh H.; Siadati M.H.; Fallah A.; Koc B.; Kavanlouei M.; Khademi-Azandehi P.; Moradpur-Tari E.; Omidi Y.; Barar J.; Beygi-Khosrowshahi Y.; Kumar A.P.; Adibkia K. Antibacterial and Cellular Behaviors of Novel Zinc-Doped Hydroxyapatite/Graphene Nanocomposite for Bone Tissue Engineering. Int. J. Mol. Sci. 2021, 22 (17), 9564. 10.3390/ijms22179564. [DOI] [PMC free article] [PubMed] [Google Scholar]
- Valletregi M. Calcium phosphates as substitution of bone tissues. Prog. Solid. State Ch. 2004, 32 (1–2), 1–31. 10.1016/j.progsolidstchem.2004.07.001. [DOI] [Google Scholar]
- Dorozhkin S. V. Bioceramics of calcium orthophosphates. Biomaterials 2010, 31 (7), 1465–1485. 10.1016/j.biomaterials.2009.11.050. [DOI] [PubMed] [Google Scholar]
- Kusumbe A. P.; Ramasamy S. K.; Adams R. H. Coupling of angiogenesis and osteogenesis by a specific vessel subtype in bone. Nature 2014, 507 (7492), 323–328. 10.1038/nature13145. [DOI] [PMC free article] [PubMed] [Google Scholar]
- Yue J.; Jin S.; Gu S.; Sun R.; Liang Q. High concentration magnesium inhibits extracellular matrix calcification and protects articular cartilage via Erk/autophagy pathway. J. Cell. Physiol. 2019, 234 (12), 23190–23201. 10.1002/jcp.28885. [DOI] [PubMed] [Google Scholar]
- Qi H.; Liu Y.; Wu L.; Ni S.; Sun J.; Xue J.; Liu Q.; Ni X.; Fan W. MicroRNA-16, via FGF2 Regulation of the ERK/MAPK Pathway, Is Involved in the Magnesium-Promoted Osteogenic Differentiation of Mesenchymal Stem Cells, Oxid. Med. Cell. Longev. 2020, 2020, 3894926. 10.1155/2020/3894926. [DOI] [PMC free article] [PubMed] [Google Scholar]
- Cacciotti I.; Bianco A.; Lombardi M.; Montanaro L. Mg-substituted hydroxyapatite nanopowders: Synthesis, thermal stability and sintering behaviour. J. Eur. Ceram. Soc. 2009, 29 (14), 2969–2978. 10.1016/j.jeurceramsoc.2009.04.038. [DOI] [Google Scholar]
- Landi E.; Logroscino G.; Proietti L.; Tampieri A.; Sandri M.; Sprio S. Biomimetic Mg-substituted hydroxyapatite: from synthesis to in vivo behaviour. J. Mater. Sci. Mater. Med. 2008, 19 (1), 239–247. 10.1007/s10856-006-0032-y. [DOI] [PubMed] [Google Scholar]
- Bairagi D.; Mandal S. A comprehensive review on biocompatible Mg-based alloys as temporary orthopaedic implants: Current status, challenges, and future prospects. J. Magnes. Alloy. 2022, 10 (3), 627–669. 10.1016/j.jma.2021.09.005. [DOI] [Google Scholar]
- Nabiyouni M.; Ren Y.; Bhaduri S. B. Magnesium substitution in the structure of orthopedic nanoparticles: A comparison between amorphous magnesium phosphates, calcium magnesium phosphates, and hydroxyapatites. Mater. Sci. Eng. C Mater. Biol. Appl. 2015, 52, 11–17. 10.1016/j.msec.2015.03.032. [DOI] [PubMed] [Google Scholar]
- Schmidtke H.-H. Stability constants of metal-ion complexes. Z. Phys. Chem., (N F) 1974, 88 (1–4), 220–221. 10.1524/zpch.1974.88.1-4.220a. [DOI] [Google Scholar]
- Moslehi N.; Bijlsma J.; de Bruijn W. J. C.; Velikov K. P.; Vincken J.-P.; Kegel W. K. Design and characterization of Ca-Fe(III) pyrophosphate salts with tunable pH-dependent solubility for dual-fortification of foods. J. Funct. Foods 2022, 92, 105066. 10.1016/j.jff.2022.105066. [DOI] [Google Scholar]
- McCarty D. J.; Kohn N. N.; Faires J. S. The Significance of Calcium Phosphate Crystals in the Synovial Fluid of Arthritic Patients: The ″Pseudogout Syndrome″. Ann. Int. Med. 1962, 56, 711–737. 10.7326/0003-4819-56-5-711. [DOI] [PubMed] [Google Scholar]
- Hessle L.; Johnson K. A.; Anderson H. C.; Narisawa S.; Sali A.; Goding J. W.; Terkeltaub R.; Millán J. L. Tissue-nonspecific alkaline phosphatase and plasma cell membrane glycoprotein-1 are central antagonistic regulators of bone mineralization. Proc. Natl. Acad. Sci. U.S.A. 2002, 99 (14), 9445–9449. 10.1073/pnas.142063399. [DOI] [PMC free article] [PubMed] [Google Scholar]
- LeGeros R. Z.; Mijares D.; Yao F.; Tannous S.; Catig G.; Xi Q.; Dias R.; LeGeros J. P. Synthetic Bone Mineral (SBM) for osteoporosis therapy: Part 1 - Prevention of bone loss from mineral deficiency. Key Eng. Mater. 2007, 361-363, 43–46. 10.4028/www.scientific.net/KEM.361-363.43. [DOI] [Google Scholar]
- Grover L. M.; Wright A. J.; Gbureck U.; Bolarinwa A.; Song J.; Liu Y.; Farrar D. F.; Howling G.; Rose J.; Barralet J. E. The effect of amorphous pyrophosphate on calcium phosphate cement resorption and bone generation. Biomaterials 2013, 34 (28), 6631–6637. 10.1016/j.biomaterials.2013.05.001. [DOI] [PubMed] [Google Scholar]
- Yang M.; Xue F.; Chu C.; Bai J.; Liu Q.; Ni X. Effect of different calcium-magnesium ratios on the properties of amorphous calcium pyrophosphate. Mater. Lett. 2023, 348, 134652. 10.1016/j.matlet.2023.134652. [DOI] [Google Scholar]
- Zhou H.; Yang M.; Hou S.; Deng L. Mesoporous hydroxyapatite nanoparticles hydrothermally synthesized in aqueous solution with hexametaphosphate and tea polyphenols. Mater. Sci. Eng. C Mater. Biol. Appl. 2017, 71, 439–445. 10.1016/j.msec.2016.10.040. [DOI] [PubMed] [Google Scholar]
- Leeuwen Y. M. v.; Velikov K. P.; Kegel W. K. Morphology of colloidal metal pyrophosphate salts. Rsc. Adv. 2012, 2 (6), 2534–2540. 10.1039/c2ra00449f. [DOI] [Google Scholar]
- Zhou H.; Yang M. M.; Zhang M. J.; Hou S. S.; Kong S. Q.; Yang L.; Deng L. H. Preparation of Chinese mystery snail shells derived hydroxyapatite with different morphology using condensed phosphate sources. Ceram. Int. 2016, 42 (15), 16671–16676. 10.1016/j.ceramint.2016.07.101. [DOI] [Google Scholar]
- Alsubhe E.; Anastasiou A. D.; Mehrabi M.; Raif E. M.; Hassanpour A.; Giannoudis P.; Jha A. Analysis of the osteogenic and mechanical characteristics of iron (Fe(2+)/Fe(3+))-doped β-calcium pyrophosphate, Mater. Sci. Eng. C Mater. Biol. Appl. 2020, 115, 111053. 10.1016/j.msec.2020.111053. [DOI] [PubMed] [Google Scholar]
- Gras P.; Rey C.; Marsan O.; Sarda S.; Combes C. Synthesis and Characterisation of Hydrated Calcium Pyrophosphate Phases of Biological Interest. Eur. J. Inorg. Chem. 2013, 2013 (34), 5886–5895. 10.1002/ejic.201300955. [DOI] [Google Scholar]
- Sauer G. R.; Wuthier R. E. Fourier transform infrared characterization of mineral phases formed during induction of mineralization by collagenase-released matrix vesicles in vitro. J. Biol. Chem. 1988, 263 (27), 13718–13724. 10.1016/S0021-9258(18)68300-0. [DOI] [PubMed] [Google Scholar]
- Zhou H.; Yang M.; Hou S.; Ni X.; Bi Y.; Wang W.; Govindan Kutty M.; Yang L. Tailoring the morphological features of hydrothermally synthesized mesoporous hydroxyapatite using polyphenols and phosphate sources. Ceram. Int. 2017, 43 (15), 12851–12856. 10.1016/j.ceramint.2017.06.176. [DOI] [Google Scholar]
- Baril M.; Assaaoudi H.; Butler I. S. Pressure-tuning Raman microspectroscopic study of cobalt(II), manganese(II), zinc(II) and magnesium(II) pyrophosphate dihydrates. J. Mol. Struct. 2005, 751, 168–171. 10.1016/j.molstruc.2005.05.009. [DOI] [Google Scholar]
- Gras P.; Baker A.; Combes C.; Rey C.; Sarda S.; Wright A. J.; Smith M. E.; Hanna J. V.; Gervais C.; Laurencin D.; Bonhomme C. From crystalline to amorphous calcium pyrophosphates: A solid state Nuclear Magnetic Resonance perspective. Acta Biomater. 2016, 31, 348–357. 10.1016/j.actbio.2015.10.016. [DOI] [PubMed] [Google Scholar]
- Soulié J.; Gras P.; Marsan O.; Laurencin D.; Rey C.; Combes C. Development of a new family of monolithic calcium (pyro)phosphate glasses by soft chemistry. Acta Biomater. 2016, 41, 320–327. 10.1016/j.actbio.2016.05.030. [DOI] [PubMed] [Google Scholar]
- Miao L.; Yan Z.; Wang X.; Zhong Y.; Yang J.; Xu D. A novel hierarchical structured calcium magnesium ammonium polyphosphate for high-performance slow-release fertilizer. React. Funct. Polym. 2022, 181, 105413. 10.1016/j.reactfunctpolym.2022.105413. [DOI] [Google Scholar]
- Tian T.; Blanco E.; Smoukov S. K.; Velev O. D.; Velikov K. P. Dissolution behaviour of ferric pyrophosphate and its mixtures with soluble pyrophosphates: Potential strategy for increasing iron bioavailability. Food Chem. 2016, 208, 97–102. 10.1016/j.foodchem.2016.03.078. [DOI] [PubMed] [Google Scholar]
- Jiang H.; Duan Y.; Li H.; Wang A. New insight into highly efficient removal of tetracycline by calcined hydroxyapatite activated peroxymonosulfate: The role of calcium carbonate and phosphate group. J. Water Process. Eng. 2023, 55, 104207. 10.1016/j.jwpe.2023.104207. [DOI] [Google Scholar]
- Tõnsuaadu K.; Gross K. A.; Plu̅duma L.; Veiderma M. A review on the thermal stability of calcium apatites. J. Therm. Anal. Calorim. 2012, 110 (2), 647–659. 10.1007/s10973-011-1877-y. [DOI] [Google Scholar]
- Li X.-G.; Lv Y.; Ma B.-G.; Wang W.-Q.; Jian S.-W. Decomposition kinetic characteristics of calcium carbonate containing organic acids by TGA. Arab. J. Chem. 2017, 10, S2534–S2538. 10.1016/j.arabjc.2013.09.026. [DOI] [Google Scholar]
- He K.; Sawczyk M.; Liu C.; Yuan Y.; Song B.; Deivanayagam R.; Nie A.; Hu X.; Dravid V. P.; Lu J.; Sukotjo C.; Lu Y. P.; Kral P.; Shokuhfar T.; Shahbazian-Yassar R. Revealing nanoscale mineralization pathways of hydroxyapatite using in situ liquid cell transmission electron microscopy. Sci. Adv. 2020, 6 (47), eaaz7524 10.1126/sciadv.aaz7524. [DOI] [PMC free article] [PubMed] [Google Scholar]
- Navrotsky A. Energetic clues to pathways to biomineralization: precursors, clusters, and nanoparticles. Proc. Natl. Acad. Sci. U. S. A. 2004, 101 (33), 12096–12101. 10.1073/pnas.0404778101. [DOI] [PMC free article] [PubMed] [Google Scholar]
- Bigi A.; Foresti E.; Gregorini R.; Ripamonti A.; Roveri N.; Shah J. S. The role of magnesium on the structure of biological apatites. Calcif Tissue Int. 1992, 50 (5), 439–444. 10.1007/BF00296775. [DOI] [PubMed] [Google Scholar]
- Rude R. K.; Gruber H. E.; Wei L. Y.; Frausto A.; Mills B. G. Magnesium deficiency: effect on bone and mineral metabolism in the mouse. Calcif. Tissue Int. 2003, 72 (1), 32–41. 10.1007/s00223-001-1091-1. [DOI] [PubMed] [Google Scholar]
- Mahato A.; De M.; Bhattacharjee P.; Kumar V.; Mukherjee P.; Singh G.; Kundu B.; Balla V. K.; Nandi S. K. Role of calcium phosphate and bioactive glass coating on in vivo bone healing of new Mg-Zn-Ca implant. J. Mater. Sci. Mater. Med. 2021, 32 (5), 55. 10.1007/s10856-021-06510-0. [DOI] [PMC free article] [PubMed] [Google Scholar]
- Yusa K.; Yamamoto O.; Takano H.; Fukuda M.; Iino M. Zinc-modified titanium surface enhances osteoblast differentiation of dental pulp stem cells in vitro. Sci. Rep. 2016, 6, 29462. 10.1038/srep29462. [DOI] [PMC free article] [PubMed] [Google Scholar]
- Chen B.; Lin Z.; Saiding Q.; Huang Y.; Sun Y.; Zhai X.; Ning Z.; Liang H.; Qiao W.; Yu B.; Yeung K. W. K.; Shen J. Enhancement of critical-sized bone defect regeneration by magnesium oxide-reinforced 3D scaffold with improved osteogenic and angiogenic properties. J. Mater. Sci. Technol. 2023, 135, 186–198. 10.1016/j.jmst.2022.06.036. [DOI] [Google Scholar]
- Ke D.; Tarafder S.; Vahabzadeh S.; Bose S. Effects of MgO, ZnO, SrO, and SiO2 in tricalcium phosphate scaffolds on in vitro gene expression and in vivo osteogenesis. Mater. Sc.i Eng. C Mater. Biol. Appl. 2019, 96, 10–19. 10.1016/j.msec.2018.10.073. [DOI] [PMC free article] [PubMed] [Google Scholar]
- Rittling S. R.; Matsumoto H. N.; McKee M. D.; Nanci A.; An X. R.; Novick K. E.; Kowalski A. J.; Noda M.; Denhardt D. T. Mice lacking osteopontin show normal development and bone structure but display altered osteoclast formation in vitro. J. Bone. Miner. Res. 1998, 13 (7), 1101–1111. 10.1359/jbmr.1998.13.7.1101. [DOI] [PubMed] [Google Scholar]
- Frank O.; Heim M.; Jakob M.; Barbero A.; Schäfer D.; Bendik I.; Dick W.; Heberer M.; Martin I. Real-time quantitative RT-PCR analysis of human bone marrow stromal cells during osteogenic differentiation in vitro. J. Cell. Biochem. 2002, 85 (4), 737–746. 10.1002/jcb.10174. [DOI] [PubMed] [Google Scholar]
- Mack C. A.; Patel S. R.; Schwarz E. A.; Zanzonico P.; Hahn R. T.; Ilercil A.; Devereux R. B.; Goldsmith S. J.; Christian T. F.; Sanborn T. A.; Kovesdi I.; Hackett N.; Isom O. W.; Crystal R. G.; Rosengart T. K. Biologic bypass with the use of adenovirus-mediated gene transfer of the complementary deoxyribonucleic acid for vascular endothelial growth factor 121 improves myocardial perfusion and function in the ischemic porcine heart. J. Thorac. Cardiovasc. Surg. 1998, 115 (1), 168–177. 10.1016/S0022-5223(98)70455-6. [DOI] [PMC free article] [PubMed] [Google Scholar]
- Folkman J.; Klagsbrun M. Angiogenic factors. Science 1987, 235 (4787), 442–447. 10.1126/science.2432664. [DOI] [PubMed] [Google Scholar]
- Gelli R.; Scudero M.; Gigli L.; Severi M.; Bonini M.; Ridi F.; Baglioni P. Effect of pH and Mg(2+) on Amorphous Magnesium-Calcium Phosphate (AMCP) stability. J. Colloid Interface Sci. 2018, 531, 681–692. 10.1016/j.jcis.2018.07.102. [DOI] [PubMed] [Google Scholar]
- Blumenthal N. C.; Posner A. S.; Holmes J. M. Effect of preparation conditions on the properties and transformation of amorphous calcium phosphate. Mater. Res. Bull. 1972, 7, 1181–1189. 10.1016/0025-5408(72)90097-9. [DOI] [Google Scholar]
- Muller W. E. G.; Ackermann M.; Al-Nawas B.; Righesso L. A. R.; Munoz-Espi R.; Tolba E.; Neufurth M.; Schroder H. C.; Wang X. Amplified morphogenetic and bone forming activity of amorphous versus crystalline calcium phosphate/polyphosphate. Acta Biomater. 2020, 118, 233–247. 10.1016/j.actbio.2020.10.023. [DOI] [PubMed] [Google Scholar]
- Cade-Menun B. J.; Preston C. M. A comparison of soil extraction procedures for 31P NMR spectroscopy. Soil Sci. 1996, 161 (11), 770–785. 10.1097/00010694-199611000-00006. [DOI] [Google Scholar]
- Guan X.-h.; Chen G.-h.; Shang C. Adsorption behavior of condensed phosphate on aluminum hydroxide. J. Environ. Sci. 2007, 19 (3), 312–318. 10.1016/S1001-0742(07)60051-5. [DOI] [PubMed] [Google Scholar]
- Puigdomenech I.MEDUSA: make equilibrium diagrams using sophisticated algorithms. Windows program, Stockholm, vers. 21; 2001.
- McCarthy W. J.; Smith D. M. A.; Adamowicz L.; Saint-Martin H.; Ortega-Blake I. An Ab Initio Study of the Isomerization of Mg– and Ca–Pyrophosphates. J. Am. Chem. Soc. 1998, 120 (24), 6113–6120. 10.1021/ja972715g. [DOI] [Google Scholar]
- Masala O.; McInnes E. J. L.; O’Brien P. Modelling the formation of granules: the influence of manganese ions on calcium pyrophosphate precipitates. Inorg. Chim. Acta 2002, 339, 366–372. 10.1016/S0020-1693(02)00936-2. [DOI] [Google Scholar]
- Feng C.; Lu B.-Q.; Fan Y.; Ni H.; Zhao Y.; Tan S.; Zhou Z.; Liu L.; Hachtel J. A.; Kepaptsoglou D.; Wu B.; Gebauer D.; He S.; Chen F. Amorphous 1-D nanowires of calcium phosphate/pyrophosphate: A demonstration of oriented self-growth of amorphous minerals. J. Colloid Interface Sci. 2024, 657, 960–970. 10.1016/j.jcis.2023.12.002. [DOI] [PubMed] [Google Scholar]
- Cai X.; Yang M.; Wang S.; Wang Z.; Zhou J.; Xue F. Experimental investigations on corrosion behavior and antibacterial property of nickel-aluminum bronze fabricated through wire-arc additive manufacturing (WAAM). Corros. Sci. 2023, 214, 111040. 10.1016/j.corsci.2023.111040. [DOI] [Google Scholar]
- Maier S. K.; Scherer S.; Loessner M. J. Long-chain polyphosphate causes cell lysis and inhibits Bacillus cereus septum formation, which is dependent on divalent cations. Appl. Environ. Microbiol. 1999, 65 (9), 3942–3949. 10.1128/AEM.65.9.3942-3949.1999. [DOI] [PMC free article] [PubMed] [Google Scholar]
- Jen C. M.; Shelef L. A. Factors affecting sensitivity of Staphylococcus aureus 196E to polyphosphates. Appl. Environ. Microbiol. 1986, 52 (4), 842–846. 10.1128/aem.52.4.842-846.1986. [DOI] [PMC free article] [PubMed] [Google Scholar]
- Velusamy N.; Sundarabharathi L.; Saminathan R. K. Microwave synthesis, characterization and antibacterial performance of dual mineralized nanohydroxyapatite for biomedical applications. Biocatal. Agric. Biotechnol. 2022, 40, 102303. 10.1016/j.bcab.2022.102303. [DOI] [Google Scholar]
- Dong C.; Cairney J.; Sun Q.; Maddan O. L.; He G.; Deng Y. Investigation of Mg(OH)2 nanoparticles as an antibacterial agent. J. Nanopart. Res. 2010, 12 (6), 2101–2109. 10.1007/s11051-009-9769-9. [DOI] [Google Scholar]
- Elmahdy A. M.; El-Mofty S. E.; Abdel-Khalek N. A.; El-Midany A. A. Impact of the adsorption of Corynebacterium diphtheriae intermedius bacteria on enhancing the separation selectivity of dolomite and apatite. Adsorp. Sci. Technol. 2011, 29 (1), 47–58. 10.1260/0263-6174.29.1.47. [DOI] [Google Scholar]
- Burel C.; Kala A.; Purevdorj-Gage L. Impact of pH on citric acid antimicrobial activity against Gram-negative bacteria. Lett. Appl. Microbiol. 2021, 72 (3), 332–340. 10.1111/lam.13420. [DOI] [PMC free article] [PubMed] [Google Scholar]
- Subramani A.; Hoek E. M. V. Direct observation of initial microbial deposition onto reverse osmosis and nanofiltration membranes. J. Membr. Sci. 2008, 319 (1), 111–125. 10.1016/j.memsci.2008.03.025. [DOI] [Google Scholar]
- Wang Y.; Geng Z.; Huang Y.; Jia Z.; Cui Z.; Li Z.; Wu S.; Liang Y.; Zhu S.; Yang X.; Lu W. W. Unraveling the osteogenesis of magnesium by the activity of osteoblasts in vitro. J. Mater. Chem. B 2018, 6 (41), 6615–6621. 10.1039/C8TB01746H. [DOI] [PubMed] [Google Scholar]
- Xu L.; Willumeit-Romer R.; Luthringer-Feyerabend B. J. C. Effect of magnesium-degradation products and hypoxia on the angiogenesis of human umbilical vein endothelial cells. Acta Biomater. 2019, 98, 269–283. 10.1016/j.actbio.2019.02.018. [DOI] [PubMed] [Google Scholar]
- Oberkersch R. E.; Santoro M. M. YAP/TAZ-TEAD link angiogenesis to nutrients. Nat. Metab. 2022, 4 (6), 645–646. 10.1038/s42255-022-00579-9. [DOI] [PubMed] [Google Scholar]
Associated Data
This section collects any data citations, data availability statements, or supplementary materials included in this article.