

Abstract
Objective.
Electrodes chronically implanted in the brain undergo complex changes over time that can lower the signal to noise ratio (SNR) of recorded signals and reduce the amount of energy delivered to the tissue during therapeutic stimulation, both of which are relevant for the development of robust, closed-loop control systems. Several factors have been identified that link changes in the electrode-tissue interface (ETI) to increased impedance and degraded performance in micro- and macro-electrodes. Previous studies have demonstrated that brief pulses applied every few days can restore SNR to near baseline levels during microelectrode recordings in rodents, a process referred to as electrical rejuvenation. However, electrical rejuvenation has not been tested in clinically relevant macroelectrode designs in large animal models, which could serve as preliminary data for translation of this technique. Here, several variations of this approach were tested to characterize parameters for optimization.
Approach.
Alternating-current (AC) and direct-current (DC) electrical rejuvenation methods were explored in three electrode types, chronically implanted in two adult male nonhuman primates (NHP) (Macaca mulatta), which included epidural electrocorticography (ECoG) electrodes and penetrating deep-brain stimulation (DBS) electrodes. Electrochemical impedance spectroscopy (EIS) was performed before and after each rejuvenation paradigm as a gold standard measure of impedance, as well as at subsequent intervals to longitudinally track the evolution of the ETI. Stochastic error modeling was performed to assess the standard deviation of the impedance data, and consistency with the Kramers-Kronig relations was assessed to evaluate the stationarity of EIS measurement.
Main results.
AC and DC rejuvenation were found to quickly reduce impedance and minimize the tissue component of the ETI on all three electrode types, with DC and low-frequency AC producing the largest impedance drops and reduction of the tissue component in Nyquist plots. The effects of a single rejuvenation session were found to last from several days to over 1 week, and all rejuvenation pulses induced no observable changes to the animals’ behavior.
Significance.
These results demonstrate the effectiveness of electrical rejuvenation for diminishing the impact of chronic ETI changes in nonhuman primates with clinically relevant macroelectrode designs.
I. INTRODUCTION
Invasive neural electrodes are an invaluable tool for research and medicine, enabling close interaction with electrical activity in the nervous system. However, the recording and stimulating characteristics of indwelling electrodes change over time as a result of biofouling and tissue changes associated with chronic foreign body response (FBR). Tissue damage incurred during electrode insertion contributes to initial inflammatory responses, transitioning to the formation of encapsulating scar tissue during the life of a chronic implant (Stensaas & Stensaas, 1978)(Biran et al., 2005). This tissue reaction is characterized in histology by the presence of microglia, macrophages, and reactive astrocytes that form a dense encapsulation layer around the foreign object. The development of the FBR is strongly correlated with increases in electrical impedance (Williams, 2001) and can interfere with an electrode’s recording capabilities and its SNR (Butson et al., 2006; Otto et al., 2006; Polikov et al., 2005). Increased impedance can also increase the stimulation thresholds necessary to elicit a desired response by reducing the penetration of energy into tissue (Dhillon et al., 2005),(Butson & McIntyre, 2005; Rossini et al., 2010).
One approach for assessing the ETI is to conduct in vivo measurements using electrochemical impedance spectroscopy (EIS), which applies sinusoidal waveforms of various frequencies (typically on the order of 10 Hz- 10 kHz) between the working and counter electrodes. (Williams et al., 2007)A Nyquist plot is often used to present and interpret EIS data, depicting the real and imaginary components of the complex impedance value (Z) of an electrode, with the real component (Z’) on the X-axis and the imaginary component (Z”) on the Y-axis, both measured in Ohms. The relationship between these two components can give useful indications about the electrochemical properties of a system being measured.
In chronically implanted electrodes, ETI alterations are often accompanied by the formation of a semicircular arc “tissue component” in Nyquist plots (Figure 1)(Williams et al., 2007). The presence of this “tissue component” is also often observed by increases in electrode impedance at a single frequency, most commonly at 1 kHz (Mercanzini et al., 2009). The signal-filtering properties of these ETI changes may be of particular concern in applications of closed-loop neuromodulation (Ansó et al., 2022), or in other scenarios where neural recordings are used as a control signal to determine when and how stimulation is delivered (Satzer et al., 2014; Sillay et al., 2019; Zhou et al., 2018). In such devices, day-to-day deviations in ETI characteristics could result in altered signal amplitudes and noise levels, requiring lengthy analysis and re-classification of brain-computer interface (BCI) paradigms to maintain performance (Pandarinath et al., 2017). It is therefore desirable to develop a means of mitigating chronic ETI changes to maintain robust and predictable recording characteristics in chronically implanted electrodes.
Figure 1-.

Nyquist plots comparing an ECoG electrode in saline (A) and the same electrode type after over a year of chronic implantation in a nonhuman primate (B). Note the semicircular arc “tissue component” visible at the high-frequency end of the spectrum, suggesting chronic biological effects on the behavior of the device.
Previous work in rodents has shown that typical biphasic stimulation of the type used to elicit motor responses can reliably reduce impedance values on chronically implanted microelectrodes (Torres-Martinez et al., 2019; Wang et al., 2013; Weiland & Anderson, 2000). These stimulation protocols, on the order of tens to hundreds of microamps, can produce impedance reductions up to 60% that generally recover within 1 day (Torres-Martinez et al., 2019). In nonhuman primates, this impedance-reducing effect has been observed in macroelectrodes following conventional biphasic charge-balanced stimulation pulses, including acute changes to the tissue component (Lempka et al., 2009) accompanying impedance reduction, as well as impedance reduction to a steady-state value during chronically applied stimulation (Chen et al., 2014). These results suggest that stimulation may be a promising tool for controlled impedance reduction in chronically implanted electrodes.
In addition to the above work observing the ETI effects of typical stimulation parameters, a few studies have explored a more targeted approach for reducing electrode impedance and returning ETI characteristics to a state resembling pre-implant properties. In contrast to the above studies, these studies by Johnson et al (2004), Johnson et al (2005), and Otto et al (2006) have used non-conventional short-duration monophasic electrical stimulation pulses (“electrical rejuvenation”) for reducing impedance levels and the tissue component in the EIS spectra of microelectrodes chronically implanted in rodents (Johnson et al., 2004, 2005; Otto et al., 2006). In these studies, impedance reduction was observed to last 24 hours or more from a single 4-second rejuvenation pulse. Single-frequency (1 kHz) and full-spectrum (100 Hz – 10 kHz) impedance measurements demonstrated a reliable drop in impedance magnitude after rejuvenation was applied. Single unit neural recordings were also recovered on some electrodes following rejuvenation, as well as general improvements in SNR. Consistent with reductions in the tissue component observed in EIS recordings, the impact of cellular components in a fitted circuit model was also reduced following rejuvenation. Previous work has also found that rejuvenation can be applied repeatedly after channels recover from initial rejuvenation (Wilks et al., 2012) as needed to maintain lower impedance levels. These observations suggest that electrical rejuvenation is a reliable, repeatable means of reducing the increased impedance levels associated with chronic ETI changes, providing better SNR for signal recording and greater charge delivery to tissue during stimulation.
Closed-loop applications of BCIs, especially making use of DBS electrodes, are becoming increasingly common in humans (Hosain et al., 2014; Parastarfeizabadi & Kouzani, 2017). However, there is currently little research into the use of targeted electrical rejuvenation methods in larger electrodes relevant to those used in clinical closed-loop DBS applications. Thus, there is a need to expand upon previous microelectrode rodent studies of rejuvenation by including larger mammals and clinically relevant macroelectrode form factors. In addition, prior electrical rejuvenation studies have only tested a narrow set of stimulation parameters, typically 4 seconds of direct-current (DC) stimulation at 1 volt. Thus, there is need to characterize a wider range of pulse types to explore which is most effective. Exploration of additional amplitudes, frequencies, and control methods may help to reveal parameters for optimization of this technique.
In this study, we explored, for the first time, the effects of electrical rejuvenation with several pulse parameters in three types of scaled-down, clinically relevant platinum-iridium macroelectrode form factors in two adult male rhesus-macaque nonhuman primates.
II. METHODS
This study examined the effects of electrical rejuvenation pulses on the impedance characteristics of 3 electrode types using two adult male nonhuman primates. Electrodes were scanned using electrochemical impedance spectroscopy before and after rejuvenation was applied, and at subsequent intervals to determine the duration of rejuvenation’s effect on impedance. EIS recordings were statistically analyzed to determine the significance of rejuvenation’s effect. An equivalent circuit model was also fitted to the data using process modeling to examine the impact of rejuvenation on effective tissue encapsulation thickness.
A. Animals
Two adult (14 and 15kg) male nonhuman primates (Macaca mulatta) were used in this study. Both were chronically implanted with penetrating deep-brain stimulation (DBS) electrodes that targeted the central thalamus, as well as epidural surface electrocorticography (ECoG) electrodes placed over prefrontal and premotor regions of the cortex. The ECoG array in NHP1 was implanted 4 years prior to rejuvenation, and the DBS electrodes were implanted 2 years prior to rejuvenation. NHP2 was implanted with a similar set of electrodes (DBS and ECoG), and rejuvenation was performed 1 year following implantation. The location of the DBS leads and ECoG arrays were confirmed using well-developed imaging and biophysical modeling techniques, as detailed in previous studies (Baker et al., 2016; Janson et al., 2021).
B. Instrumentation
The in vivo EIS recordings were performed using a Palmsens4 Potentiostat instrument (PalmSens BV, Netherlands) in 2-electrode mode, with the electrode contact acting as the working electrode and using either a titanium screw (61 mm2 surface area, NHP1) or titanium rod (approx. 12.5 mm2 exposed to dural surface, NHP2) as an implanted counter/reference electrode. Two PalmSens MUX-8 multiplexers were used to automate up to 16-channel recordings. Electrical rejuvenation was applied using an STG4004–3.2 mA stimulus generator (Multi Channel Systems MCS GmbH) with a compliance of 120 V. EIS was performed at least once for each channel prior to rejuvenation using multiplexer automation, with three replications performed on channels planned for rejuvenation to facilitate stochastic error modeling using the Measurement Model software developed by Watson and Orazem (Watson & Orazem, 2023)(10.1149/osf.io/kze9x). Post-rejuvenation EIS was also performed at least once on each channel, with three replications performed for all rejuvenated channels. All rejuvenations in a session were performed back-to-back, with a minimal time delay, between the automated pre- and post-rejuvenation EIS recordings. During recording and stimulation, animals were awake and head-fixed in a stationary behavioral chair located in a room isolated from the experimenters.
C. Rejuvenation
Direct-current (DC) and alternating current (AC) rejuvenation protocols were tested on four 12-channel platinum-iridium (10/90%) segmented DBS electrodes, each targeting the central thalamus (Heraeus Group, Hanau, Germany), as well as epidural single-row (8-ch) strip type ECoG electrodes (Fetz Spinal Cord 8, Cortec GmbH, Freiburg, Germany) and grid type (32-ch) ECoG electrodes (Micro 4 × 8 Square 45deg AirRay, CorTec GmbH, Freiburg, Germany), also of a platinum-iridium (90/10%) alloy (Figure 2). Rejuvenation pulses applied included a 1 V DC pulse for a duration of 4 seconds in order to replicate the protocols used in prior studies (Otto et al., 2006); we also used a 1 mA DC rejuvenation for 4 seconds to test the longevity of the induced changes to the EIS. Subsequently, under current-controlled stimulation, we used with DC and AC rejuvenation pulses of 0.1 mA and 1 mA in amplitude, each spanning a range of frequencies (1 Hz, 10 Hz, 100 Hz, 1 kHz, and 10 kHz). In-vivo electrical impedance spectroscopy was performed pre- and post- rejuvenation, measured between 10 Hz and 10 kHz (39 separate frequencies in total). As a control, these rejuvenation protocols were applied to test electrodes in vitro, where we observed a rapid recovery of electrode impedance characteristics (<4 hrs), indicating that any enduring effects observed in vivo across the impedance spectrum are likely not attributable to metallurgical damage.
Figure 2-.

The 3 electrode models used in this study. (A) Hereaus segmented deep brain stimulation electrode (Hereaus Group, Hanau, Germany), contact surface area 0.37 mm2. (B) CorTec Fetz Spinal cord ECoG (CorTec Neuro, Freiburg, Germany), contact surface area 0.28 mm2. (C) CorTec Micro Square ECoG (CorTec Neuro, Freiburg, Germany), 0.79 mm2 contact surface area.
NHP1 was used for the initial testing of both voltage-controlled and current-controlled rejuvenation protocols, where rejuvenation protocols were applied to individual channels of the DBS electrodes. Following a 1-week recovery period, an expanded set of rejuvenation methods was applied to the ECoG and DBS electrodes, under current-control, with an amplitude of 1 mA, each lasting 4 seconds. Rejuvenation pulses included DC and AC at 1 Hz, 10 Hz, 100 Hz, 1 kHz and 10 kHz. A second round of rejuvenations was performed on ECoG electrodes in NHP1 following a 1-week recovery interval from the first application.
Eleven of the 12 contact surfaces on the DBS electrodes for NHP2 were laser-roughened and had Amplicoat™ applied during the manufacturing process by Heraeus Medevio, which is a conductive polymer to improve charge injection capacity (Narayan et al., 2021). One control contact on each DBS lead consisted of bare platinum-iridium, and only these contacts were used for rejuvenation to maintain consistency and to avoid possible damage to the Amplicoat layer. These bare platinum electrodes were rejuvenated, with the adjacent two Amplicoat-coated channels within the respective ring acting as controls to observe effects on these channels. ECoG electrodes implanted in NHP2 contained grids of 32 channels each (Figure 2C), with exposed surface areas of 0.79 mm2. Rejuvenation was applied to a select grid of contacts within each array, with a maximal separation between rejuvenated channels to measure potential effects on neighboring contacts. A set number of channels were rejuvenated over the course of several days as denoted in Figure 3.
Figure 3-.

Rejuvenation timeline overview. (A) An illustration of the order of channel rejuvenations applied to NHP2’s ECoG array. Dark circles are available electrode contacts. White number labels depict the day on which rejuvenation was performed on that channel. (A) depicts the right-side array, with rejuvenations performed on day 1, day 2, day 9 and day 10. (B) depicts the left-side array, with rejuvenations performed on day 3 and day 8. Dark circles without a number label are unrejuvenated channels, used as a reference in statistical analysis. (C) An overview of the experiment timeline in both animals. No stimulation was applied apart from the rejuvenation protocols described.
D. Process model
Process models can be fitted to EIS data to estimate the response of physical phenomena within the system (Agarwal et al., 1992, 1995). Such models are useful for investigating possible mechanisms for the outcomes observed following electrical rejuvenation. To explore a potential mechanism for the impedance-lowering effects of our stimulation, we developed a process model (Figure 4) using the Measurement Model software by Watson and Orazem (Watson & Orazem, 2023). The electrode’s charge-transfer resistance was represented by the resistance RTA, and its distributed time-constant behavior by the constant phase element
| (1) |
where represents admittance, is phase angle, is the imaginary number and is a dimensionless parameter between 0 and 1. The R-C circuit containing and represents the resistive and capacitive components of the tissue encapsulation layer surrounding the working electrode, with representing the Ohmic resistance of the extracellular matrix and electrolyte fluid. This model can be represented as
| (2) |
Figure 4-.

Diagram of the process model used to fit select examples of the rejuvenation data. Re is an Ohmic impedance representing the bulk resistance of the extracellular fluid and matrix surrounding the electrode, while the Cfilm and Rfilm circuit elements represent the cellular components of the tissue encapsulation. ZCPE depicts the constant phase element behavior of double-layer capacitance on the electrode, while RTA denotes electrode charge transfer resistance.
To identify an appropriate process model for our data, a Voigt measurement model
| (3) |
was first employed (Agarwal et al., 1992), where corresponds to an ohmic resistance, is the element resistance, and is the time constant. This informed the removal of some high-frequency datapoints that demonstrated inconsistency with Kramers-Kronig relations, thus indicating the presence of instrument artifact.
Following selection of the model described in Equation 2, the process model was regressed to fit the data using a Levenberg-Marquardt algorithm (Roweis, 1996) weighted by parameters identified through stochastic error regression. This provided an estimate of physical parameters in our electrode-tissue interface and how they changed after the application of electrical rejuvenation (Table 2). Parameters were retained in the model only if the 95.4% confidence interval, based on the calculated standard deviation of the parameter estimate, did not include zero. Using the encapsulation layer capacitance estimated by the process model () along with an assumed brain tissue relative permittivity of 56.45(Schmid et al., 2003) and manufacturer-reported electrode surface area, an estimation of “effective layer thickness” could be calculated. Effective thickness was calculated using
| (4) |
where is the relative permittivity of brain tissue, is the permittivity of vacuum, A is the electrode surface area, and is the film capacitance calculated using the process model The effective layer thickness value is hypothesized to represent effective thickness of the tissue encapsulation layer surrounding the electrodes. Changes in effective layer thickness following rejuvenation may indicate temporary physical changes in the electrode encapsulation layer, allowing more charge to flow across it unimpeded. Note that this estimation is relative, and its precise value is sensitive to relative permittivity values used, for which a single-frequency value for brain tissue served as an approximation. An example of this modeling process for each animal is described in Results and shown in Figure 11.
Table 2-.
Regressed model parameters for the process model described in Figure 4, for the data shown in Figure 11. The change in parameters observed between pre- and post-rejuvenation samples reflects the reduction in tissue component and overall impedance magnitudes following rejuvenation.
| NHP 1 | ||
|---|---|---|
| Variable | Pre Rejuvenation | Post Rejuvenation |
| Re, Ω | 6970±280 | 4580±50 |
| Rta, Ω | 262000±1300 | 9220±270 |
| Rfilm, Ω | 209000±11000 | 59600±5100 |
| Cfilm, F | 2.16e-07±4.3e-09 | 1.35e-06±2.4e-08 |
| Q, F/s1–α | 1.50e-08±3.6e-10 | 2.16e-06±1.8e-07 |
| α | 0.77±0.0030 | 0.62±0.010 |
| χ2/ν | 26.2 | 1510 |
| NHP 2 | ||
| Variable | Pre Rejuvenation | Post Rejuvenation |
| Re, Ω | 3760±330 | 4950±76 |
| Rta, Ω | 246000±120000 | 302000±100000 |
| Rfilm, Ω | 3760±320 | 1920±160 |
| Cfilm, F | 2.37e-08±3.1e-09 | 1.84e-07±1.5e-08 |
| Q, F/s1–α | 5.66e-07±3.8e-08 | 1.34e-06±3.8e-08 |
| α | 0.71 (fixed) | 0.67 (fixed) |
| χ2/ν | 73600 | 6450 |
Figure 11-.
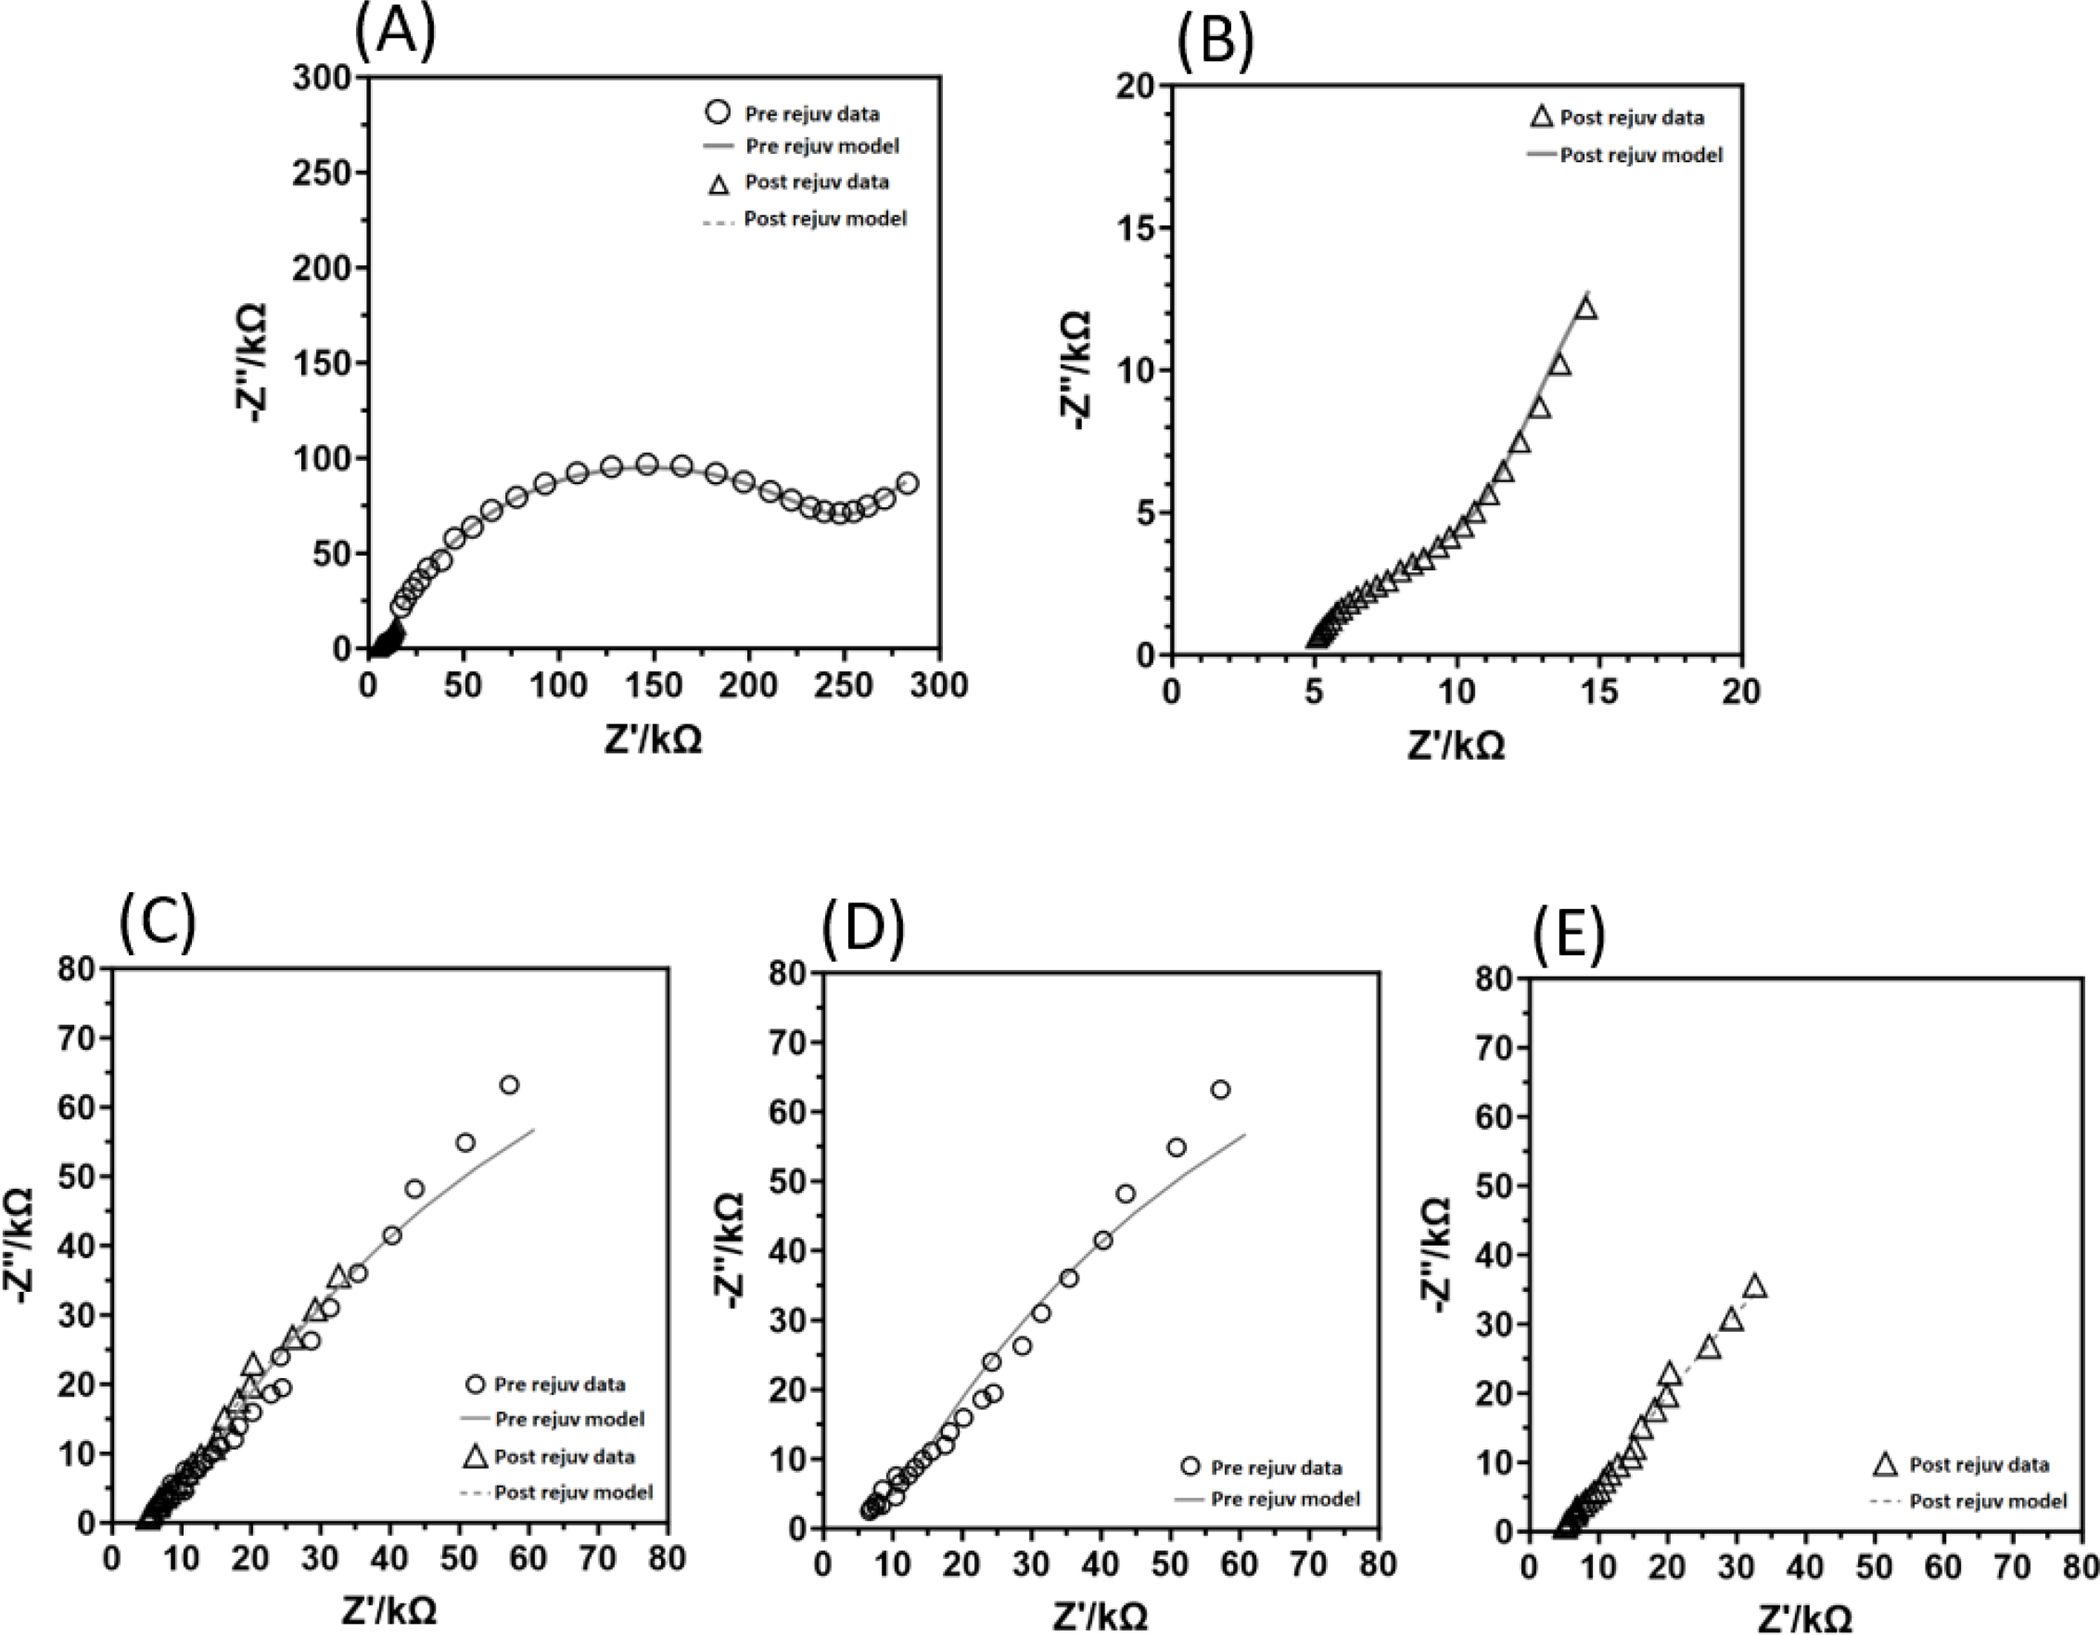
Data fitted to the process model described in figure 4. (A)- A summary plot containing the example data from NHP1’s ECoG electrode. Note the large, apparent tissue component in the pre-rejuvenation data. Trendlines depict the model fit, while symbols depict the measured datapoints. The small cluster of symbols from 0–25 kΩ is the post-rejuvenation data. (B)- An enlarged figure of the post-rejuvenation data and model fit for NHP1. (C)- Summary plot of the pre- and post-rejuvenation example data and fitted models for NHP2. (D)- An isolated plot of the pre-rejuvenation data and model fit for NHP2. (E)- Isolated plot of the post-rejuvenation data and model fit for NHP2.
E. Statistical analysis
Statistical analysis was performed on a combined dataset using data from NHP1 and NHP2, including all rejuvenated channel data and a selection of data from unrejuvenated channels. Two linear models were used to compare rejuvenation protocols (DC, 1 Hz, 10 Hz, 100 Hz, 1 kHz, and 10 kHz) and stimulation amplitudes (0.1 mA and 1 mA) with effects observed for electrode type (DBS and ECoG) and measurement frequency (39 frequencies from 10 Hz to 10 kHz). Analysis of the effects of rejuvenation protocol included a selection of control (unrejuvenated) channels that were chosen as a statistical reference. For analysis of stimulation amplitude, the unrejuvenated channels were again used as a reference (amplitude of 0 mA). Frequency data were scaled prior to model regression. Alpha was defined as a p value of less than 0.05. Statistical analysis was performed using R (https://www.r-project.org/).
F. Animal ethics statement
The methods reported follow the ARRIVE guidelines (https://arriveguidelines.org/). All work was performed in strict accordance with the National Institutes of Health Guidelines for Use of Animals in research and under an approved protocol from the Weill Cornell Medical College Institutional Animal Care and Use Committee (IACUC). Animals were cared for by the Research Animal Resource Center (RARC) at Weill Cornell Medicine.
III. RESULTS
Electrical rejuvenation was found to decrease impedance magnitude and tissue component throughout the EIS spectra in each electrode type, for all rejuvenation protocols. Low frequency (1 Hz and 10 Hz) AC pulses were the most consistently effective for lowering impedance values. The duration of rejuvenation effects on impedance was found to last from several days to one week. Data fitted to our equivalent circuit model showed a reduced effective encapsulation layer thickness following rejuvenation.
A. NHP1
Initially, an identical protocol to those previously applied was tested (voltage-controlled rejuvenation at 1.5V DC, 4 seconds) (Otto et al., 2006, Johnson et al., 2004) using the DBS macroelectrode implanted in NHP1 rather than a rodent microelectrode (Figure 5). As expected, this achieved both the desired reduction in tissue component capacitance and an overall reduction in impedance magnitude across the frequency spectrum. Following these initial results, additional rejuvenations were conducted using both DC and AC pulses in NHP1.
Figure 5-.

An example of initial rejuvenation testing performed in a single channel of NHP1’s ECoG electrode with similar parameters to those used in rodent rejuvenation studies. A 1.5V DC stimulation pulse was applied for 4 seconds. Note the visible “tissue component” present in the pre-rejuvenation data (depicted with circular markers). Following rejuvenation, the impedance spectra assume a more linear shape, with lower real and imaginary impedance values across the frequency spectrum (represented with triangular markers).
All subsequent rejuvenation protocols for NHP1 were applied for four seconds under current-control using an amplitude of 1 mA (Figure 6). In both the Heraeus DBS electrode and CorTec strip-type ECoG electrode implanted in NHP1, the lowest tested AC rejuvenation pulse frequencies (1 Hz and 10 Hz) were found to be most effective at reducing the measured impedance. In order to establish the effectiveness of the rejuvenation protocols over time, EIS data were recorded periodically for several days following the initial rejuvenation pulse (Figure 7).
Figure 6-.
Summary of rejuvenation results for NHP1, showing the percent change in impedance observed with each rejuvenation protocol. Data for all channels rejuvenated with each protocol are shown at 3 measurement frequencies. Note that frequencies depicted for rejuvenation protocols (X axis) are frequencies of stimulation, while frequencies of measurement are frequencies at which the electrode impedance was characterized (High-Frequency = 1 kHz, Middle-Frequency = 112 Hz, and Low-Frequency = 10 Hz). Percent change values reflect the change in impedance observed immediately post-rejuvenation. Trendlines depict mean values within each category. Results for NHP1’s ECoG electrode are shown in (A). Note that low-frequency AC rejuvenation resulted in the largest percent change in measured impedance. (B) depicts NHP1’s DBS electrode results. Low-frequency AC rejuvenation was most effective in this electrode as well, with the highest rejuvenation frequency (10 kHz) failing to reduce measured impedance for some datapoints.
Figure 7-.

An example Nyquist plot of a rejuvenated ECoG electrode channel from NHP1 measured at timepoints over the course of 7 days following rejuvenation. This ECoG channel was rejuvenated at 1 mA, 10 kHz for 4 seconds. Note the clear presence of a semicircular arc “tissue component” in the pre-rejuvenation measurement, which is visibly reduced in the post-rejuvenation spectra, along with a reduction in impedance values across the frequency spectrum. Overall impedance values increase the 7-day interval, with the “tissue component” visibly returning to a similar magnitude to pre-rejuvenation measurements by day 7.
While previous experiments with voltage-controlled DC rejuvenation demonstrated an effect duration of around 24 hours (Otto et al., 2006, Johnson et al., 2004), we found that nearly all of our current-controlled AC rejuvenation protocols resulted in lasting changes, up to 7 days before the EIS values returned to pre-rejuvenation levels. In general, these changes manifested as an initial reduction in the appearance of capacitive “tissue component” effects in the EIS spectra, with the characteristic semicircular arc returning to EIS spectra with increasing size in subsequent measurements and returning to impedance magnitudes similar to its pre-rejuvenation state within the 1 week measured.
B. NHP2
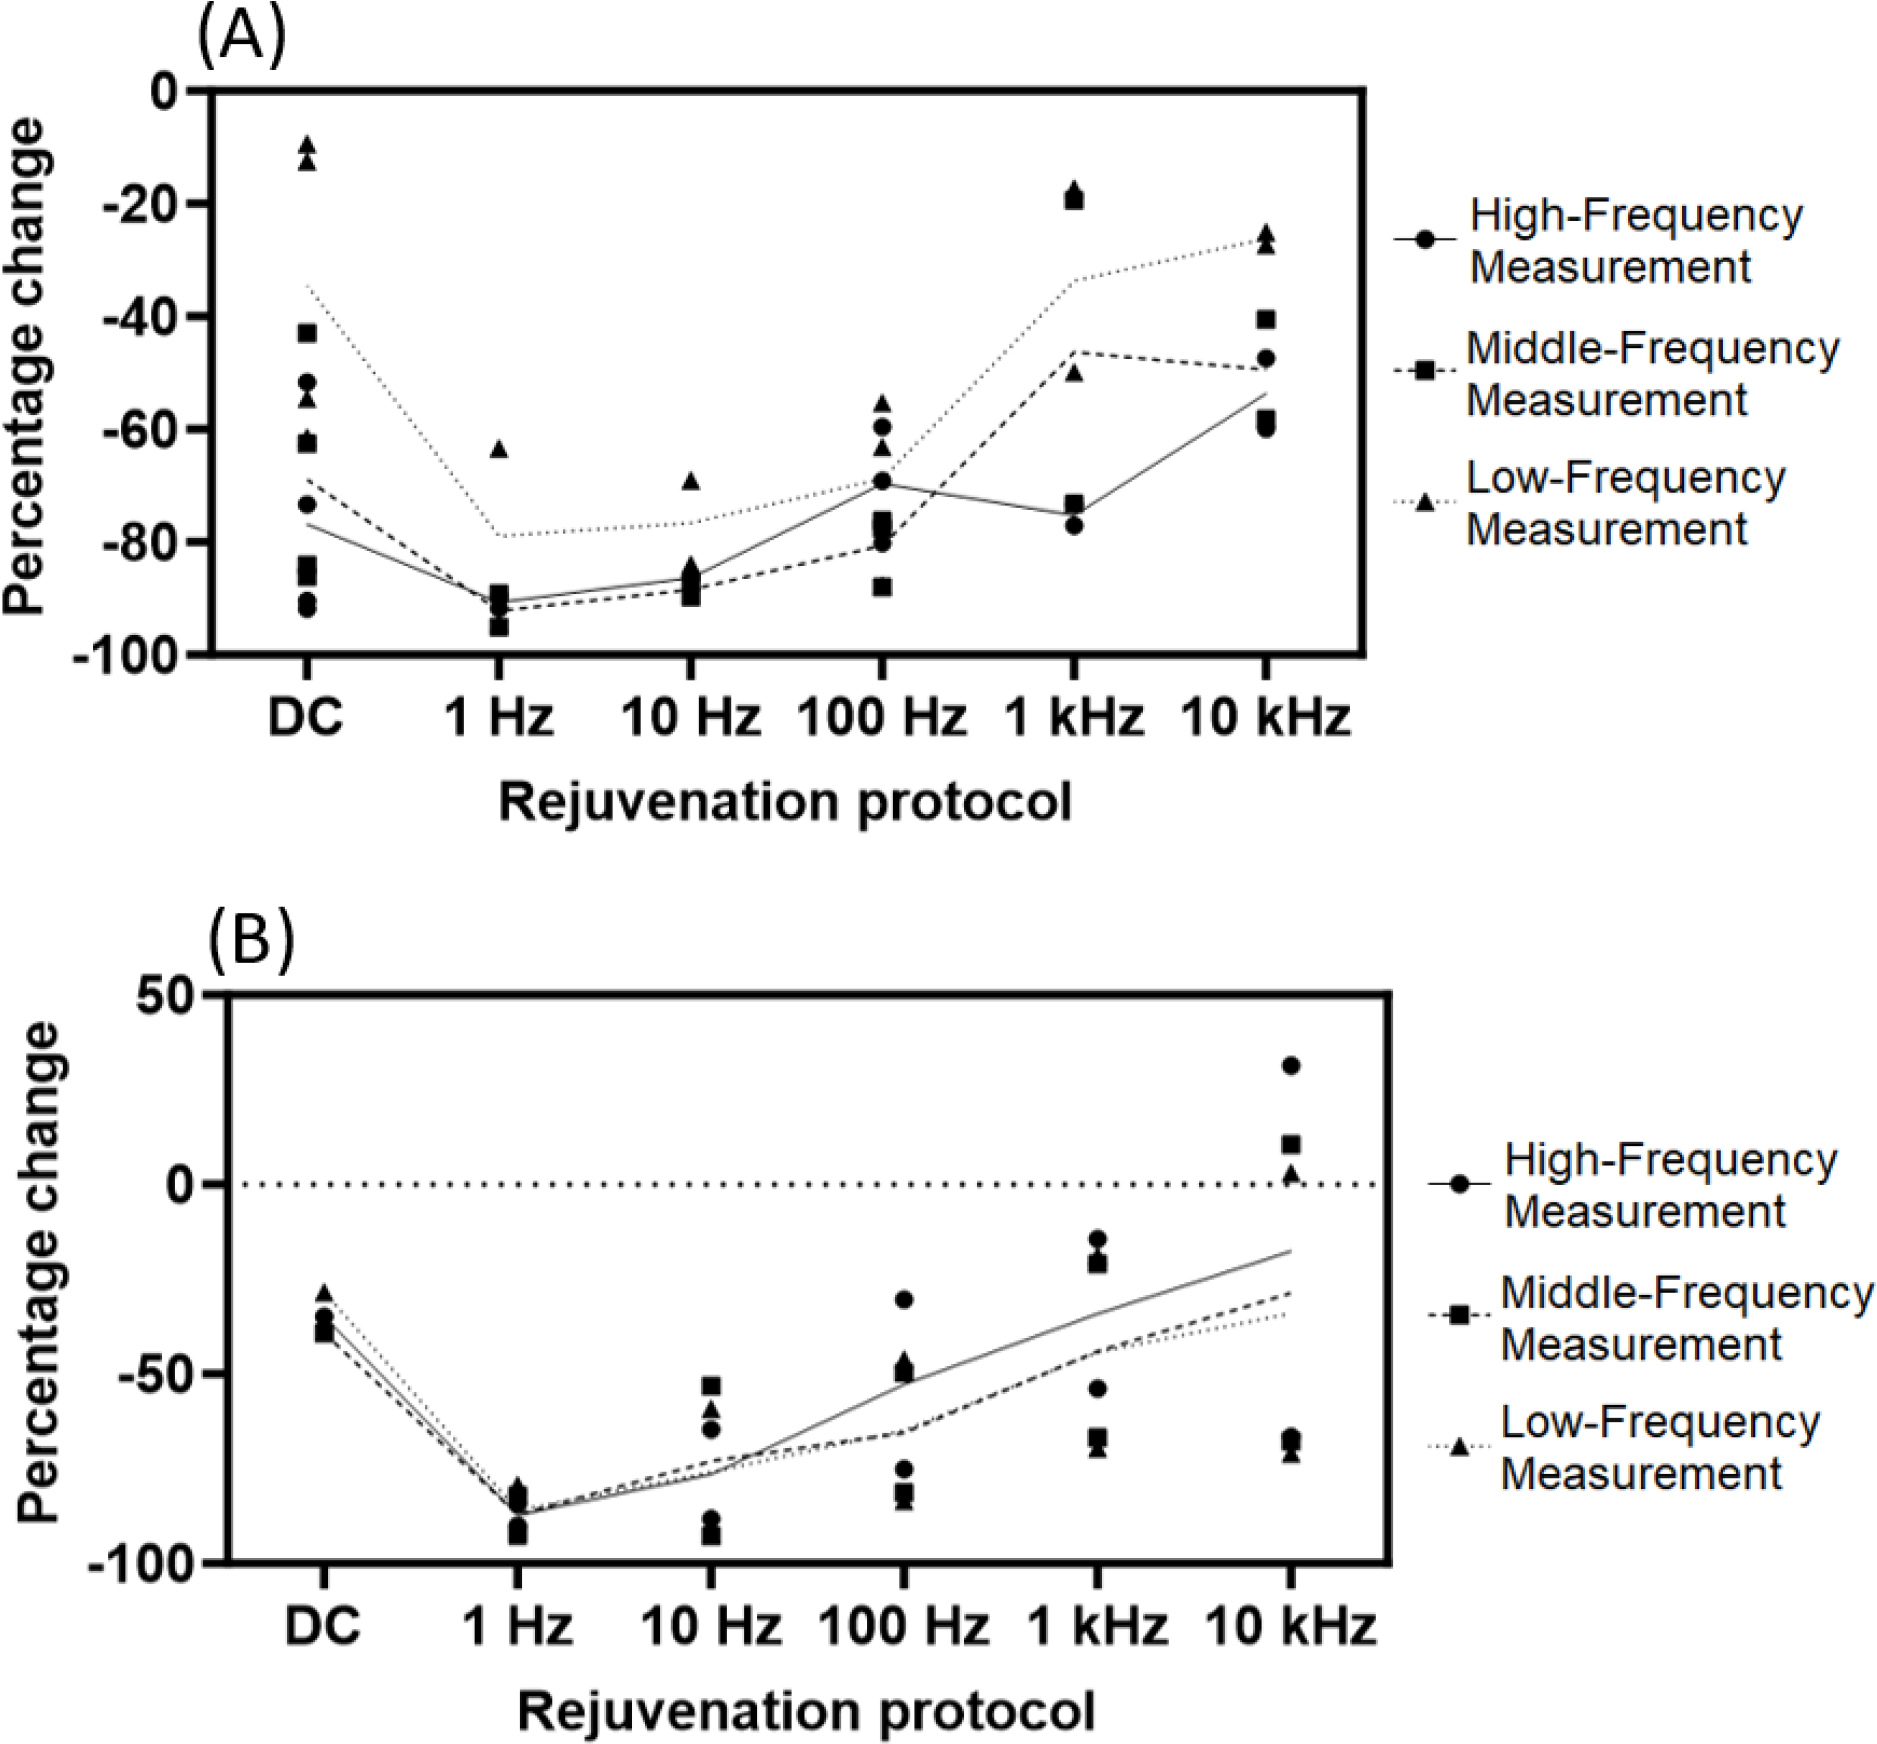
The expanded number of ECoG channels in NHP2 (64 in total) allowed us to conduct a more systematic test of the rejuvenation protocols used in NHP1. A subset of channels (Figure 3) were used to test both DC and AC rejuvenations with the same frequencies used in NHP1, but here we tested amplitudes of 1 mA and 0.1 mA. For the 0.1 mA rejuvenations, 1 Hz stimulation resulted in the greatest impedance reduction amongst AC pulses (Figure 8), with higher frequencies generally having a smaller effect on impedance. DC rejuvenation at 0.1 mA was similarly effective to 1 Hz. At 1 mA, AC rejuvenation resulted in the greatest impedance reductions at 1 Hz and 100 Hz, with impedance values decreasing less for 10 Hz, 1 kHz and 10 kHz rejuvenations. DC rejuvenation was the most effective at reducing impedance for 1mA amplitude.
Figure 8-.

Summary of rejuvenation results for NHP2, showing the percent change in impedance observed with each rejuvenation protocol. Data for all channels rejuvenated with each protocol are shown at 3 measurement frequencies. Note that frequencies depicted for rejuvenation protocols (X axis) are frequencies of stimulation, while frequencies of measurement are frequencies at which the electrode impedance was characterized (High-Frequency = 1 kHz, Middle-Frequency = 112 Hz, and Low-Frequency = 10 Hz). Percent change values reflect the change in impedance observed immediately post-rejuvenation. Trendlines depict mean values within each category. All data shown for NHP2 were measured using the ECoG grid electrode, with data shown in (A) rejuvenated at 0.1 mA and data in (B) rejuvenated at 1 mA. DC rejuvenation was more effective in NHP2. AC rejuvenation also displayed a trend similar to that observed in NHP1, with low-frequency protocols inducing a greater percent change in measured impedance than those at higher frequency.
The effect duration of rejuvenation on the ECoG arrays in NHP2 was long-lasting for DC and 1 Hz rejuvenations at 1 mA, resulting in a marked reduction in the impedance values, lasting up to 9 days before returning to pre-rejuvenation levels (Figure 9). Less effective rejuvenations had effects lasting 2–5 days at 1 mA. The most effective rejuvenations performed at 0.1 mA were found to be long-lasting as well, with DC and 1 Hz rejuvenations resulting in lowered impedance measurements that lasted over 9 days and, interestingly, did not return to pre-rejuvenation values during the measurement interval, despite being rejuvenated at only 1/10th the amplitude used in NHP1. Channels with less effective rejuvenations at 0.1 mA returned to or exceeded initial pre-rejuvenation impedance values within 2 days.
Figure 9-.

Single-frequency impedance measurements recorded in a selection of NHP2’s ECoG electrode channels, showing the changes in post-rejuvenation impedance over the course of 9–11 days. Impedance change is depicted as a difference between the pre-rejuvenation value measured at 1 kHz and each subsequent value. The top plot shows data from the right-side ECoG array, rejuvenated at 1 mA. Note the convergence of measured impedance values around the baseline value of 0 on day 10. Channels depicted with open symbols we re un-rejuvenated controls. Rejuvenated channels from the left ECoG array, rejuvenated at 0.1 mA (lower plot) did not exhibit a convergence to the original baseline values within the measured time interval.
While the available bare platinum DBS channels in NHP2 allowed for only 2 rejuvenations in those electrodes (1 mA, 1 Hz AC for 4 seconds), results were consistent with those observed in NHP1. Notably, the initial impedance reduction observed in the rejuvenated channels, on the order of 10–20 kOhms (measured at 1 kHz and 112 Hz), and up to 50 kOhms (measured at 10 Hz), was correlated with a reduction in impedance for the adjacent unrejuvenated channels (on the order of 5–10 kOhms measured at 1 kHz). This is likely due to the immediate adjacency of the three segmented contacts, all within one ring of the DBS leads. The rejuvenated channel’s impedance remained below its pre-rejuvenation value for 4–7 days on rejuvenated channels, with this effect lasting 1–2 days on adjacent (non-rejuvenated) channels (Figure 10). Note the initial drop in impedance observed on the un-rejuvenated channels within each segmented ring, indicating an effect on impedance of the neighboring electrodes. This may be due to close proximity of segments within the DBS ring (0.11 mm). Although speculative, the rejuvenation could also have impacted the integrity of the Amplicoat on the adjacent contacts.
Figure 10-.

Single-frequency impedance measurements recorded for NHP2’s DBS electrodes, including the rejuvenated channels (dark markers) and adjacent unrejuvenated channels within each segmented ring (open markers), showing the changes in post-rejuvenation impedance over 11days. Impedance change is depicted as a difference between the pre-rejuvenation value measured at 1 kHz and each subsequent value. Note that both DBS leads showed lowered impedance lasting approximately 4 days, followed by a return to impedance values exceeding the original measurement.
C. Statistical Analysis
Data were analyzed using a linear statistical model (Table 1). Rejuvenation efficacy was assessed as percent change pre-rejuvenation to post-rejuvenation. Impedance data from all measured frequencies and on all rejuvenated channels in both animals were included in the analysis, scaled to frequencies. A sample set of unrejuvenated channels from all electrode types was used as reference. For simplicity, both models of epidural ECoG electrode were considered as the category “ECoG”, and a comparison was made between ECoG and DBS rejuvenations, with ECoG electrodes showing a significantly different rejuvenation effect from DBS electrodes (p < 0.001). Across both electrode types, the effect size of the rejuvenations performed at 1 Hz, 10 Hz, and 100 Hz as well as DC was significant when compared to the unrejuvenated channels (p < 0.001); DC rejuvenation showing the greatest estimated mean percent change in impedance value (−41.2%). closely followed by 1 Hz AC (−39.4%). The effect of rejuvenation performed at 1 kHz was significant (p < 0.001), but with a notably lower estimated mean percent change in impedance value (−7.71%). Rejuvenation performed at 10 kHz was not found to have a significant effect on mean percent impedance change (p = 0.523). Considering stimulation amplitude, both 0.1 mA and 1 mA stimulation produced significant results as compared to unrejuvenated channels (0.1 mA p = 6.65e-7, 1 mA p < 0.001).
Table 1-.
Summary of statistical analysis of the rejuvenation data. Two linear models were run to examine the effects of stimulation protocol (A) and amplitude (B) with electrode type and measurement frequency as interaction variables. Most rejuvenation protocols were found to be significant, with the exception of 10 kHz. Stimulation amplitude, electrode type and measurement frequency also had significant effects.
| (A) | |||||||
|---|---|---|---|---|---|---|---|
| Variable | Estimate | Standard Error | t value | p value | Significance | 2.5% Conf. Interval | 9.5% Conf. Interval |
| Intercept | −23.28 | 1.10 | −21.19 | < 0.001 | *** | −25.43 | −21.12 |
| DC | −41.20 | 1.52 | −27.13 | < 0.001 | *** | −44.18 | −38.22 |
| 1 Hz | −39.74 | 1.32 | −30.21 | < 0.001 | *** | −42.32 | −37.16 |
| 10 Hz | −24.06 | 1.39 | −17.25 | < 0.001 | *** | −26.80 | −21.33 |
| 100 Hz | −22.12 | 1.35 | −16.42 | < 0.001 | *** | −24.76 | −19.48 |
| 1 kHz | −7.71 | 1.39 | −5.53 | < 0.001 | *** | −10.45 | −4.98 |
| 10 kHz | −1.03 | 1.60 | −0.64 | 0.523 | −4.17 | 2.12 | |
| Electrode type: ECoG | 14.65 | 1.01 | 14.44 | < 0.001 | *** | 12.66 | 16.64 |
| Measurement Frequency | 7.83 | 0.41 | 19.18 | < 0.001 | *** | 7.03 | 8.63 |
| (B) | |||||||
| Variable | Estimate | Standard Error | t value | p value | Significance | 2.5% Conf. Interval | 9.5% Conf. Interval |
| Intercept | −16.12 | 1.16 | −13.91 | < 0.001 | *** | −18.39 | −13.84 |
| 0.1 mA | −5.74 | 1.15 | −4.98 | < 0.001 | *** | −8.01 | −3.48 |
| 1 mA | −33.76 | 0.98 | −34.33 | < 0.001 | *** | −35.69 | −31.83 |
| Electrode type: ECoG | 5.94 | 1.09 | 5.44 | < 0.001 | *** | 3.80 | 8.08 |
| Measurement Frequency | 7.83 | 0.42 | 18.70 | < 0.001 | *** | 7.01 | 8.65 |
D. Process Model
A process model was fitted to an example dataset for each animal ECoG electrodes. A 1 Hz, 1 mA AC rejuvenation from NHP1 and a 1 mA DC rejuvenation from NHP2 were modeled (Table 2, Figure 11), using repeated measures to create a stochastic error structure which weighted the model regression. Note that alpha values for NHP2 were fixed in order to achieve a satisfactory fit. A Voigt measurement model was fitted to the real component of each dataset to identify frequencies which were inconsistent with Kramers-Kronig relations, indicating the presence of instrument artifact (Orazem, 2004; Orazem & Tribollet, 2008). These frequencies were excluded from the process model analysis, in this case 13 frequencies at the high-frequency end of the spectrum (above 5 kHz). Once a fit was obtained, process model parameters were used to estimate the effective thickness of the modeled tissue encapsulation layer surrounding each electrode. For the model created with data from NHP1, effective encapsulation thickness was estimated be 82.36 micrometers pre-rejuvenation and 13 micrometers post-rejuvenation. For the model fitted using data from NHP2, pre-rejuvenation effective encapsulation was estimated at 266.49 micrometers thick, while post-rejuvenation effective layer thickness was estimated as 34.32 micrometers. These results indicate an approximate 80% reduction in effective encapsulation thickness for both NHPs.
IV. DISCUSSION
Our results demonstrated that rejuvenation can be an effective, repeatable means of reducing impedance levels in chronically implanted macroelectrodes of clinically relevant form factors. Such impedance reductions could serve as a reliable method for improving the recording capabilities and charge delivery of clinical implants. The process model fitted to our data showed a reduction in effective encapsulation layer thickness, indicating a possible mechanism of action for rejuvenation. Though our study was limited by not evaluating the quality of recordings post-rejuvenation or conducting histological analysis, it demonstrates promising results for the use of rejuvenation in future applications of macroelectrodes, particularly in closed-loop systems.
A. Rejuvenation protocols
The results presented here demonstrate the efficacy of electrical rejuvenation for reducing the impact of chronic ETI changes on the behavior of implanted macroelectrodes within a large animal model. Consistent with previous work conducted using microelectrodes in rodents (Johnson et al., 2004, 2005; Otto et al., 2006), we observed an immediate decrease in the EIS in response to rejuvenation, across the measured impedance spectrum. In EIS with a clearly visible “tissue component” prior to rejuvenation, this component was consistently reduced immediately following rejuvenation. Of the rejuvenation protocols tested, only the 10 kHz condition failed to produce a statistically significant effect (Table 1). The consistency of the results across the two animals indicates that low-frequency AC rejuvenation is potentially optimal for achieving an enduring impedance reduction. Importantly, this type of sinusoidal rejuvenation has the advantage of greater charge-balance than DC rejuvenation, with charge-balanced stimulation considered safer for use in biological tissue (Merrill et al., 2005).
While not tested in this dataset, previous rejuvenation studies using microelectrodes in rodents (Otto et al., 2006) demonstrated improvements in signal-to-noise ratio (SNR) in the isolation of spiking activity in neural recordings for over 80% of rejuvenated electrodes, following similar reductions in impedance post-rejuvenation. A reliable means of reducing electrode impedance to a predictable level may also be a valuable tool for closed-loop neuromodulation using macroelectrodes (Ansó et al., 2022), automatic drug administration or other applications where specific biological recordings are as a control signal, in which changes in signal threshold may alter device behavior and interfere with consistent application of therapies (Satzer et al., 2014; Sillay et al., 2019; Zhou et al., 2018). One limitation of this study is that we did not explore the immediate effects of rejuvenation on the recording and stimulation capabilities of the implanted macroelectrodes. Instead, our goal was to test the electrochemcial impedance effects of rejuvenation in chronically implanted macroelectrodes. Importantly, chronic impedance changes can affect an electrode’s recording characteristics and limit electrical current delivery to tissue, potentially affecting the outcome of stimulation therapies and electrophysiological recordings (Gardner et al., 2018). Thus, rejuvenation of chronically implanted electrodes may improve device performance both in recording and stimulation.
Future work will expand upon these results by performing a more systematic analysis of the cellular impact of rejuvenation, including recordings of electrophysiological data from the electrode sites where rejuvenation is applied. Future work will also include histological analysis around implant sites and electrode surface analysis to further elucidate the impact of rejuvenation on the electrode surface. These analyses were not possible in this study since the NHPs studied here are part of ongoing experiments. Future work will include more detailed analyses of these factors following animal sacrifice.
B. Process model
The process model fitted to our example data provided some estimates of potential mechanisms of action for rejuvenation. The calculated “effective” tissue encapsulation layer thickness before and after rejuvenation was consistent with the hypothesis that rejuvenation temporarily creates current pathways through the dense fibrous encapsulation layer created by the chronic FBR, allowing recorded potentials and stimulation charge to flow more freely across the biological boundary. One limitation of this model was its failure to fit datapoints at the high-frequency end of our measured EIS spectra (above 5 kHz). This was attributed to instrument noise, as regression to a Voigt measurement model (Equation 3) demonstrated inconsistency of the real impedance component with Kramers-Kronig relations at high frequency (Agarwal et al., 1992). We are developing additional models with the goal of elucidating additional electrochemical parameters and providing deeper insights into the effects of rejuvenation on electrode integrity and tissue.
V. CONCLUSIONS
Multiple methods exist for combating ETI changes that are chronically affected by the foreign body response (FBR), which includes changes to electrode geometry and pliability, the addition of surface coatings, and the local administration of anti-inflammatory medications (Cody et al., 2018; Gori et al., 2021, 2022; Oliva et al., 2018; Skousen et al., 2011). However, most of these measures involve changes to electrode design or the introduction of additional elements which may affect electrical performance that could limit lifespan, which are critical issues for invasive devices designed for lifetime use. Electrical rejuvenation as demonstrated here has several advantages over other FBR-mitigation techniques. It requires no changes to electrode design or introduction of new materials or metal alloys, and it can be performed with any implantable device capable of delivering electrical stimulation. Although the effects of rejuvenation appear to be temporary, lasting from several days to one week, they are repeatable and require only brief amounts of stimulation, on the order of seconds. These properties make rejuvenation a useful tool for improving or maintaining closed-loop device capabilities, without substantial changes to existing hardware or therapy protocols.
Further investigation is needed to identify the optimal rejuvenation parameters for each electrode type, including an exploration of additional stimulation amplitudes, frequencies, and durations of charge delivery, as well as investigating the effect duration of these protocols and, importantly, the physiological impacts on neural tissue. In summary, we demonstrate here the potential benefits of electrical rejuvenation in clinically relevant macroelectrode designs, but there are still unknowns with regard to mechanism of action, safety parameters, and optimization. Improved process modeling of pre- and post-rejuvenation EIS will likely provide additional insights regarding rejuvenation’s effect on the properties of an electrode and its surrounding tissue encapsulation layer. It is clear that the application of electrical stimulation for the purpose of reducing chronic ETI changes is viable in both micro and macroelectrode designs and has potential for future development in clinical settings.
VI. REFERENCES
- Agarwal P, Crisalle OD, Orazem ME, & Garcia-Rubio LH (1995). Application of Measurement Models to Impedance Spectroscopy: II. Determination of the Stochastic Contribution to the Error Structure (Journal of The Electrochemical Society, pp. 4149–4158). [Google Scholar]
- Agarwal P, Orazem ME, & Garcia-Rubio LH (1992). Measurement Models for Electrochemical Impedance Spectroscopy: I. Demonstration of Applicability. Journal of The Electrochemical Society, 139(7), 1917–1927. 10.1149/1.2069522 [DOI] [Google Scholar]
- Ansó J, Benjaber M, Parks B, Parker S, Oehrn CR, Petrucci M, Gilron R, Little S, Wilt R, Bronte-Stewart H, Gunduz A, Borton D, Starr PA, & Denison T (2022). Concurrent stimulation and sensing in bi-directional brain interfaces: a multi-site translational experience. Journal of Neural Engineering, 19(2), 10.1088/1741-2552/ac59a3. 10.1088/1741-2552/ac59a3 [DOI] [PMC free article] [PubMed] [Google Scholar]
- Baker JL, Ryou J-W, Wei XF, Butson CR, Schiff ND, & Purpura KP (2016). Robust modulation of arousal regulation, performance, and frontostriatal activity through central thalamic deep brain stimulation in healthy nonhuman primates. Journal of Neurophysiology, 116(5), 2383–2404. 10.1152/jn.01129.2015 [DOI] [PMC free article] [PubMed] [Google Scholar]
- Biran R, Martin DC, & Tresco PA (2005). Neuronal cell loss accompanies the brain tissue response to chronically implanted silicon microelectrode arrays. Experimental Neurology, 195(1), 115–126. 10.1016/j.expneurol.2005.04.020 [DOI] [PubMed] [Google Scholar]
- Butson CR, Maks CB, & McIntyre CC (2006). Sources and effects of electrode impedance during deep brain stimulation. Clinical Neurophysiology, 117, 447–454. 10.1016/j.clinph.2005.10.007 [DOI] [PMC free article] [PubMed] [Google Scholar]
- Butson CR, & McIntyre CC (2005). Tissue and electrode capacitance reduce neural activation volumes during deep brain stimulation. Clinical Neurophysiology, 116, 2490–2500. 10.1016/j.clinph.2005.06.023 [DOI] [PMC free article] [PubMed] [Google Scholar]
- Chen KH, Dammann JF, Boback JL, Tenore FV, Otto KJ, Gaunt RA, & Bensmaia SJ (2014). The effect of chronic intracortical microstimulation on the electrode–tissue interface. Journal of Neural Engineering, 11(2), 026004. 10.1088/1741-2560/11/2/026004 [DOI] [PMC free article] [PubMed] [Google Scholar]
- Cody PA, Eles JR, Lagenaur CF, Kozai TDY, & Cui XT (2018). Unique electrophysiological and impedance signatures between encapsulation types: An analysis of biological Utah array failure and benefit of a biomimetic coating in a rat model. Biomaterials, 161, 117–128. 10.1016/j.biomaterials.2018.01.025 [DOI] [PMC free article] [PubMed] [Google Scholar]
- Dhillon GS, Krüger TB, Sandhu JS, & Horch KW (2005). Effects of short-term training on sensory and motor function in severed nerves of long-term human amputees. Journal of Neurophysiology, 93, 2625–2633. 10.1152/jn.00937.2004 [DOI] [PubMed] [Google Scholar]
- Gardner AT, Strathman HJ, Warren DJ, & Walker RM (2018). Impedance and Noise Characterizations of Utah and Microwire Electrode Arrays. IEEE Journal of Electromagnetics, RF and Microwaves in Medicine and Biology, 2(4), 234–241. 10.1109/jerm.2018.2862417 [DOI] [Google Scholar]
- Gori M, Giannitelli SM, Vadalà G, Papalia R, Zollo L, Sanchez M, Trombetta M, Rainer A, Pino GD, & Denaro V (2022). A Soft Zwitterionic Hydrogel as Potential Coating on a Polyimide Surface to Reduce Foreign Body Reaction to Intraneural Electrodes. Molecules, 27(10), 3126. 10.3390/molecules27103126 [DOI] [PMC free article] [PubMed] [Google Scholar]
- Gori M, Vadalà G, Giannitelli SM, Denaro V, & Pino GD (2021). Biomedical and Tissue Engineering Strategies to Control Foreign Body Reaction to Invasive Neural Electrodes. Frontiers in Bioengineering and Biotechnology, 9, 659033. 10.3389/fbioe.2021.659033 [DOI] [PMC free article] [PubMed] [Google Scholar]
- Hosain MK, Kouzani A, & Tye S (2014). Closed loop deep brain stimulation: an evolving technology. Australasian Physical & Engineering Sciences in Medicine, 37(4), 619–634. 10.1007/s13246-014-0297-2 [DOI] [PubMed] [Google Scholar]
- Janson AP, Baker JL, Sani I, Purpura KP, Schiff ND, & Butson CR (2021). Selective activation of central thalamic fiber pathway facilitates behavioral performance in healthy non-human primates. Scientific Reports, 11(1), 23054. 10.1038/s41598-021-02270-7 [DOI] [PMC free article] [PubMed] [Google Scholar]
- Johnson MD, Otto KJ, & Kipke DR (2005). Repeated voltage biasing improves unit recordings by reducing resistive tissue impedances. IEEE Transactions on Neural Systems and Rehabilitation Engineering, 13, 160–165. 10.1109/tnsre.2005.847373 [DOI] [PubMed] [Google Scholar]
- Johnson MD, Otto KJ, Williams JC, & Kipke DR (2004). Bias voltages at microelectrodes change neural interface properties in vivo. 26 VI, 4103–4106. 10.1109/iembs.2004.1404145 [DOI] [PubMed] [Google Scholar]
- Lempka SF, Miocinovic S, Johnson MD, Vitek JL, & McIntyre CC (2009). In vivo impedance spectroscopy of deep brain stimulation electrodes. Journal of Neural Engineering, 6. 10.1088/1741-2560/6/4/046001 [DOI] [PMC free article] [PubMed] [Google Scholar]
- Mercanzini A, Colin P, Bensadoun J-C, Bertsch A, & Renaud P (2009). <emphasis emphasistype=“italic”>In Vivo</emphasis> Electrical Impedance Spectroscopy of Tissue Reaction to Microelectrode Arrays. IEEE Transactions on Biomedical Engineering, 56(7), 1909–1918. 10.1109/tbme.2009.2018457 [DOI] [PubMed] [Google Scholar]
- Merrill DR, Bikson M, & Jefferys JGR (2005). Electrical stimulation of excitable tissue: design of efficacious and safe protocols. Journal of Neuroscience Methods, 141(2), 171–198. 10.1016/j.jneumeth.2004.10.020 [DOI] [PubMed] [Google Scholar]
- Narayan S, Stoica L, Liess A, & Reisinger A (2021). Amplicoat® – Conductive Polymer Coating with Enhanced Durability and Performance for Chronic Implants. 2021 Design of Medical Devices Conference. 10.1115/dmd2021-1082 [DOI] [Google Scholar]
- Oliva ND la, Navarro, X., & Valle, J. del. (2018). Dexamethasone Reduces the Foreign Body Reaction to Intraneural Electrode Implants in the Peripheral Nerve of the Rat. The Anatomical Record, 301(10), 1722–1733. 10.1002/ar.23920 [DOI] [PubMed] [Google Scholar]
- Orazem ME (2004). A systematic approach toward error structure identification for impedance spectroscopy. Journal of Electroanalytical Chemistry, 572, 317–327. 10.1016/j.jelechem.2003.11.059 [DOI] [Google Scholar]
- Orazem ME, & Tribollet B (2008). An integrated approach to electrochemical impedance spectroscopy. Electrochimica Acta, 53, 7360–7366. 10.1016/j.electacta.2007.10.075 [DOI] [Google Scholar]
- Otto KJ, Johnson MD, & Kipke DR (2006). Voltage pulses change neural interface properties and improve unit recordings with chronically implanted microelectrodes. IEEE Transactions on Biomedical Engineering, 53, 333–340. 10.1109/tbme.2005.862530 [DOI] [PubMed] [Google Scholar]
- Pandarinath C, Nuyujukian P, Blabe CH, Sorice BL, Saab J, Willett FR, Hochberg LR, Shenoy KV, & Henderson JM (2017). High performance communication by people with paralysis using an intracortical brain-computer interface. ELife, 6, e18554. 10.7554/elife.18554 [DOI] [PMC free article] [PubMed] [Google Scholar]
- Parastarfeizabadi M, & Kouzani AZ (2017). Advances in closed-loop deep brain stimulation devices. Journal of NeuroEngineering and Rehabilitation, 14(1), 79. 10.1186/s12984-017-0295-1 [DOI] [PMC free article] [PubMed] [Google Scholar]
- Polikov VS, Tresco PA, & Reichert WM (2005). Response of brain tissue to chronically implanted neural electrodes. Journal of Neuroscience Methods, 148, 1–18. 10.1016/j.jneumeth.2005.08.015 [DOI] [PubMed] [Google Scholar]
- Rossini PM, Micera S, Benvenuto A, Carpaneto J, Cavallo G, Citi L, Cipriani C, Denaro L, Denaro V, Pino GD, Ferreri F, Guglielmelli E, Hoffmann KP, Raspopovic S, Rigosa J, Rossini L, Tombini M, & Dario P (2010). Double nerve intraneural interface implant on a human amputee for robotic hand control. Clinical Neurophysiology, 121, 777–783. 10.1016/j.clinph.2010.01.001 [DOI] [PubMed] [Google Scholar]
- Roweis S (1996). Levenberg-marquardt optimization. Notes, University Of Toronto, 52. [Google Scholar]
- Satzer D, Lanctin D, Eberly LE, & Abosch A (2014). Variation in Deep Brain Stimulation Electrode Impedance over Years Following Electrode Implantation. Stereotactic and Functional Neurosurgery, 92(2), 94–102. 10.1159/000358014 [DOI] [PMC free article] [PubMed] [Google Scholar]
- Schmid G, Neubauer G, & Mazal PR (2003). Dielectric properties of human brain tissue measured less than 10 h postmortem at frequencies from 800 to 2450 MHz. Bioelectromagnetics, 24(6), 423–430. 10.1002/bem.10123 [DOI] [PubMed] [Google Scholar]
- Sillay KA, Ondoma S, Wingeier B, Schomberg D, Sharma P, Kumar R, Miranpuri GS, & Williams J (2019). Long-Term Surface Electrode Impedance Recordings Associated with Gliosis for a Closed-Loop Neurostimulation Device. Annals of Neurosciences, 25(4), 289–298. 10.1159/000481805 [DOI] [PMC free article] [PubMed] [Google Scholar]
- Skousen JL, Merriam Sr. M. E., Srivannavit O., Perlin G., Wise KD., & Tresco PA. (2011). Chapter 12 Reducing surface area while maintaining implant penetrating profile lowers the brain foreign body response to chronically implanted planar silicon microelectrode arrays. Progress in Brain Research, 194, 167–180. 10.1016/b978-0-444-53815-4.00009-1 [DOI] [PubMed] [Google Scholar]
- Stensaas SS, & Stensaas LJ (1978). Histopathological evaluation of materials implanted in the cerebral cortex. Acta Neuropathologica, 41(2), 145–155. 10.1007/bf00689766 [DOI] [PubMed] [Google Scholar]
- Torres-Martinez N, Ratel D, Crétallaz C, Gaude C, Maubert S, Divoux J-L, Henry C, Guiraud D, & Sauter-Starace F (2019). Reliability of parylene-based multi-electrode arrays chronically implanted in adult rat brains, and evidence of electrical stimulation on contact impedance. Journal of Neural Engineering, 16(6), 066047. 10.1088/1741-2552/ab3836 [DOI] [PubMed] [Google Scholar]
- Wang C, Brunton E, Haghgooie S, Cassells K, Lowery A, & Rajan R (2013). Characteristics of electrode impedance and stimulation efficacy of a chronic cortical implant using novel annulus electrodes in rat motor cortex. Journal of Neural Engineering, 10(4), 046010. 10.1088/1741-2560/10/4/046010 [DOI] [PubMed] [Google Scholar]
- Watson W, & Orazem ME (2023). EIS: Measurement Model Program program, Version 1.8. ECSarXiv. [Google Scholar]
- Weiland JD, & Anderson DJ (2000). Chronic neural stimulation with thin-film, iridium oxide electrodes. IEEE Transactions on Biomedical Engineering, 47(7), 911–918. 10.1109/10.846685 [DOI] [PubMed] [Google Scholar]
- Wilks SJ, Richner TJ, Brodnick SK, Kipke DR, Williams JC, & Otto KJ (2012). Voltage biasing, cyclic voltammetry, & electrical impedance spectroscopy for neural interfaces. Journal of Visualized Experiments. 10.3791/3566 [DOI] [PMC free article] [PubMed] [Google Scholar]
- Williams JC (2001). Performance of chronic neural implants: Measurement, modeling and intervention strategies. Arizona State University ProQuest Dissertations Publishing. [Google Scholar]
- Williams JC, Hippensteel JA, Dilgen J, Shain W, & Kipke DR (2007). Complex impedance spectroscopy for monitoring tissue responses to inserted neural implants. Journal of Neural Engineering, 4, 410–423. 10.1088/1741-2560/4/4/007 [DOI] [PubMed] [Google Scholar]
- Zhou A, Johnson BC, & Muller R (2018). Toward true closed-loop neuromodulation: artifact-free recording during stimulation. Current Opinion in Neurobiology, 50, 119–127. 10.1016/j.conb.2018.01.012 [DOI] [PubMed] [Google Scholar]