

Abstract
目的
探讨在乙型肝炎病毒(HBV)相关肝细胞癌(HCC)中M2巨噬细胞特征基因(MRG)对患者预后的评估价值及潜在的分子机制。
方法
从TCGA数据库获取73例HBV相关肝HCC患者的转录组数据,通过WGCNA识别M2巨噬细胞相关基因模块,利用LASSO鉴定出关键MRG并构建风险评分,并在外部数据集中验证风险评分的预测性能。应用CIBERSORT和R.pRRophetic分析风险评分与免疫细胞浸润、药物敏感性的关系。通过GSVA和GSEA对高风险组和低风险组的差异基因进行通路富集分析。R.Seurat验证在HCC中表达MRG的细胞类型,并通过R.Cellchat分析细胞互作强度,找到与HCC进展相关的重要细胞类型。流式细胞术检测肝癌条件培养基诱导THP-1向M2样极化,RT-qPCR验证MRG在HBV阳性的肝癌细胞系和M2巨噬细胞中表达。
结果
M2巨噬细胞高浸润状态与患者不良预后显著相关(P=0.025)。高风险组的总生存期(OS)均显著低于低风险组(训练集P=0.021,测试集P=0.046)。高风险组中M2巨噬细胞显著富集(P=0.03),低风险组中幼稚B细胞显著富集(P=0.049)。药物BI.2536对高风险组更有效(P=0.025),AG.014699(P=0.044)、AKT.inhibitor.VIII(P=0.041)、AZD.0530(P=0.0033)、AZD7762(P=0.0051)和BMS.708163(P=0.015)对低风险组更有效。通路富集分析结果表明,增殖相关通路和代谢相关通路在高风险组中富集。单核细胞在高风险组HCC进展的细胞互作中最为活跃。VTN在PLC/PRF/5中的表达显著上调(P<0.0001),GCLC、PARVB、TRIM27和GMPR在M2样THP-1中的表达显著上调(P=0.0037、P=0.0015、P=0.0071、P=0.0004)。
结论
MRG风险评分能准确预测HBV相关HCC患者的预后,揭示其肿瘤微环境的差异,为HCC患者的精准治疗提供了指导。
Keywords: M2巨噬细胞, 肝细胞癌, 预后模型, 乙型肝炎病毒
Abstract
Objective
To investigate the prognostic value of M2 macrophage-related genes (MRG) in hepatitis B virus (HBV)-related hepatocellular carcinoma (HCC).
Methods
The transcriptome data of 73 patients with HBV-related HCC were obtained from TCGA database, and the MRG modules were identified by WGCNA. The MRG-based risk scoring model was constructed by LASSO regression analysis and validated using an external dataset. The correlation of the risk score with immune cell infiltration and drug sensitivity of HCC were analyzed with CIBERSORT and R.pRRophetic. The signaling pathways of the differential genes between the high- and low-risk groups were investigated using GSVA and GSEA enrichment analyses, and MRG expressions at the single cell level were validated using R.Seurat. The cell interaction intensity was analyzed by R.Cellchat to identify important cell types related to HCC progression. MRG expression levels were detected by RT-qPCR in THP-1 cells with HCC-conditioned medium-induced M2 polarization and in HBV-positive HCC cells.
Results
A high M2 macrophage infiltration level was significantly correlated with a poor prognosis of HCC, and 5 hub MRG (VTN, GCLC, PARVB, TRIM27, and GMPR) were identified. The overall survival of HCC patients was significantly lower in the high-risk than in the low-risk group. The high- and the low-risk groups showed significant enrichment of M2 macrophages and naïve B cells, respectively, and were sensitive to BI.2536 and to AG.014699, AKT.inhibitor.VIII, AZD.0530, AZD7762, and BMS.708163, respectively. The proliferation-related and metabolism-related pathways were enriched in the high-risk group, where monocytes showed the most active cell interactions during HCC progression. VTN was significantly upregulated in HCC cell lines, while GCLC, PARVB, TRIM27, and GMPR were upregulated in M2 THP-1 cells.
Conclusion
The MRG-based risk scoring model can accurately predict the prognosis of HBV-related HCC and reveal the differences in tumor microenvironment to guide precision treatment of the patients.
Keywords: M2 macrophages, hepatocellular carcinoma, prognostic model, hepatitis B virus
肝细胞癌(HCC)是最常见的原发性肝癌之一,由于其不断上升的发病率和死亡率,HCC已成为造成全球公共卫生沉重负担的疾病之一[1]。在东亚地区,乙型肝炎病毒(HBV)感染是诱发HCC的主要危险因素之一[2]。HBV相关HCC起病隐匿,早期症状不典型,且疾病进展快,因此往往在晚期才被确诊。晚期HCC总体治疗效果差,患者生存率和生存质量不良[3]。甲胎蛋白(AFP)是目前HBV相关HCC早期筛查的血清标志物,但其敏感性和特异性尚无法满足临床诊疗需求[4]。HCC预后分期系统主要有TNM分期系统、巴塞罗那临床肝癌分期系统(BCLC),以及意大利肝癌项目(CLIP)评分,但无任何一种得到普遍采用[5-8]。这些预后分期系统主要参考4个传统的临床病理特征:基础肝病的严重程度、肿瘤大小和肿瘤向邻近结构侵袭的程度及是否有转移,未考虑HCC的分子特征和微环境差异[5, 9]。HBV相关HCC是一种高度异质性的肿瘤,临床病理特征类似的患者,预后并不总是相似。目前缺乏能够预测HBV相关HCC病人预后的生物标志物,因此需要更深入地识别和研究创新的“特征”,从而预测HBV相关HCC患者的预后。研究表明基于多基因表达的风险评分是一个可靠的选择[10-12]。
肿瘤微环境(TME)包含了肿瘤的许多特征,是一个十分复杂的生态环境,除肿瘤细胞外,TME还包含成纤维细胞、内皮细胞、巨噬细胞在内的多种非肿瘤细胞[13-15]。探索TME中免疫细胞如何影响肿瘤的发生和发展是当下的研究热点之一[16-18]。研究表明TME中的多种免疫细胞能直接或间接地与肿瘤细胞作用,对肿瘤的进展和耐药性形成产生重要影响[19]。肿瘤相关巨噬细胞(TAM)是HCC中数量最丰富的一群免疫细胞,在维持肝癌细胞生长、侵袭、支持新血管生成和抑制抗肿瘤免疫反应方面起到非常重要的作用[20, 21]。利用TCGA数据对HCC中巨噬细胞的免疫原性进行全面的分析,发现在HCC中存在许多M2巨噬细胞[22]。Yeung等[23]发现HCC患者组织样本中M2巨噬细胞的数量与患者的不良预后显著相关。CD163(+)TAM可以通过表达5-脂氧合酶从而增强HCC细胞的增殖和干细胞潜力[24]。M2巨噬细胞可能与HCC的发生和进展有关,但其生物学机制尚不完全清楚。目前,以M2巨噬细胞关键基因为“特征”来预测HBV相关HCC患者预后的研究较为缺乏[25]。
本研究利用WGCNA识别了5个关键M2巨噬细胞相关基因(MRG)并构建了具有普适性的预后风险评分,能准确预测HBV相关HCC患者的预后。为HBV相关HCC患者的预后管理提出更好的策略。
1. 材料和方法
1.1. 数据集下载
从TCGA数据库(https://portal.gdc.cancer.gov/)下载已处理的LIHC原始表达数据,随后根据病史提取出73例HBV相关HCC样本。从GEO数据库(https://www.ncbi.nlm.nih.gov/geo/info/datasets.html)下载GSE10140数据集,共纳入82例患者的表达谱数据(表1)。从GEO数据库下载GSE146115数据集,共提取4例肝癌患者的数据用于单细胞分析。
表1.
TCGA数据集和GSE10140数据集患者的基线资料
Tab.1 Baseline characteristics of HCC patients in TCGA dataset and GEO dataset
| Item | Overall | GSE10140 | TCGA-LIHC |
|---|---|---|---|
| n | 155 | 82 | 73 |
| Futime (median [IQR]) | 1613.00 [630.50, 2871.75] | 2854.00 [1368.00, 3662.50] | 682.50 [437.00, 1632.50] |
| Fustat =1 [n (%)] | 48 (30.9) | 32 (39.0) | 16 (21.9) |
| EGF [n (%)] | |||
| High | 9 (5.8) | 9 (11.0) | 0 (0.0) |
| Low | 73 (47.1) | 73 (89.0) | 0 (0.0) |
| NA | 73 (47.1) | 0 (0.0) | 73 (100.0) |
| Age (year, median [IQR]) | 52.00 [46.00, 62.75] | NA [NA, NA] | 52.00 [46.00, 62.75] |
| Gender [n (%)] | |||
| Female | 15 (9.7) | 0 (0.0) | 15 (20.5) |
| Male | 58 (37.4) | 0 (0.0) | 58 (79.5) |
| NA | 82 (52.9) | 82 (100.0) | 0 (0.0) |
| Grade (%) | |||
| G1 | 6 (3.8) | 0 (0.0) | 6 (8.2) |
| G2 | 27 (17.4) | 0 (0.0) | 27 (37.0) |
| G3 | 34 (21.9) | 0 (0.0) | 34 (46.6) |
| G4 | 6 (3.9) | 0 (0.0) | 6 (8.2) |
| NA | 82 (52.9) | 82 (100.0) | 0 (0.0) |
| Stage [n (%)] | |||
| Stage I | 49 (31.6) | 0 (0.0) | 49 (67.1) |
| Stage II | 15 (9.8) | 0 (0.0) | 15 (20.5) |
| Stage III | 5 (3.2) | 0 (0.0) | 5 (6.8) |
| Stage IV | 1 (0.6) | 0 (0.0) | 1 (1.4) |
| Unknow | 3 (1.8) | 0 (0.0) | 3 (4.2) |
| NA | 82 (52.9) | 82 (100.0) | 0 |
| T stage [n (%)] | |||
| T1 | 52(33.5) | 0 (0.0) | 52 (71.3) |
| T2 | 15 (9.8) | 0 (0.0) | 15 (20.5) |
| T3 | 5 (3.2) | 0 (0.0) | 5 (6.8) |
| T4 | 1 (0.6) | 0 (0.0) | 1 (1.4) |
| NA | 82 (52.9) | 82 (100.0) | 0 (0.0) |
| Metastasis [n (%)] | |||
| M0 | 70 (45.3) | 0 (0.0) | 70 (95.8) |
| M1 | 2 (1.2) | 0 (0.0) | 2 (2.8) |
| MX | 1 (0.6) | 0 (0.0) | 1 (1.4) |
| NA | 82 (52.9) | 82 (100.0) | 0 (0.0) |
| Nodes [n (%)] | |||
| N0 | 70 (45.3) | 0 (0.0) | 70 (95.8) |
| NX | 3 (1.8) | 0 (0.0) | 3 (4.2) |
| NA | 82 (52.9) | 82 (100.0) | 0 (0.0) |
EGF: Epidermal Growth Factor, NA: Not available.
1.2. CIBERSORT分析
该方法基于支持向量回归原理,对免疫细胞亚型的表达矩阵进行反卷积分析[26]。本研究使用CIBERSORT算法对数据进行分析,用来推断22种免疫浸润细胞的相对比例。
1.3. WGCNA分析
通过构建加权基因共表达网络,探索基因网络与M2巨噬细胞之间的关联以及网络中的关键基因。利用WGCNA构建HBV相关HCC数据集中所有基因的共表达网络,筛选方差前10 000的基因,软阈值设置为6。将加权邻接矩阵转化为拓扑重叠度矩阵(TOM)来估计网络连接度,运用层次聚类的方法来构建TOM的聚类树结构。基于基因的加权相关系数,将基因按照表达模式进行分类,找到与M2巨噬细胞呈显著正相关的基因模块。
1.4. 构建预后风险预测模型
选取与M2巨噬细胞显著正相关的基因模块,将Cox回归中P<0.05的基因纳入LASSO回归模型。在纳入每个特定基因的表达值后,构建了每个患者的风险评分公式。
根据风险评分公式[(Riskscore=(exprgene1×coefficientgene1)+(expgene2×coefficientgene2)+⋯+(exprgeneX×coefficientgeneX)]计算每个患者的风险得分,以风险评分中位值为分界点,将患者分为低风险组和高风险组,并评估两组间的生存差异。利用TIDES数据库来预测高、低风险组对抗肿瘤免疫治疗的敏感性[28]。
1.5. GSVA分析
从分子特征数据库(v7.0版)(MSigDB)下载基因集合,采用GSVA算法对每个基因集合进行综合打分,评估不同样本潜在的生物学功能变化。
1.6. GSEA分析
从MsigDB数据库下载背景基因集,作为亚型通路的注析基因集进行亚型之间通路的差异表达分析,根据一致性得分对显著富集的基因集(P<0.05)进行排序。
1.7. 药物敏感性分析
基于最大的药物基因组学数据库(GDSC,https://www.cancerrxgene.org/),使用R程序包“pRRophetic”来预测每个肿瘤样本的化疗敏感性;linearRidge函数做岭回归分析,通过基因表达水平预测患者对化疗药物的半抑制浓度(IC50),并用GDSC训练集进行10次交叉验证检验回归和预测精度。所有参数都选择了默认值,包括去除批处理效应的“combat”以及取重复基因表达的平均值[28]。
1.8. 单细胞分析
通过Seurat包对数据进行处理,使用tSNE算法分析得到每个Cluster间的位置关系;通过Celldex包对Cluster进行注释,分别被注释到一些与肿瘤发生有重要关系的细胞。最后通过设置FindAllMarkers的logfc.threshold参数为1,从单细胞表达谱中提取每个细胞亚型的标记基因。
1.9. 配体受体互作分析
在本次分析中将标准化后的单细胞表达谱作为输入数据,单细胞分析得出的细胞亚型为细胞信息,利用R.Cellchat分析了细胞相关的互作并以细胞间的互作强度和次数来量化互作关系的密切程度,以此来观察每类细胞在疾病中的活跃程度及影响。
1.10. 肝癌条件培养基
将肝癌细胞系饥饿处理后的培养上清液作为肝癌条件培养基(HCM)。在10 cm的培养皿(Corning)中加入10 mL无血清的DMEM培养基(Gibco)饥饿处理24 h,收取培养上清置于15 mL离心管中,以1300 r/min的转速,离心10 min。上清液用22 μm过滤器(Millex-GV)和10 mL注射器进行无菌过滤。将样品保存在-20 ℃冰箱中。
1.11. 细胞培养
HBV阳性肝癌细胞株PLC/PRF/5从实验室现有细胞库获取,均通过STR鉴定。细胞使用的培养基为PLC/PRF/5专用培养基(Pricella),置于恒温培养箱(37 ℃,5%CO2 )中培育。THP-1使用THP-1专用培养基(Pricella)培养,加100ng/mL的PMA(Merk),培养48 h成为巨噬细胞。
1.12. RT-qPCR
总RNA提取试剂Trizol和RT-qPCR试剂盒(碧云天生物技术公司)。用Trizol裂解细胞并提取细胞总 RNA,逆转录为cDNA,在PCR仪上进行实时荧光定量PCR扩增。使用2-ΔΔct 定量方法计算MRG与内参的相对表达量。所有引物均由华大基因公司提供(表2)。
表2.
MRG基因的RT-qPCR引物序列
Tab.2 RT-qPCR primer sequences
| MRG | Forword primer (5'-3') | Reverse primer (5'-3') |
|---|---|---|
| GAPDH | AGATCCCTCCAAAATCAAGTGG | GGCAGAGATGATGACCCTTTT |
| VTN | AAGCCCCAAGTGACTCGC | TTTTCTCCTCGCCATCGTCA |
| GCLC | ACTTCATTTCCCAGTACCTTAACA | GCAGCACTCAAAGCCATAACA |
| GMPR | GGGCCACATCATCTCTGATGGA | TCAGTCCCCCGAGAATATCCAG |
| PARVB | GGTTCACTTCTCCCTGGCTC | CGCTCCTCGTTCTCCTCAAG |
| TRIM27 | AGCATGAGTATCGCCTCCTG | CTGATTCTTTCAGCCCTGCTC |
1.13. M2巨噬细胞极化鉴定
利用HCM孵育巨噬细胞48 h后,弃培养上清,加入胰酶后放入37 ℃恒温培养箱消化5 min,培养基终止后收集细胞,用不同荧光通道标记的CD163和CD206抗体(BD Biosciences)对细胞进行染色,在冰上避光孵育20 min。通过流式细胞术鉴定CD163和CD206在THP-1上的表达以判断是否向M2 巨噬细胞极化。
1.14. 统计学分析
所有统计分析均采用R版本4.3.0和Graph Pad prism9.3进行,计数资料采用Spearman相关分析,通过Kaplan-Meier(K-M)曲线进行生存分析,并通过Log-rank进行比较。采用Cox比例风险回归模型进行多变量分析。计量资料的比较采用独立样本t检验。P<0.05代表差异具有统计学意义。
2. 结果
2.1. M2巨噬细胞高度浸润的HCC患者预后不良
各种免疫细胞的占比(图1A),其中,巨噬细胞是数量最为丰富的一类免疫细胞。生存分析结果显示M0巨噬细胞和M1巨噬细胞的浸润状态与患者的预后无关(P=0.21和P=1.00),但M2巨噬细胞高浸润水平的HCC患者的生存显著较差(P=0.025,图1B~D)。
图1.

M2巨噬细胞高浸润的HCC患者预后不良
Fig.1 HCC patients with high M2 macrophage infiltration level have poor prognosis. A: Proportion of immune cells in HBV-related HCC patients. B-D: Prognosis of patients stratified by the number of M0 macrophage (B), M1 macrophage (C) and M2 macrophage (D).
2.2. 风险评分的构建
根据TCGA-LIHC表达谱数据构建WGCNA网络,软阈值β设置为6(图2A)。在本次分析中共检测到11个基因模块,其中Darkturquoise(479)模块与M2巨噬细胞相关性最高(r=0.28,P=0.02,图2B、C)。通过LASSO回归筛选出5个关键MRG(VTN、GCLC、PARVB、TRIM27和GMPR),并得到每个样本对应的最佳风险评分值(Riskscore=VTN×(-0.0498)+GCLC×0.0677+PARVB×0.0922+TRIM27×0.1797+GMPR×0.4240,图2D~F)。
图2.

风险评分的构建
Fig.2 Construction of prognostic risk scoring model. A-C: Identification of M2 macrophage-related gene (MRG) modules by WGCNA. D-F: Five hub MRGs (VTN, GCLC, PARVB, TRIM27 and GMPR) identified by LASSO regression analysis for constructing the risk scoring model.
2.3. 风险评分的验证
根据风险评分将患者分为高风险组和低风险组(图3A~D)。K-M生存曲线显示训练集及测试集中高风险组的总生存期(OS)显著短于低风险组(训练集P=0.021,测试集P=0.046,图3E、F),在GEO数据集中也得到一致结果(P=0.007,图3I)。此外,训练集及测试集ROC曲线结果均提示风险评分预测患者1y-OS、3y-OS和5y-OS效果良好(图3G、H)。
图3.
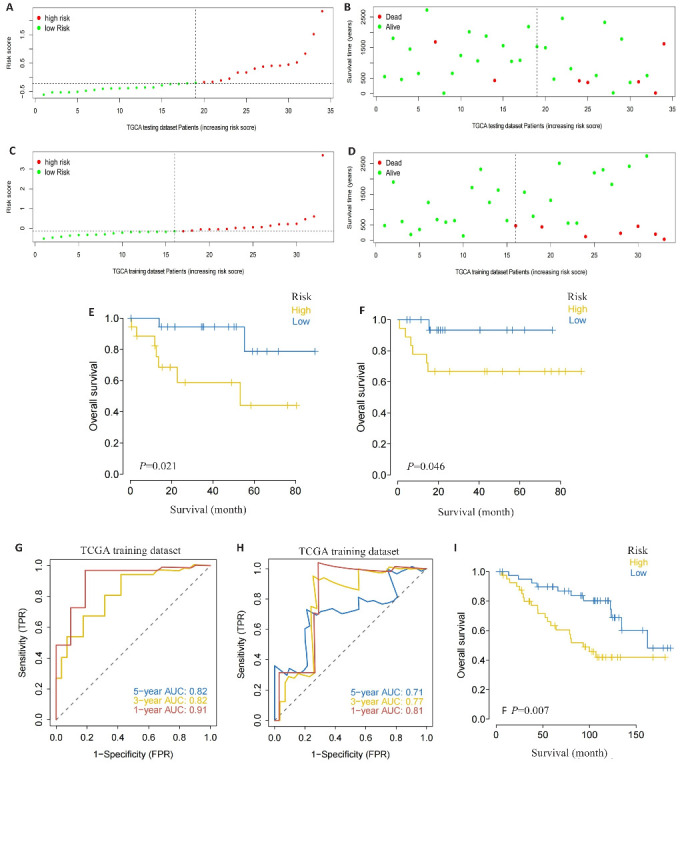
风险评分的验证
Fig.3 Validation of the risk scoring model. A-D: Different patterns of survival status and survival time between the high-risk group (A, B) and low-risk group (C, D). E, F: Validation of the MRG prognostic model in the training dataset (E) and testing dataset (F). G, H: ROC curves of the risk score for predicting overall survival (OS) in the training dataset (G) and testing dataset (H). I: Validation of the MRG prognostic model using the external dataset.
2.4. 列线图的构建
结合风险评分与临床特征构建列线图,其中风险评分对列线图预测模型有显著贡献(图4A)。列线图对患者第3年和第5年的生存预测与实际基本一致(图4B)。ROC曲线显示列线图对HCC患者第1年、第3年和第5年生存预测的准确性高,AUC值分别为0.9019、0.8184和0.7041(图4C)。采用DCA曲线评估列线图中指标的临床效用,发现风险评分净获益值最大,优于其他临床指标(图4D)。风险评分的高低与HCC患者生存、分级和T分期相关(P<0.05,图4E~G)。此外,通过单因素(HR=2.847,95% CI:1.772-4.574,P<0.001)和多因素(HR=5.507,95% CI:1.956-15.502,P=0.001)分析发现风险评分是HBV相关HCC患者的独立预后因素(图4H、I)。
图4.

列线图的构建
Fig.4 Construction of the nomogram. A: Nomogram of the risk scores and clinical characteristics. B: Calibration curves for evaluating OS predictions at 3 and 5 years. C, D: ROC and DCA curves for determining the accuracy of the nomogram for OS at 1, 3 and 5 years, respectively. E-G: Correlation of the risk scores with clinical stages. H, I: Univariate analysis and multivariate analysis for validating the independent prognostic value of the risk scores.
2.5. 风险评分的临床预测价值
测试集中高、低风险组的免疫细胞占比,高风险组中M2巨噬细胞数量显著高于低风险组(图5A,P=0.03),而低风险组中幼稚B细胞数量显著高于高风险组(P=0.049,图5B)。低风险组可能对免疫治疗的响应较差(图5C)。除免疫疗法外,早期肝细胞癌手术结合化疗治疗效果明显,利用GDSC数据库的药物敏感性数据,进一步探讨风险评分与常见化疗药和靶向药物的IC50值。高风险组对BI.2536更敏感(P=0.025),低风险组则对AG.014699(P=0.044)、AKT.inhibitor.VIII(P=0.041)、AZD.0530(P=0.0033)、AZD7762(P=0.0051)和BMS.708163(P=0.015)更敏感(图5D)。
图5.

风险评分的临床预测价值
Fig.5 Clinical predictive value of the risk scoring model. A, B: Infiltrating level of immune cells in the high- and low-risk groups. C: Sensitivity of anti-tumor immunotherapy in the high- and low-risk groups. D: IC50 values of common chemotherapy drugs.
2.6. 风险评分相关信号转导机制
GSVA富集分析结果显示增殖相关通路如Myc targets v2、Mitotic spindle和Wnt-β catenin和代谢相关通路如PI3K-AKT-mTOR、Protein secretion、Oxidative phosphorylation和Adipogenesis在高风险组中富集(图6A)。此外,GSEA分析显示mTOR和Wnt信号通路也在高风险组富集(图6B),图6C展示了各通路之间的分子作用网络。
图6.

风险评分相关的功能富集分析
Fig.6 Functional enrichment analysis of signaling pathways related to the risk scoring model. A: GSVA in the high- and low-risk groups. B: GSEA in the high- and low-risk groups. C: Molecular interaction networks between the pathways.
2.7. MRG与HCC致病基因的关系
选取其中相关性评分前20的基因,在高低风险组和低风险组间进行差异表达分析。结果显示CDH1(P=0.027)、EGFR(P=0.036)和MSH6(P=0.042)在两组间具有差异(图7A)。此外,5个关键MRG的表达水平和多个HCC致病基因的表达水平具有相关性,其中VTN与CDH1正相关(r=0.445,P<0.001),PARVB与EGFR负相关(r=-0.356,P=0.002,图7B)。
图7.
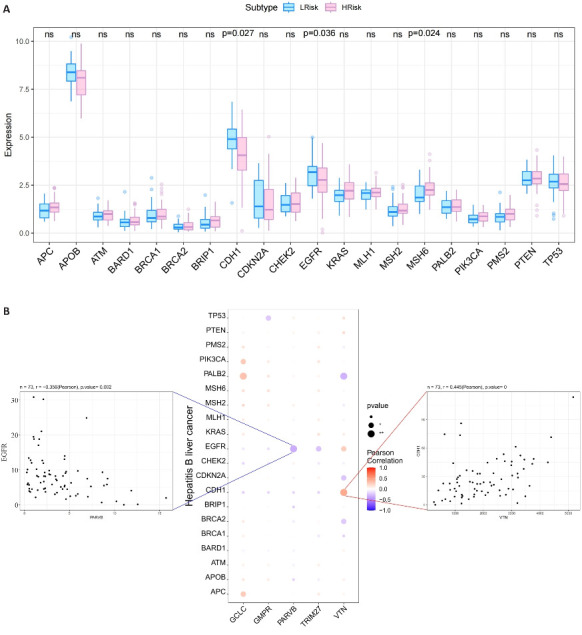
MRG与HCC致病基因的关系
Fig.7 Relationship between the 5 hub MRGs and HCC pathogenic genes. A: Relationship between the hub genes and the top 20 HCC pathogenic genes. B: A bubble plot illustrating the Pearson correlation between 5 hub MRGs (VTN, GCLC, PARVB, TRIM27 and GMPR) and the top 20 HCC pathogenic genes.
2.8. 单细胞分析揭示MRG在免疫细胞中表达
单细胞分析结果显示VTN主要在肝癌细胞中表达,GCLC、PARVB、TRIM27和GMPR主要在免疫细胞中表达(图8A~C)。其中Monocyte与其他细胞的潜在互作关系最密切(图8D、E)。通过HCC单细胞测序数据库(http://cancer-pku.cn:3838/HCC/)进一步获得了MRG在HCC中6个免疫细胞类群中表达情况(图8F)。结果提示GCLC、PARVB、GMPR和TRIM27在HCC巨噬细胞高中表达,其中GCLC、PARVB和GMPR表达更具有特异性(图8G)。
图8.
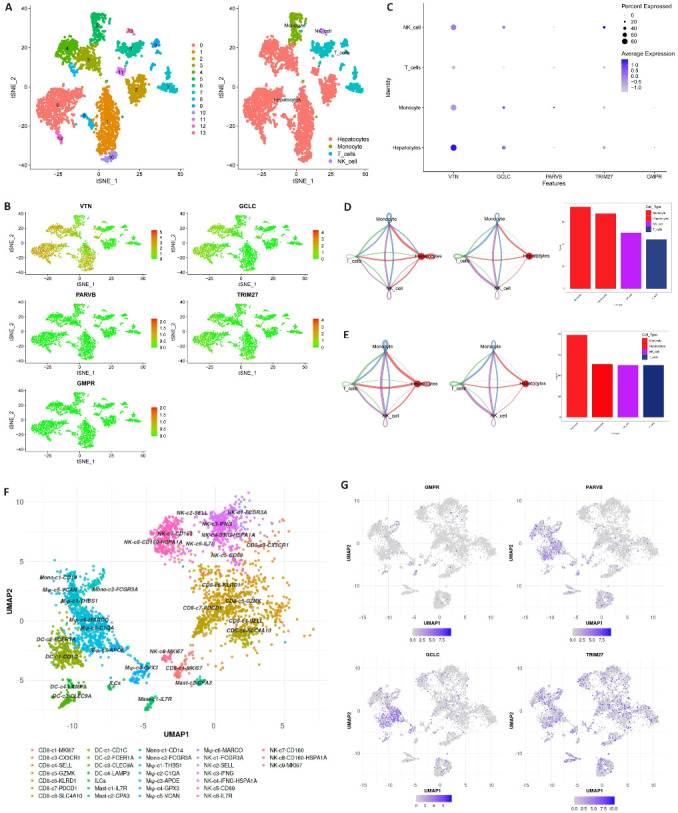
表达MRG的细胞类型
Fig.8 Expression of MRGs in different cell types. A-C: 5 hub MRGs are mainly expressed in hepatocytes, monocyte, T cells and NK cell. D, E: Cell chat intensity in high- and low-risk groups. F: UMAP projection showing the immune landscape of HCC, colored by cluster. G: Expressions of GCLC, PARVB, GMPR and TRIM27 in HCC immune microenvironment.
2.9. MRG在细胞水平的验证
经过PLC/PRF/5培养上清处理48 h后,表达CD163+和CD206+的THP-1细胞数量显著增加(P<0.0001, 图9A)。VTN 在肝癌细胞中的表达显著高于巨噬细胞(P<0.0001),与PLC/PRF/5相比,HCM-THP-1中GCLC、PARVB、TRIM27和GMPR表达显著上调(P=0.0037、P=0.0015、P=0.0071、P=0.0004),与风险评分系数表达趋势一致(图9B~F)。
图9.

MRG在肝癌细胞和巨噬细胞中的表达
Fig.9 Expressions of MRGs in HCC cell lines and macrophages. A: Expression of CD163 and CD206 on THP-1 cells detected by flow cytometry. B-F: Expression of MRGs in PLC/PRF/5 and HCM-THP-1 cells. **P<0.01, ***P<0.001, ****P<0.0001.
3. 讨论
HCC的肿瘤异质性给精准治疗带来了巨大的挑战。传统的分期系统不能充分预测HBV相关HCC患者的预后,因此迫切需要开发更可靠和更精准的预后风险评估系统。本研究发现M2巨噬细胞高浸润状态的HBV相关HCC患者预后不良,随后利用LASSO回归分析筛选出5个关键MRG(GCLC、GMPR、PARVB、TRIM27、和VTN)来构建风险评分,从而对患者进行分组。K-M曲线显示高风险组患者的总生存率明显高于低风险患者,提示MRG风险评分可能是HBV相关HCC的预后指标。为了更准确、更科学地计算HBV相关HCC患者的总体生存概率,本研究构建了列线图来预测患者的预后情况,更直观的展示了患者预后风险。风险评分作为HBV相关HCC的独立预后因素,风险评分效用优于其他临床特征,说明预后模型具有良好的预测效能,可以较好的预测HBV相关HCC的预后。
肝癌组织中高水平GCLC与根治性切除后HCC预后不良有关[29]。GMPR能通过减少细胞内GTP总量来抑制HCC的侵袭[30]。研究表明在HCC细胞系中过表达PARVB能促进HCC细胞迁移和侵袭[31]。TRIM27的表达上调与HCC患者生存率低和免疫浸润增加相关[32]。VTN 是HCV相关肝硬化患者HCC发展的候选生物标志物。随着单细胞测序技术的发展,单细胞测序技术成为解析肿瘤微环境中不同细胞群体间相互作用关系的有力工具[33-35]。利用HCC患者的单细胞测序结果,我们从更高维度分析关键MRG基因在肝癌TME中表达情况,发现VTN主要在肝实质细胞中表达,其他MRG基因多在巨噬细胞中表达。最后在体外实验中,MRG基因在HCC细胞和巨噬细胞中的表达趋势与我们的生物信息学分析结果一致,进一步说明了MRG风险评分的可靠性。
免疫疗法已成为不同类型癌症的一种有前途的治疗选择,具有刺激免疫系统靶向癌细胞的潜力。然而,目前针对HCC的免疫治疗方案显示出有限的疗效[36]。研究表明在HCC中,巨噬细胞的高浸润状态是患者对免疫治疗无响应的主要原因。Liu等[37]应用配对的单细胞测序技术和空间转录组学识别出对HCC免疫治疗有反应和无反应的患者的TME的差异,发现由SPP1+巨噬细胞和成纤维细胞在无反应患者中的相互作用限制了免疫细胞的浸润。ZFP64在抗PD-1耐药HCC患者的肿瘤组织中经常上调。研究发现,ZFP64在PD-1耐药的HCC患者中高表达,其通过PKCα/ZFP64/CSF1轴促使巨噬细胞向M2极化,从而诱导耐药性的产生[37, 38]。基于MRG风险评分对患者高低风险的区分,本研究发现高风险评分的HCC患者对免疫治疗的反应性好,两组间的在M2巨噬细胞和B细胞数量上差异可能是该部分患者对免疫治疗响应的潜在原因,值的进一步探究其潜在的作用机制。
为了阐明MRG风险评分对HBV相关HCC高低风险组间差异与内部生物学过程的联系,采用通路富集分析发现高风险评分的HCC患者Wnt和mTOR信号通路均显著富集。研究表明肿瘤细胞衍生的Wnt配体通过Wnt/Catenin信号诱导巨噬细胞向M2样极化,导致HCC中的肿瘤迁移、发展、免疫抑制和转移[39]。另一项研究表明,肿瘤细胞衍生的EGF可以通EGFR-PI3K-AKT-mTOR通路去促进巨噬细胞向M2样极化[40]。
然而,本研究仍然存在一些局限性。首先,所有分析均基于生物信息学分析,模型的纳入的样本量较少。其次,本研究尚未探索MRG在M2巨噬细胞中对HCC发生发展的影响,未来需要进一步研究M2巨噬细胞中MRG对HBV相关HCC的作用机制。
综上所述,基于5个关键MRG开发的风险评分能够准确预测HBV相关HCC患者的预后。本文探究了风险评分对临床治疗方案的预测价值和潜在的分子机制,为理解HBV相关HCC患者发病和治疗方案提供了新的视角。
基金资助
国家自然科学基金(82273243)
Supported by National Natural Science Foundation of China (82273243).
参考文献
- 1. Craig AJ, von Felden J, Garcia-Lezana T, et al. Tumour evolution in hepatocellular carcinoma[J]. Nat Rev Gastroenterol Hepatol, 2020, 17(3): 139-52. DOI: 10.1038/s41575-019-0229-4 [DOI] [PubMed] [Google Scholar]
- 2. Vogel A, Meyer T, Sapisochin G, et al. Hepatocellular carcinoma [J]. Lancet, 2022, 400(10360): 1345-62. DOI: 10.1016/s0140-6736(22)01200-4 [DOI] [PubMed] [Google Scholar]
- 3. Koga H, Iwamoto H, Suzuki H, et al. Clinical practice guidelines and real-life practice in hepatocellular carcinoma: a Japanese perspective[J]. Clin Mol Hepatol, 2023, 29(2): 242-51. DOI: 10.3350/cmh.2023.0102 [DOI] [PMC free article] [PubMed] [Google Scholar]
- 4. Bruix J, Sherman M, American Association for the Study of Liver Diseases . Management of hepatocellular carcinoma: an update[J]. Hepatology, 2011, 53(3): 1020-2. DOI: 10.1002/hep.24199 [DOI] [PMC free article] [PubMed] [Google Scholar]
- 5. Prospective validation of the CLIP score: a new prognostic system for patients with cirrhosis and hepatocellular carcinoma[J]. Hepatology, 2000, 31(4): 840-5. DOI: 10.1053/he.2000.5628 [DOI] [PubMed] [Google Scholar]
- 6. Chevret S, Trinchet JC, Mathieu D, et al. A new prognostic classification for predicting survival in patients with hepatocellular carcinoma. Groupe d’Etude et de Traitement du Carcinome Hépatocellulaire[J]. J Hepatol, 1999, 31(1): 133-41. DOI: 10.1016/s0168-8278(99)80173-1 [DOI] [PubMed] [Google Scholar]
- 7. Llovet JM, Brú C, Bruix J. Prognosis of hepatocellular carcinoma: the BCLC staging classification[J]. Semin Liver Dis, 1999, 19(3): 329-38. DOI: 10.1055/s-2007-1007122 [DOI] [PubMed] [Google Scholar]
- 8. Yau T, Tang VYF, Yao TJ, et al. Development of Hong Kong Liver Cancer staging system with treatment stratification for patients with hepatocellular carcinoma[J]. Gastroenterology, 2014, 146(7): 1691-700.e3. DOI: 10.1053/j.gastro.2014.02.032 [DOI] [PubMed] [Google Scholar]
- 9. Primack A, Vogel CL, Kyalwazi SK, et al. A staging system for hepatocellular carcinoma: prognostic factors in Ugandan patients[J]. Cancer, 1975, 35(5): 1357-64. DOI:3.0.co;2-8">10.1002/1097-0142(197505)35:5<1357::aid-cncr2820350518>3.0.co;2-8 [DOI] [PubMed] [Google Scholar]
- 10. Kamel HFM, Al-Amodi HSAB. Exploitation of gene expression and cancer biomarkers in paving the path to era of personalized medicine[J]. Genomics Proteomics Bioinformatics, 2017, 15(4): 220-35. DOI: 10.1016/j.gpb.2016.11.005 [DOI] [PMC free article] [PubMed] [Google Scholar]
- 11. Ahluwalia P, Kolhe R, Gahlay GK. The clinical relevance of gene expression based prognostic signatures in colorectal cancer[J]. Biochim Biophys Acta Rev Cancer, 2021, 1875(2): 188513. DOI: 10.1016/j.bbcan.2021.188513 [DOI] [PubMed] [Google Scholar]
- 12. Ye ZM, Zou SM, Niu ZY, et al. A novel risk model based on lipid metabolism-associated genes predicts prognosis and indicates immune microenvironment in breast cancer[J]. Front Cell Dev Biol, 2021, 9: 691676. DOI: 10.3389/fcell.2021.691676 [DOI] [PMC free article] [PubMed] [Google Scholar]
- 13. Bussard KM, Mutkus L, Stumpf K, et al. Tumor-associated stromal cells as key contributors to the tumor microenvironment[J]. Breast Cancer Res, 2016, 18(1): 84. DOI: 10.1186/s13058-016-0740-2 [DOI] [PMC free article] [PubMed] [Google Scholar]
- 14. Jensen C, Nissen NI, Von Arenstorff CS, et al. Serological assessment of collagen fragments and tumor fibrosis may guide immune checkpoint inhibitor therapy[J]. J Exp Clin Cancer Res, 2021, 40(1): 326. DOI: 10.1186/s13046-021-02133-z [DOI] [PMC free article] [PubMed] [Google Scholar]
- 15. de Visser KE, Joyce JA. The evolving tumor microenvironment: from cancer initiation to metastatic outgrowth[J]. Cancer Cell, 2023, 41(3): 374-403. DOI: 10.1016/j.ccell.2023.02.016 [DOI] [PubMed] [Google Scholar]
- 16. Sherman MH, Beatty GL. Tumor microenvironment in pancreatic cancer pathogenesis and therapeutic resistance[J]. Annu Rev Pathol, 2023, 18: 123-48. DOI: 10.1146/annurev-pathmechdis-031621-024600 [DOI] [PMC free article] [PubMed] [Google Scholar]
- 17. Liu YD, Li CF, Lu YP, et al. Tumor microenvironment-mediated immune tolerance in development and treatment of gastric cancer[J]. Front Immunol, 2022, 13: 1016817. DOI: 10.3389/fimmu.2022.1016817 [DOI] [PMC free article] [PubMed] [Google Scholar]
- 18. Donne R, Lujambio A. The liver cancer immune microenvironment: therapeutic implications for hepatocellular carcinoma[J]. Hepatology, 2023, 77(5): 1773-96. DOI: 10.1002/hep.32740 [DOI] [PMC free article] [PubMed] [Google Scholar]
- 19. Hanahan D, Coussens LM. Accessories to the crime: functions of cells recruited to the tumor microenvironment[J]. Cancer Cell, 2012, 21(3): 309-22. DOI: 10.1016/j.ccr.2012.02.022 [DOI] [PubMed] [Google Scholar]
- 20. Zhou DX, Luan JJ, Huang C, et al. Tumor-associated macrophages in hepatocellular carcinoma: friend or foe[J]? Gut Liver, 2021, 15(4): 500-16. DOI: 10.5009/gnl20223 [DOI] [PMC free article] [PubMed] [Google Scholar]
- 21. Pan YY, Yu YD, Wang XJ, et al. Tumor-associated macrophages in tumor immunity[J]. Front Immunol, 2020, 11: 583084. DOI: 10.3389/fimmu.2020.583084 [DOI] [PMC free article] [PubMed] [Google Scholar]
- 22. Zhang QM, He Y, Luo N, et al. Landscape and dynamics of single immune cells in hepatocellular carcinoma[J]. Cell, 2019, 179(4): 829-45.e20. DOI: 10.1016/j.cell.2019.10.003 [DOI] [PubMed] [Google Scholar]
- 23. Yeung OWH, Lo CM, Ling CC, et al. Alternatively activated (M2) macrophages promote tumour growth and invasiveness in hepatocellular carcinoma[J]. J Hepatol, 2015, 62(3): 607-16. DOI: 10.1016/j.jhep.2014.10.029 [DOI] [PubMed] [Google Scholar]
- 24. Nosaka T, Murata Y, Takahashi K, et al. Hepatocellular carcinoma progression promoted by 5-lipoxygenase activity in CD163+ tumor-associated macrophages[J]. Biomed Pharmacother, 2023, 162: 114592. DOI: 10.1016/j.biopha.2023.114592 [DOI] [PubMed] [Google Scholar]
- 25. Song HQ, Wang XX, Zhang C, et al. Construction of an M2 macrophage-related prognostic model in hepatocellular carcinoma[J]. Front Oncol, 2023, 13: 1170775. DOI: 10.3389/fonc.2023.1170775 [DOI] [PMC free article] [PubMed] [Google Scholar]
- 26. Chen BB, Khodadoust MS, Liu CL, et al. Profiling tumor infiltrating immune cells with CIBERSORT[J]. Methods Mol Biol, 2018, 1711: 243-59. DOI: 10.1007/978-1-4939-7493-1_12 [DOI] [PMC free article] [PubMed] [Google Scholar]
- 27. Shin SW, Ahn KS, Kim SW, et al. Liver resection versus local ablation therapies for hepatocellular carcinoma within the Milan criteria: a systematic review and meta-analysis[J]. Ann Surg, 2021, 273(4): 656-66. DOI: 10.1097/sla.0000000000004350 [DOI] [PubMed] [Google Scholar]
- 28. Jiang P, Gu SQ, Pan D, et al. Signatures of T cell dysfunction and exclusion predict cancer immunotherapy response[J]. Nat Med, 2018, 24(10): 1550-8. DOI: 10.1038/s41591-018-0136-1 [DOI] [PMC free article] [PubMed] [Google Scholar]
- 29. Sun JL, Zhou CH, Ma QN, et al. High GCLC level in tumor tissues is associated with poor prognosis of hepatocellular carcinoma after curative resection[J]. J Cancer, 2019, 10(15): 3333-43. DOI: 10.7150/jca.29769 [DOI] [PMC free article] [PubMed] [Google Scholar]
- 30. Bianchi-Smiraglia A, Bagati A, Fink EE, et al. Microphthalmia-associated transcription factor suppresses invasion by reducing intracellular GTP pools[J]. Oncogene, 2017, 36(1): 84-96. DOI: 10.1038/onc.2016.178 [DOI] [PMC free article] [PubMed] [Google Scholar]
- 31. Ng L, Tung-Ping Poon R, Yau S, et al. Suppression of actopaxin impairs hepatocellular carcinoma metastasis through modulation of cell migration and invasion[J]. Hepatology, 2013, 58(2): 667-79. DOI: 10.1002/hep.26396 [DOI] [PubMed] [Google Scholar]
- 32. Wang HC, Zhang Y, Yan L, et al. Analysis of TRIM27 prognosis value and immune infiltrates in hepatocellular carcinoma[J]. Int J Immunopathol Pharmacol, 2022, 36: 3946320221132986. DOI: 10.1177/03946320221132986 [DOI] [PMC free article] [PubMed] [Google Scholar]
- 33. Casanova-Acebes M, Dalla E, Leader AM, et al. Tissue-resident macrophages provide a pro-tumorigenic niche to early NSCLC cells[J]. Nature, 2021, 595(7868): 578-84. DOI: 10.1038/s41586-021-03651-8 [DOI] [PMC free article] [PubMed] [Google Scholar]
- 34. Zhang L, Li ZY, Skrzypczynska KM, et al. Single-cell analyses inform mechanisms of myeloid-targeted therapies in colon cancer[J]. Cell, 2020, 181(2): 442-59.e29. DOI: 10.1016/j.cell.2020.03.048 [DOI] [PubMed] [Google Scholar]
- 35. Zheng LT, Qin SS, Si W, et al. Pan-cancer single-cell landscape of tumor-infiltrating T cells[J]. Science, 2021, 374(6574): abe6474. DOI: 10.1126/science.abe6474 [DOI] [PubMed] [Google Scholar]
- 36. Liu CL, Yang MX, Zhang DZ, et al. Clinical cancer immunotherapy: current progress and prospects[J]. Front Immunol, 2022, 13: 961805. DOI: 10.3389/fimmu.2022.961805 [DOI] [PMC free article] [PubMed] [Google Scholar]
- 37. Liu Y, Xun ZZ, Ma K, et al. Identification of a tumour immune barrier in the HCC microenvironment that determines the efficacy of immunotherapy[J]. J Hepatol, 2023, 78(4): 770-82. DOI: 10.1016/j.jhep.2023.01.011 [DOI] [PubMed] [Google Scholar]
- 38. Wei CY, Zhu MX, Zhang PF, et al. PKCα/ZFP64/CSF1 axis resets the tumor microenvironment and fuels anti-PD1 resistance in hepatocellular carcinoma[J]. J Hepatol, 2022, 77(1): 163-76. DOI: 10.1016/j.jhep.2022.02.019 [DOI] [PubMed] [Google Scholar]
- 39. Yang Y, Ye YC, Chen Y, et al. Crosstalk between hepatic tumor cells and macrophages via Wnt/β‑catenin signaling promotes M2-like macrophage polarization and reinforces tumor malignant behaviors[J]. Cell Death Dis, 2018, 9(8): 793. DOI: 10.1038/s41419-018-0818-0 [DOI] [PMC free article] [PubMed] [Google Scholar]
- 40. Lian GH, Chen SJ, Ouyang M, et al. Colon cancer cell secretes EGF to promote M2 polarization of TAM through EGFR/PI3K/AKT/mTOR pathway[J]. Technol Cancer Res Treat, 2019, 18: 1533033819849068. DOI: 10.1177/1533033819849068 [DOI] [PMC free article] [PubMed] [Google Scholar]