

Abstract
Obesity is a leading risk factor for progression and metastasis of many cancers1,2, yet can in some cases enhance survival3–5 and responses to immune checkpoint blockade therapies, including anti-PD-1, which targets PD-1 (encoded by PDCD1), an inhibitory receptor expressed on immune cells6–8. Although obesity promotes chronic inflammation, the role of the immune system in the obesity–cancer connection and immunotherapy remains unclear. It has been shown that in addition to T cells, macrophages can express PD-19–12. Here we found that obesity selectively induced PD-1 expression on tumour-associated macrophages (TAMs). Type I inflammatory cytokines and molecules linked to obesity, including interferon-γ, tumour necrosis factor, leptin, insulin and palmitate, induced macrophage PD-1 expression in an mTORC1- and glycolysis-dependent manner. PD-1 then provided negative feedback to TAMs that suppressed glycolysis, phagocytosis and T cell stimulatory potential. Conversely, PD-1 blockade increased the level of macrophage glycolysis, which was essential for PD-1 inhibition to augment TAM expression of CD86 and major histocompatibility complex I and II molecules and ability to activate T cells. Myeloid-specific PD-1 deficiency slowed tumour growth, enhanced TAM glycolysis and antigen-presentation capability, and led to increased CD8+ T cell activity with a reduced level of markers of exhaustion. These findings show that obesity-associated metabolic signalling and inflammatory cues cause TAMs to induce PD-1 expression, which then drives a TAM-specific feedback mechanism that impairs tumour immune surveillance. This may contribute to increased cancer risk yet improved response to PD-1 immunotherapy in obesity.
More than 13 types of cancer have been associated with obesity, which is second only to smoking as a preventable cancer risk factor13–15 and becoming increasingly prevalent worldwide. Conversely, obesity can prime for robust responses to checkpoint immunotherapy through PD-1 blockade, in what has been termed the obesity paradox16–20. Although some patient cohorts have shown a conflicting response to immunotherapy21, this is complicated by the use of body mass index (BMI) as a simplified and often unreliable indicator of health assessment and the absence of other quantifiable features of metabolic health22. Studies investigating the effects of obesity on immunotherapy efficacy have largely focused on T cell phenotyping and reported that obesity can result in a reduced number of tumour-infiltrating T cells with a more naive phenotype for those T cells that remain23,24. However, macrophages are well known to infiltrate and predominate tumour and adipose tissue microenvironments and act as key drivers of obesity-associated comorbidities including chronic inflammation, insulin resistance and lipid dysregulation25. Given the established link between macrophages in obesity and the abundance of macrophages in many tumour microenvironments, we sought to explore the role of TAMs in obesity-associated cancer and response to immunotherapy.
Obesity impairs tumour immune function
Diet-induced obesity (DIO) can alter the tumour immune landscape24. A syngeneic subcutaneous tumour model using a colorectal adenocarcinoma cell line, MC38, was initially used to test the effects of DIO on tumour growth and the efficacy of anti-PD-1 immune checkpoint blockade (Fig. 1a). Mice were given a control low-fat diet (LFD, 10% kcal from fat) or high-fat diet (HFD, 45% kcal from fat), with both groups fed ad libitum for 20 weeks starting at 6 weeks of age. HFD-fed mice gained more body weight (Extended Data Fig. 1a) and exhibited systemic obesity-associated metabolic changes including hyperglycaemia and hyperinsulinaemia, without significant changes in food intake (Extended Data Fig. 1b–d). After acclimation to diet feeding, mice were subcutaneously injected with cancer cells, which were allowed to grow for 19 days. Consistent with obesity promoting cancer growth24,26, our data show that tumours grew more rapidly in mice fed HFD than in those fed LFD. After tumours were palpable, mice from both diet groups were treated with either anti-PD-1 or an IgG isotype control. Anti-PD-1 treatment seemed to attenuate tumour growth in both diet groups; however, a significant decrease in tumour weight occurred only in HFD-fed mice (Fig. 1b and Extended Data Fig. 1e–j). These data support the paradox that HFD can enhance both tumour growth and response to anti-PD-1.
Fig. 1 |. Obesity impairs anti-tumour immune cell function and metabolic signature.

a, Schematic illustrating experimental approach. s.c., subcutaneous. b, Tumour growth of MC38 tumours over time in mice receiving IgG or anti-PD-1 treatment following 20–25 weeks of diet treatment. c, Uniform manifold approximation and projection (UMAP) embeddings of scRNA-seq profiles for CD45− cells from MC38 tumours annotated using SingleR. NKT, natural killer T cell; ILC, innate lymphoid cell. d, Density UMAPs of CD45− cells from the four treatment groups. e, UMAP of CD45+ cells from MC38 tumours annotated using SingleR. DC, dendritic cell; MDSC, myeloid-derived suppressor cell; NK, natural killer. f, Density UMAPs of CD45+ cells from the four treatment groups. g–i, Violin plot of Gzmb (g), Havcr2 (h) and Lag3 (i) gene expression within clusters identified as CD8+ T cells from scRNA-seq MC38 tumours. j, Combined UMAP of clone abundance from V(D)J sequencing of T cell clusters with productive TCRs. k, Frequency of total T cells within treatment groups with paired TCRα and TCRβ sequences from MC38 tumours. l, Compass analysis of scRNA-seq data presented as differential activity of metabolic reactions from clusters identified as CD8+ and macrophages comparing LFD IgG to HFD IgG groups partitioned by Recon2 pathways. ROS, reactive oxygen species. m, Percentage of pHrodo+ cells gated on live CD11b+F480+ TAMs from MC38 tumours. n, Mean fluorescence intensity (MFI) of MHC-I on TAMs from MC38 tumours. o, Percentage of MHC-II+ TAMs from MC38 tumours. For b, lines indicate the average tumour diameter measured over time (n = 8). For scRNA-seq (c–l), data are representative of 1 experiment, n = 3 pooled tumours from mice in each treatment group. For m–o, each data point represents a biological replicate (n = 8). Data are mean ± s.e.m. Data in m–o represent ≥2 independent experiments with ≥3 mice per treatment group pooled together. P values were calculated using a two-way analysis of variance (ANOVA) with a Fisher’s least significant difference test for multiple comparisons (b,m–o) or Wilcoxon rank-sum test (g–i). *P ≤ 0.05. The images of the needles, the tumour and the magnetic affinity cell sorting (MACS) set-up in a were created with BioRender.com.
To assess the effects of diet and immunotherapy at the cellular detail, fresh CD45+ and CD45− cells were isolated from tumours and subjected to single-cell RNA sequencing (scRNA-seq). Despite significant differences observed in tumour size, HFD treatment diet alone did not lead to a striking change in the relative abundance of CD45− epithelial cells or fibroblasts (Fig. 1c,d and Extended Data Fig. 2a). Anti-PD-1 treatment, however, resulted in a shift from cells identified as epithelial cells to cells identified as fibroblasts that may reflect the elimination of cancer cells. The CD45+ fraction, by contrast, revealed significant alterations to the tumour immune cell landscape in the HFD group (Fig. 1e,f and Extended Data Fig. 2b,c). HFD reduced the frequency of tumour-infiltrating lymphocytes (TILs) specifically effector CD8+ T cells, whereas CD4+ T cells were unchanged and macrophage abundance increased according to scRNA-seq. These population changes in frequency were confirmed by flow cytometry (Extended Data Fig. 2d–g). CD8+ TILs from HFD-treated mice exhibited a decreased effector molecule expression level with a reduced level of Gzmb expression, and less exhausted phenotypes with reduced levels of Havcr2 (TIM3) and Lag3 co-inhibitory receptor expression according to scRNA-seq (Fig. 1g–i). These did not reach statistical significance when assessed by flow cytometry, except for increased PD-1 expression on TAMs in HFD, which was also observed in the scRNA-seq gene expression analysis (Extended Data Fig. 2h–k). T cell receptor (TCR) sequencing revealed that CD8+ T cell clonality, a measure of the number of expanded clones and an indicator of anti-tumour activity, was decreased in the HFD group (Fig. 1j,k and Extended Data Fig. 3a,b). Anti-PD-1 treatment increased CD8+ T cell frequency and clonality to a similar proportion between LFD and HFD groups despite HFD CD8+ T cells starting at a reduced clonal state. We next applied Compass to the scRNA-seq gene expression data to better assess metabolic states of CD8+ T cells and TAMs with LFD versus HFD27. Whereas CD8+ T cell metabolism was moderately altered by HFD, TAMs had widespread metabolic changes, most notably in fatty acid oxidation (Fig. 1l).
Given the significant changes to TAMs in the HFD condition, these cells were isolated and characterized in greater depth. The levels of TAM functions, including phagocytosis and expression of receptors associated with antigen presentation through major histocompatibility complex class I molecules (MHC-I) and MHC-II, were decreased in HFD and seemed to be rescued following anti-PD-1 treatment (Fig. 1m–o and Extended Data Fig. 3c–e). The co-stimulatory protein CD80 was also significantly decreased in HFD TAMs (Extended Data Fig. 3f). HFD TAMs preferentially utilized glycolysis compared to LFD TAMs and this level of glycolysis was further increased with anti-PD-1 treatment (Extended Data Fig. 3g–i). HFD thus results in less activated and fewer clonally expanded CD8+ T cells while reprogramming metabolism and impairing phagocytosis and antigen presentation of TAMs, consistent with previous observations showing a role for PD-1 in TAMs28. In support of the role of PD-1 in regulating these phenotypes, each HFD-related impairment was reversed with anti-PD-1 blockade.
Obesity induces PD-1 expression on TAMs
Obesity-associated immunotherapy responses may occur through changes to T cell activation or sensitivity to anti-PD-1. Consistent with data in the literature9,11,29 and public databases, our findings show that CD8+ T cells and macrophages expressed PD-1 across a range of tumours (Extended Data Fig. 4a–c). Similarly, TAMs were more frequently PDCD1-expressing than macrophages in normal adjacent tissue in two independent scRNA-seq datasets of samples from patients with colon or kidney cancer30,31 (Extended Data Fig. 4d–g). However, PDCD1-expressing TAM frequencies did not correlate with tumour grade (Extended Data Fig. 4f,g). Analysis of differentially expressed genes in PDCD1-expressing TAMs compared to PDCD1-nonexpressing TAMs from the colon cancer dataset revealed a greater anabolic and inflammatory state of PDCD1-nonexpressing TAMs relative to an insulin response in PDCD1-expressing TAMs (Extended Data Fig. 4h). We next assessed PD-1 from patients with clear cell renal cell carcinoma by protein. PD-1 could be readily measured by flow cytometry in both CD8+ TILs and TAMs, with a lower expression level in TAMs relative to CD8+ TILs (Extended Data Fig. 5a–c and Supplementary Fig. 1). Notably, LAG3, but not TIM3, was also detected in TAMs (Extended Data Fig. 5d,e). Immunohistochemistry staining on a tumour microarray of more than 100 resected tumours from patients with kidney cancer showed co-localization of both T cell and macrophage markers with PD-1 (Extended Data Fig. 5f), with a trending increase in macrophage PD-1 when patients were stratified by BMI (Extended Data Fig. 5g). Similarly, immunohistochemistry staining of human endometrial tumour biopsies taken before and after a 10% body weight loss showed significant reduction in the abundance of PD-1-expressing TAMs and a trend in CD8+ TILs following weight loss (Fig. 2a–c, Extended Data Fig. 5h and Supplementary Table 1). In human clear cell renal cell carcinoma tumours, PD-1+ macrophages were distinct from the TREM2+ population that characterizes lipid-associated macrophages and may suppress anti-tumour immunity32,33 and were largely restricted to an F4/80hi population relative to other tumour myeloid populations in mouse MC38 tumours (Extended Data Fig. 5i–k and Supplementary Fig. 2).
Fig. 2 |. Obesity and obesity-associated signalling drive macrophage-specific PD-1.

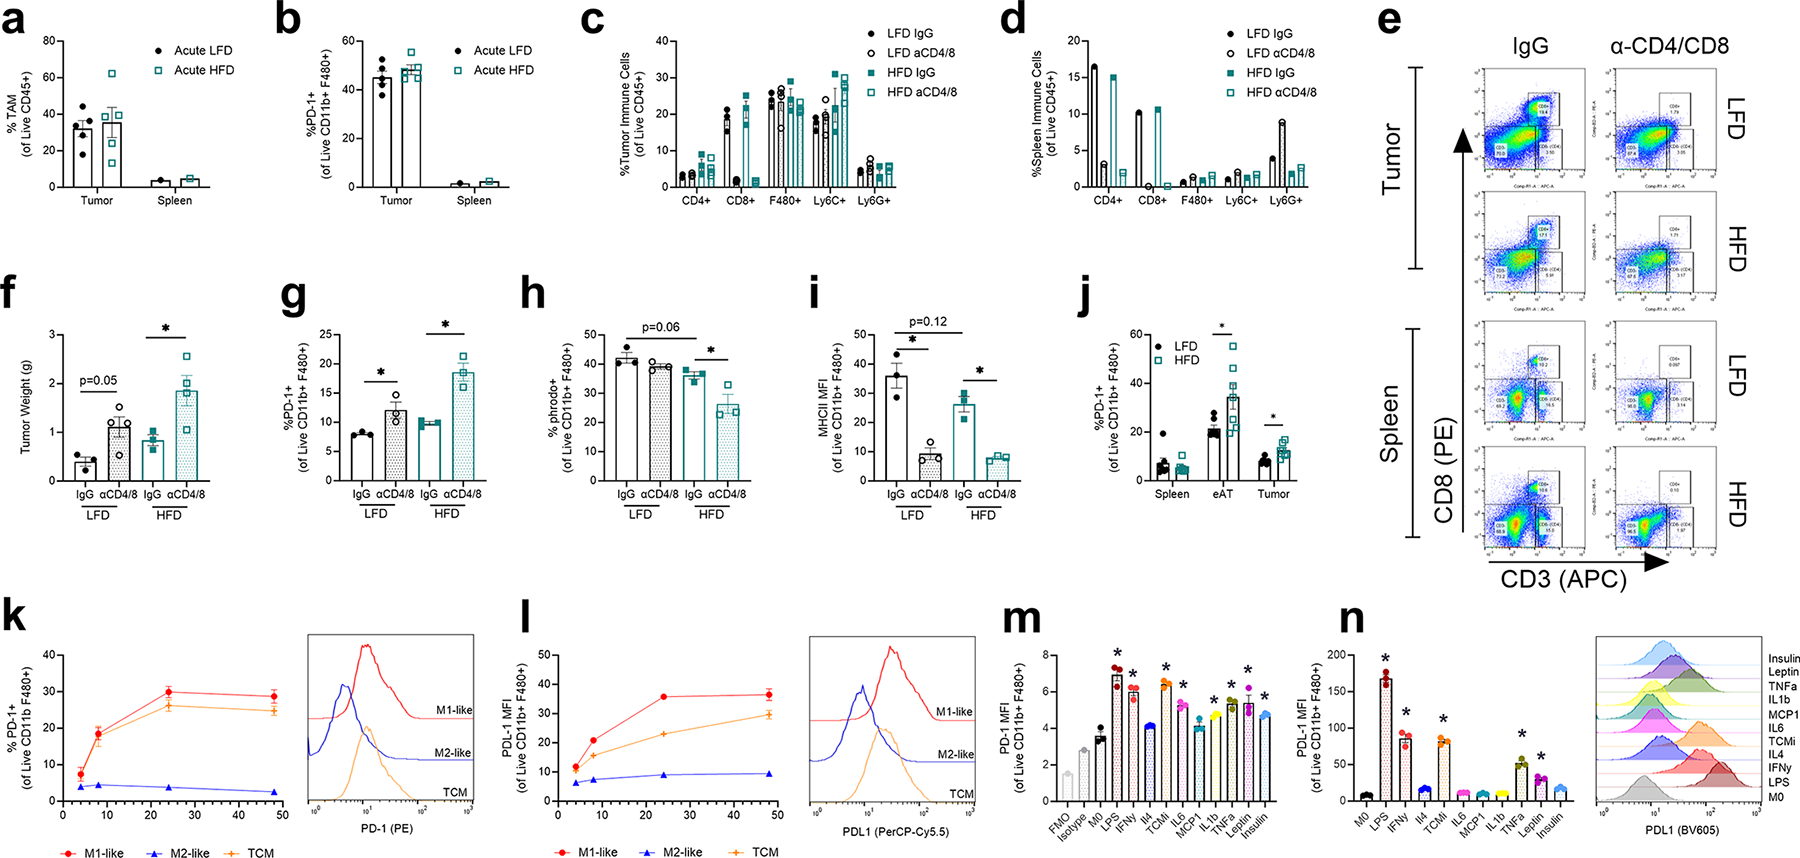
a,b, Area of co-localized staining of CD163+ PD-1+ TAMs (a) or CD8+ PD-1+ T cells (b), from endometrial carcinoma tumour tissues obtained from five patients before and after a body weight loss of at least 10%. Immunofluorescence staining was carried out on serial sections (4 μm thickness) of tumour tissue from formalin-fixed paraffin-embedded samples. c, Representative image of co-localized staining of CD163+ PD-1+ TAMs, from endometrial tumours from patients before and after weight loss (yellow arrows exemplify double positive stained TAMs). DAPI, 4′,6-diamidino-2-phenylindole. d,e, Percentage PD-1+ within CD8+ and F480+ gated live cells from LFD- and HFD-fed mice with representative histograms (n = 17 mice/treatment). f, Frequency of PD-1+ macrophages from bone marrow, gonadal adipose tissue (gAT), peritoneal exudate cells (PECs) or spleen from non-tumour-bearing mice fed a 60 kcal% HFD or 10 kcal% LFD for 20 weeks (n = 5 mice or treatments). g, Frequency of PD-1+ macrophages from bone marrow, gonadal adipose tissue, peritoneal exudate cells or spleen from 8-week-old mice with thioglycolate-induced peritonitis (n = 5 mice or treatments). h, PD-1 expression of BMDMs following 24-h exposure to LPS (1 ng ml−1), IFNγ (50 ng ml−1), IL-4 (50 ng ml−1), TCMi (25% tumour-conditioned medium), IL-6 (50 ng ml−1), MCP1 (also known as CCL2; 50 ng ml−1), IL-1β (50 ng ml−1), TNF (50 ng ml−1), leptin (5 mg ml−1) or insulin (100 mg ml−1) (n = 3 mice). i,j, Viability (i) and PD-1 expression (j) of BMDMs following 24-h treatment with increasing doses of BSA-conjugated palmitic acid (n = 3 mice); dotted horizontal line indicate mean of M0 control group. Data points in a,b indicate data for individual patients for pre-operative endometrial biopsies taken before weight loss and matched hysterectomy specimens taken after weight loss (n = 5 patients). In d–j, each data point represents a biological replicate; data are mean ± s.e.m.; data in e represent ≥4 independent experiments with ≥3 mice per diet group combined together. P values were calculated using a paired two-tailed t-test (a,b), an unpaired two-tailed t-test (d–g) or a one-way ANOVA compared to IgG or M0 (unstimulated BMDMs) (h–j). NS, P > 0.05; *P ≤ 0.05; **P ≤ 0.01.
The population of PD-1+ macrophages became selectively more abundant with obesity in mouse tumours and inflammation. Whereas there was no change in PD-1-expressing CD8+ T cells, HFD increased the proportion of PD-1+ TAMs (Fig. 2d,e and Extended Data Fig. 2h,j). This finding and associated changes to reduce TAM inflammatory functions while promoting lipid uptake were validated in multiple syngeneic models, including pancreatic and renal cancer models, an orthotopic breast cancer model and a genetically engineered spontaneous breast cancer model (Extended Data Fig. 6). The level of TAM-specific PD-1 expression did not change in response to an acute HFD treatment of 2 weeks (Extended Data Fig. 7a,b), but instead increased at the end time point concordant with onset of metabolic dysfunction. To determine the extent of T cell influence on TAM PD-1 expression, T cells were depleted by treatment with anti-CD4 and anti-CD8 antibodies. As expected, T cell deficiency enhanced tumour growth (Extended Data Fig. 7c–f and Supplementary Fig. 3). PD-1-expressing TAMs, however, continued to accumulate (Extended Data Fig. 7g) and remained poorly functional (Extended Data Fig. 7h,i). Non-tumour- and tumour-bearing HFD mice had selectively increased PD-1 expression levels in adipose tissue macrophages compared to LFD mice whereas bone marrow and spleen were unaffected (Fig. 2f and Extended Data Fig. 7j). Sterile inflammation in thioglycolate-induced peritonitis also induced PD-1 expression in peritoneal macrophages (Fig. 2g). These data support a model in which obesity, metabolic dysfunction and inflammation directly drive macrophage PD-1 expression irrespective of T cell signalling in obese adipose tissue and tumours.
Next we assessed inflammatory mechanisms that may induce PD-1 expression on macrophages. Bone-marrow-derived macrophages (BMDMs) were activated classically (M1-like) and alternatively (M2-like) with interferon-γ (IFNγ) or interleukin 4 (IL-4) treatments, respectively. To model TAMs, BMDMs were conditioned with MC38-tumour-conditioned medium (TCM). Both M1-like and TCM groups showed an increased level of PD-1 expression as early as 8 h following stimulation, whereas PD-1 expression did not change on M2-like macrophages (Extended Data Fig. 7k). The expression level of PD-L1, the ligand for PD-1 most notably expressed on cancer cells and TAMs34, increased similarly to that of PD-1 in M1 and TCM groups (Extended Data Fig. 7l). To further explore the influence of cytokines on macrophage PD-1 response, we treated BMDMs with cytokines and adipokines that are often increased in obesity35,36. In addition to lipopolysaccharide (LPS)29, the pro-inflammatory and obesity-associated cytokines and adipokines including IFNγ, IL-6, IL-1β, tumour necrosis factor (TNF), leptin and insulin all increased the level of PD-1 expression on BMDMs (Fig. 2h and Extended Data Fig. 7m). The level of PD-L1 also increased following treatment with LPS, IFNγ, TCM, TNF and leptin, whereas some cytokines such as IL-6 and IL-1β induced only PD-1 expression (Extended Data Fig. 7n). Obesity also increases the level of circulating free fatty acids37 and treatment with a saturated fatty acid, palmitic acid C16:0, resulted in a dose–response toxicity that inversely correlated with an increase in PD-1 expression (Fig. 2i,j). Although it was previously established that TAMs can express PD-1, which negatively correlates with phagocytic function9,28,29,38, our data now show that HFD-mediated obesity induces TAM PD-1 expression, which may be attributed to increased obesity-associated inflammatory cytokines, leptin, insulin and free fatty acids.
PD-1 impairs macrophage function
To better understand the regulation and role of PD-1, we analysed gene expression patterns associated with PD-1+ macrophages. Gene set enrichment comparing PD-1+ and PD-1− macrophages from the scRNA-seq dataset (Fig. 1e) showed that PD-1+ TAMs had signatures for cell cycle and mitochondrial metabolism whereas PD-1− TAMs had signatures for phagocytosis, inflammation and T cell activation (Extended Data Fig. 8a). Notable differentially expressed genes included Glud, Mecr and Atp5c1 in PD-1+ and B2m, Gapdh and Ldha in PD-1− TAMs (Extended Data Fig. 8b and Supplementary Table 2). To analyse PD-1+ TAMs in greater detail, PD-1+ TAMs and TAMs expressing PD-1 at low levels or negative for PD-1 expression (PD-1low/−) were fluorescence-activated cell sorting (FACS)-sorted for bulk RNA-seq (Supplementary Fig. 4). PD-1+ FACS gating was validated by a significantly increased level of Pdcd1 expression in PD-1+ sorted TAMs compared to the PD-1low/− population (Extended Data Fig. 8c). PD-1+ TAMs were enriched for proliferation, MYC and mTORC1 pathway signalling, whereas IL-6, transforming growth factor-β and TNF signalling pathways were predominant in PD-1− TAMs (Fig. 3a and Extended Data Fig. 8d). Consistent with these differentially expressed gene sets, FACS-sorted PD-1+- and PD-1low/−-tumour-conditioned macrophages confirmed an increase in the level of oxidative phosphorylation among the PD-1+ groups (Fig. 3b and Supplementary Fig. 5a). Additionally, gating on PD-1+ and PD-1low/− TAMs from MC38 tumours by flow cytometry confirmed that PD-1+ TAMs have an increased mitochondrial mass, an increased level of lipid uptake, a reduced level of phagocytosis and a reduced MHC-II expression level (Fig. 3c–f and Supplementary Fig. 5b,c). These data are consistent with PD-1 being a regulator of macrophage metabolism and function.
Fig. 3 |. PD-1-mediated macrophage dysfunction is dependent on mTOR and MYC activation.

a, Hallmark pathway analysis of differential gene expression of FACS-isolated PD-1low/− versus PD-1+ live CD11b+F480+ cells from MC38 tumours (n = 10 mice). b, Representative extracellular flux analysis of the oxygen consumption rate (OCR) of PD-1+ and PD-1low/− FACS-sorted TCM-stimulated BMDMs (left) with quantified basal respiration, maximal respiration and basal OCR/extracellular acidification rate (ECAR) ratio (right; each dot represents a technical replicate (n = 3); data representative of two independent experiments). c, MFI (left) and representative histogram (right) of MitoTracker Green staining of live PD-1low/− and PD-1+ TAMs from MC38 subcutaneous tumours. d–e, MFI (left) and representative histograms (right) of palmitate analogue BODIPY C:16 uptake in TAMs (d) and percentage pHrodo+ TAMs (left) and representative histogram (right) (e) from pancreatic subcutaneous tumours following 30 min acclimation and 45 min incubation with BODIPY dye or pHrodo beads. f, Percentage MHC-II+ TAMs (left) and representative histogram (right) from MC38 subcutaneous tumours. g, Histogram of MFI of pS6 from BMDMs treated with LPS (100 ng ml−1) for 24 h. h, Frequency of PD-1+ BMDMs treated with LPS with or without rapamycin (200 ng ml−1) for 24 h. i, Frequency of PD-1+ peritoneal macrophages following thioglycolate-induced peritonitis treated with or without rapamycin. j, MFI of PD-1 in immortalized cas9 BMDMs subjected to CRISPR-mediated Pten deletion compared to control immortalized cas9 BMDMs transduced with an empty vector. k, Frequency of PD-1+ BMDMs stimulated with LPS + IFNy for 24 h followed by 24 h treatment with metabolic inhibitors of glycolysis (2-DG, 5 mM), glutaminolysis (6-diazo-5-oxo-l-norleucine (DON), 5 mM) and fatty acid oxidation (etomoxir, 100 mM). Each data point represents a biological replicate unless stated otherwise and is presented as mean ± s.e.m.; in j data point represents an independent trial that indicates the average of three technical replicates per trial. P values were calculated using a paired two-tailed t-test unless stated otherwise. P values in b,i were calculated using an unpaired two-tailed t-test. P values in k were calculated using a one-way ANOVA (NS, P > 0.05; *P ≤ 0.05; **P ≤ 0.01; ***P ≤ 0.001; ****P ≤ 0.001).
On the basis of the gene signature for MYC and mTORC1 activity (Fig. 3a and Extended Data Fig. 8d) and the described role of NF-κB to upregulate PD-1 in macrophages29, we next tested whether these pathways regulate PD-1 expression. LPS effectively increased expression of the downstream mTORC1 mediator, pS6, in macrophages (Fig. 3g). In vitro inhibition of MYC, NF-κB or mTORC1 reduced PD-1 expression in LPS-treated BMDMs, immortalized BMDMs or monocytic RAW264.7 cells (Fig. 3h and Extended Data Fig. 9a–c). Similarly, in vivo treatment with rapamycin reduced the level of thioglycolate-induced PD-1 expression in peritoneal macrophages (Fig. 3i). To genetically test the role of mTORC1, CRISPR was used to delete Pten and activate the PI3K–mTORC1 pathway in immortalized BMDMs. PTEN-deficient cells were found to have increased basal PD-1 expression (Fig. 3j, Extended Data Fig. 9d and Supplementary Fig. 6). These data were recapitulated in humans through RNA-seq analysis, as the level of expression of PDCD1 was elevated in monocytes enriched from peripheral blood mononuclear cells from a patient deficient in PTEN compared to healthy donor controls (Extended Data Fig. 9e).
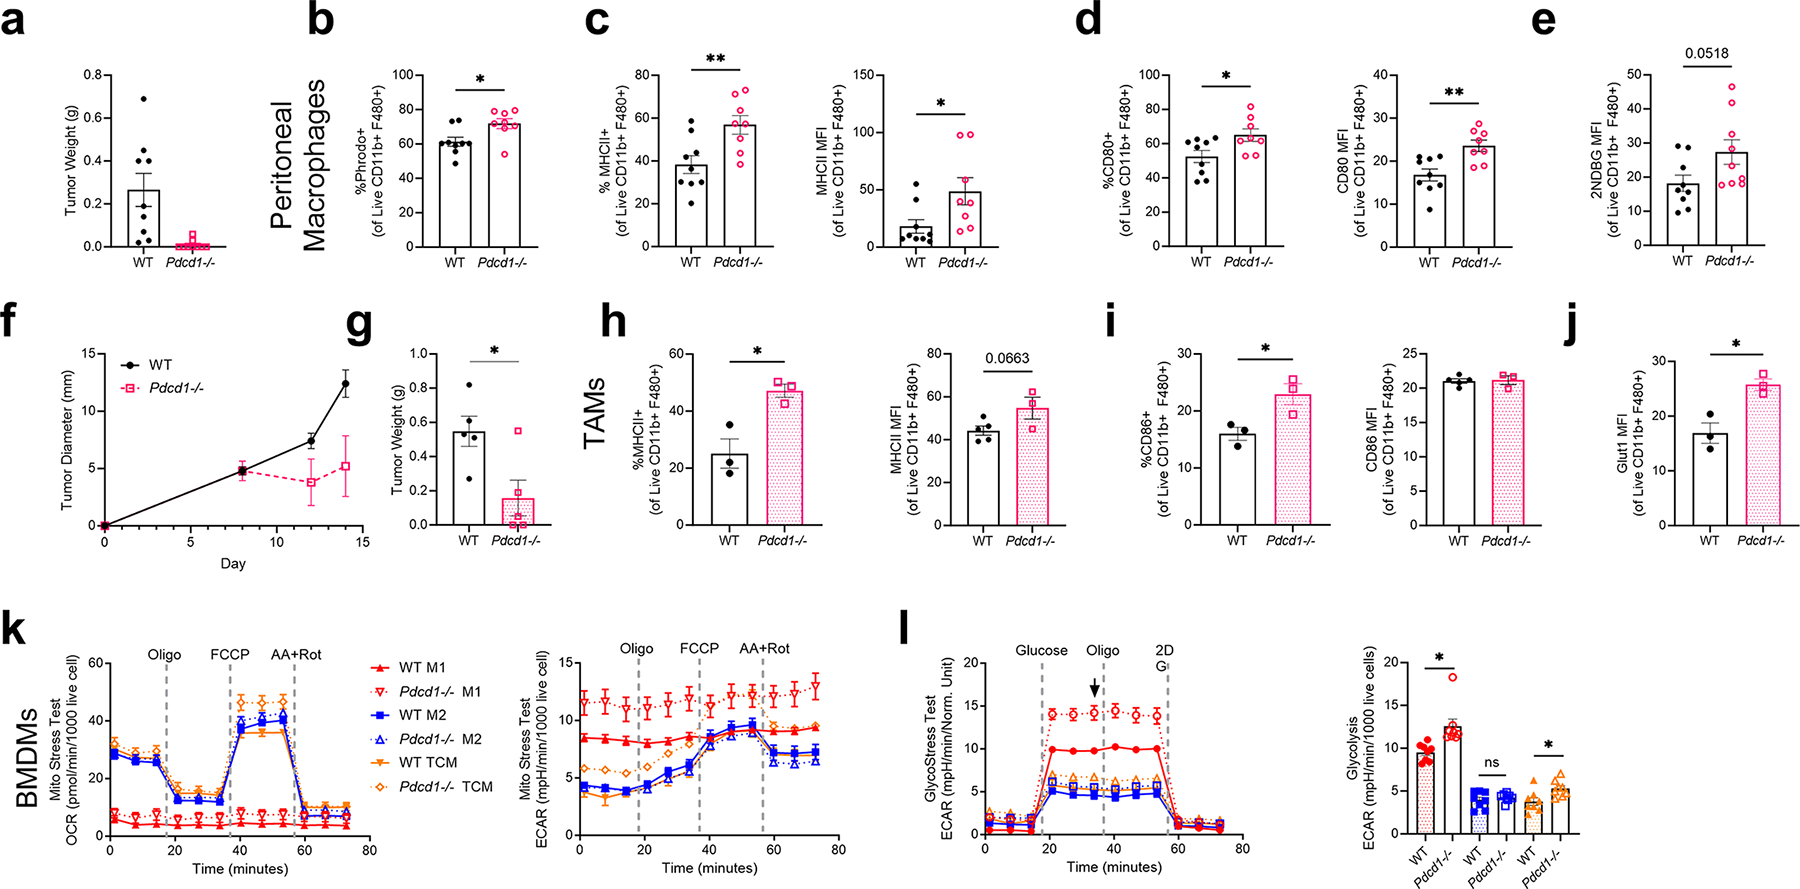
PD-1 was next tested for a direct role in regulating macrophages. As whole-body PD-1 deficiency strongly suppressed MC38 syngeneic tumour growth (Extended Data Fig. 10a), peritoneal macrophages from tumour-exposed Pdcd1−/− mice were analysed. Pdcd1−/− macrophages had a more pro-inflammatory state as shown by increased levels of phagocytosis, MHC-II and CD80 expression, and glucose uptake (Extended Data Fig. 10b–e). In subsequent experiments with injection of increased MC38 cell numbers, Pdcd1−/− significantly reduced but did not prevent tumour growth and, consistent with the results for peritoneal macrophages, our data showed that TAMs exhibited an increased inflammatory state evident through increased levels of MHC-II, CD86 and GLUT1 expression (Extended Data Fig. 10f–j).
Inflammatory activation cues induce macrophage glycolysis, which is then required for normal inflammatory functions39. This was regulated by PD-1, as in vitro-stimulated M1-like, M2-like and TCM BMDMs from Pdcd1−/− mice preferentially increased the level of glycolysis as indicated by extracellular acidification (Extended Data Fig. 10k,l). Conversely, macrophage induction of PD-1 required glucose metabolism. The level of PD-1 expression in M1-like-stimulated BMDMs was reduced when glycolysis was inhibited with the glucose analogue 2-deoxyglucose (2-DG) but was unaffected by inhibition of glutaminolysis or lipid oxidation (Fig. 3k). As Pdcd1−/− macrophages may be altered developmentally or by other cells, wild-type BMDMs were treated directly with recombinant mouse PD-L1 (rmPD-L1) or anti-PD-1 blocking antibody. Whereas there were no changes in oxygen consumption (Extended Data Fig. 11a), saturating PD-1-expressing macrophages with rmPD-L1 decreased the level of glycolysis and increased lipid uptake and these phenotypes were reversed with PD-1 blocking antibody (Fig. 4a–c and Extended Data Fig. 11b,c). CD11b+ myeloid cells from MC38 tumours were next isolated from lean and obese mice and cultured with or without anti-PD-1 blocking antibody. Blocking PD-1 increased the levels of phagocytosis and inducible nitric oxide synthase (iNOS), GLUT1, CD80, MHC-I and MHC-II expression in MC38 TAMs compared to IgG treatment (Fig. 4d and Extended Data Fig. 11d–f). Notably, MC38 TAMs taken from lean or obese MC38-tumour-bearing mice responded similarly to anti-PD-1 treatment (Fig. 4d and Extended Data Fig. 11g). RNA-seq showed that PD-1 blockade on isolated TAMs led to a wide range of inflammatory and metabolic gene changes, including increased levels of expression of Tnf, Il12a and the succinate transporter Slc13a3 and a decreased expression level of Trem2 (Fig. 4e and Extended Data Fig. 11h). The pro-inflammatory effects of blocking PD-1 were dependent on an increased level of glycolysis, as treatment with 2-DG prevented MHC-II, MHC-I and CD80 expression in anti-PD-1-treated BMDMs (Fig. 4f–h). Taken together, these data suggest that inflammatory signals that activate glycolysis also induce PD-1 expression through mTORC1, and PD-1 then provides feedback to inhibit macrophage glycolysis and inflammatory functions and instead promote lipid uptake and metabolism.
Fig. 4 |. Anti-PD-1 directly rescues macrophage anti-tumour function and metabolism.

a, ECAR from extracellular flux analysis of a GlycoStress test of TCM-stimulated BMDMs following rmPD-L1 (1 mg) and anti-PD-1 (1 mg) treatment with quantified maximal glycolysis (n = 4 mice run in triplicate). b, ECAR from a MitoStress test of TCM-stimulated BMDMs following rmPD-L1 (1 mg) and anti-PD-1 (1 mg) treatment (left) with quantified basal (middle) and maximal (right) ECAR (n = 4 mice run in triplicate). c, MFI of BODIPY C:16 uptake of TCM-stimulated BMDMs treated with rmPD-L1 and/or anti-PD-1. d, MFI or percentage positive of GLUT1, MHC-II+, MHC-I and iNOS from TAMs isolated from MC38 tumours from LFD- or HFD-treated mice and ex vivo-treated with anti-PD-1 for 24 h. e, Kyoto Encyclopedia of Genes and Genomes pathway analysis of differentially expressed genes from MACS-enriched CD11b+ cells from MC38 tumours ex vivo-treated with or without anti-PD-1 (1 μg ml−1) for 24 h. All pathways indicated are M. musculus (house mouse). f–h, MFI of MHC-I (g), MHC-II (f) and CD86 (h) expression in BMDMs stimulated with IFNy and treated with IgG or anti-PD-1 and with or without 2-DG for 24 h. Each data point represents a biological replicate unless stated otherwise and is presented as mean ± s.e.m. P values were calculated using a one-way ANOVA (a–c), a paired two-tailed t-test (d) or a two-way ANOVA (f–h). *P ≤ 0.05; **P ≤ 0.01; ***P ≤ 0.001.
Myeloid PD-1 impairs anti-tumour immunity
Our data show that obesity-induced PD-1 expression can directly reduce macrophage function. We next tested whether PD-1 directly regulated macrophage function in the tumour microenvironment or whether PD-1 effects depended on T cells. T cell-depleted tumours exhibited an increased level of growth but still responded to anti-PD-1 treatment (Fig. 5a and Supplementary Fig. 7a–c). Notably, TAMs in T cell-depleted tumour microenvironments responded to anti-PD-1 treatment through an increased level of phagocytosis, decreased lipid uptake and a trend to increase the glucose transporter GLUT1 (Fig. 5b–d). To directly test a myeloid-intrinsic role for PD-1, LysMCre Pdcd1fl/fl animals were subjected to the same MC38 tumour model. PD-1-deficient myeloid cells effectively reduced tumour growth (Fig. 5e), consistent with the full-body knockout (Extended Data Fig. 10f,g) and previous findings11,28. PD-1-deficient tumour CD11b+ myeloid cells exhibited enhanced phagocytosis, a reduced level of lipid uptake and broadly increased metabolic activity compared to wild-type TAMs, suggesting increased anabolic metabolism and an improved ability to present antigens and activate T cells (Fig. 5f–h and Extended Data Fig. 12a–d). Consistent with an increased level of T cell interactions, improved T cell activation and proliferation were observed when PD-1-deficient CD11b+ tumour myeloid cells were co-cultured with naive non-tumour-bearing splenic OVA-specific CD8+ T cells and their antigen OVA peptide, SIINFEKL (Fig. 5i) Additionally, TAMs co-cultured with OVA-specific CD8+ T cells showed enhanced antigen presentation and an increased level of CD8+ T cell granzyme B expression when cultured with a full OVA protein, which does not activate OTI CD8+ T cells alone without an antigen-presenting cell (Fig. 5j). Further, T cells in these tumours exhibited reduced levels of expression of the co-inhibitory markers PD-1, LAG3 and TIM3 whereas the CD69 expression level was unchanged (Fig. 5k and Extended Data Fig. 12e–h). These myeloid-specific effects were not due to myeloid-derived suppressor cell contamination, as similar experiments that isolated CD11b+GR-1− TAMs also resulted in increased metabolic activity and improved antigen presentation and activation of CD8+ T cells (Extended Data Fig. 12i–n). PD-1 thus provides inflammation-induced direct feedback on macrophage glycolytic metabolism and function to regulate anti-tumour immunity and this pathway is enhanced in obesity.
Fig. 5 |. Targeting macrophage-specific PD-1 improves T cell-mediated anti-tumour immunity.

a, Tumour weight on day 16 of MC38 tumour in mice treated with anti-CD4 and anti-CD8 cocktail on days −1, 2, 7, 12 and 15 and 200 mg anti-PD-1 or IgG on days 9, 11, 13 and 15. b, Frequency of pHrodo+ CD11b+F480+ TAMs from MC38 tumours. c,d, MFI of BODIPY C:16 uptake (c) and GLUT1 expression (d) in macrophages from MC38 tumours. MFI values were normalized within trials to IgG controls. Data are combined from two independent experiments e, Tumour diameter over time following injection of MC38 cells in wild-type (WT) versus LysMCre Pdcd1fl/fl male mice. f, Frequency of pHrodo+ CD11b+F480+ TAMs. g, MFI of BODIPY C:16 uptake of TAMs. h, OCR measurement over time from a MitoStress test (left) and ECAR measurement over time from a GlycoStress test (right) of MACS-isolated CD11b+ cells from MC38 tumours in wild-type versus LysMCre Pdcd1fl/fl male mice. i, Left: division index calculated from flow cytometry analysis of CellTrace Violet (CTV) staining. CD11b+ cells isolated from MC38 tumours from wild-type or LysMCre Pdcd1fl/fl mice were co-cultured with isolated CD8+ OT1 splenocytes in the presence of 1 mg SIINFEKL for 2 days. Right: histogram of CellTrace Violet staining of co-cultured SIINFEKL-treated CD8+ T cells with unstimulated CD8+ T cells. Stim, stimulation. j, MFI of granzyme B expression in CD8+ T cells co-cultured at 4:1 with MACS-isolated CD11b+ cells from MC38 tumours k, Percentage of PD-1+CD8+ T cells from MC38 tumours of wild-type and LysMCre Pdcd1fl/fl mice (left) with histogram (right). Data in a–d are combined from two independent trials and normalized to IgG control within each trial. Data in e–k represent ≥3 independent experiments. Data are mean ± s.e.m. P values were calculated using a two-way ANOVA with a Fisher’s least significant difference test for multiple comparisons (a–d) and an unpaired two-tailed t-test (e–k). *P ≤ 0.05; **P ≤ 0.001.
Myeloid PD-1 promotes an obesity paradox
Obesity promotes tumour initiation and progression but can also augment responses to immunotherapy, contributing to the observed paradox. These effects of obesity occur in part through direct action of cytokines and altered metabolites on cancer cells, but probably also occur through modulation of anti-tumour immunity. PD-1 itself contributes to this obesity–cancer connection as obesity-associated inflammatory cues and an increased level of glycolysis upregulated PD-1 on macrophages through mTORC1 in negative feedback to dampen glycolysis and inflammation. This was selective for macrophages exposed locally to inflammatory cues, as the level of PD-1 expression on tumour-infiltrating T cells was not altered and splenic macrophages did not increase the PD-1 expression level, nor was the level of PD-1 expression increased in other tumour myeloid cells. An obesity-driven shift in immune cell populations has the potential to reshape the tumour immune microenvironment through impaired macrophage function. Notably, the PD-1+ TAM population was separate from TREM2+ TAMs, although PD-1 may ultimately promote a transition to this population. DIO decreased the ability of macrophages to uptake and present antigens to T cells ultimately reducing T cell-mediated immune surveillance that could allow more rapid tumour growth. Responses to the widely used PD-1 checkpoint therapy may subsequently be enhanced in individuals with high BMIs by combined actions of releasing obesity-associated inhibition of macrophages, a less exhausted T cell population and increased T cell function. Notably, PD-1 expression acts directly on macrophages to affect pro-inflammatory anti-tumour function and metabolism. These findings identify PD-1 as a metabolic regulator of TAM and reveal a unique PD-1-mediated and macrophage-specific mechanism for immune tumour surveillance and checkpoint blockade. It is important to note that the direct effects of PD-1 were tested in settings in which other innate immune cells, such as dendritic cells, may also be affected. Future work will be needed to explore the impacts on and by these other myeloid cells in the tumour microenvironment and the effects of different diets. In addition, it would be important to explore the role of combination therapies with this newly identified mechanism of anti-PD-1. It remains unclear whether macrophage expression of PD-1 may provide a prognostic indicator for immune checkpoint therapies. These findings provide mechanistic insight into obesity, HFD and immune checkpoint therapies and the role of immune checkpoints in obesity-associated cancers. Obesity-associated inflammation and fatty acids provide a metabolic link in macrophage-specific PD-1 expression. Taken together, our findings uncover an obesity–cancer connection through induction of PD-1 on macrophages and an alternative mechanism for the obesity paradox of immune checkpoint therapy, in which PD-1 blockade directly enhances TAM-mediated stimulation of anti-tumour T cells.
Methods
Mice
C57BL/6J (stock number 000664), Pdcd1−/− (stock number 028276), OTI transgenic (stock number 003831) and DIO (stock number 380050; number 380056) mice were purchased from The Jackson Laboratory. LysMCre Pdcd1fl/fl mice were provided by Dr Vassiliki A. Boussiotis of Harvard Medical School. All mouse procedures were carried out under Institutional Animal Care and Use Committee (IACUC)-approved protocols from the Vanderbilt University Medical Center (VUMC) and conformed to all relevant regulatory standards. Mice were housed in ventilated cages with at most five mice per cage and were provided with ad libitum food and water. Mice were maintained on 12-h light–dark cycles that coincided with daylight in Nashville, TN. The mouse housing facility was maintained at 20–25 °C and 30–70% humidity.
Diet treatment
For DIO experiments, male C57BL/6J mice starting at 6–10 weeks old were randomly assigned to cages (5 mice per cage) to receive a 45 kcal% fat diet (Research Diets D12451) or a 10 kcal% sucrose-matched control diet (Research Diets, D12450H). Mice were maintained on their respective diet for 20–25 weeks before initiating subcutaneous injectable tumour studies. Metabolic parameters were assessed at 19–21 weeks of dietary treatment. After a 5-h fast, blood samples were collected from the tip of the tail. Blood glucose concentrations were determined in whole blood using a glucometer (Bayer Contour). Collected blood was centrifuged at 4,000 r.p.m. for 10 min at 4 °C. Plasma was aliquoted and stored at −80 °C until analysis. Plasma insulin (Mercodia) concentrations were analysed using a commercial ELISA kit according to the manufacturer’s instructions. For the orthotopic EO771 tumour model, female C57BL6/J mice were ovariectomized at 6 weeks of age (Vanderbilt Mouse Metabolic Phenotyping Center) and fed a chow diet for 2 weeks during recovery. At 8 weeks of age, all mice were placed on a 10 kcal% fat diet (Research Diets D12450B). After 12 weeks on the diet, the DIO group was switched to and maintained on a 60 kcal% fat diet (Research Diets D12492) for the duration of the study. After a total of 20 weeks on the diet, all mice received orthotopic injection of 3 × 10⁵ GFP-expressing, PD-L1-overexpressing E0771 breast cancer cells (a gift from Jennifer Pietenpol) in the fourth left mammary fat pad. Once palpable, tumours were measured every 2 days using callipers. Tumours were allowed to grow for 28 days, at which point all mice were euthanized. For the PyMT mouse model, all mice were maintained following a protocol approved by the Vanderbilt University Institutional Animal Care and Use Committee (M1700029). Diabetes was induced in female B6.FVB-Tg(MMTV-PyVT)634Mul/LellJ mice as previously described40. Briefly, FVB/MMTV-PyMT mice were fed a 60 kcal% fat diet (NC0004611, Research Diet) starting at 4 weeks of age. Diabetes was induced through intraperitoneal injection at 5 weeks of age with five consecutive daily doses of streptozotocin (MilliporeSigma), a small molecule that specifically causes destruction of β-islet cells, at a concentration 70 mg per kilogram of body weight. Blood glucose was monitored weekly throughout the duration of the experiment. Blood glucose levels above 400 mg dl−1 were considered diabetic. Mice were humanely euthanized by CO2 asphyxiation at 12 weeks of age. For injectable tumour models, mice were injected subcutaneously in the posterior flank with 5 × 10⁵ MC38 cells, 2 × 10⁵ 6419c5 cells, 2 × 10⁶ LVRCC cells and 3 × 10⁵ EO771 cells. For non-DIO experiments, mice were injected subcutaneously with 2 × 10⁶ MC38 cells. Once palpable tumours were present, tumour measurements were carried out using a calliper every 2–3 days. Mice were euthanized if the IACUC-approved humane end points were reached. In immunotherapy studies, tumour-bearing mice were randomly assigned to receive intraperitoneal injections of either 200 μg anti-mouse PD-1 antibody (RMP1-14; BioXCell) in 200 μl PBS or 200 μg rat IgG2a isotype control (2A3; BioXCell) in 200 μl PBS on days 9, 11, 13 and 15 post tumour injection. For antibody-mediated T cell depletion, mice were treated with depleting antibodies or isotype control delivered by intraperitoneal injection on days −1 (200 μg), 2 (200 μg), 7 (200 μg), 12 (200 μg) and 16 (200 μg) relative to tumour injection (day 0). For T cell depletion experiments, the following antibodies were used: rat IgG2b isotype control (BioXCell, Clone 2A3), anti-CD8α (BioXCell, Clone 2.43) and anti-CD4 (BioXCell, Clone GK1.5).
Cell lines and primary macrophage isolation
MC38, EO771, RAW264.7, immortalized BMDMs and 6419c5 cells were grown in RPMI supplemented with 10% FBS and 1% penicillin–streptomycin at 37 °C in a humidified 5% CO2 incubator. LVRCC cells were grown in Dulbecco’s modified Eagle’s medium and Ham’s F12 mixed 1:1 (Gibco; 11320-033) supplemented with 0% FBS and 1% penicillin–streptomycin, 5 μg ml−1 insulin (Sigma, I6634), 1.25 ng ml−1 prostaglandin E1 (PGE1; Sigma; P7527), 34 pg ml−1 triiodothyronine (T3; Sigma; T5516), 5 μg ml−1 apo-transferrin bovine (Sigma; T1428), 1.73 ng ml−1 sodium selenite (Sigma; S5261), 18 ng ml−1 hydrocortisone (Sigma; H0396), 25 ng ml−1 epidermal growth factor (Invitrogen; 13247051). All FBS was heat-inactivated before use. For primary macrophage experiments, bone marrow was flushed from femurs of 6–10-week-old mice and incubated in the presence of 20ng ml−1 M-CSF (Peprotech) for 5 days. BMDMs were stimulated with 50 ng ml−1 IFNγ or IL-4 or 25% MC38-conditioned medium for 24 h before further analysis. Following stimulation, BMDMs were treated with 1 μg anti-mouse PD-1 antibody (RMP1-14; BioXCell) followed by 1 μg rmPD-L1/B7-H1 His Tag Protein (R&D Systems, 9048-B7) for an additional 24 h before flow cytometry analysis, bulk RNA-seq analysis or metabolic flux assay. For metabolic inhibitor assays, macrophages were treated following stimulation for an additional 24 h with DON (5 μM, Sigma-Aldrich D2131), 2-DG (5 mM, Cayman Chemical 14325) or etomoxir (100 μM, Cayman Chemical, 11969), or an equal volume of PBS vehicle was added. For signalling inhibitor assays, macrophages were treated following stimulation for an additional 24 h with MYC inhibitors (KJ Pyr 9, MedChemExpress, 10 μg ml−1 and 10058-F4, MedChemExpress, 10 μg ml−1), mTOR inhibitor (rapamycin, Sigma, 87.5 ng ml−1), AMPK agonist (AICAR, Sigma, 52.5 g ml−1) and NF-κB inhibitor (BMS-345541, Sigma, 150 μg ml−1). Conditioned medium was obtained by growing MC38 cells to 90% confluence and treating them with 50 ng ml−1 IFNγ for 24 h. Following treatment, cells were washed and incubated with fresh medium for another 24 h. Supernatant of treated MC38 cells was sterile filtered through a 0.45 μM filter and frozen into small aliquots for subsequent use. For thioglycolate-induced peritonitis, mice were injected intraperitoneally with 1 ml of 3% (v/v) thioglycolate (BD) that had been autoclaved and protected from light. Peritoneal exudate cells were isolated by flushing the peritoneal cavity of 6–10-week-old mice with 10 ml of medium. Peritoneal exudate cells were analysed directly through flow cytometry or subsequently cultured in tissue culture-treated plates in MCSF-containing medium for 24 h. Non-adherent cells were washed away after 24 h, and adherent cells were identified as peritoneal macrophages and used in subsequent analysis with a Seahorse phagocytosis or nutrient uptake assay. To detach adherent BMDM or pMacs, cells were washed with PBS and incubated in 0.05% trypsin for 5 min before being gently scraped with a cell scraper.
For CRISPR-mediated Pten deletion in macrophages, immortalized cas9 BMDMs were transduced with lentivirus (pLentiGuide-puro) expressing two gRNAs targeting the mouse Pten proximal promoter and 5′ UTR region. The controls were transduced with an empty vector. Pten-knockout cells were selected using puromycin and clones were obtained by limiting dilution.
Tissue dissociation
Mice were euthanized and spleen and tumours were collected as previously described41,42. Single-cell suspensions of splenocytes were prepared by mechanical dissociation followed by ACK lysis. Tumours were chopped, mechanically dissociated on the Miltenyi gentleMACS Octo Dissociator with Heaters (setting implant tumour one) and digested in 435 U ml−1 DNase I (Sigma-Aldrich, D5025) and 218 U ml−1 collagenase (Sigma-Aldrich, C2674) at 37 °C for 30 min. After enzyme treatment, tumours were passed through a 70-μm filter and ACK-lysed. Cells were resuspended in complete RPMI and counted using trypan blue with the TC20 Automated Cell Counter (Bio-Rad). Next, cell suspensions were fractionated using magnetic bead positive selection according to the manufacturer’s instructions (all Miltenyi mouse kits: CD45 TIL 130-110-618, Dead cell removal kit 130-090-101, CD11b 130-049-601). In brief, cells were resuspended at 10 million total cells per 90 μl MACS buffer and 10 μl microbeads for 15 min. Then, cell suspensions were applied to LS columns (Miltenyi, 130-042-401) in Miltenyi QuadroMACS Separators, washed and eluted according to the manufacturer’s instructions.
Mouse flow cytometry
Single-cell suspensions obtained from tumours, spleens or primary cell culture were incubated in Fc block (1:50, BD, 553142) for 10 min at room temperature, stained for surface markers for 15 min at room temperature, washed with FACS buffer (PBS + 2% FBS) once and resuspended in FACS buffer for analysis on a Miltenyi MACSQuant Analyzer 10 or 16. For intracellular staining, the eBioscience FOXP3/transcription factor staining buffer kit (Thermo Fisher Scientific, 00-5523-00) was used. Surface staining was carried out as described above, cells were fixed and permeabilized for 20 min at 4 °C, and then stained for intracellular markers for at least 30 min at 4 °C. Ghost Dye Red 780 viability dye (1:4,000, Cell Signaling, 18452S) was used identically to surface antibodies. Anti-mouse and cross-reactive antibodies used were: CD45–BV510 (1:1,600, 30-F11, Biolegend, 103138), B220–e450 (1:400, RA3-6B2, Thermo Fisher Scientific, 48-0452-82), CD11b–e450 (1:1,600, M1/70, Thermo Fisher Scientific, 48-0112-82), CD11b–FITC (1:1,600, M1/70, Biolegend, 101206), CD8A–AF488 (1:1,600, 53–6.7, Biolegend, 100723), CD8A–BV510 (1:600, 53–6.7, BD, 563068), LY6C–FITC (1:4,000, HK1.4, Biolegend, 128006), CD11C–PE (1:1,000, N418, BioLegend, 117308), FOXP3–PE (1:125, FJK-16 s, Thermo Fisher Scientific, 12-5773-82), CD4–PerCP–Cy5.5 (1:600, RM4-5, BioLegend, 100540), LY6G–PerCP–Cy5.5 (1:800, 1A8, BioLegend, 127616), F4/80–PE–Cy7 (1:800, BM8, BioLegend, 123114), NKp46–PE–Cy7 (1:200, 29A1.4, BioLegend, 137618), CD3–PE–Cy7 (1:200, 17A2, BioLegend, 100220), CD3–FITC (1:200, 17A2, BioLegend, 100204), CD3–APC (1:200 17A2, BioLegend, 100236), CD206–APC (1:500, C068C2, BioLegend, 141708), GLUT1–AF647 (1:500, EPR3915, Abcam, ab195020), MHC-II I-A/I-E–APC (1:4,000, M5/114.15.2, BioLegend, 107614), LAG3–e450 (1:100, eBioC9B7W, Thermo Fisher Scientific, 48-2231-82), PD-1–PE (1:100, 29F-1A12, BioLegend, 135206), TIM3–APC (1:100, RMT3-23, BioLegend, 119706), CD44–PE–Cy7 (1:1,000, IM7, BioLegend, 103030), CD80 (1:200, 16-10A1, BioLegend, 104713), CD86–APC (1:200, GL-1, BioLegend, 10511), MHC-II–FITC (1:400, BioLegend, 107605), PD-L1–BV605 (1:400, BioLegend, 124321) and MHC-I–FITC (1:800, BioLegend, 107605). The anti-human antibodies used were: CD45–BV421 (1:400, HI30, BioLegend, 304032), CD3–APC (1:200, UCHT1, BioLegend, 300439), CD8–FITC (1:200, SK1, Invitrogen), PD-1–PE (1:40, J105, eBioscience), CD11b–PerCP–Cy5.5 (1:200, ICRF44, BioLegend, 301328), CD14–BV510 (1:200, M5E2, BioLegend, 301842), CD68–BV421 (1:500, Y1/82A, eBioscience) CD163–PE–Cy7 (1:200, GHI/61, eBioscience), TREM2–APC (1:25, 237920, Novus) and human Fc block (1:50, BD 564220). In appropriate cases, an FMO or FMO + antibody class and type-matched isotype with appropriate flourophore controls were used to ensure accurate flow gating for PD-1+ expression. For ex vivo fluorescent palmitate or glucose uptake, tumour single-cell suspensions were acclimated for 45 min in XF RPMI with 200 mM l-glutamine (Agilent 103681-100) at 37 °C, 5% CO2, incubated with BODIPY FL C16 (1 μM in XF RPMI) and 2-NBDG (100 μM Sigma A8625), for 45 min, washed twice with FACS and then stained for surface markers. For phagocytosis assay, single-cell suspensions were incubated for 45 min with 100μg ml−1 of pHrodo red Escherichia coli beads (Invitrogen P35361).
For myeloid suppression assays, microbead-isolated CD11b+ myeloid cells were plated in 96-well plates and serially diluted starting at 4 × 10⁵ cells per well. Microbead-isolated CD8+ splenocytes (1 × 10⁵ cells per well) from OTI TCR-transgenic mice were isolated using a negative isolation kit (Miltenyi 130-095-236) and were stained with CellTrace Violet and plated in the CD11b-plated wells at 105 cells per well in addition to 1 μg ml−1 SIINFEKL peptide (Sigma-Aldrich S7951). CellTrace Violet (Thermo Fisher Scientific, C34557) was used at 1:1,000 for cell proliferation assays. CD11b–CD8 co-cultures were incubated in Dulbecco’s modified Eagle’s medium containing 5% FCS, 2 mM glutamine, 100 units ml−1 penicillin–streptomycin, 10 mM HEPES and 20 μM β-mercaptoethanol for 48–72 h. As positive and negative controls, CD8+ OTI splenocytes alone were incubated with 1 μg ml−1 SIINFEKL peptide or no peptide, respectively. Flow cytometry data were analysed using FlowJo v10.7.1. For the antigen presentation assay, CD11b–CD8 co-cultures were prepared identically to those for the suppression assay and incubated with 1 mg ml−1 OVA protein (Ovalbumin, 323–329, Japanese quail, Sigma, O1641) for 5 days before analysis using flow cytometry. Additionally, positive fraction MACS isolation of GR-1− (Miltenyi 130-094-538) cells followed by CD11b+ cells were used for co-culture with CD8+ T cells for the antigen presentation assay. The division index was calculated using FlowJo v10.7.1 software and represents the total number of divisions divided by the number of cells at the start of the culture.
Extracellular flux assay
For isolated TAMs, BMDMs and peritoneal macrophages, cells were plated at 50,000–100,000 live cells per well in at least four technical replicates on a Cell-Tak-coated plate (Corning 354240) in Agilent Seahorse RPMI 1640 supplemented with 10 mM glucose, 1 mM sodium pyruvate and 2 mM glutamine (for the GlycoStress test, RPMI without glucose and sodium pyruvate was used). Cells were analysed on a Seahorse XFe 96 bioanalyser using the MitoStress assay with 1 μM oligomycin, 2 μM FCCP and 0.5 μM rotenone and antimycin A or the GlycoStress assay with 10 mM glucose, 1 μM oligomycin and 50 mM 2-DG. Data were analysed in Agilent Wave software v2.6. For cell normalization, following MitoStress or GlycoStress assays, cells were stained with propidium iodide (eBioscience 00-6990-50) and Hoechst (Thermo Fischer 62249) for 15 min. Dead cells and total cells were counted using Cytation 5 and live cell number was calculated (as total (Hoechst positive) − dead (PI positive) cells) before being imported into the wave normalization software and OCR/ECAR data were presented as per 1,000 live cells.
Immunofluorescence staining and TMA
Human clear cell renal cell carcinoma (ccRCC) TMAs were provided by Scott Haake and Vanderbilt University Medical Center. Paraffin-embedded TMA slides were prepared for immunofluorescence and stained with anti-PD-1 (abcam number 52587; 1:250), anti-CD163 (abcam number 189915; 1:1,000) and anti-CD8 (Cell Signaling number 70306S; 1:500) as previously described43. Briefly, slides were deparaffinized in xylene and rehydrated in serial ethanol dilutions. Antigen retrieval was carried out by heating slides for 17 min in Tris EDTA buffer, pH 9 in a pressure cooker at 110 °C. Slides were cooled to room temperature and then blocked with 2.5% horse serum (Vector Labs). After blocking, slides were incubated overnight at 4 °C with primary antibody in horse serum. Slides were then incubated in anti-rabbit or mouse HRP secondary (Vector Labs) for 1 h at room temperature the following day and subsequently incubated in 1:500 Opal 520, Opal 570 or Opal 590 (Akoya) for 10 min. For serial staining, slides were stripped using citric acid buffer, pH 6.1 in a pressure cooker at 110 °C for 2 min and then staining was repeated using a different antibody and Opal fluorophore. After the last Opal staining, slides were mounted using antifade gold mount with DAPI (Invitrogen). Stained images were acquired using an Aperio Versa 200 Automated Slide imaging system (Leica/Aperio) using the Vanderbilt University Medical Center Digital Histology Shared Resource core. Images were analysed with Fiji software. Quantification of markers was carried out by calculating the total amount of fluorescence divided by total area of tissue (determined by haematoxylin–eosin staining).
Endometrial carcinoma tumour tissues were provided by Cheng-Han Lee and Christa Aubrey from University of Alberta obtained from five patients who underwent a successful diet-based pre-operative weight loss programme, with an initial average BMI of 55 kg m−2 (43 to 64 kg m−2) and an average reduction of BMI of 13% (9 to 17%) through the weight loss period. All five patients had low-grade (grade 1 or 2) endometrioid-type carcinoma. Serial unstained sections (4 μm thickness) of the tumour tissue were obtained from formalin-fixed paraffin-embedded samples of pre-weight-loss endometrial biopsy and post-weight-loss hysterectomy specimens for immunofluorescence analysis.
Patient samples
Fresh histology-confirmed ccRCC tumours and matched healthy tissue were surgically removed. Tumours and matched healthy kidney tissue were processed by mechanical dissociation (human tumour setting two on a Miltenyi gentleMACS) in Hanks’ balanced salt solution (HBSS) with calcium chloride and magnesium chloride. Mechanical dissociation was followed by enzymatic digestion in 435 U ml−1 DNase I (Sigma-Aldrich, D5025) and 218 U ml−1 collagenase (Sigma-Aldrich, C2674) in RPMI supplemented with 10% FBS, 1% glutamine, 1% penicillin–streptomycin, 1% HEPES and 0.1% 2-mercaptoethanol for 30–45 min, depending on tissue toughness, at room temperature with agitation at 17 r.p.m. Tissue digests were washed with HBSS without calcium chloride, magnesium chloride or magnesium sulfate and then incubated in 5 mM EDTA for 20 min at room temperature with agitation at 17 r.p.m. Tumour and matched healthy kidney digests were washed with HBSS with calcium chloride and magnesium chloride. Then they were passed through a 70-μm filter and ACK-lysed. Peripheral blood mononuclear cells were isolated from patients by density gradient centrifugation using Ficoll-Paque (GE Healthcare, 17144002) in SepMate-50 tubes (StemCell Technologies, 85450) and subsequently ACK-lysed. Single-cell suspensions were frozen in 90% FBS, 10% dimethylsulfoxide. Batched tumour and matched peripheral blood mononuclear cells were thawed, rested for 10 min at 37 °C, counted, stained and analysed for flow cytometry. All studies were conducted in accordance with the Declaration of Helsinki principles under a protocol approved by the VUMC Institutional Review Board (protocol number 151549). Informed consent was received from all patients before inclusion in the study by the Cooperative Human Tissue Network at VUMC.
Fresh, whole patient blood was collected from a patient with PTEN haploinsufficiency (IDDI-002) and two control donors. Frozen PMBCs from this patient (IDD1-002) and a control donor from a previous collection were also used. Fresh, whole blood was diluted with sterile HBSS (Gibco, 14175095) at a 1:2 dilution in 50-ml conical tubes and spun at 400g for 40 min at room temperature with no brake. Plasma was removed and cells (RBC–plasma interface) were placed into a new 50-ml conical tube and diluted 1:2 with HBSS. Percoll (GE Healthcare, 17-0891-01) was diluted with 1.5 M NaCl and sterile tissue culture grade water (Corning, 25-055-CVC) to give 1.077 g ml−1 Percoll and 1.119 g ml−1 Percoll. Patient cells were slowly applied on top of the Percoll gradient and spun at 400g for 40 min at room temperature with no brake. The plasma supernatant was discarded and the buffy coat of mononuclear cells were transferred to a new tube. The cells were washed with HBSS and spun at 300g for 12 min at room temperature with no brake. To lyse any remaining red blood cells, 10 ml of ACK lysis buffer (Gibco, A1049201) was applied to the cell pellet, which was resuspended, and incubated at room temperature for 3 min while swirling gently. HBSS was added to 25 ml and cells were spun at 300g for 12 min at room temperature with no brake. Cells were resuspended in 3–5 ml RPMI 1640 (Gibco, 11875093) and counted using an automatic cell counter. Cells were plated in 6-well tissue culture-treated dishes (Fisherbrand, FB012927), at 1 × 10⁵ cells per well. Cells were allowed to adhere for 1 h, washed and supplemented with complete RPMI 1640 with 1% each of penicillin–streptomycin (Gibco, 150700630), l-glutamine (Gibco, A2916801) and HEPES buffer (Gibco, 15630080). Cells were infected with heat-killed methicillin-resistant Staphylococcus aureus (MRSA USA300 LAC strain)1 at a multiplicity of infection of 10 overnight (18 h). Cells were washed with HBSS and RNA was collected and processed using an RNeasy Mini Kit (Qiagen, 74104). Purified RNA was submitted for RNA-seq processing and analysis to VANTAGE (Vanderbilt Technologies for Advanced Genomics).
Bulk RNA-seq
MC38 tumours were digested and sorted for PD-1low/− and PD-1+ of live CD45+CD11b+F480+. RNA was isolated using the RNeasy Micro Kit (Qiagen). BMDMs were plated at 2 × 10⁶ cells and treated for 24 h with 50 ng ml−1 IFNγ. BMDMs were then treated with rmPD-L1 (1 μg ml−1) or anti-PD-1 (1 μg m−1) for another 24 h before RNA was isolated using the RNeasy Mini Kit (Qiagen). Raw read quality was first assessed using FastQC (v0.11.5). Then STAR (v2.7.3a) was used to align reads to the mouse genome (GRCm38.primary assembly from gencode) or human genome (GRCh38.primary assembly from gencode). Gene expression was quantified using the featureCounts function in the R package (v2.6.4) with paired-end mode to count reads that mapped uniquely. Then the differentially expressed genes were called using edgeR (v2.26.5) with Benjamini–Hochberg-adjusted P value < 0.05. The gene set over-representation analysis was carried out using the differential expression genes with the Kyoto Encyclopedia of Genes and Genomes gene sets utilizing the R package clusterProfiler (v3.12.0). Gene set variation analysis of hallmark pathways was carried out with the R package GSVA (v1.40.1) using the gene expression matrix as input.
scRNA-seq
Eight-week-old C57BL/6 male mice were fed ad libitum with either a 10% kcal from fat (low-fat) diet or a 45% kcal from fat (high-fat) diet (Research Diets D12450H and D12451, respectively). After 28 weeks of diet treatment, mice were injected subcutaneously with 2 × 10⁵ mouse MC38 (Kerafast) cells. Tumours were collected on day 20 post injection and then mechanically and enzymatically digested using mouse tumour digestion kit (Miltenyi) following the manufacturer’s instructions. Tumour-infiltrating leukocytes were sorted by positive selection using CD45+ microbeads (Miltenyi Biotec) from dissociated tumours for single-cell analysis. CD45+ cells were further enriched for live cells using a dead cell removal kit (Miltenyi Biotec). Cells were diluted with trypan blue and counted using a haemocytometer. Three tumours possessing the median weights were pooled together for each treatment group. Pooled samples were resuspended at 1 × 10⁶ cells ml−1 in PBS plus 0.4% BSA with a target of 20,000 live cells loaded onto the Chromium Controller (10x Genomics) and processed according to the manufacturer’s instructions. Sequencing was carried out on the Illumina NovaSeq 6000 targeting 50,000 reads per cell for the 5′ assay. The raw data (FASTQ files) were processed using the velocyto (version 0.17.17) to generate gene expression matrix as loom files.
Data preprocessing, normalization, integration and clustering were carried out in scanpy (version 1.7.1). In brief, the gene expression matrix for each sample was filtered by keeping cells with more than 200 but fewer than 4,000 detected genes, as well as genes that were detected in more than 3 cells. Cells with mitochondrial genes representing greater than 10% of the transcripts were also removed. The matrix for each sample was integrated using a mutual nearest-neighbour algorithm with 4,002 highly variable genes (highly variable genes in at least 2 samples). Clustering was carried out using Leiden on the integrated matrix, which identified 20 clusters that were then annotated using SingleR and manually confirmed. Differential gene expression analysis was carried out in scanpy using the function scanpy.tl.rank_genes_groups with a Wilcoxon rank-sum test to determine significance. Violin plots of genes were created with scanpy. Data are available at the Gene Expression Omnibus (GSE179936).
For PD-1 analysis in human macrophages, a previously published dataset sequenced using the 10x Genomics platform from ref. 44 was obtained and converted to a Seurat v4 object45. Macrophages were then subset and labelled as PD-1+ or PD-1− on the basis of normalized expression of PDCD1. For differential expression between PD-1+ and PD-1− macrophages, the FindMarkers function from Seurat v4 with the MAST test was used46. Significant differentially expressed genes were identified by an adjusted P value < 0.05.
V(D)J sequencing
Raw V(D)J sequencing files were processed using CellRanger (10x Genomics). Consensus V, D and J gene sequences (that is, contigs) generated by CellRanger were further analysed in R v4.2.1 by selecting for productive TCRs. In cases in which multiple TCRs were observed for a given cell, the most enriched TCR was retained. TCR results were incorporated into Seurat v4 objects generated using the cell by gene matrix from scanpy. Clones were called on the basis of unique paired TCRα and TCRβ sequences.
Downstream analysis of Compass scores
Single-cell RNA-seq data as described above were further analysed using Compass to infer the metabolic status of cells on the basis of transcriptome data and flux balance analysis27. Compass was run—without micro pooling—four separate times with four separate inputs: LFD CD8; HFD CD8; LFD macrophage; and HFD macrophage, using clusters classified by SingleR as macrophage or CD8. Compass and postprocessing of samples were followed as described in ref. 27. Data were presented as the −log of the reaction penalties, which makes the higher scores correspond with more active reactions and any reactions that were close to constant were removed (<10−3). Significant reaction values were determined using an unpaired Wilcoxon rank-sum test between the lean and obese mice of each group (CD8 and macrophage) and all non-core reactions were filtered out. A meta-reaction was defined as belonging to core metabolism if it contains at least one core reaction. Core pathways are defined as Recon2 subsystems that have at least three core reactions. Metabolic genes are defined as the set of genes annotated in Recon2. Compass uses the package Recon2, which ranks confidence on a scale of 1–4, with 4 being the most confident, whereas a value of 0 means that the confidence was not evaluated. Only reactions with a confidence value of 4 or 0 were included. In addition, all reactions in the citric acid cycle subsystem that occur outside the mitochondria were removed. To decide which Recon2 subsystems to plot, we first filtered both groups for subsystems having >5 reactions. We further filtered the CD8 group by taking the median adjusted P value of each subsystem and keeping only reactions whose medians were below the median of the medians (taking the most significant half of the subsystems) as well as the fatty acid oxidation and fatty acid synthesis subsystems. For the dot plots, we plotted only reactions shared between this filtered CD8 group and the unfiltered macrophage group whose subsystem had a median adjusted P value of below 0.1. The colour of the dot corresponds to the sign of Cohen’s d from the Wilcoxon rank-sum test (blue = negative, red = positive), and the opacity of the dot corresponds to its adjusted P value (adjusted P 0.1 = faded).
Statistics
Prism software (GraphPad Software) was used to create graphs and conduct statistical analyses. Data were expressed as mean ± s.e.m. Analyses of the differences between two test groups were carried out using the non-parametric unpaired two-way t-test or a paired two-way t-test. For analysis of three or more group from a single variable, one-way ANOVA tests were carried out with Tukey post hoc test. For analysis of four groups with two variables, a two-way ANOVA test was carried out with a Fisher’s least significant difference test for multiple comparison. For the scRNA-seq violin plots, a Student t-test was carried out and the values were adjusted using the Benjamini–Hochberg procedure. The P values were considered statistically significant if P < 0.05.
Extended Data
Extended Data Fig. 1 |. High Fat Diet feeding induces an obese phenotype.

a, Mouse body weights during 20 weeks of LFD or HFD feeding prior to MC38 tumor injection (n = 20 mice per diet). b, Mouse food intake during 20-week diet treatment. Food weighed weekly per cage and intake calculated as food weight difference between weeks (difference in food weight(g)/7 days/5 mice per cage X kcal of diet) (45% HFD = 4.73 kcal/g; LFD = 3.85 kcal/g) (n = 4 cages with 5 mice per cage). c-d, Blood glucose and blood insulin levels measured via tail bleed following a 4-hour fast after 20 weeks of diet treatment (n = 20 mice per diet). e-h, Representative tumor growth curves of mice inoculated with 5 × 10⁵ MC38 cells following 20 weeks of diet treatment (n = 6–8 mice per group). i, Tumor weights on day 19 following subcutaneous inoculation. “X” indicates days of anti-PD-1 or IgG injection. Data points identified as “+” were pooled together at equal amounts of live cells for subsequent single cell RNA sequencing analysis. j, Percent change in tumor growth in response to a-PD-1 treatment within respective diets ((Tumor Diameter Day 9 LFD α-PD-1 – Diameter Day 19 LFD IgG) ÷ Diameter Day 19 LFD IgG × 100). P values were calculated using an unpaired two-tailed t-test (a-d, j) or two-way ANOVA using a Fishers LSD test for multiple comparisons (i). ns=p > 0.05; * p ≤ 0.05; ** p ≤ 0.01.
Extended Data Fig. 2 |. Cell characterization of CD45+ and CD45− cells from MC38 tumors.

a-b, Cell counts of SingleR annotated clusters from scRNAseq of MACS enriched CD45− and CD45+ MC38 tumor samples. c, Heat map of identifying genes used to annotate CD45+ clusters. d, Representative gating strategy for quantifying T cell and macrophage cell populations within the spleen and tumor of MC38 tumor bearing mice. e-g, Quantification of tumor CD8+, CD4+ and TAMs, respectively, gated on live singlets in MC38 tumors. h-j, Quantification of percent positive and MFI of tumor PD-1+, Lag3+ and Tim3+ CD8 T cells, CD4 T cells and TAMs. k, Frequency of Pdcd1+ cells in TAM clusters of scRNAseq dataset. Data is representative of one experiment, n = 3 pooled tumors from each treatment group (a-b, k). Each data point represents a biological replicate; data are mean ± s.e.m. P values were calculated using a Two-way ANOVA with a Fishers LSD test for multiple comparisons. ns=p > 0.05; * p ≤ 0.05.
Extended Data Fig. 3 |. HFD reduced clonality of CD8 T cells and impairs TAM function and metabolic signature with MC38 tumors.

a, UMAP of clone abundance within each treatment group from V(D)J Sequencing of T cell clusters with productive TCRs from scRNAseq dataset. b, Absolute number of T cells with paired TCR-a and TCR-b sequences. Data is representative of one experiment, n = 3 pooled tumors from each treatment group. c, Representative gating strategy for TAMs from MC38 tumors, identified as live singlets CD45+, CD8− CD11b+ and F480+. d, MFI of phrodo+ TAMs. e, MFI of MHCII in TAMs. f, Percent positive and MFI of CD80 in TAMs. MFI values were normalized within trials to IgG controls. g-i, Measurement of basal OCR, basal ECAR and OCR:ECAR ratio of MACS enriched CD11b+ cells sorted from MC38 tumors during a MitoStress Test measured using Agilent Seahorse extracellular flux analyzer. Each data point represents a biological replicate; For d-f MFI was normalized to the average of LFD IgG control within each independent trial and combined from 2 independent experiments. Data are mean ± s.e.m. P values were calculated using a Two-way ANOVA with a Fishers LSD test for multiple comparisons. * p ≤ 0.05.
Extended Data Fig. 4 |. Pdcd1 is increased in TAMs in many types of cancers.

a, Pdcd1 expression within tumor immune cells subsets from scRNAseq within TISCH2 database. b-c, Pdcd1 expression in CD8 T effector and Monocyte/Macrophage identified cells in the TISCH2 scRNAseq database from various cancer datasets. d, Percent Pdcd1+ macrophages from human ccRCC tumor samples measured using gene expression from scRNAseq dataset (n = 11 patients) e, Percent Pdcd1+ macrophages of human CRC tumor samples quantified using gene expression from scRNAseq (n = 62 patients) f-g, Percent Pdcd1+ macrophage cells corresponding to pathological tumor grade compared to adjacent normal tissue from human CRC or human ccRCC tumor samples measured using gene expression from scRNAseq. h, Enrichment of KEGG metabolic signature scores of Pdcd1− versus Pdcd1+ TAMs from human CRC scRNAseq. Data are mean ± s.e.m. P values were calculated using an unpaired two-tailed t-test. *p ≤ 0.05, **p ≤ 0.01.
Extended Data Fig. 5 |. Tumor Associated Macrophages express PD-1 in human tumor samples which is not directly associated with TREM2 expression.

a, Representative histogram and contour plot illustrating PD-1 expression within TAMs or CD8 T cells from human ccRCC patients. b, Frequency of live singlets CD45+ CD11b+ CD68+ and CD163+ TAMs and CD45+ CD8+ T cells from ccRCC patient PBMCs or tumor. c, MFI of PD-1 expression in TAMs and CD8 T cells from ccRCC patient samples. d, Representative flow gating strategy of MACS sorted CD11b+ and CD8+ cells from freshly isolated human ccRCC tumors or matched PBMCs. e, Histogram representing PD-1, TIM3 and LAG3 expression on human peripheral blood mononuclear cells (PBMCs) and matched ccRCC tumor in MACS sorted CD11b+ TAMs and CD8+ TILs. f, Representative image of Tumor Microarray (TMA) staining identifying PD-1 colocalizing with CD163+ and CD8+ cells at 40X magnification. Scale bar 50 mm. g, Frequency of PD-1+ TAMs or PD-1+ CD8 T cells from TMA staining with patient clinical data categorized by BMI status (lean BMI < 25; obese BMI 30–35) (n = 28 lean patients; n = 53 obese). h, Area of CD163+ or CD8+ staining taken from endometrial carcinoma tumor tissues obtained from 5 patients before and after at least a 10% body weight loss. i, Representative PD-1 and TREM2 expression from live CD11b+ CD163+ and CD68+ TAMs from human ccRCC tumor samples. j, Percent positive of PD-1+ cells in tumor immune cells from MC38 subcutaneous murine tumors. k, MFI of PD-1 expression within different immune cell subsets with representative overlay of histogram and contour plots with FMO control. Each data point represents individual patient samples. Data are mean ± s.e.m. P values were calculated using an unpaired two-tailed t-test (d, e, i) or a paired two tailed t-test (h). P values were calculated using a one way ANOVA compared to CD3− CD11b− cells (j-k).ns p > 0.05, *p ≤ 0.05, ****p ≤ 0.001.
Extended Data Fig. 6 |. Obesity and metabolic dysfunction induce PD-1 expression on TAMs.

a, Tumor diameter over time of pancreatic tumor cells, 6419c5, injected 2 × 10⁵ subcutaneously into mice fed a LFD or 45% HFD diet for 20–25 week. b, Tumor weight at Day17 post injection of pancreatic tumor cell line. c-d, Percent positive and MFI of PD-1 of TAMs and CD8 T cells respectively from pancreatic tumors. e-g, Percent positive and MFI of MHCII, CD80 and PDL1 of TAMs from pancreatic tumors. h, Percent of phrodo positive TAMs from pancreatic tumors. i) MFI of Bodipy C:16 uptake in TAMs from pancreatic tumors. j, Tumor diameter over time of subcutaneous kidney tumor cells, LVRCC, injected 2×10⁶ subcutaneously into mice fed a LFD or 45% HFD diet for 20–25 week. k, Tumor weight at Day 28 post injection of kidney tumor cell line. l-m, Percent positive and MFI of PD-1 of TAMs and CD8 T cells respectively from kidney tumors. n-o, Percent positive PD-1 of TAMs and CD8 T cells respectively from 3 × 10⁵ PD-L1 expressing EO771 cells injected in 4th mammary pad of female C57BL6/J mice ovariectomized at 6 weeks of age following 25 weeks of LFD or 60% HFD treatment. p, Tumor weight of FVB/MMTV-PyMT mice injected with or without streptozotocin (STZ) at 70 mg/kg and fed a 60% HFD for 12 weeks. q, Percent positive of PD-1 of TAMs from PYMT tumors. Each data point represents biological replicates. In n-o data were combined from 4 independent trials. In p-q data were combined from 4 independent trials and normalized to control within each trial. Individual tumors from PyMT mice with multiple tumors were processed separately. Dots of the same color indicate individual tumors collected from the same mouse. Data are mean ± s.e.m. P values were calculated using an unpaired two-tailed t-test. ns p > 0.05, *p ≤ 0.05, **p ≤ 0.01.
Extended Data Fig. 7 |. Obesity induced PD-1 expression on TAMs independent of T cell presence.
a, Percent of CD11b+ F480+ macrophages within MC38 tumors and spleens following 2 weeks of LFD or 45% HFD treatment (acute diet). b, Percent of PD-1+ macrophages in tumor and spleen following 2-week acute diet treatment. c-e, Relative abundance of indicated immune cell populations in MC38 tumor (c) and spleen (d) with diet and αCD4/8 treatments (n = 3 mice/group) with representative flow cytometry plots (e) demonstrating T cell depletion. f-i, Tumor weights, PD-1+ expression, % phrodo+ cells, and MHCII expression on CD11b+/F480+ TAMs on day 14 of MC38 tumors following αCD4 and αCD8 T cell depletion in mice fed LFD or HFD for 20 weeks (n = 3–4 mice). j, Frequency of PD-1+ macrophages from spleen, epididymal adipose tissue, or tumors of s.c. pancreatic tumor-bearing mice following 20 weeks of diet treatment. k, Frequency of PD-1+ BMDMs following 4-, 8-, 24- and 48-hours exposure to IFNg (M1-like;Pro-inflammatory), IL-4 (M2-like; Anti-inflammatory) or tumor-conditioned media (TCM). l, MFI of CD274 (PD-L1) of BMDMs following 4-, 8-, 24- and 48-hour exposure to (M1), (M2) or (TCM) conditions. m, MFI of PD-1 of BMDMs following 24-hour exposure to LPS, IFNg, IL-4, TCM, IL-6, MCP-1, IL-1b, TNF-a, leptin, or insulin with representative Isotype and FMO control. n, MFI expression of PD-L1 and representative histograms of BMDMs following 24-hour stimulation. Data points indicate biological replicates. Data in E is one sample of 3–5 pooled spleens per treatment group. Data are mean ± s.e.m. P values were calculated using a Two-Way ANOVA followed by a Fishers LSD test for multiple comparisons (f-i) or an unpaired two-tailed t-test (j). P values were calculated using a one-way ANOVA compared to untreated M0 BMDMs (k-n) *p ≤ 0.05). *p ≤ 0.05). Data points indicate biological replicates (n = 3). Data are mean ± s.e.m.
Extended Data Fig. 8 |. Pdcd1+ and PD-1 + TAMs have a unique gene signature.

a, GO Biological Process Pathway Analysis of differential gene expression from Pdcd1− versus Pdcd1+ TAMs from MC38 scRNAseq TAM clusters independent of diet or treatment. b, Differential Gene expression of select genes from Pdcd1− versus Pdcd1+ TAMs from MC38 scRNAseq (See Supplementary Table 1 for full list of significant genes). c, Quantification of Pdcd1 CPM expression from FACS sorted PD-1+ and PD-1low/negative populations. d, Bulk RNA sequencing of Hallmark Pathway analysis of DEGs from PD-1low/negative versus PD-1+ TAMs via FACS. Data points or squares represent biological replicates as mean ± s.e.m (n = 10). P values were calculated using a paired two-tailed t-test. ***p ≤ 0.001.
Extended Data Fig. 9 |. PD-1 expression in macrophages is dependent on PI3K, mTOR, NF-κB and c-Myc activation.

a, Percent viability, MFI of PD-1 and percent PD-1+ of primary BMDMs stimulated with LPS (1ug/mL) and treated with c-Myc inhibitors (KJ Pyr 9 10ug/mL and 10058-F4 10ug/mL), mTOR inhibitor (Rapamycin 250 ng/mL), AMPK agonist (AICAR 2ug/mL) and NF-κB inhibitor (BMS-345541 1.2ug/mL) for 24 h. b, Percent viability, MFI of PD-1 and percent PD-1+ of immortalized cas9 BMDMs treated with c-Myc inhibitors (KJ Pyr 9 10ug/mL and 10058-F4 10ug/mL), mTOR inhibitor (Rapamycin 350 ng/mL), AMPK agonist (AICAR 5ug/mL) and NF-κB inhibitor (BMS-345541 300ug/mL) for 24 h. c, Percent viability, MFI of PD-1 and percent PD-1+ of RAW264.7 cells treated with c-Myc inhibitors (KJ Pyr 9 10ug/mL and 10058-F4 10ug/mL), mTOR inhibitor (Rapamycin 87.5 ng/mL), AMPK agonist (AICAR 52.5 g/mL) and NF-κB inhibitor (BMS-345541 150ug/mL) for 24 h. d, Western blot of PTEN expression of immortalized cas9 BMDMs following crispr mediated deletion of PTEN. Ctrl is the empty vector. All studies used PTEN 2 clone e, Pdcd1 expression of monocytes enriched from PBMCs of healthy donors or a PTEN haploinsufficient patient. Data points in a indicate biological replicates (n = 4). Data points in b-c indicate technical replicates (n = 4) and is representative of >3 independent trials. Data points in e represent 2 independent healthy donors and a PTEN deficient patient. Data are mean ± s.e.m. P values were calculated using a one-way ANOVA (A-C). ns p > 0.05, *p ≤ 0.05, **p ≤ 0.01, ****p ≤ 0.0001.
Extended Data Fig. 10 |. Deletion of Pdcd1 suppresses tumor growth and promotes a pro-inflammatory, glycolytic phenotype in macrophages.
a, Tumor weight on Day 14 following 1×10⁶ MC38 cells injected subcutaneously into WT or Pdcd1−/− age matched mice (n = 8–10mice). b, Percent phrodo+ of peritoneal macrophages from WT or Pdcd1−/− tumor-exposed mice c, Percent positive and MFI of MHCII of peritoneal macrophages d) Percent positive and MFI of CD80 of peritoneal macrophages e, MFI of 2-NBDG in peritoneal macrophages following 45 min exposure to 2-NDBG. f-g, Tumor diameter over time and tumor weight on Day 14 following 5×10⁶ MC38 cells injected subcutaneously into WT or Pdcd1−/− age matched mice (n = 3–5mice). h-j, Frequency and MFI of MHCII, CD86 and Glut1 expression on TAMs from WT or Pdcd1−/− mice. k, OCR and ECAR measurements over time from MitoStress Test of BMDMs isolated from WT or Pdcd1−/− mice stimulated for 24 h with IFN-g (M1), IL-4 (M2), or 50% Tumor Conditioned Media (TCM). l, ECAR measurement over time from GlycoStress test of BMDMs with corresponding Glycolysis calculation. Data points in f-g represent 6 biological replicates run in triplicate. P values were calculated using an unpaired two-tailed t-test; ns= p > 0.05, *p ≤ 0.05, **p ≤ 0.05).
Extended Data Fig. 11 |. Direct effects of anti-PD-1 treatment on tumor conditioned macrophage function and metabolism.

a, OCR from MitoStress Test of BMDM stimulated with TCM for 24 h followed by treatment with recombinant mouse PD-L1 and/or anti-PD-1 for an additional 24 h. b, c, Percent positive phrodo, and CD80 of TCM stimulated BMDM following rmPD-L1 and/or anti-PD-1 treatment. d-f, Percent positive phrodo, CD80 and MHCII of TAMs from MACS isolated CD11b+ cells from MC38 tumors ex-vivo treated α−PD-1 for 24 h. g, Fold change of MHCII, MHCI, Glut1, and iNOS expression of IgG/a-PD-1 ex-vivo treated TAMs from LFD versus HFD treated MC38 tumor bearing mice. h, Volcano plot of differentially expressed genes from MACS isolated CD11b+ cells from MC38 tumors ex-vivo treated α-PD-1 for 24 h. Data points indicated biological replicates. Data in a-c representative of ≥ three independent experiments with ≥ 3 mice per group run in triplicate. Data are mean ± s.e.m. P values were calculated using a One-way ANOVA (a-c), a paired two-tailed t-test (d-f), or an unpaired two tailed t-test g, *p ≤ 0.05, **p ≤ 0.01).
Extended Data Fig. 12 |. Myeloid specific PD-1 depletion improves TAM anti-tumor function.
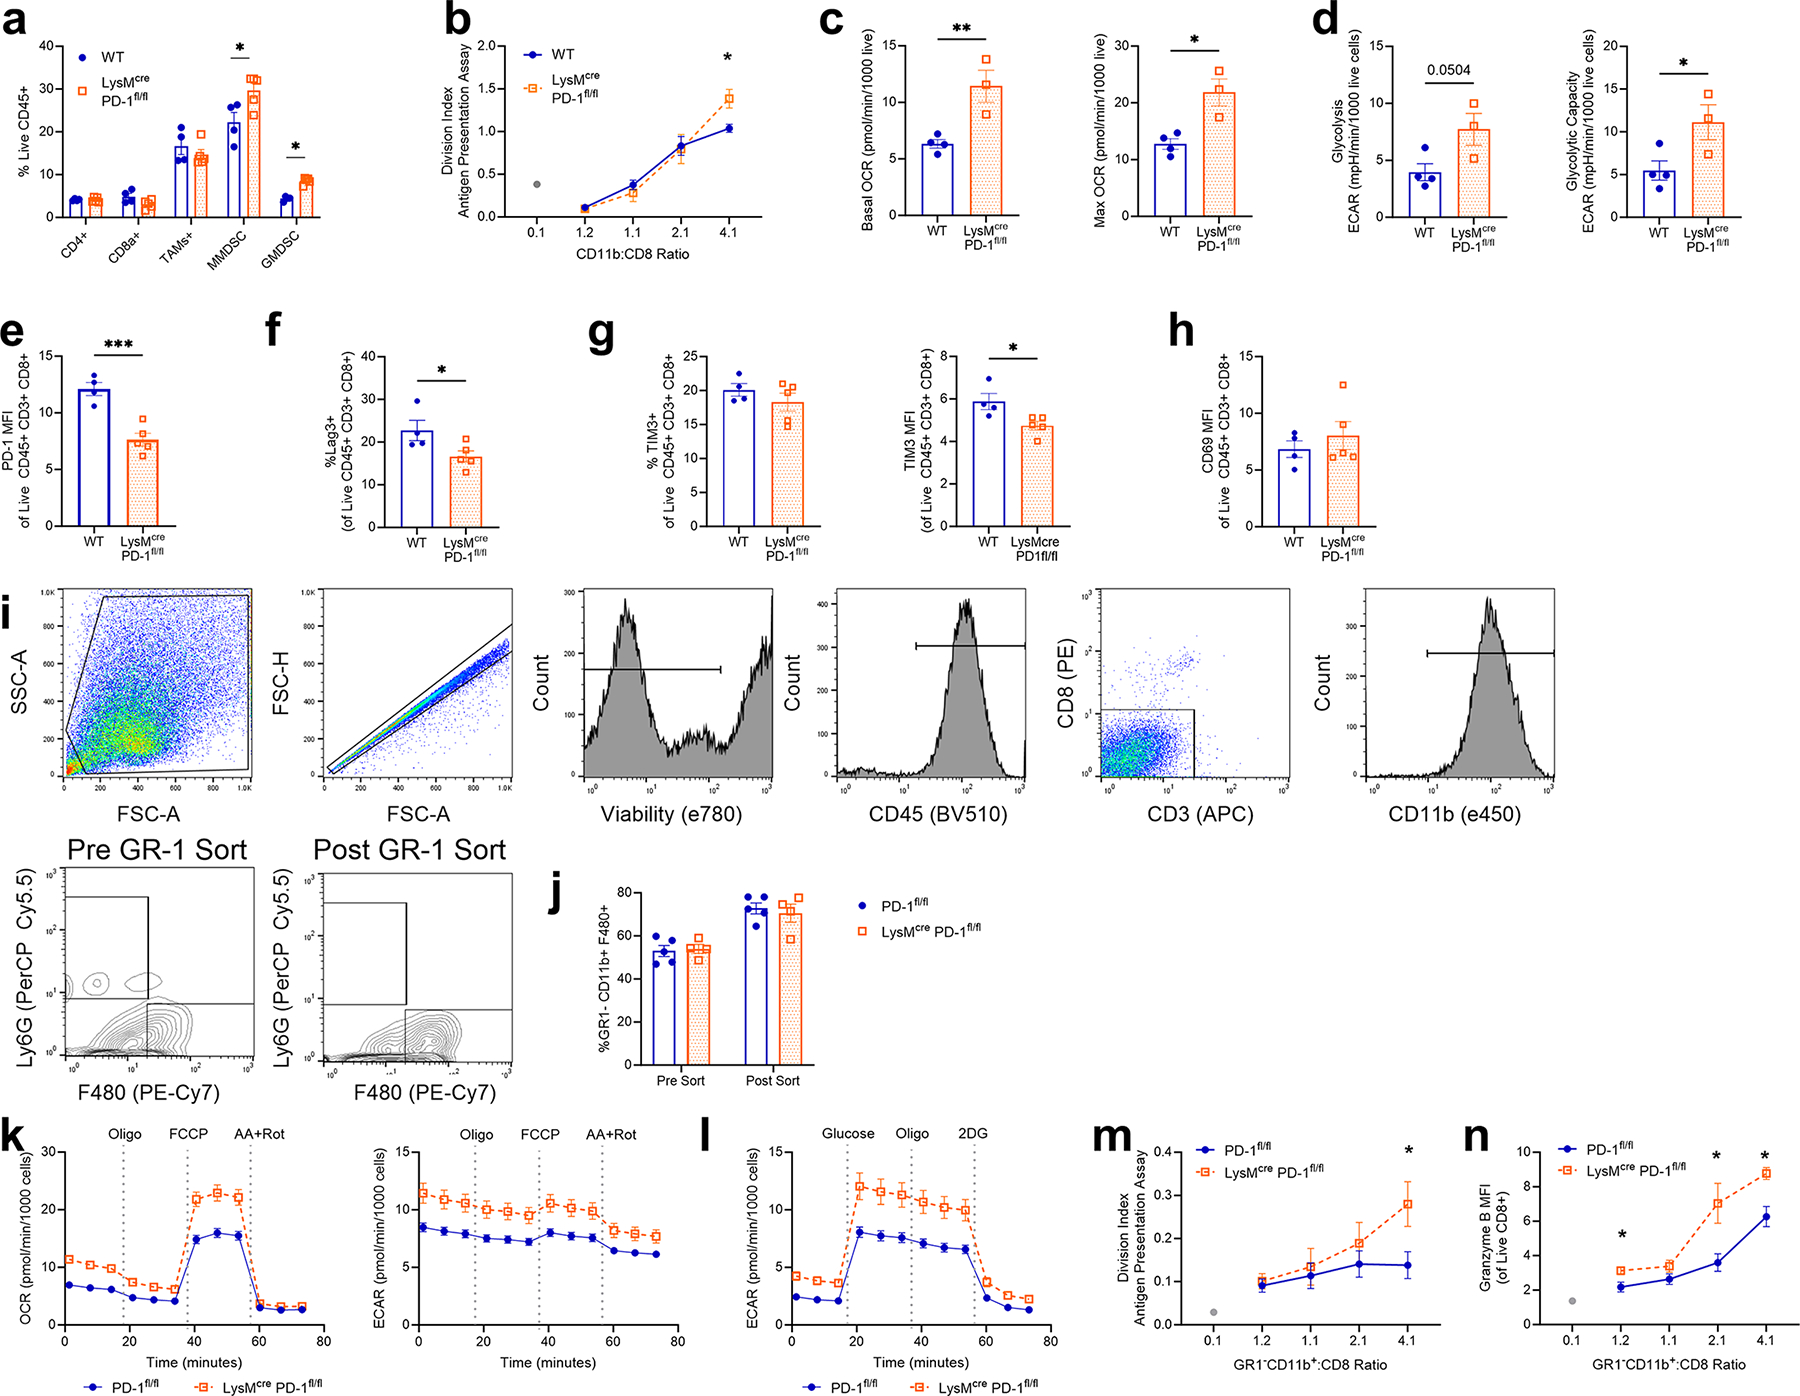
a, Frequency of immune cell subsets from MC38 tumors injected into WT and LysMcre Pdcd1fl/fl mice. b, Division index calculated from flow cytometry analysis of CTV staining CD11b+ isolated cells from MC38 tumors from WT vs LysMcre Pdcd1fl/fl mice cocultured with OT1 CD8+ isolated splenocytes. Cocultured cells treated in the presence of 1 mg/ml OVA protein for 5 days. c, Basal and maximal OCR measurements from MitoStress Test of CD11b+ isolated cells from MC38 tumors of WT and LysMcre Pdcd1fl/fl. d, Calculated glycolysis and glycolytic capacity following GlycoStress Test of CD11b+ isolated cells from MC38 tumors of WT and LysMcre Pdcd1fl/fl. e-h, Percent positive and MFI of PD-1, Lag3, TIM3 and CD69 expression on CD8 T cells from MC38 tumors of WT and LysMcre Pdcd1fl/fl. i, Representative gating following serial MACS isolations of Gr-1− cells followed by CD11b+ MACS isolation. j, Purity of GR-1− CD11b+ F480+ cells before and after MACS sorting. k-l, OCR and ECAR measurement over time from a MitoStress Test and ECAR measurement over time from a GlycoStress Test of MACS isolated GR-1− CD11b+ cells from MC38 tumors in WT vs LysMcre Pdcd1fl/fl male mice. m, Division index calculated from flow cytometry analysis of CellTrace violet staining GR-1− CD11b+ isolated cells from MC38 tumors from WT vs LysMcre Pdcd1fl/fl mice cocultured with OT1 CD8+ isolated splenocytes. Cocultured cells treated in the presence of 1 mg/ml OVA protein for 5 days. n, MFI of Granzyme B expression from OT1 CD8+ cells cocultured as indicated in in panel m. Data representative of ≥ three independent experiments with 3–6 mice per group. Data are mean ± s.e.m. P values were calculated using an unpaired two-tailed t-test. (*p ≤ 0.05, **p ≤ 0.01, ***p ≤ 0.001).
Supplementary Material
Acknowledgements
We thank members of the laboratories of J.C.R. and W.K.R. for input; the laboratories of J. Balko, Y. Kim and P. Hurley for the use of their tumour dissociators; the Doran Lab (Vanderbilt University Medical Center) for providing the RAW264.7 cell line and the laboratory of B. Stanger (University of Pennsylvania) for providing the 6419c5 pancreatic cell line. This work was supported by National Institutes of Health (NIH) grants K00 CA234920 (J.E.B.), F31 CA261049 (M.M.W.), F30 CA239367 (M.Z.M.), F30 CA247202 (B.I.R.), K00 CA253718 (E.N.A), F99 CA274695 (W.W.), T32 DK007314 (L.V.P.), R01 CA217987 (J.C.R.), K08 CA241351 (S.M.H.), R01CA238263 (V.A.B.), R01 DK105550 (J.C.R.), T32 GM007347 (M.Z.M. and B.I.R.), K12 CA090625 (K.E.B. and W.K.R.) and T32 DK101003 (K.S.), the American Association for Cancer Research (B.I.R. and W.K.R.), the Vanderbilt-Incyte Alliance (J.C.R. and W.K.R.), the Mark Foundation for Cancer Research (J.C.R. and A.H.H.) and pilot funding from the Vanderbilt Ingram Cancer Center (P30 CA068485; J.C.R.). The Vanderbilt VANTAGE Core, including A. Jones, provided technical assistance for this work. VANTAGE is supported in part by a Clinical and Translational Science Award grant (5UL1 RR024975-03), the Vanderbilt Ingram Cancer Center (P30 CA068485), the Vanderbilt Vision Center (P30 EY08126) and the NIH’s National Center for Research Resources (G20 RR030956). Flow-sorting experiments were carried out in the VUMC Flow Cytometry Shared Resource by D. K. Flaherty and B. K. Matlock and were supported by the Vanderbilt Ingram Cancer Center (P30 CA068485) and the Vanderbilt Digestive Disease Research Center (P30 DK058404). We acknowledge the Translational Pathology Shared Resource supported by NIH National Cancer Institute Cancer Center Support Grant 5P30 CA68485-19 and the Vanderbilt Mouse Metabolic Phenotyping Center Grant 2 U24 DK059637-16. The images of the needles, the tumour and the MACS set-up in Fig. 1a were created with BioRender.com.
Footnotes
Competing interests J.C.R. has held stock equity in Sitryx and in the past two years has received unrelated research support, travel and honoraria from Sitryx, Caribou, Nirogy, Kadmon, Calithera, Tempest, Merck, Mitobridge and Pfizer. In the past two years, W.K.R. has received unrelated clinical research support from Bristol-Meyers Squib, Merck, Pfizer, Peloton, Calithera and Incyte. Both J.C.R. and W.K.R. are divested of these interests at present. K.E.B. received funding to the institution for preclinical research from Bristol-Myers Squibb–International Association for the Study of Lung Cancer–Lung Cancer Foundation of America, funding to the institution for clinical trials from Arrowhead, Aravive, Aveo, BMS, Exelexis and Merck, and consulting fees from Alpine Immune Sciences, Aravive, AstraZeneca, Aveo, BMS, Exelexis, Merck, Seagen and Sanofi. V.A.B. has patents on the PD-1 pathway licensed by Bristol-Myers Squibb, Roche, Merck, EMD-Serono, Boehringer Ingelheim, AstraZeneca, Novartis and Dako.
Additional information
Supplementary information The online version contains supplementary material available at https://doi.org/10.1038/s41586-024-07529-3.
Online content
Any methods, additional references, Nature Portfolio reporting summaries, source data, extended data, supplementary information, acknowledgements, peer review information; details of author contributions and competing interests; and statements of data and code availability are available at https://doi.org/10.1038/s41586-024-07529-3.
Springer Nature or its licensor (e.g. a society or other partner) holds exclusive rights to this article under a publishing agreement with the author(s) or other rightsholder(s); author self-archiving of the accepted manuscript version of this article is solely governed by the terms of such publishing agreement and applicable law.
Reporting summary
Further information on research design is available in the Nature Portfolio Reporting Summary linked to this article.
Data availability
Materials are available upon request from the corresponding author with an appropriate material transfer agreement. scRNA-seq data are available at the Gene Expression Omnibus under accession number GSE179936. RNA-seq data are publicly available at the Gene Expression Omnibus under accession number GSE242839. Source data are provided with this paper.
References
- 1.Islami F, Goding Sauer A, Gapstur SM & Jemal A Proportion of cancer cases attributable to excess body weight by US state, 2011–2015. JAMA Oncol. 5, 384–392 (2019). [DOI] [PMC free article] [PubMed] [Google Scholar]
- 2.Sung H et al. Global patterns in excess body weight and the associated cancer burden. CA Cancer J. Clin. 69, 88–112 (2019). [DOI] [PubMed] [Google Scholar]
- 3.Choi Y et al. Body mass index and survival in patients with renal cell carcinoma: a clinical-based cohort and meta-analysis. Int. J. Cancer 132, 625–634 (2013). [DOI] [PubMed] [Google Scholar]
- 4.Hakimi AA et al. An epidemiologic and genomic investigation into the obesity paradox in renal cell carcinoma. J. Natl Cancer Inst. 105, 1862–1870 (2013). [DOI] [PMC free article] [PubMed] [Google Scholar]
- 5.Schlesinger S et al. Postdiagnosis body mass index and risk of mortality in colorectal cancer survivors: a prospective study and meta-analysis. Cancer Causes Control 25, 1407–1418 (2014). [DOI] [PubMed] [Google Scholar]
- 6.Wang Z et al. Paradoxical effects of obesity on T cell function during tumor progression and PD-1 checkpoint blockade. Nat. Med. 25, 141–151 (2019). [DOI] [PMC free article] [PubMed] [Google Scholar]
- 7.Cortellini A et al. A multicenter study of body mass index in cancer patients treated with anti-PD-1/PD-L1 immune checkpoint inhibitors: when overweight becomes favorable. J. Immunother. Cancer 7, 57 (2019). [DOI] [PMC free article] [PubMed] [Google Scholar]
- 8.Assumpcao JAF, Pasquarelli-do-Nascimento G, Duarte MSV, Bonamino MH & Magalhaes KG The ambiguous role of obesity in oncology by promoting cancer but boosting antitumor immunotherapy. J. Biomed. Sci. 29, 12 (2022). [DOI] [PMC free article] [PubMed] [Google Scholar]
- 9.Gordon SR et al. PD-1 expression by tumour-associated macrophages inhibits phagocytosis and tumour immunity. Nature 545, 495–499 (2017). [DOI] [PMC free article] [PubMed] [Google Scholar]
- 10.Huang X et al. PD-1 expression by macrophages plays a pathologic role in altering microbial clearance and the innate inflammatory response to sepsis. Proc. Natl Acad. Sci. USA 106, 6303–6308 (2009). [DOI] [PMC free article] [PubMed] [Google Scholar]
- 11.Strauss L et al. Targeted deletion of PD-1 in myeloid cells induces antitumor immunity. Sci. Immunol. 5, eaay1863 (2020). [DOI] [PMC free article] [PubMed] [Google Scholar]
- 12.Yao A et al. Programmed death 1 deficiency induces the polarization of macrophages/microglia to the M1 phenotype after spinal cord injury in mice. Neurotherapeutics 11, 636–650 (2014). [DOI] [PMC free article] [PubMed] [Google Scholar]
- 13.Avgerinos KI, Spyrou N, Mantzoros CS & Dalamaga M Obesity and cancer risk: emerging biological mechanisms and perspectives. Metab. Clin. Exp. 92, 121–135 (2019). [DOI] [PubMed] [Google Scholar]
- 14.Calle EE, Rodriguez C, Walker-Thurmond K & Thun MJ Overweight, obesity, and mortality from cancer in a prospectively studied cohort of U.S. adults. N. Engl. J. Med. 348, 1625–1638 (2003). [DOI] [PubMed] [Google Scholar]
- 15.Dai Z, Xu YC & Niu L Obesity and colorectal cancer risk: a meta-analysis of cohort studies. World J. Gastroenterol. 13, 4199–4206 (2007). [DOI] [PMC free article] [PubMed] [Google Scholar]
- 16.Murphy WJ & Longo DL The surprisingly positive association between obesity and cancer immunotherapy efficacy. JAMA 321, 1247–1248 (2019). [DOI] [PubMed] [Google Scholar]
- 17.Donnelly D et al. The complex relationship between body mass index and response to immune checkpoint inhibition in metastatic melanoma patients. J. Immunother. Cancer 7, 222 (2019). [DOI] [PMC free article] [PubMed] [Google Scholar]
- 18.Naik GS et al. Complex inter-relationship of body mass index, gender and serum creatinine on survival: exploring the obesity paradox in melanoma patients treated with checkpoint inhibition. J. Immunother. Cancer 7, 89 (2019). [DOI] [PMC free article] [PubMed] [Google Scholar]
- 19.Sanchez A et al. Transcriptomic signatures related to the obesity paradox in patients with clear cell renal cell carcinoma: a cohort study. Lancet Oncol. 21, 283–293 (2020). [DOI] [PMC free article] [PubMed] [Google Scholar]
- 20.Woodall MJ, Neumann S, Campbell K, Pattison ST & Young SL The effects of obesity on anti-cancer immunity and cancer immunotherapy. Cancers 12, 1230 (2020). [DOI] [PMC free article] [PubMed] [Google Scholar]
- 21.Boi SK et al. Obesity diminishes response to PD-1-based immunotherapies in renal cancer. J Immunother. Cancer 8, e000725 (2020). [DOI] [PMC free article] [PubMed] [Google Scholar]
- 22.Lennon H, Sperrin M, Badrick E & Renehan AG The obesity paradox in cancer: a review. Curr. Oncol. Rep. 18, 56 (2016). [DOI] [PMC free article] [PubMed] [Google Scholar]
- 23.Le CT et al. PD-1 blockade reverses obesity-mediated T cell priming impairment. Front. Immunol. 11, 590568 (2020). [DOI] [PMC free article] [PubMed] [Google Scholar]
- 24.Ringel AE et al. Obesity shapes metabolism in the tumor microenvironment to suppress anti-tumor immunity. Cell 183, 1848–1866 (2020). [DOI] [PMC free article] [PubMed] [Google Scholar]
- 25.Chakarov S, Bleriot C & Ginhoux F Role of adipose tissue macrophages in obesity-related disorders. J. Exp. Med. 219, e20211948 (2022). [DOI] [PMC free article] [PubMed] [Google Scholar]
- 26.Hamada K et al. Obesity strongly promotes growth of mouse MC38 colon cancer in an orthotopic-syngeneic C57BL/6 mouse model. In Vivo 36, 1643–1646 (2022). [DOI] [PMC free article] [PubMed] [Google Scholar]
- 27.Wagner A et al. Metabolic modeling of single Th17 cells reveals regulators of autoimmunity. Cell 184, 4168–4185 (2021). [DOI] [PMC free article] [PubMed] [Google Scholar]
- 28.Christofides A et al. SHP-2 and PD-1-SHP-2 signaling regulate myeloid cell differentiation and antitumor responses. Nat. Immunol. 24, 55–68 (2023). [DOI] [PMC free article] [PubMed] [Google Scholar]
- 29.Bally AP et al. NF-kappaB regulates PD-1 expression in macrophages. J. Immunol. 194, 4545–4554 (2015). [DOI] [PMC free article] [PubMed] [Google Scholar]
- 30.Obradovic A et al. Single-cell protein activity analysis identifies recurrence-associated renal tumor macrophages. Cell 184, 2988–3005 (2021). [DOI] [PMC free article] [PubMed] [Google Scholar]
- 31.Pelka K et al. Spatially organized multicellular immune hubs in human colorectal cancer. Cell 184, 4734–4752 (2021). [DOI] [PMC free article] [PubMed] [Google Scholar]
- 32.Katzenelenbogen Y et al. Coupled scRNA-seq and intracellular protein activity reveal an immunosuppressive role of TREM2 in cancer. Cell 182, 872–885 (2020). [DOI] [PubMed] [Google Scholar]
- 33.Wolf EM, Fingleton B & Hasty AH The therapeutic potential of TREM2 in cancer. Front. Oncol. 12, 984193 (2022). [DOI] [PMC free article] [PubMed] [Google Scholar]
- 34.Li W et al. Correlation between PD-1/PD-L1 expression and polarization in tumor-associated macrophages: a key player in tumor immunotherapy. Cytokine Growth Factor Rev. 67, 49–57 (2022). [DOI] [PubMed] [Google Scholar]
- 35.Schmidt FM et al. Inflammatory cytokines in general and central obesity and modulating effects of physical activity. PLoS ONE 10, e0121971 (2015). [DOI] [PMC free article] [PubMed] [Google Scholar]
- 36.Kumar R et al. Association of leptin with obesity and insulin resistance. Cureus 12, e12178 (2020). [DOI] [PMC free article] [PubMed] [Google Scholar]
- 37.Zhao L et al. A panel of free fatty acid ratios to predict the development of metabolic abnormalities in healthy obese individuals. Sci. Rep. 6, 28418 (2016). [DOI] [PMC free article] [PubMed] [Google Scholar]
- 38.Kono Y et al. Increased PD-1-positive macrophages in the tissue of gastric cancer are closely associated with poor prognosis in gastric cancer patients. BMC Cancer 20, 175 (2020). [DOI] [PMC free article] [PubMed] [Google Scholar]
- 39.Freemerman AJ et al. Myeloid Slc2a1-deficient murine model revealed macrophage activation and metabolic phenotype are fueled by GLUT1. J. Immunol. 202, 1265–1286 (2019). [DOI] [PMC free article] [PubMed] [Google Scholar]
- 40.Wang W et al. Diabetic hyperglycemia promotes primary tumor progression through glycation-induced tumor extracellular matrix stiffening. Sci. Adv. 8, eabo1673 (2022). [DOI] [PMC free article] [PubMed] [Google Scholar]
- 41.Dudzinski SO et al. Leptin augments antitumor immunity in obesity by repolarizing tumor-associated macrophages. J. Immunol. 207, 3122–3130 (2021). [DOI] [PMC free article] [PubMed] [Google Scholar]
- 42.Reinfeld BI et al. Cell-programmed nutrient partitioning in the tumour microenvironment. Nature 593, 282–288 (2021). [DOI] [PMC free article] [PubMed] [Google Scholar]
- 43.Sorrelle N et al. Improved multiplex immunohistochemistry for immune microenvironment evaluation of mouse formalin-fixed, paraffin-embedded tissues. J. Immunol. 202, 292–299 (2019). [DOI] [PMC free article] [PubMed] [Google Scholar]
- 44.Zhang L et al. Single-cell analyses inform mechanisms of myeloid-targeted therapies in colon cancer. Cell 181, 442–459 (2020). [DOI] [PubMed] [Google Scholar]
- 45.Hao Y et al. Integrated analysis of multimodal single-cell data. Cell 184, 3573–3587 (2021). [DOI] [PMC free article] [PubMed] [Google Scholar]
- 46.Finak G et al. MAST: a flexible statistical framework for assessing transcriptional changes and characterizing heterogeneity in single-cell RNA sequencing data. Genome Biol. 16, 278 (2015). [DOI] [PMC free article] [PubMed] [Google Scholar]
Associated Data
This section collects any data citations, data availability statements, or supplementary materials included in this article.
Supplementary Materials
Data Availability Statement
Materials are available upon request from the corresponding author with an appropriate material transfer agreement. scRNA-seq data are available at the Gene Expression Omnibus under accession number GSE179936. RNA-seq data are publicly available at the Gene Expression Omnibus under accession number GSE242839. Source data are provided with this paper.