

Summary
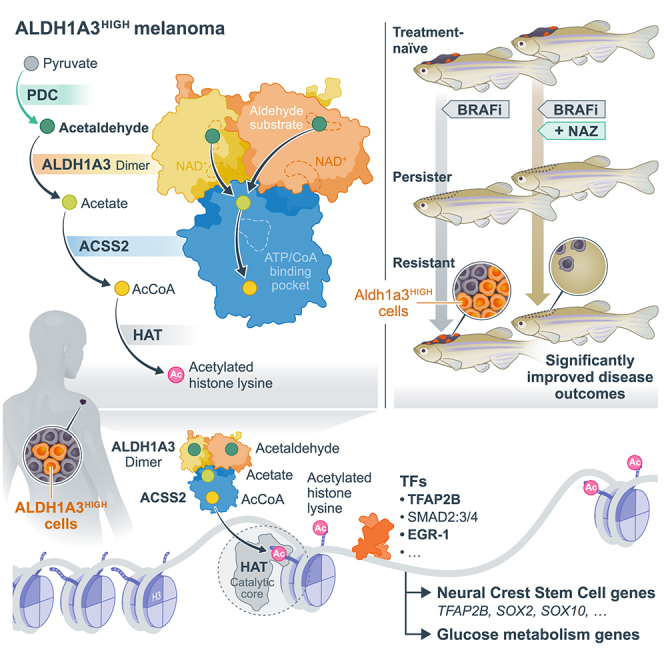
Cancer cellular heterogeneity and therapy resistance arise substantially from metabolic and transcriptional adaptations, but how these are interconnected is poorly understood. Here, we show that, in melanoma, the cancer stem cell marker aldehyde dehydrogenase 1A3 (ALDH1A3) forms an enzymatic partnership with acetyl-coenzyme A (CoA) synthetase 2 (ACSS2) in the nucleus to couple high glucose metabolic flux with acetyl-histone H3 modification of neural crest (NC) lineage and glucose metabolism genes. Importantly, we show that acetaldehyde is a metabolite source for acetyl-histone H3 modification in an ALDH1A3-dependent manner, providing a physiologic function for this highly volatile and toxic metabolite. In a zebrafish melanoma residual disease model, an ALDH1-high subpopulation emerges following BRAF inhibitor treatment, and targeting these with an ALDH1 suicide inhibitor, nifuroxazide, delays or prevents BRAF inhibitor drug-resistant relapse. Our work reveals that the ALDH1A3-ACSS2 couple directly coordinates nuclear acetaldehyde-acetyl-CoA metabolism with specific chromatin-based gene regulation and represents a potential therapeutic vulnerability in melanoma.
Keywords: melanoma, pyruvate metabolism, acetaldehyde, ALDH1A3, ACSS2, TFAP2B, neural crest stem cell, residual disease, Nifuroxazide
Graphical abstract
Highlights
-
•
ALDH-high metabolic activity controls stem cell transcriptional states
-
•
Nuclear ALDH1A3 partners with ACSS2 to promote selective acetyl-histone H3
-
•
Acetaldehyde is an acetyl source for ALDH1A3-dependent histone H3 acetylation
-
•
ALDH1A3 is a master regulator and drug target of melanoma heterogeneity
Metabolic and transcriptional cellular heterogeneity drives melanoma drug resistance and progression. This study reveals that ALDH1A3-ACSS2 directly coordinates nuclear acetaldehyde-acetyl-CoA metabolism with histone H3 acetylation and is associated with TFAP2B-neural crest stem cell and glucose metabolism gene expression. The ALDH1A3 metabolism-stem cell axis represents a potential therapeutic vulnerability in melanoma.
Introduction
The perennial challenge in cancer therapies is that non-genetic mechanisms can potentiate dynamic cellular state switches.1 Such plasticity enables cancer cells to adapt and thrive under environmental pressures including immune surveillance, nutrient deprivation, and therapy.2,3,4 Across tumor types, co-opting of common developmental (fetal) lineage programs often underlie tumor progression and drug resistance.5,6,7,8,9,10,11,12 A deeper understanding of the interplay between epigenetic, transcriptional, and metabolic plasticity in cell state reprogramming is needed to make transformative progress toward curtailing tumor state transitions and enhancing treatment efficacy.
For many patients with advanced melanoma, systemic targeted and immune therapies have greatly improved prognosis.13,14,15,16,17 However, melanoma cell subpopulations undergoing phenotypic transitions into dedifferentiated stem-like states cause innate or acquired drug resistance and tumor recurrence. In such subpopulations, a transcriptional state resembling that of neural crest (NC) stem cells (NCSCs) and characterized by low activity of melanocyte-inducing transcription factor (MITF) emerges.12,18,19,20 This state then becomes enriched after therapy, which is predictive for patient outcomes.4,8,9,10,12,18,19,21,22,23,24,25 In addition to transcriptional states, metabolic heterogeneity has recently come to the forefront as a mechanism influencing tumor cell plasticity and survival.26,27,28,29,30,31,32,33,34,35,36 While the developmental NC state is known to be highly sensitive to metabolic deficiencies,37,38,39,40,41 we lack an understanding of how metabolic states are coordinated with NC programs in melanoma.
In this study, we discover that the pan-cancer stem cell marker ALDH1A3 is a central regulator of both metabolic and stem cell transcriptional states in melanoma. By tracing acetaldehyde to acetyl-histone H3, we demonstrate it is a source for acetylated histones dependent on ALDH1A3 and link this to transcription of genes regulating NCSC and glucose metabolism. Our findings uncover an actionable, high-dimensional metabolic-transcriptional framework that controls melanoma stem cell plasticity.
Results
ALDH1A3High melanomas are enriched for NCSC and glucose metabolic states
When patients with melanoma become resistant to mitogen-activated protein kinase (MAPK) inhibitor therapy, their tumor cells can upregulate stem cell marker expression including ALDH1 enzymes (Figure S1A).42,43,44 In mouse melanoma models, we find Aldh1a3 expression is tightly associated with dedifferentiated, NC, and stem cell states, which have been reported to fuel cancer growth in a cellular hierarchy45,46 (Figures S1B and S1C). From these observations, we hypothesized that the ALDH-high metabolic activity of cancer cells is the consequence of a changed transcriptional state that contributes to melanoma stemness and plasticity.
To investigate this, we considered that ALDH-high (ALDHHigh) activity is heterogeneous in human cell lines (Figure S1D), and that the predominant ALDH activity in melanoma cell line A375 is due to ALDH1A3.42 Thus, we sorted A375 cells for the highest and lowest ALDH activity, termed ALDHHigh and ALDHLow, using Aldefluor (a fluorescent amino acetaldehyde) (Figure 1A). As demonstrated previously, these sorted ALDHHigh cells have increased tumor-initiating potential.42,44 When we validated ALDH1A3 expression by immunocytochemistry (ICC), we were intrigued to see that ALDH1A3 was predominantly expressed in the cytosol in ALDHLow cells but was enriched in the nucleus of sorted ALDHHigh cells (Figure 1B).
Figure 1.

ALDH1A3High melanomas are enriched for NCSC and glucose metabolic states
(A) ALDHHigh and ALDHLow melanoma cell subpopulations. The Aldefluor assay quantifies ALDH activity in live cells by measuring the accumulated fluorescence from converted BODIPY-aminoacetaldehyde (BAAA) to BODIPY-aminoacetate (BAA−). Highest and lowest Aldefluor activity, termed ALDHHigh and ALDHLow subpopulations, were isolated by FACS. Negative control: diemethylaminobenzaldehyde (DEAB), a pan-ALDH inhibitor.
(B) ALDH1A3 cellular localization and levels. Immunocytochemistry (ICC) staining by fluorescence antibody labeling ALDH1A3 in A375 sorted ALDHHigh and ALDHLow cells. Scale bar, 50 μm. Quantification of cells enriched with nuclear ALDH1A3: experiment repeat n = 2, quantified image fields: 11 for ALDHHigh and 9 for ALDHLow, mean ± SD; non-paired Kolmogorov-Smirnov test, ∗∗∗∗p < 0.0001. Cells showing minimal cytoplastic content outside DAPI-stained regions (indicated with an asterisk [∗]) were determined as unfit following FACS and thus excluded from quantification.
(C) Differential gene expression in ALDHHigh and ALDHLow melanoma cells. Volcano plot showing differentially expressed genes analyzed from DESeq2. n = 3, fold change >1, adjusted p <0.05. See also Table S1.
(D and E) Gene set enrichment analysis in melanoma cells and patient samples. Dot plot of pathway analysis showing significantly enriched terms (D) in ALDHHigh and ALDHLow cells and (E) in ALDH1A3High and ALDH1A3Low patient samples. Dot sizes represent -log10 FDR q value (weighted Kolmogorov-Smirnov test) and colors indicate normalized enrichment score (NES). Patient groups are defined in Figure S1G. See also Tables S1 and S2.
(F) Heatmap of NCSC gene sets variation analysis (GVSA) score from patient samples ranked by the ALDH1A3 level. Melanoma patient samples from The Cancer Genome Atlas (TCGA), Lund, and Bergen cohorts unanimously showed positive correlation between ALDH1A3 and NCSC gene sets as annotated. ∗p < 0.05, ∗∗∗∗p < 0.0001, Spearman’s rank correlation critical probability exact (p) value.
(G) ALDH1A3 and TFAP2B scRNA-seq cluster in metastatic patient samples. Uniform manifold approximation and projection (UMAP) feature plot showing expression level of ALDH1A3 and TFAP2B in scRNA-seq of re-analyzed patient samples of metastatic melanomas.47 Red circle highlights an ALDH1A3 and TFAP2B cluster.
(H) ALDH1A3 levels are significantly higher in ICB non-responders. scRNA-seq data from approximately 14, 200 malignant cells from Pozniak et al., 202448 were interrogated for ALDH1A3 expression and early response to ICB. ∗∗∗∗p < 0.0001, Wilcoxon signed-rank test.
(I) Schematic of ALDH1A3 activity stratified states. High levels of ALDH1A3 Aldefluor activity are associated with nuclear localization and a high glucose metabolism and TFAP2B-NC stem cell dual state. Low levels of ALDH1A3 Aldefluor activity are associated with a differentiated, immunogenic, and starved-like state.
We then conducted RNA sequencing (RNA-seq) of sorted ALDHHigh and ALDHLow cells and identified high expression of genes associated with dedifferentiated, NC, and stem cell states (including SOX2, SOX10, GAS7, GDNF, RXRG, and TFAP2B) in ALDHHigh cells (Figures 1C, 1D, and S1E; Table S1 and S2). These genes were also identified as the top marker genes for a less-differentiated state as measured by CytoTRACE in murine melanoma (Figure S1F). This molecular profile resembles a cell state present in drug-resistant melanomas that is predictive of poor outcomes for patients treated with both targeted and immunotherapy.9,10,49
In contrast, ALDHLow cells were enriched for interferon regulatory factor 1 (IRF1) target genes (IFIT3, IL18, PDL1), proinflammatory genes (TAP2, PSMB9, SMAD7) as well as MITF target pigmentation (differentiation) genes (MLPH) (Figures 1C and 1D; Table S1). Metabolic-transcriptional signatures were also highly distinct in ALDHHigh and ALDHLow cell populations, with glycolysis pathway genes (PFKFB3, PDHX) enriched in ALDHHigh cells, whereas starvation response-related fatty acid metabolism genes (ACSL5, SLC12A7) were enriched in ALDHLow cells (Figure 1D). Taken together, the ALDH1A3High state has features of both NCSC and high glucose metabolism, while ALDH1A3Low has proinflammatory and differentiation features.20,37,50,51
Next, we asked if the ALDH1A3-enriched state is present in human patient samples. We ranked patient samples from available datasets based on ALDH1A3 RNA levels, and then selected ALDH1A3-high and ALDH1A3-low patients from each cohort; top and bottom 10% for TCGA52 and Lund (primary and metastatic melanomas),53 and top and bottom 25% for Bergen dataset (stage IV melanomas)54 (Figure S1G). Gene expression-based melanoma subtype consensus has previously been established from these cohorts, which successfully stratified prognosis independent of oncogenic genotype.55 In our case, for the ALDH1A3-high samples, we found that the NCSC state as well as mesenchymal state (epithelial to mesenchymal transition [EMT]) were enriched (Figures 1E, 1F, and S1H; Tables S1 and S2). Analysis of a fourth independent patient sample dataset revealed a direct positive correlation between ALDH1A3 expression and NCSC transcriptional signatures (Figure S1I).
We were particularly intrigued to see a strong association between ALDH1A3 and TFAP2B, given that we have recently shown tfap2b marks an adult multipotent melanocyte stem cell population in zebrafish46 (Figures 1C, S1E, and S1F). The ALDH1A3-TFAP2B association was isoform specific: across the entire ALDH family, TFAP2B was only positively correlated with ALDH1A3 (Figure S1J). In contrast, TFAP2A, a related family member expressed in proliferative melanoma that shares near-identical binding motif with TFAP2B (Figure S1K), was negatively correlated with ALDH1A3 (Figure S1L). Given these data, we re-analyzed single-cell RNA-seq (scRNA-seq) data from 15 patient melanoma samples47 and found that ALDH1A3 and TFAP2B are co-expressed in a distinct cell cluster present in five out of 15 samples of varied mutation subtypes, indicating that there are enough cells in this state to form a cluster and that this cluster does not simply come from a single patient or genotype (Figures 1G and S1M). Thus, in five independent melanoma patient datasets, ALDH1A3 expression correlates with TFAP2-NCSC expression.
In contrast to ALDH-high melanomas, and in agreement with our RNA-seq analysis (Figure 1D), ALDH1A3-low samples were enriched in proinflammatory gene signatures and MITF pigmentation target genes (Figures 1E; S1H, and S1L). Proinflammation signatures have predictive value of the immune checkpoint blockade (ICB) response, which has greatly improved patient outcomes for advanced-stage melanoma.56 We addressed how ALDH1A3 expression levels correlate with patient response to ICB. We analyzed scRNA-seq of >14,000 melanoma cells from treatment-naive patients with stage III/IV melanoma who later received ICB (nivolumab or ipilimumab and nivolumab) and we found ALDH1A3-high expression associated with “non-responders,” while ALDH1A3-low expression was associated with "responders" to ICB (Figure 1H).
Collectively, our data support a model in which high ALDH1A3 metabolic activity segregates with transcriptional activation of TFAP2B-NCSC-driven developmental stem cell program, high expression of glucose metabolism genes, and resistance to both targeted and ICB therapy, while low-ALDH1A3 metabolic states have features of melanocyte differentiation, low glucose metabolism, and robust immunogenicity (Figure 1I).
TFAP2B promotes stemness and dedifferentiation in ALDH1A3High melanoma cells
We next asked whether ALDH-associated melanoma stem cell phenotypes are directly regulated by TFAP2B. To do this, we selected two cutaneous melanoma cell lines, A375 and C089, both bearing wild-type (WT) p53 and BRAF(V600E) mutations.42,57 ALDH1A3 and TFAP2B are both expressed at high levels in A375 and at moderate levels in C089 (Figure 2A). Next, we engineered these two lines to knock out or overexpress ALDH1A3 (Figure S2A). By western blot, we validated that ALDH1A3 knockout (KO) led to reduced TFAP2B, while ALDH1A3 overexpression (OE) upregulated TFAP2B (Figures 2A and 2B). Using Aldefluor, we validated ALDH1A3 KO and OE has significantly shifted ALDH activity toward low and high states, respectively (Figures 2C and 2D). Consistently, RT-qPCR revealed that ALDH1A3 KO led to reduced TFAP2B-NCSC gene expression, concomitant with increased expression of IRF1 and MITF target genes in both cell lines, while this response was reversed in cells that overexpressed ALDH1A3 (Figure 2E). Taken together, these data support that ALDH1A3 is a direct regulator of the TFAP2B-NCSC state.
Figure 2.

TFAP2B promotes stemness and dedifferentiation in ALDH1A3High melanoma cells
(A and B) TFAP2B protein levels are dependent on ALDH1A3. Western blot and quantification of ALDH1A3 and TFAP2B protein expression in ALDH1A3 control, KO, and OE cells. n = 3, mean ± SD; one-way ANOVA with Tukey’s test for multiple comparisons.
(C and D) ALDH1A3 melanoma cell models. Aldefluor activity and quantification in ALDH1A3 KO, OE, and vehicle control cells (A375 and C089 cells). n = 3, mean ± SD; one-way ANOVA with Tukey’s test correction for multiple comparisons.
(E) The ALDH1A3-NC stem cell (NCSC) gene signature. RT-qPCR results of NCSC signature genes in control versus ALDH1A3 KO and OE cells (A375 and C089 cells, three bio-replicants with three technical replicates each).
(F–H) TFAP2B rescues ALDH1A3 activity in colony assays. Representative images and quantification of colonies formed by A375 cell control, ALDH1A3 KO, ALDH1A3 OE, TFAP2B KO, and combined ALDH1A3 KO with TFAP2B OE conditions. Quantification on both A375 and C089 cells across each condition group, n = 3 per condition, mean ± SD one-way ANOVA with Tukey’s test for multiple comparisons.
(I) Schematics of the establishment of low-passage melanoma patient-derived (MPD) cells and experimental design for molecular profiling of ALDH1A3 target genes.
(J and K) ALDH1A3 OE promotes TFAP2B expression in low-passage patient cells. MPD 001 and 002 cells are ALDH1A3 low, MAPKi sensitive, ALDH1A3 high, and MAPKi resistant, respectively. RT-qPCR of ALDH1A3, TFAP2A, TFAP2B expression in control cells and cells over-expressing ALDH1A3. n = 3, mean ± SD; multiple non-paired t test corrected with Holm-Sidak’s method.
∗p < 0.05; ∗∗p < 0.01; ∗∗∗p < 0.001; ∗∗∗∗p < 0.0001.
See also Figure S2.
Next, to test the phenotypic response to altering ALDH1A3 and TFAP2B, we found that ALDH1A3 KO led to decreased colony formation while ALDH1A3 OE increased colony formation in both A375 and C089 (Figures 2F–2H), consistent with the pan-cancer effect of ALDH activity in cancer stem-like states.42,43,58 Remarkably, TFAP2B KO phenocopied ALDH1A3 deficiency in colony assays (Figures 2F–2H). We were unable to assess the impact of TFAP2B OE alone in colony assays due to neuronal-like differentiation, consistent with TFAP2B being a powerful NC development regulator. However, in ALDH1A3 KO cells, TFAP2B OE partially rescued the stemness deficiency, leading to enhanced colony-formation capacity in both ALDH1A3 and TFAP2B KO cells (Figures 2F–2H and S2B). These data indicate that TFAP2B is a downstream mediator of ALDH1A3 that sustains cancer stemness in melanoma.
Next, we set out to test if ALDH1A3 mediates TFAP2B expression in patient samples. We obtained low-passage human melanoma cells with associated clinical treatment response data, termed melanoma patient-derived (MPD) cells. With this new resource, we employed MPD001 and MPD002 cells from patients with BRAFV600-mutant melanoma, with relatively low and very high levels of ALDH1A3, respectively (Figures 2I and S2C). The clinical records show that the patient’s disease for MPD001 donor was sensitive initially but then continued to progress on immune therapy (ipilimumab) as well as targeted therapies (vemurafenib), while the patient’s disease for MPD002 was innately resistant to vemurafenib as well as ipilimumab. We found that TFAP2B was upregulated in MPD001 ALDH1A3 OE cells, whereas melanocyte differentiation gene TFAP2A was downregulated (Figure 2J). Moreover, these changes upon ALDH1A3 OE segregated with an observable loss of pigmentation, indicative of melanocyte de-differentiation into a stem cell-like state (Figure S2D). In contrast, ALDH1A3 knockdown (KD) in MPD002 cells led to decreased TFAP2B, whereas TFAP2A was increased (Figure 2K). Thus, we conclude that ALDH1A3 is sufficient to promote TFAP2B gene expression.
ALDH1A3High cells use glucose while ALDH1A3Low cells rely on acetate for acetyl-coenzyme A production
Next, we sought to explore relationships between ALDH1A3 function and the metabolic states informed by RNA-seq in cells and in patients (Figure 1). To this end, we traced 13C6-labeled glucose in two A375-based melanoma cell models: (1) WT control versus ALDH1A3 KO cells following 24-h labeling; and (2) following 12-h labeling, non-engineered cells sorted for ALDH1A3High and ALDH1A3Low (Figure 3A; Table S3). We did not find any difference in 13C6-glucose uptake between cells having different levels of ALDH1A3 (Figure 3B), despite the increased expression of glycolysis genes in ALDH1A3High cells determined by RNA-seq analysis. Instead, we observed significantly higher glucose-derived carbon flux in cells with high ALDH1A3, as shown by an increase in 13C-labeled carbon in pyruvate and tricarboxylic acid (TCA) cycle intermediates, including citric acid, α-ketoglutaric acid, succinic acid, and malic acid (Figures 3C and 3D). Conversely, in ALDH1A3 KO and ALDH1A3Low cells, glucose-derived carbon was converted into ketone bodies such as aceto-acetate, a metabolite synthesized from acetyl-coenzyme A (CoA), reflecting a starvation-like metabolic state (Figure 3E). Despite the lower glycolytic flux, ALDH1A3 KO cells produced higher levels of lactate both in cells and secreted into the culture medium (Figure 3F). These data indicate that ALDH1A3High cells are primed to execute glycolysis and oxidative phosphorylation (OXPHOS), whereas ALDH1A3Low cells exist in a starvation-like state and secrete lactate. Consequently, we reasoned these states exert differential metabolic and epigenetic effects on surrounding cancer and stromal cells.59,60
Figure 3.

ALDH1A3High cells use glucose while ALDH1A3Low cells rely on acetate for acetyl-CoA production
(A–E) (A) Schematic of 13C6 glucose tracing experiment. Central carbon metabolites were profiled by UPLC-MRM/MS (ultra-performance liquid chromatography electrospray ionization-tandem mass spectrometry in multiple reactions monitoring [MRM] mode) in (B). Glucose (C) and pyruvate (D) TCA cycle metabolites: citrate, alpha-ketoglutarate, succinic acid, malic acid, and (E) aceto-acetate (n = 3 for WT vs. ALDH1A3 KO cells; n = 5 for ALDHHigh vs. ALDHLow cells. Multiple paired t test corrected with Holm-Sidak’s method.).
(F) ALDH1A3 KO cells generate and secrete lactate. Intracellular lactate measured by targeted UPLC-MRM/MS (n = 3, multiple paired t test corrected with Holm-Sidak’s method). Secreted lactate levels were measured by a colorimetric lactate assay kit and normalized to standards (n = 3, unpaired student t test).
(G and H) ALDH1A3 KO cells generate more acetyl-CoA but not from glucose. (G) Intracellular glucose without 13C6 labeling and (H) total acetyl-CoA measured by targeted UPLC-MRM/MS (n = 3, multiple paired t test corrected with Holm-Sidak’s method).
(I and J) Schematic of 13C2 acetate tracing experiment. 13C2 acetate tracing experiment designed for 13C-incoporation profiling by high-pressure liquid chromatography (HPLC) in (J) whole-cell and nuclear acetyl-CoA. n = 5, two-way ANOVA corrected with Holm-Sidak’s method.
(K and L) Western blot analyses of pan-acetyl-histone H3 (acetyl-K9 + K14 + K18 + K23 + K27) and total histone H3 protein levels in lysates of A375 and C089 cell lines with vehicle control (WT), ALDH1A3 KO, or ALDH1A3 OE, respectively, with total histone H3 probed as loading control and (L) quantification (n = 3, mean ± SD; one-way ANOVA with Tukey’s correction for multiple comparisons.).
(M) Schematic of ALDH1A3 and metabolic states. ALDH1A3 acts through two different sources of acetyl (Ac)-CoA production: high glucose flux generates high levels of pyruvate, leading to Ac-CoA in ALDHHigh cells, while ALDHLow cells preferentially uptake acetate as an Ac-CoA source.
∗p < 0.05; ∗∗p < 0.01; ∗∗∗p < 0.001; ∗∗∗∗p < 0.0001.
See also Figures S3 and S4 and Table S3.
Acetyl-CoA, an acetyl group donor in biochemical reactions, is generated from pyruvate through glycolysis or through oxidation of long-chain fatty acids or certain amino acids, and its availability is known to shape both metabolic processes as well as epigenetic regulation.61 Unexpectedly, we found that total levels of acetyl-CoA increased in ALDH1A3Low cells despite decreased glycolysis and reduced TCA cycle flux (Figure 3G). This increase of total acetyl-CoA was not derived from a glucose source, as indicated by 13C6 glucose tracing (Figure 3H). Given that cancer cells under metabolic stress can support as much as half of their lipid synthesis by using acetate as a substrate,62 we hypothesized that ALDH1A3Low melanoma cells supplement their carbon source by switching from glucose to acetate. When we traced 13C2-acetate incorporation into acetyl-CoA (Figure 3I), we found that ALDH1A3 KO cells had a higher percentage of acetate-derived acetyl-CoA relative to control cells, both within the whole cell and in the nuclear fraction (Figure 3J).
To address the potential link between metabolic processes and chromatin modification, we found that the increase in acetyl-CoA in ALDH1A3 KO and sorted ALDHLow cells was also concomitant with a significant increase in acetyl-histone H3 (∼30%) (Figures 3K, 3L, and S3A), while ALDH1A3 OE led to a ∼15% decrease (Figures 3K, 3L, and S3A). Thus, we conclude that cells with high levels of ALDH1A3 rapidly metabolize glucose to generate pyruvate, while cells with low ALDH1A3 activity preferentially use acetate as a carbon source for acetyl-CoA (Figure 3M).
Pyruvate-derived acetaldehyde serves as an acetyl source for histone H3-acetylation
In human cells, pyruvate dehydrogenase (PDH) can generate acetaldehyde, an ALDH substrate, from pyruvate.63 We investigated if this pyruvate-derived acetaldehyde pool could serve as a source of histone H3 acetyl modification in melanoma. To answer this question, we traced 13C2-labeled acetaldehyde and performed histone proteomic analyses (Figure 4A). Indeed, in our two independent melanoma cell lines (control vs. ALDH1A3 KO), we detected higher levels of 13C2-labeled acetylated histone H3 proteins in cells with high ALDH1A3 activity, with the incorporation at H3K14ac and H3K23ac especially responsive to ALDH1A3 levels (Figure 4B, left panel). This demonstrates that acetaldehyde can be a direct source for histone H3 acetylation.
Figure 4.

Pyruvate-derived acetaldehyde serves as an acetyl source for histone H3-acetylation
(A) Schematic summarizing the acetyl group transfer from pyruvate to histone mediated by ALDH1A3 metabolizing acetaldehyde, with the experiment design that 13C2-acetaldehyde and/or 13C3-pyruvate-derived acetyl groups can be traced to histone acetylation.
(B) Pyruvate-derived acetaldehyde is an acetyl source across multiple lysine residues on histone H3. 13C2-acetyl groups were traced from acetaldehyde into lysine acetylation at K9, K14, K18, K23, and K27, measured by HPLC-MS/MS. ALDH1A3 KO cells treated with 13C2-acetaldehyde showed fewer 13C2-acetyl groups at K9, K14, and K23 residues. Similar differential patterns of 13C2-acetyl group incorporation at histone H3 were observed when cells were treated with 13C3 sodium pyruvate. n = 5 per cell line; p values by two-way ANOVA with Sidak’s multiple comparisons test.
(C and D) Volcano plot of differentially acetylated histone H3K27 peaks (C) and H3K23 peaks (D) from CUT&TAG in MPD002 control and ALDH1A3 KD cells (highlighted by red and blue respectively, fold change >2, FDR q <0.05). Representative NCSC gene-related peaks are annotated in the control enriched H3K23 peaks.
(E) Gene tracks of acetylated histone H3K27 and H3K23 peaks in MPD002 vehicle control versus ALDH1A3 KD cells at representative NCSC genes. No significant changes are present in H3K27, while the significant change in H3K23 acetylation is observed.
(F) Venn diagram of overlapping genes between (upper left) genes enriched in A375 control cells versus ALDH1A3 KO cells mapped from total histone H3 acetylation and (upper right) MPD002 control cells versus ALDH1A3 knockdown cells mapped from histone H3K23 acetylation. p values by Fisher’s exact test. Transcription factor binding motif over-representation analysis of the Venn diagram overlapping genes (lower panel) showed significant enrichment of AP-2 binding motif, with enrichment score by g:Profiler (e111_eg58_p18_30541362) with g:SCS multiple testing correction method applying statistical significance threshold of 0.05.64
(G) Binding motif of human TFAP2B from JASPAR database.
(H) Scatterplot shows the correlation of ALDHHigh enriched gene signature and Tfap2b regulon activities (AUCell score) in murine melanoma cells (NRASQ61K/°;Ink4a−/−).46
(I) SCENIC-inferred Tfap2b regulatory network using a murine mouse scRNA-seq dataset,46 with Tfap2b target genes in green and ALDHHigh enriched Tfap2b target genes highlighted in yellow. Tfap2b regulon genes were mapped to human homologs to allow comparison and visualization.
See also Figures S3 and S4 and Tables S4 and S5.
Next, we traced 13C3-labeled pyruvate to histones, and again consistently detected higher percentage of 13C-labeled acetylated histone H3 proteins in cells with high ALDH1A3 activity (Figure 4B, right panel). This observation supports a model in which pyruvate can serve as the source of acetaldehyde and subsequently acetate for acetyl-CoA production.
ALDH1A3 alters selective histone H3 acetylation in the genome
To better understand the significance of ALDH1A3 dependent acetyl-histone H3, we considered that selective histone acetylation mechanisms can regulate specific gene expression, including glucose metabolism enzymes,65,66 and that global histone repositories serve as reservoirs for acetyl groups.67 We hypothesized that pyruvate-derived acetaldehyde serves as a local source of acetyl-CoA for histone acetylation at specific gene loci to generate a cancer stem cell-like state. Conversely, in the low-ALDH1A3 state, acetate-derived acetyl-CoA is deposited on chromatin as a reservoir,67 serving as a rapid source for acetyl-CoA and as a buffer for intracellular pH.68,69
To determine how ALDH1A3-dependent histone H3 acetylation is deposited on chromatin, we first performed quantitative acetyl-histone H3 chromatin immunoprecipitation (ChIP)-seq using an antibody against pan-histone H3 acetylated sites (K9 + K14 + K18 + K23 + K27) (Methods S1; Figures S3 and S4). In control cells, the enriched acetyl-histone H3 peaks were clustering around transcription start sites (TSSs), especially within 1 kb of promoters, whereas, in ALDH1A3 KO cells, the enriched acetyl-histone H3 peaks were broadly dispersed throughout the genome, and particularly spreading into the distal intergenic region and intronic regions (Figures S3D and S3E). Next, we found that acetyl-histone H3 sites enriched in the ALDH1A3High state were present in NCSC and glucose metabolism pathway genes, while, conversely, the loss of ALDH1A3 was associated with a broadly dispersed acetyl-histone H3 landscape in which subsets of elevated acetyl-histone H3 peaks were associated with proinflammatory genes (Figures S4G and S4H; Table S4).
While consistent with the RNA expression patterns that we identified earlier, the use of the pan-histone acetylation antibody that recognizes five different marks could be masking the effect of site-selective acetylation events. To address this, we performed CUT&TAG analysis in MPD002 control and ALDH1A3 KD cells using individual antibodies selective in H3K23ac and H3K27ac, with H3K23ac indicated as dependent on ALDH1A3 from 13C-labeled acetaldehyde and pyruvate tracing and H3K27ac not affected. We found limited differential peaks between WT and ALDH1A3 KD groups for H3K27ac, with much stronger differential effects for H3K23ac (Figures 4C and 4D). More importantly, by mapping the H3K23ac-enriched peaks in the control compared to ALDH1A3 KD, we again identified NCSC genes, including TFAP2B and SOX10 (Figure 4E). Further, by comparing the total enriched H3 acetylation peak target genes in A375 (control versus ALDH1A3 KO) with the enriched H3K23ac peak target genes in MPD002 (control versus ALDH1A3 KD), we found the overlapping target genes are over-represented for TFAP2 transcription factor (AP-2) motif (Figures 4F and 4G; Table S5).
The discovery of the TFAP2 motif supports a likely TFAP2B feedforward loop, acting both as a direct target and mediator of ALDH1A3-dependent gene expression and thereby establishing and sustaining the ALDH1A3High NC identity. To test our prediction, we employed gene-regulatory network inference (SCENIC)70 and identified a melanoma derived Tfap2b regulon (Table S5). When comparing AUCell expression scores of the Tfap2b regulon with our ALDHHigh enriched gene set across 16,700 single melanoma cells, originating from five primary mouse murine lesions,46 we detected significant co-expression of both transcriptional programs (Figure 4H). When we intersected Tfap2b regulon genes with ALDHHigh enriched genes, we found a striking overlap that included both NC and stem cell genes such as SOX2, SOX10, SPRY4, and RXRG (Figures 4I; Table S5).
ALDH1A3 forms a predicted complex with ACSS2
Nutrition, cellular metabolism, and transcription are intimately linked with epigenetic control of gene expression.71 When we analyzed the ALDH1A3 protein interaction network database via STRING,72 we noted that acetyl-CoA synthetase 2 (Acs2) and pyruvate decarboxylase (Pdc) are interacting partners of aldehyde dehydrogenase (Ald6; ortholog of ALDH1) in yeast (Saccharomyces cerevisiae)73 (Figure 5A). This was intriguing as, in neuronal stem cell differentiation and memory formation in mammals, ACSS2 was reported to generate acetyl-CoA “on-demand” from chromatin-bound acetate associated with selective histone acetylation and gene expression.74,75
Figure 5.

ALDH1A3 forms a predicted complex with ACSS2
(A) ALDH1A3 functional association. STRING functional protein association analysis between yeast Ald6, Acs2, and Pdc1, orthologous to human ALDH1A3, ACSS2, and PDH.
(B) AlphaFold Multimer modeling of human ALDH1A3 and ACSS2. Proteins visualized as a complex in surface model (left) and ribbon model (right). The binding sites of an aldehyde substrate (retinaldehyde) and co-factor (NAD+) were created by structural alignment of the AlphaFold-Monomer predicted structure to PDB: 5fhz, a published tetramer ALDH1A3 structure. The ATP/CoA binding pocket of ACSS2 was visualized by structural alignment of AlphaFill-optimized protein-ligand complexes (ATP donor, PDB: 5k8f. CoA donor, PDB: 3gpc).
(C and D) Subcellular expression of ALDH1A3, ACSS2, and TFAP2B. (C) ICC staining by fluorescence antibody probing ALDH1A3 (yellow), ACSS2 (green), and TFAP2B (red) in sorted A375 ALDHHigh and ALDHLow cells. DAPI (blue). Scale bar, 10 μm. (D) Fluorescence signal intensity quantification of nuclear TFAP2B and ACSS2 in ICC images. 2 biological repeat experiments, n = 55 quantified single cells for ALDHHigh TFAP2B, n = 46 single cells for ALDHLow TFAP2B; n = 26 single cells for ALDHHigh ACSS2, n = 20 single cells for ALDHLow ACSS2 (represented as individual dots), mean ± SD, unpaired non-parametric Kolmogorov-Smirnov test. ∗∗∗∗p < 0.0001.
(E and F) ALDH1A3, ACSS2, and TFAP2B co-localize in the nucleus. Structured illumination microscopy (SIM) of ALDH1A3 (magenta), TFAP2B (orange), ACSS2 (green), and DAPI (blue) in A375 melanoma FACS-sorted (E) ALDHHigh cells and (F) ALDHLow cells. Scale bar, 1 μm. Complex co-localization signals were abundant (arrows) and are indicated as highlighted dots in the zoomed image in (E). Low signals of nuclear TFAP2B are highlighted in zoomed image in (F).
(G) Intensity plot profiles of the line scan across two co-localization hotspots in zoomed image of (E). Signal overlap peaks are indicated by arrows. Pearson correlation test.
(H) Intensity plot profile of the line scan across the two TFAP2B signal spots in zoomed image of (F). TFAP2B signal peaks are indicated by arrows, where no ALDH1A3 or ACSS2 signals are present. Pearson correlation test.
See also Figure S5.
Based on this, we used AlphaFold Multimer76 to predict interactions between yeast Acs2 and Ald6 and between their human homologs ACSS2 and ALDH1A3 (Figures 5B and S5A). This approach yielded complexes for both the yeast and human pairs with moderate confidence (45% and 47%, respectively). In addition, we identified strong interface conservation between Acs2 and ACSS2 (Pearson correlation of 0.61 between buried surface area of homologous residues, p = 1.7 × 10−66), with Acs2/ACSS2 binding at the perimeter of the Ald6/ALDH1A3 dimerization interface in a 1:2 stoichiometry. This binding mode ensures accessibility of the Acs2/ACSS2 binding pockets for CoA and ATP and the Ald6/ALDH1A3 substrate pockets for NAD and aldehyde. Thus, both the predicted yeast and human complexes are consistent with an ACSS2-ALDH1A3 enzymatic partnership.
Next, using immunofluorescence staining, we found that ACSS2, along with ALDH1A3 and TFAP2B, was localized in the nucleus of sorted ALDH1A3High cells but not in ALDH1A3Low cells (Figures 5C and 5D). In the presence of an ACSS2 inhibitor, we found no change in nuclear ALDH1A3, whereas nuclear TFAP2B levels were significantly reduced (Figures S5B and S5C). We propose that the ALDH1A3-ACCS2 enzymatic partnership is not required for ALDH1A3 nuclear localization; however, ALDH1A3-dependent TFAP2B expression and nuclear localization are mediated through ACSS2.
Using super-resolution imaging, we detected abundant nuclear co-localization signals of ALDH1A3-ACSS2-TFAP2B and a significant positive correlation between the linear signal distribution of any two of the three target proteins (Figures 5E–5H). In contrast, we saw minimal nuclear signals of ALDH1A3, ACSS2, or TFAP2B in sorted ALDHLow cells and the nuclear signals captured by super-resolution imaging were not overlapping (Figure 5H). Finally, we tested the potential for interaction in vivo by co-immunoprecipitation and confirmed the interaction of ACSS2 with ALDH1A3 in both A375 whole cells and the nuclear department (Figure S5D).
ALDH1A3 determines ACSS2 binding to NCSC gene loci
To verify ALDH1A3-ACSS2-dependent acetylated histone loci and target genes, we designed primers targeting the promoter regions of NCSC genes and IRF1 genes and performed ACSS2 ChIP-qPCR in both A375 and MAPKi-resistant MPD002 cells (Figure 6A). ACSS2 ChIP-qPCR revealed higher levels of ACSS2 binding to multiple NCSC gene promoter regions in control comparing to ALDH1A3 KO/KD cells, while, in contrast, ACSS2 binding was enriched at the IRF1 promoter in ALDH1A3 KO/KD cells. This effect was restored upon ALDH1A3 OE in A375 cells. These data show that ALDH1A3 is required for ACSS2 binding to specific loci to shape the genomic landscape.
Figure 6.

Acetaldehyde serves as an acetyl source for histone H3-acetylation
(A) ALDH1A3 directs gene-specific ACSS2 chromatin binding. ACSS2 ChIP-qPCR results in (left) A375 WT control versus ALDH1A3 KO and ALDH1A3 OE cells, as well as in (right) MPD002 control versus ALDH1A3 KD cells (siALDH1A3). n = 3 biological replicates each with 3 technical replicates and normalized to immunoglobulin (Ig) G control.
(B) RT-qPCR-measured NCSC gene expression change in A375 and MPD002 in response to pyruvate dehydrogenase (PDH) activity change induced by PDH inhibitors (PDHis) CPI-613 (upper) and AC-148 (lower). ∗p < 0.05; ∗∗p < 0.01; ∗∗∗p < 0.001; one-way ANOVA with Sidak’s correction.
(C) ALDH1A3-directed gene-specific ACSS2 chromatin binding relies on PDH activity. ACSS2 ChIP-qPCR results in A375 and MPD002 cells with vehicle control (Ve) versus PDH inhibitor CPI-613-treated samples (on, 24 h) and PDH inhibitor wash-off samples (24-h treatment followed by additional 24-h wash-off recovery, off). n = 2 biological repeat experiments in both A375 and MPD002 cells, each with 3 technical replicates and normalized to IgG control before heatmap scaling and plotting.
PDH inhibitors alter ACSS2 binding to selective genomic loci
To strengthen our understanding of pyruvate in the ALDH1A3-ACSS2 mechanism, we used two independent PDH inhibitors, the thiamine analogue AC-14877 (Data S1) and a commercially available lipoate related PDH inhibitor, CPI-613,78 and determined the effect on NCSC gene expression. Addition of either of the PDH inhibitors for 24 h led to decreased NCSC gene expression, followed by restored expression (except AQP1) 24 h after wash-off (Figure 6B). Next, we addressed whether PDH inhibition altered the ACSS2 binding to multiple NC gene loci by ChIP-qPCR, in both A375 and MPD002 cells. We found that ACSS2 binding to these regions in control cells was reduced with PDHi treatment and restored upon inhibitor washout (Figure 6C).
We propose a model in which ALDH1A3 and ACSS2 cooperate in a metabolic cascade from pyruvate to acetaldehyde to generate a regional chromatin source of acetyl-CoA from nuclear acetaldehyde used to selectively deposit localized histone H3 acetylation and is associated with increased expression of NCSC genes (including TFAP2B itself) and glucose metabolism genes.
ALDH1A3 cells promote drug resistance and disease recurrence in vivo
To evaluate functional relationships between ALDH1A3High cells, melanoma disease progression, and therapy resistance, we employed the widely used BRAFV600E p53 mutant zebrafish melanoma model, in which BRAF inhibitors initially reduce tumor burden followed by drug resistance and recurrent melanoma growth.79,80,81 Here, we dissected melanomas from BRAFV600E p53 mutant zebrafish that also express GFP in the melanocyte lineage (mitfa:GFP), and performed AldeRed analysis (similar to the Aldefluor assay but using a red fluorescent substrate) (Figures 7A and 7B). Through fluorescence-activated cell sorting (FACS), we identified a distinct zebrafish cell population with ALDHHigh activity that was also low for mitfa:GFP (Figure 7B), indicating that both zebrafish and human melanoma ALDHHigh cells express low levels of MITF. Next, we sorted zebrafish melanoma cells with the highest and lowest ALDH activity and performed RT-qPCR (Figures 7C and 7D). In agreement with our findings in human melanoma, we found that aldh1a3 was the most enriched ALDH family isoform in the ALDHHigh cells (Figure S6A), together with high tfap2b, sox2, and sox10, while melanoma cells with ALDHLow activity expressed irf1b (Figure 7D).
Figure 7.

ALDH1A3High subpopulations promote melanoma drug resistance in vivo
(A) Zebrafish BRAFV600E melanoma model (arrow indicates melanoma). BRAFV600E and GFP are expressed in the melanocyte lineage, by the mitfa promoter, and the zebrafish is mutant for p53.
(B–D) ALDHHigh cells with low levels of mitfa:GFP in zebrafish melanoma (red circle). DEAB: negative control. (C) FACS of ALDHHigh and ALDHLow zebrafish melanoma cells. (D) RT-qPCR of sox2, sox10, and tfap2b expression in sorted ALDHHigh versus ALDHLow zebrafish melanoma cells (n = 3 bio-replicates each with 3 technical replicates, multiple paired t test corrected with Holm-Sidak’s method).
(E and F) Aldh1a3 in zebrafish model of BRAF inhibitor regression and recurrent disease. (E) BRAFV600Ep53 mutant zebrafish with melanomas were fed with 200 mg/kg/day vemurafenib-containing food pellets leading to melanoma regression, drug resistance. and disease recurrence. (F) Aldh1a3 IHC in DMSO, BRAFi, and/or NAZ treatment-responding disease and in drug-resistant recurrent disease shows Aldh1a3 on-target efficacy of nifuroxazide. One-way ANOVA with Tukey’s test correction for multiple comparisons. Scale bar = 25 μm. ∗p < 0.05; ∗∗∗p < 0.001; ∗∗∗∗p < 0.0001.
(G and H) Zebrafish combination drug trial to target ALDHHigh cells. (G) Long-term drug-pellet treatment design. (H) Kaplan-Meier survival curves of zebrafish melanomas under different drug treatment shown in (G). Log rank tests, p < 0.001.
See also Figure S6.
Further, mirroring the observation in human patients, we administered vemurafenib (BRAF inhibitor) drug pellets to adult zebrafish with melanomas81 and found that clusters of Aldh1a3 cell populations increased in drug-resistant and progressing disease upon immunohistochemistry (IHC) assessment through disease stages (melanoma responding, stable, and progressive disease) (Figures 7E and 7F). Finally, we designed a zebrafish drug trial to test whether killing the Aldh1a3High cells that emerge during BRAF inhibitor (BRAFi) drug resistance would affect disease outcome (Figures 7F and 7G). We administered nifuroxazide (NAZ), a 5-nitrofuran pro-drug that specifically kills ALDH1High cells in human cell lines and mouse xenograft melanoma models.42 As expected, zebrafish melanoma responded rapidly to BRAFi treatment but then grew back quickly despite ongoing treatment (Figure S6B). When we administered NAZ treatment alone, we observed a period of stable disease followed by progressive melanoma growth (Figure S6B).
We then tested combinational drug treatment, using the BRAF inhibitors to target the bulk of the tumor and NAZ to target ALDH1High cells: (1) BRAFi followed by NAZ (BRAFi_NAZ) at day 21, and (2) BRAFi treatment alone until day 21, followed by both BRAFi + NAZ (Figure 7G). Our data demonstrate that both combinations of BRAFi plus NAZ significantly improved disease outcomes and probability of survival (Figures 7H and S6B). To investigate whether the improved outcomes are achieved via on-target effect of NAZ, we examined Aldh1a3 levels in NAZ-treated zebrafish melanomas in progressive, drug-resistant disease and found that Aldh1a3 clusters were absent (Figure 7F). Together, these results support a combination therapeutic strategy using BRAF inhibitors to target the tumor bulk and NAZ to eradicate the ALDH1A3-melanoma stem cell pool in the residual disease.
Discussion
Cell state heterogeneity and plasticity endow genetically identical cancer cells to respond differently to treatment. As a result, diverse resistant cell states emerge in patients, challenging clinical strategies that target limited static states.82 Here, we uncover that nuclear ALDH1A3, functioning as a master coordinator of metabolic and transcriptional cell states, fosters stem-like gene expression programs in melanoma by using pyruvate-derived acetaldehyde as an acetyl donor for histones.
We identified a nuclear ALDH1A3-ACSS2 mechanism that controls both a glycolytic gene expression program and a developmental NCSC program mediated by TFAP2B. Mechanistically, nuclear ALDH1A3-ACSS2 directs a glucose-derived pyruvate-acetaldehyde-acetate-acetyl-CoA flux and selectively deposits histone H3 acetylation, including H3K23ac, at genomic loci encoding for glycolysis and TFAP2B-NCSC genes. Cells with low ALDH1A3 preferentially take up acetate to generate a nuclear acetyl-CoA flux, which activates MITF and IRF1 gene programs but is otherwise broadly deposited on the chromatin as an acetate reservoir (Figure S7A).
Critically, we demonstrate that endogenous acetaldehyde is a metabolite utilized by ALDH1A3 to modify chromatin. This functional relationship expands the scope of acetaldehyde metabolism from solely protecting cells from aldehyde macromolecule adducts.83,84 Endogenous and alcohol-derived acetaldehydes, as well as other aldehydes, including formaldehyde, are highly reactive toward DNA, and cells employ a robust two-tier protection mechanism to protect against aldehyde-induced DNA damage.83,85,86,87,88 Tier 1 involves aldehyde detoxification enzymes (ALDH2 and ADH5) followed by tier 2 Fanconi anemia DNA damage repair pathways to repair aldehyde-induced DNA damage.84 Gene variants in these pathways in people lead to a loss of protection and directly contribute to increased cancer risks, bone marrow failure, and risks associated with the alcohol-exposed developing fetus.89,90,91,92,93,94 However, recent evidence also shows exogenous alcohol can serve as an acetyl source for histones in the brain via ACSS2, near genes involved in learning and memory, and in the liver.95,96 Together with our findings presented here, this points to a possible broader role for acetaldehyde as a metabolite source for chromatin regulatory marks. Supporting this intimate relationship between aldehydes and chromatin modification, recent evidence shows that nucleosome demethylation releases formaldehyde97 and that histone deacetylase three suppresses endogenous formaldehyde production, the reaction products of which are used in one-carbon (formate) metabolism.98,99 Thus, chromatin may be both modified by aldehydes to shape the regulatory landscape as well as serving as a source of metabolites when required, including acetyl-CoA and formate.
Our data here, along with recent discoveries that formaldehyde metabolism promotes differentiation of primed melanocyte stem cells,100 highlights an emerging physiological role for aldehydes as essential metabolites governing stem cell function. Pioneering studies of nuclear condensates show that the spatial clustering of active gene transcription is intimately linked with nuclear protein-metabolite condensate distribution,101 providing a possibility that subnuclear ALDH-aldehyde metabolism may exert local control of gene expression or acetate reservoirs. It will be important for future studies to identify the external signals that promote the ALDH1A3High state following drug treatment and address whether these contribute to the cross-resistance mechanisms triggered by targeted therapies and ICB. Transcriptionally, analysis of two independent hemagglutinin (HA)-tagged MITF ChIP sequencing (ChIP-seq) experiments show HA-MITF binds the ALDH1A3 promoter region,102,103 and, given that we find MITF activity is low in ALDH1A3High cells, this suggests that MITF may be a repressor of ALDH1A3 transcription (Figure S7B). Further, it will be important to identify whether aldehydes available from the microenvironment (possibly even through diet or the microbiome) can affect the metabolism-NCSC state axis in melanoma.
In conclusion, we present evidence that ALDH1A3 is a master regulator of a metabolism-NCSC state axis that partners with ACSS2 to modify histone acetylation by locally depositing acetaldehyde-derived acetyl groups. The conceptual framework we present here for melanoma may be broadly applicable to ALDHHigh cancer stem cell subpopulations in other cancer types, as ALDH isoforms potentially cooperate with lineage-specific master transcription factors (often from developmental lineages) that are co-opted to regulate tumor cell states.104
Limitations of this study
Additional CUT&TAG or ChIP-seq experiments using independent antibodies for each of the H3K-ac marks would clarify how acetaldehyde-selective histone H3 acetylation relates to the chromatin landscape beyond H3K23 and H3K27. Testing for ACSS2 interactions with other ALDH family members would provide more insight into the specificity and wider applicability of ACSS2-ALDH interactions in other biological contexts. Drugs often have more than a single target in vivo, and we are not able to determine the contribution of these potential other targets to the melanoma response to NAZ in our experimental model.
STAR★Methods
Key resources table
| REAGENT or RESOURCE | SOURCE | IDENTIFIER |
|---|---|---|
| Antibodies | ||
| Rabbit polyclonal anti-ALDH1A3 | Abcam | Cat # ab129815; RRID: AB_2937054 |
| Rabbit polyclonal anti-ALDH1A3 | Thermo Fisher Scientific | Cat# PA5-29188; RRID: AB_2546664 |
| Mouse polyclonal anti-TFAP2B | Santa Cruz | Cat # SC-390119x; RRID: AB_2828008 |
| Mouse monoclonal anti-beta Actin | Abcam | Cat # ab8226; RRID: AB_306371 |
| Rabbit polyclonal anti-acetyl-Histone H3 | Millipore | Cat# 06–599; RRID: AB_2115283 |
| Mouse monoclonal anti-Histone H3 | Abcam | Cat# ab10799; RRID: AB_470239 |
| Rabbit recombinant monoclonal anti-ACSS2 | Abcam | Cat # ab133664; RRID: AB_2943489 |
| Rabbit monoclonal anti-ACSS2 (AceCS1) | Cell Signaling Technology | Cat# 3658; RRID: AB_2222710 |
| Rabbit monoclonal anti-ACSS2 | Invitrogen | Cat # PA5-26612; RRID: AB_2544112 |
| Acetyl-Histone H3K23Ac antibody Rabbit mAb | Invitrogen | Cat # PA5109818; RRID:AB_2855229 |
| Acetyl-Histone H3 (Lys27) (D5E4) XP® Rabbit mAb | Cell Signaling Technology | Cat # 8173; RRID: AB_2798743 |
| Goat anti Rabbit secondary antibody unconjugated | Abcam | Cat # ab7085; RRID:AB_955982 |
| Rabbit (DA1E) mAb IgG XP® Isotype Control (CUT&RUN) | Cell Signaling Technology | Cat # 66362; RRID:AB_2924329 |
| IRDye 680RD Goat polyclonal anti-Mouse IgG | LI-COR Biosciences | Cat# 925–68070; RRID: AB_2651128 |
| IRDye 800CW Goat polyclonal anti-Rabbit IgG | LI-COR Biosciences | Cat# 925–32211; RRID: AB_2651127 |
| Donkey anti-rabbit conjugated Alexa Fluor 488 | Invitrogen | Cat# A-21206; RRID: AB_2535792 |
| Donkey anti-mouse conjugated Alexa Fluor 568 | Invitrogen | Cat# A-10037; RRID: AB_2534013 |
| Donkey anti-rabbit conjugated Alexa Fluor 647 | Invitrogen | Cat# A-31573; RRID: AB_2536183 |
| Bacterial and virus strains | ||
| One Shot™ Stbl3™ Chemically Competent E. coli | Invitrogen | Cat# C737303 |
| Biological samples | ||
| Human patient melanoma samples | Manchester Cancer Research Center (MCRC) | Patient samples were collected with MCRC Biobank ethics application #07/H1003/161 + 5 and with approval for the work under MCRC Biobank Access Committee application 13_RIMA_01 |
| Chemicals, peptides, and recombinant proteins | ||
| DAPI (for nucleic acid staining) | Sigma-Aldrich | Cat# D9542 |
| 7-AAD (7-Aminoactinomycin D) | Eurogentec | Cat# AS-83201 |
| TRIzol™ Reagent | Invitrogen | Cat# 15596026 |
| RIPA Lysis buffer (10x) | Merck Millipore | Cat # 20-188 |
| PhosSTOP™ phosphatase inhibitor | Merck Roche | Cat # 4906837001 |
| EASYpack™ Protease Inhibitor Cocktail | Merck Roche | Cat # 5892970001 |
| Phenylmethylsulphonyl Fluoride (PMSF) | Life Technologies | Cat # 36978 |
| Laemmli (SDS-Sample) Buffer (Reducing, 6X) | Enzo Life Sciences | Cat # NOV-NBP- 111R |
| Sodium dodecyl sulfate (SDS) | Sigma-Aldrich | Cat #L3771 |
| Sodium Butyrate | Abcam | Cat # ab120948 |
| DNase/RNase-Free Distilled Water | Life Technologies | Cat # 10977035 |
| LightCycler 480 SYBR Green I Master Mix | Roche | Cat # 04707516001 |
| EGF (Epidermal Growth Factor) | Thermo Fisher Scientific | Cat # PHG0313 |
| FGF (Fibroblast Growth Factor ) | Bio-Techne R&D | Cat # 233-FB- 025/CF |
| B27 Supplement | Thermo Fisher Scientific | Cat # 17504044 |
| Low Melting Temperature Agarose | Sigma-Aldrich | Cat # A4018 |
| UltraPure™ Agarose | Invitrogen | Cat # 16500500 |
| Restriction digestion Enzyme BbsI-HF | NEB | Cat #R3539 |
| Restriction digestion Enzyme KpnI-HF | NEB | Cat #R3142 |
| Restriction digestion Enzyme BsiWI-HF | NEB | Cat #R3553 |
| CutSmart™ Buffer | NEB | Cat #M0202M |
| T4 DNA ligase | NEB | Cat #M0202M |
| T4 DNA Ligase Reaction Buffer | NEB | Cat #B0202 |
| Monarch RNase A (20 mg/mL) | NEB | Cat #T3018 |
| Opti-MEM™ Reduced Serum Medium | Gibco | Cat # 31985062 |
| DMEM High Glucose | Gibco | Cat # 11965092 |
| RPMI 1640 Medium | Gibco | Cat # 61870036 |
| RPMI 1640 with HEPES | Gibco | Cat # 22400089 |
| DMEM, no glucose, no glutamine, no phenol red | Gibco | Cat # A1443001 |
| Tumor Dissociation Kit, human | Miltenyi Biotec | Cat # 130-095-929 |
| Red blood cell lysis buffer | BioLegend | Cat # 420301 |
| Trypsin-EDTA (10x) | Gibco | Cat # 15400054 |
| L-Glutamine (100x) | Gibco | Cat # 25030081 |
| Fetal Bovine Serum | Gibco | Cat # 26140079 |
| Penicillin/Streptomycin | Gibco | Cat # 10378016 |
| Lipofectamine 2000 Transfection Reagent | Life Technologies | Cat # 11668019 |
| Lipofectamine™ RNAiMAX Transfection Reagent | Invitrogen | Cat # 13778075 |
| Polybrene Infection/Transfection Reagent | Merck Millipore | Cat # TR-1003-G |
| Puromycin | Life Technologies | Cat # A1113803 |
| Bovine Serum Albumin | Merck Life Sciences | Cat # A9647 |
| 16% Pierce™ Methanol-free Formaldehyde | Thermo Fisher Scientific | Cat # 11586711 |
| Tris Base | Merck Millipore | Cat # 648310-M |
| Dithiothreitol (DTT), reducing reagent | Abcam | Cat # ab141390 |
| Sucrose | Merck Millipore | Cat #S0389 |
| NP-40 | Sigma-Aldrich | Cat #I8896 |
| Trichloroacetic acid (TCA) | VWR | Cat # 89500-550 |
| Trifluoracetic acid (TFA) | VWR | Cat # 153112E |
| Acetonitrile (ACN) | VWR | Cat # 83640.320 |
| LC-MS Grade Water | Supelco | Cat # 115333.2500 |
| Monarch® RNase A | NEB | Cat #T3018L |
| Proteinase K (20 mg/mL) | Thermo Fisher Scientific | Cat # EO0491 |
| Vectashield™ Vibrance Antifade Mounting Medium | 2BScientific | Cat # H-1700-10 |
| D-Glucose (13C-6) | Merck Life Sciences | Cat # 389374 |
| Sodium Acetate (13C-2) | CK Isotopes | Cat # CLM-381-1 |
| Sodium Pyruvate (13C-3) | CK Isotopes | Cat # CLM-2440 |
| FACSmax™Cell Dissociation Solution | AMS Biotechnology | Cat #T200100 |
| Liberase TM Research Grade | Merck Roche | Cat # 5401119001 |
| CPI-613 (Devimistat) | Axon Medchem | Cas # 95809-78-2 |
| AC-148 | Chan et al.77 | N/A |
| vemurafenib (PLX4032) | SelleckChem | Cat #S1267 |
| Nifuroxazide (NAZ) | Merck Millipore | Cat # 481984 |
| Dimethyl sulfoxide (DMSO) | Sigma Aldrich | Cat # 67-68-5 |
| Critical commercial assays | ||
| Aldefluor Assay (with DEAB and 2N HCl included) | STEMCELL technology | Cat# 01705 |
| AldeRed ALDH Detection Assay | Millipore Europe | Cat # SCR150 |
| SureBeads™ Starter Kit Protein A and G | Bio-Rad | Cat #1614833 |
| Direct-zol RNA Miniprep Kits | ZYMO Research | Cat# 2052 |
| SuperScript III Reverse Transcriptase | Life Technologies | Cat # 18080044 |
| Illumina TruSeq Stranded mRNA Sample Prep Kit | Illumina | Cat # RS-122-2001 |
| NEBNext Ultra Directional RNA library Prep Kit | NEB | Cat #E7420S |
| NEBNext Ultra II DNA Library Prep Kit for Illumina | NEB | Cat #E7645S |
| NEBNext Multiplex Oligos for Illumina® (Index Primers Set 1) | NEB | Cat #E7335S |
| NEBNext High-Fidelity 2X PCR Master Mix | NEB | Cat #M0541S |
| AMPure XP beads | Beckman Coulter | Cat # A63882 |
| QIAquick PCR Purification Kit | Qiagen | Cat # 28104 |
| Pierce™ BCA Protein Assay Kit | Thermo Fisher | Cat # 23225 |
| 4–15% Mini-PROTEANTM TGX Precast Protein Gels |
Bio-rad | Cat # 4561085DC |
| Trans-Blot™ Turbo Mini 0.2 μm Nitrocellulose Transfer Packs | Bio-rad | Cat # 1704158 |
| Collagen I, Coverslip Glass 22mm Round | VWR | Cat # 734-1009 |
| L-Lactate Assay Kit (Colorimetric/Fluorometric) | Abcam | Cat # ab65330 |
| Zenon™ Rabbit IgG labelling kits Alexa Fluor 488 | Thermo Fisher | Cat #Z25302 |
| Zenon™ Rabbit IgG labelling kits Alexa Fluor 647 | Thermo Fisher | Cat #Z25308 |
| CUTANA™ pAG-Tn5 for CUT&Tag | EpiCypher | Cat # SKU: 15-1017 |
| Magnetic Concanavalin A Beads | Bangs Laboratories | Cat # BP531 |
| Spermidine 0.1 M solution | Sigma Aldrich | Cat # 05292-1ML-F |
| SureBeads™ magnetic protein A beads for co-immunoprecipitation | BioRad | Cat # 1614013 |
| Deposited data | ||
| Raw and analyzed A375 ALDHHigh and ALDHLow RNA-seq data | This paper | GEO: GSE243840 |
| Raw and analyzed A375 Cas9 ALDH1A3 WT and ALDH1A3 KO ChIP-Histone acetyl-H3-seq data; CUT&TAG H3K23ac and H3K27ac data | This paper | GEO: GSE243834 |
| AlphaFold multimer modeling result of ALDH1A3-ACSS2 interaction | This paper | ModelArchive: ma-i8503 |
| AlphaFold multimer modeling result of Ald6-Acs2 interaction | This paper | Model Archive: ma-n4imc |
| Mouse melanoma single-cell RNAseq | Karras et al.46 | GEO: GSE207592 |
| Human patient melanoma single-cell RNAseq before immune checkpoint blockade therapy | Pozniak et al.48 | EGA: EGAD00001009291 |
| Patient melanoma single-cell RNAseq | Tirosh et al.47 | GEO: GSE72056 |
| Human cutaneous melanoma TCGA dataset | TCGA cBioPortal; https://www.cbioportal.org/ |
RRID: SCR_003193 |
| Human cutaneous melanoma Lund dataset | Cirenajwis et al.53 | GEO: GSE65904 |
| Human cutaneous melanoma Bergen dataset | Jonsson et al.54 | GEO: GSE22155 |
| Tfap2b (biotin) ChIP-seq | Ling and Sauka-Spengler105 | GEO: GSE125711 |
| HA-MITF ChIP-seq | Louphrasitthiphol et al.102 Louphrasitthiphol et al.103 |
GEO: GSE137522; GSE137776 |
| Experimental models: Cell lines | ||
| Human: A375 melanoma cell line | ATCC | RRID: CVCL_6233 |
| Human: Cas9 A375 melanoma cell line | David Adams, Sanger Institute, UK | N/A |
| Human: Cas9 C089 melanoma cell line | David Adams, Sanger Institute, UK | N/A |
| HEK293T | ATCC | Cat# CRL-3216; RRID: CVCL_0063 |
| MPD001 | This paper | N/A |
| MPD002 | This paper | N/A |
| Experimental models: Organisms/strains | ||
| Zebrafish: Tg(mitfa:GFP, mitfa:BRAFV600E), p53M214K | Patton et al.79 | ZFIN Cat #: ZDB-TGCONSTRCT-070117-106, ZDB-ALT-050428-2 |
| Oligonucleotides (See also Table S6) | ||
| gALDH1A3: CGTCCCGGAGCAATCTGAAG | Sanjana et al.106 | https://www.genscript.com/tools/gRNA-library-design |
| gTFAP2B: GGACCGAGTGGTAGTCCCTC | Sanjana et al.106 | https://www.genscript.com/tools/gRNA-library-design |
| siALDH1A3: GUAUCGAAGAAGUGAUAAA | Life technology: Silencer® Select | Cat # 4390824 |
| Recombinant DNA | ||
| pKLV2-U6gRNA5(BbsI)-PGKpuro2A-BFP | Addgene | Cat # 67991 |
| pKLV2-U6gRNA5(BbsI)-PGKpuro2A-mCherry | This paper | N/A |
| pKLV2-U6gALDH1A3-PGKpuro2A-BFP | This paper | N/A |
| pKLV2-U6gTFAP2B-PGKpuro2A-BFP | This paper | N/A |
| pKLV2-U6gRNA5(BbsI)-PGKpuro2A-ALDH1A3 | This paper | N/A |
| pKLV2-U6gRNA5(BbsI)-PGKpuro2A-TFAP2B | This paper | N/A |
| psPAX2 | Addgene | Cat # 12260 |
| pMD2.G | Addgene | Cat # 12259 |
| Software and algorithms | ||
| R (v. 4.0.4) | R core team (2020): (https://www.R-project.org/.) | RRID:SCR_001905 |
| R Studio (v. 1.4.1106) | RStudio Team (2020): (http://www.rstudio.com/.) | RRID:SCR_000432 |
| ggPlot2 (v.3.4.2) | (Wickham, 2016) https://cran.r-project.org/web/packages/ggplot2/index.html |
RRID:SCR_014601 |
| MATLAB | The Math Works (2020): (http://www.mathworks.com/products/matlab/) |
RRID:SCR_001622 |
| FastQC (v.0.11.3) | Babraham Institute; (https://www.bioinformatics.babraham.ac.uk/projects/fastqc/) | RRID: SCR_014583 |
| STAR (v. STAR_2.5.1b) | Dobin et al.107 | RRID: SCR_015899 |
| RNASeqQC (v.1.1.8.1) | DeLuca et al.108 | RRID: SCR_005120 |
| htseq-count (0.6.1) | Simon et al.70 | RRID:SCR_011867 |
| DESeq2 R package (v. 1.30.1) | Love et al.70 | RRID: SCR_015687 |
| GSEA software (v. 4.0.3) | Subramanian et al.109 (http://www.broad.mit.edu/gsea/index.html) | RRID: SCR_016884 |
| g:Profiler | Raudvere et al.64 | RRID:SCR_006809 |
| Seurat (v. 4.0.0) | Hao et al.110 | RRID:SCR_016341 |
| EpiProfile2.1_1Basic | Yuan et al.111 | N/A |
| Bowtie2 (bwa-0.7.9) | Langmead and Salzberg70 | RRID:SCR_016368 |
| HOMER (version 4.11) | Heinz et al.112 | RRID:SCR_010881 |
| ChIPseeker R package (v. 1.26.2) | Wang et al.113 | RRID:SCR_021322 |
| SAMtools (v. 1.9) | Li et al.114 | RRID:SCR_002105 |
| MACS2 (v. 2.1.1.20160309) | Feng et al.115 | N/A |
| deeptools (v. 3.5.1) | Ramírez et al.116 | RRID:SCR_016366 |
| DiffBind (v. 2.10.0) | Ross-Innes et al.117 | RRID:SCR_012918 |
| edgeR (v3.32.1) | McCarthy et al.118 | RRID:SCR_012802 |
| GSVA (v1.38.2) | Hänzelmann et al.119 | RRID:SCR_021058 |
| Galaxy (usegalaxy.org) | The Galaxy Community120 | RRID:SCR_006281 |
| The UniProt Consortium | The UniProt Consortium121 | RRID:SCR_002380 |
| AlphaFold-Multimer | Evans et al.76 | N/A |
| ColabFold version 1.5.2 | Mirdita et al.122 | N/A |
| GalaxyRefineComplex | Heo et al.123 | N/A |
| FreeSASA 2.0.3 | Mitternacht124 | N/A |
| AlphaFill | Hekkelman et al.125 | N/A |
| UCSF ChimeraX version 1.6 | Pettersen et al.126 | RRID:SCR_015872 |
| ImageJ Fiji software (v. 1.53c) | National Institutes of Health, USA | RRID: SCR_003070 |
| Prism 9 (v. 9.3.1) for macOS | GraphPad Software, San Diego, USA | RRID: SCR_002798 |
| eulerr R (v. 6.1.1) | https://CRAN.R-project.org/package=eulerr | RRID:SCR_022753 |
| Cytoscape (v.3.8.0) | Otasek et al.127 | RRID:SCR_003032 |
| SCENIC | Aibar et al.70 | RRID:SCR_017247 |
| AUCell | Aibar et al.70 | RRID:SCR_021327 |
| CytoTRACE | Gulati et al.45 | RRID:SCR_022828 |
| pheatmap | https://CRAN.R-project.org/package=pheatmap | RRID:SCR_016418 |
| NDP.view 2 (v. 2.9.29) | Hamamatsu.com: NDP.view2 U12388-01 (http://www.hamamatsu.com/jp/en/U12388 −01.html) | N/A |
| FlowJo (v. 10.8.1) for macOS | Becton, Dickinson and Company (https://www.flowjo.com/) | RRID:SCR_008520 |
Resource availability
Lead contact
Further information and requests for resources and reagents should be directed to and will be fulfilled by the lead contact, E. Elizabeth Patton (e.patton@ed.ac.uk).
Materials availability
Plasmids generated in this study will be made available upon request made to the lead contact.
Patient derived low passage melanoma cells are available, upon MTA approval, upon request to v.pavet@beatson.gla.ac.uk and o.sansom@beatson.gla.ac.uk.
Data and code availability
The RNA-seq, ChIP-seq, and CUTandTAG data generated in this study have been deposited at GEO and are publicly available as of the date of publication. Accession numbers are listed in the key resources table. The PDB files of ACSS2-ALDH1A3 and Acs2-Ald6 from AlphaFold-Multimer modeling are released on ModelArchive and are publicly available as of the date of publication with the DOI listed in the key resources table. No original code had been generated for this paper. Any additional information required to reanalyse the data reported in this paper is available from the lead contact upon request.
Experimental models and study participant details
Zebrafish maintenance and husbandry
Zebrafish were maintained in accordance with UK Home Office regulations, UK Animals (Scientific Procedures) Act 1986, under project license P8F7F7E52. All experiments were approved by the Home Office and AWERB (University of Edinburgh Ethics Committee).
Zebrafish melanoma models
Zebrafish were genotyped using DNA extracted from tail fin clipped tissue by PCR to confirm the mutant allele status of tp53M214K (referred to as p53−/− or p53 mutant) and mitfa:BRAFV600E as described in our previous publications.79 The emergence of melanoma is usually observed in individuals aged 3- to 6-month-old. Individuals used in this study for DMSO control versus vemurafenib or Nifuroxazide drug pellets treatment were aged 5- to 6-month-old when entering the treatment scheme. Both female and male individuals were admitted into the treatment course regardless of the sex.
Human melanoma cell line culture
A375 cells were cultured in DMEM high glucose media, C089 cells were cultured in RPMI 1640 media, and patient sample derived cell line MPD001 were cultured in RPMI 1640 with 25 mM HEPES. All media were supplemented with 2 mM L-glutamine and 10% fetal calf serum, and all cells grown at 37°C in a 5% CO2 humidified incubator. All cells have been routinely tested for mycoplasma, with the most recent test performed on June 21, 2023.
Method details
Establishment and amplification of patient derived melanoma cell lines
Patients with melanoma were managed in accordance with the ethical principles of Declaration of Helsinki and in accordance with Good Clinical Practice as defined by the International Conference on Harmonisation. All patients gave informed written consent to participate in clinical trials or EAP or EAMS. Patient samples were collected with written full-informed consent under Manchester Cancer Research Center (MCRC) Biobank ethics application #07/H1003/161 + 5 and approval for the work under MCRC Biobank Access Committee application 13_RIMA_01. Tissue samples were collected from patients with cutaneous melanoma at The Christie NHS Foundation Trust. For cell line MPD001 and MPD002, tumor fragments from the lymphatic melanoma and skin lesion to chest wall metastases were obtained respectively during the surgical procedure and dissociation was performed on the same day utilising the human tumor dissociation kit (Miltenyi Biotec) following manufacturer’s instructions. Briefly, after mechanical dissociation with a scalpel, tissue was resuspended in RPMI media with a mixture of Kit Enzymes (H, R and A) and placed on the gentleMACS Dissociator, program 37°C _h_TDK_1 for 30 min. Next, cells were transferred to a 50 mL falcon tube and centrifuged at 300xg for 7 min, then resuspended and passed through a 70 μm cell strainer. This was centrifuged again (300xg for 7 min) and resuspended in 1X red blood cell lysis buffer (BioLegend) in deionized water, then incubated at room temperature, protected from light, for 15 min. After this step, the sample was centrifuged and finally resuspended and plated in a 10 cm cell culture Petri dish in RMPI medium supplemented with FBS (Gibco) (10%) and Penicillin/Streptomycin (Gibco) (1%). Cells were cultured in an incubator at 37°C with 5% CO2. Cell lines were frozen and stored after a 2-week amplification period, freezing performed using FBS with DMSO (10%). Cryotubes were placed in an isopropanol freezing container (Nalgene Cat. C1562-1EA) at −80°C for 24h for gentle freezing and transferred to liquid nitrogen tanks for long term storage.
Generation of human melanoma mutant cell lines
Human melanoma cell lines A375 and C089 engineered with stable expression of Streptococcus pyogenes Cas9 were gifted to us and used to build ALDH1A3 mutant cells.42 Briefly, for ALDH1A3 knockout, the vehicle plasmid expressing gRNA (pKLV2-U6gRNA5(BbsI)-PGKpuro2ABFP, Addgene: 67991) was engineered by Golden Gate cloning using restriction enzyme BbsI-HF (NEB) to express gRNA targeting ALDH1A3 (CGTCCCGGAGCAATCTGAAG). Lentiviral particles were produced by co-transforming the HEK293T (ATCC) cells with target plasmid, the packaging plasmid psPAX2 (Addgene: 12260), and pMD2.G (Addgene: 12259), facilitated with Lipofectamine 2000 (Invitrogen) following the manufacturer’s instructions. 48 h post transfection, the 293T cell culture supernatant was collected and filtered (0.45 μm) to transfect the targeted recipient cell lines, supplemented with 10 μg/mL polybrene (Merck Millipore). 48–72 h post transfection, the cells were split and seeded with the complete growth media containing 1 μg/mL puromycin (Life Technologies) to obtain clones with stable expression of the gRNA. Suitable single clones were validated by western blot to confirm full-length ALDH1A3 knockout and Aldefluor assay to confirm the loss of ALDH activity before expanded for biological experiments. For TFAP2B knockout cells, the gRNA sequence was engineered similarly (GGACCGAGTGGTAGTCCCTC) using Golden Gate cloning. For vehicle control samples, the vehicle plasmid expressing empty gRNA were engineered to express mCherry instead of BFP sequence; for ALDH1A3 and TFAP2B over-expression cells, the vehicle plasmid expressing empty gRNA were engineered to express ALDH1A3 CDS instead of BFP. Briefly, restriction digestion enzyme KpnI-HF (NEB) and BsiWI-HF (NEB) were used to remove BFP sequence and create sticky ends matching the mCherry, ALDH1A3 or TFAP2B CDS flanking sequence. The digested fragment of plasmid backbone and the target sequence were then ligated using T4 DNA ligase (NEB), following which a similar transfection and selection procedures were performed to acquire stable mutant lines.
Human melanoma cell ALDH activity measurement
The ALDH enzyme activity in human melanoma cells was measured using the Aldefluor assay kit (StemCell Technologies) following the manufacturer’s instructions. In brief, melanoma cells dissociated with trypsin (Gibco) were resuspended in the Aldefluor buffer with the fluorescent bodipy-aminoacetaldehyde (BAAA) reagent included in the kits. For each experiment, a negative control vial was set up using a small aliquot out of the sample vial (100 μL out of 1 mL), supplemented with (5 μL) pan-ALDH inhibitor DEAB (diemethylaminobenzaldehyde) immediately after the resuspension. After incubation of 30 min at 37°C, the Aldefluor activity was measured using flow cytometry (Fortessa, BD Biosciences). For cell sorting to establish the ALDHHigh and ALDHLow cells, the stained cells were sorted by FACS Aria II (BD Biosciences) and the population with the highest and lowest 5% ALDH activity (ALDHHigh and ALDHLow) were collected. All flow cytometry data were analyzed using the software FlowJo. Dead cells were excluded using 7-Aminoactinomycin D (7-AAD, Eurogentec), or 4,6-Diamidine-2-phenylindole dihydrochloride (DAPI, Sigma-Aldrich).
RNA extraction and RT-qPCR
Quantitative reverse transcription PCR (RT-qPCR) assays were performed by standard protocol suitable for LightCycler 480 Instrument (Roche). In brief, total RNA was extracted and purified from live cells using TRIzol (Invitrogen) and Direct-Zol RNA Miniprep Kits (ZYMO Research). After quality check and measurement by NanoDrop (ThermoFisher), 1 μg RNA for each sample was reverse transcribed using Superscript III reverse transcriptase (Life Tchnologies). Quantitative PCR were carried out by setting up reactions using the reverse transcribed cDNA template, primers (see also Table S6, related to STAR Oligonucleotides) and LightCycler 480 SYBR Green I Master reagent, run by the program of Standard Roche Template (System II). Reads of gene ACTB (Beta Actin) were used as the internal control to calculate the relative expression values.
RNA-seq pipeline
Libraries were prepared from 500 ng of each total-RNA sample using the TruSeq Stranded mRNA Library Kit (Illumina) according to the provided protocol and purified using AMPure XP beads (Beckman Coulter). Sequencing was performed using the NextSeq 500/550 High-Output v2 (150 cycle) Kit (# FC-404-2002) on the NextSeq 550 platform (Illumina Inc, #SY-415-1002). Libraries were combined in an equimolar pool based on the library quantification results and run across a single High-Output Flow Cell. Raw FASTQ sequence reads were quality checked using FastQC (v. 0.11.3) and aligned to the human genome (GrCh38) assembly using STAR (v. STAR_2.5.1b) software with default parameters. The quality of the resulting alignment to the transcriptome (Ensembl annotation version GRCh38.91) was checked using RNASeqQC (v. 1.1.8.1). Raw counts of reads covering the transcriptome (Ensembl annotation version GRCh38.91) were obtained using htseq-count (0.6.1) with the “-s reverse” option. Differential expression was analyzed using the DESeq2 R package (v. 1.20.0).
Pathway enrichment analysis
Gene set functional enrichment analysis (GSEA) identified enriched pathways at FDR <0.05 (weighted Kolmogorov-Smirnov test) using GSEA software (Subramanian et al., 2005). The gene expression matrix of sorted ALDHHigh versus ALDHLow cells or selected patient melanoma ALDH1A3High versus ALDH1A3Low samples were used to compare against literature-based datasets (Tables S1 and S2) using gene set permutation settings. For gene over-representation analysis across literature curated signature terms, genes with differential acetyl-Histone H3 in WT compared to ALDH1A3 knockout were selected based on FDR <0.05 (in total 1599, see also Table S4) as input to the g:Profiler website.64 The gene terms with FDR <0.05 (hypergeometric test, BH adjusted) were considered significantly over-represented, with the term size cut-off set to 1000 (token: gp__33Kp_FaEr_Mcs). For gene over-representation analysis across the REACTOME database,128 genes with acetyl-histone H3 peaks differentially enriched in WT or ALDH1A3 knockout (see also Table S4) were separately tested and terms of FDR <0.05 (hypergeometric test, BH adjusted) were considered significantly over-represented.
Gene set expression correlation analysis
To assess the expression corelation between ALDH1A3 and NCSC gene signature, gene set variation analysis (GSVA)118 was used to calculate the relative expression score for the gene set containing only ALDH1A3 or the related signature gene lists. Spearman correlation analysis was then performed to evaluate the statistical correlation across all samples. Positive correlation was determined as Spearman co-efficient R > 0.3 with exact critical probability p-value <0.05.
Human metastatic melanoma single cell data mining
Human metastatic melanoma single-cell RNA-seq expression matrix was accessed via supplementary data of Tirosh et al., 2016.47 Cells classified as malignant tumor cells were extracted for UMAP clustering via Seurat (v.4.0.0), with ALDH1A3 and TFAP2B visualised, clustering resolutions equals 0.5. For immune immune checkpoint blockade therapy naive samples, single-cell RNA-seq expression matrix of human melanoma was accessed via the published study of Pozniak et al., 202448 as deposited on European Genome-phenome Archive (EGA): EGAD00001009291, with the original patient tumor progression tracked and recorded for their anti-PD-1 and/or anti-CTLA-4 treatment outcomes. Cells classified as malignant tumor cells were extracted for violin plot analysis via Seurat (v.4.0.0), with ALDH1A3 visualised and compared between the responder and non-responder groups based on the matched patient clinical records.
NRASQ61K/°; Ink4a−/− murine melanoma data mining
Single-cell RNA expression data of malignant melanoma cells, originating from 5 primary murine melanoma lesions,46 were interrogated for Aldh1a3, ALDHhigh_enriched_signature and Tfap2b_regulon expression activities, measured by AUCell.70 A Tfap2b regulon is inferred by using the pySCENIC pipeline on a mouse melanoma single-cell RNA-seq data46 with the genes extracted and visualized using Cytoscape (v.3.8.0).129 To map potential differentiation trajectories onto the single-cell UMAP space, we calculated for each melanoma cell its corresponding CytoTRACE score,45 which is a measure of gene expression diversity and a surrogate for developmental potential (0<CytoTRACE score<1). CytoTRACE scores close to 1 are indicative of a less differentiated and close to 0 of a differentiated state. Besides the single cells, every gene was scored and correlated to either contribute to a dedifferentiated or differentiated state and ranked accordingly.
Western blot
Cells were detached by Trypsin (Gibco) and lysed on ice for 30 min at a cell density of 107 cells per mL of RIPA lysis buffer (Merck Millipore), supplemented with phosphatase and complete protease inhibitors (Merck Roche). Debris of cells were removed by centrifuge (10,000 rpm, 10 min, 4°C). Protein concentrations were determined using the BCA assay (Thermo Fisher) and 10–20 μg protein per lane was electrophoresed on 4–15% precast gradient gels (Bio-Rad). Based on the protein concentration and sample volumes, calculated amount of Laemmli (SDS) buffer (Enzo Life Science) were added and incubated with the samples at 95°C for 5 min before gel loading. After the electrophorese program, gels were transferred onto Turbo transfer membranes (Bio-Rad) using the semi-dry Turbo Transfer system (Bio-Rad). Membranes were then blocked with 5% w/v BSA/TBS for 30 min at room temperature, subsequently probed by primary antibodies with optimised dilution factors overnight at 4°C, incubation of goat anti-mouse IRDye 680- or goat anti-rabbit 800- labelled secondary antibodies (LI-COR Biosciences) and imaged using an Odyssey infrared scanner (LI-COR Biosciences).
To probe the histone proteins using western blot, an acid extraction protocol was carried out instead of RIPA lysing protocol. In brief, the cells were washed with ice-cold PBS and lysed on ice for 10 min at a cell density of 107 cells per mL of Triton Extraction Buffer (TEB: PBS, 0.5% Triton X-100 (v/v), 2 mM phenylmethylsulfonyl fluoride (PMSF, Life Technologies)), supplemented with 5 mM sodium butyrate (Abcam) to retain levels of histone acetylation. The nuclei of cells were centrifuged (650 x g, 10 min, 4°C) and washed in half the volume of TEB and centrifuged again. Pellets were re-suspended using 0.2 N HCl at a density of 4x10⁷ nuclei per mL. The histones were extracted overnight at 4°C and the debris were removed by centrifuge (650 x g, 10 min, 4°C). 5M NaOH were added at 1/20 of the volume of the supernatant to neutralise the samples. The same steps of protein measurement and western blot were followed as described above for probing protein in the total cell lysates.
The primary antibodies used are as following: ALDH1A3 (1:10,000, Rabbit, Invitrogen), TFAP2B (1:1000, Mouse, Santa Cruz), beta-Actin (1:1000, Mouse, Invitrogen), Histone H3 (1:1000, Mouse, Abcam), acetyl-Histone H3 (1:10,000, Rabbit, Millipore).
Co-immunoprecipitation of ACSS2
Co-immunoprecipitation was performed using SureBeads Protein A Magnetic Beads (BioRad) following recommended instructions from the manufacturer. Briefly, to prepare the beads for binding target protein, for each 1 million cells, 5 μL SureBeads were washed in 0.1% TBST for 3 times and then incubated with 1:50 ACSS2 primary antibody (Rabbit, Cell Signaling) or 1:50 IgG control (Cell Signaling Technology) at room temperature for 30 min. Unbound antibodies were removed by another 3 times of washing using 0.1% TBST. To prepare the protein lysates, cells were cultured to 80–90% confluence before dissociated using trypsin/EDTA. Cells were pooled into a master tube before aliquoting 20 million cells per sample for whole cell co-IP or 40 million cells per sample for nuclear department co-IP.
For whole-cell co-IP, aliquoted cells were pelleted by centrifuge at 300 xg, for 3 min and resuspended in 1x RIPA buffer supplemented with Roche protease inhibitor cocktail and lysed on ice for 10 min. The lysates were then centrifuged at 12,000 xg for 10 min before the supernatant were transferred to primary antibody conjugated SureBeads Protein A Magnetic Beads for incubation overnight at 4°C. For nuclear protein co-IP, nuclei isolation were performed by adding 5 mL nuclei isolation buffer (NIB) to the cell pellets (15 mM Tris, 60 mM KCl, 15 mM NaCl, 5 mM MgCl2, 1 mM CaCl2, 250 mM sucrose, pH adjusted to 7.5, supplemented with 1 mM DTT and 0.1% NP-40) with gentle pipetting and incubation on ice for 5 min. Nuclei were spun down by centrifuging at 600 xg for 5 min at 4°C and then proceed to the same RIPA lysing steps as described for the whole cell co-IP assay. For both whole-cell and nuclei co-IP, 10% of lysates were set aside as input before proceeding to adding SureBeads conjugated antibodies.
Following incubation at 4°C overnight, unbound proteins were washed off by rinsing the magnetic beads 3 times using 0.1% TBST. Captured proteins were released by adding 50 μL 1x RIPA buffer and 10 μL 6x Laemmli SDS reducing buffer to the beads slurry and being heated at 95°C for 3 min. Proteins were then probed by standard Western Blot as described above.
Colony formation assay in soft agar
For each sample in a 6-well plate set up, 5000 cells were suspended in serum-free growth media supplemented with 10 ng/mL EGF, 10 ng/mL FGF, B27 supplement (1x, Thermo Fisher Scientific), and 0.3% low melting agarose (Sigma-Aldrich). Cells were then layered over a solid base of 0.5% low melting agarose, cultured for 18 days (A375) or 25 days (C089), optimised by the colony growth speed. Colonies (>10 cells) from 10 separate fields of each sample were then manually counted using the images captured by a Nikon DS-L3 camera system on an Eclipse TS100 microscope (Nikon) with a 4× objective.
Immunocytochemistry with fluorescence labelling and imaging
Cells were cultured on the collagen I coated coverslip glasses (VWR) for ICC assays. Samples were washed twice with PBS and fixed with 4% paraformaldehyde (PFA, Thermo Fisher Scientific) at room temperature for 15 min before permeabilized by PBST (0.1% Triton x-100/PBS) for 10 min. Coverslips were then incubated in 3% BSA/PBST (w/v) for 30 min before probed with primary antibodies at appropriate dilution for 4 h at room temperature or 4°C overnight (ALDH1A3, 1:300, Abcam; TFAP2B, 1:100; ACSS2, 1:100, Abcam). After being washed 3 times in PBST for 5 min each, samples were incubated with fluorochrome-conjugated secondary antibodies (Donkey anti-Rabbit 488, Donkey anti-Mouse 568, and Donkey anti-Rabbit 647, all 1:1000, Invitrogen) for 30 min in the dark. After 3 times of wash in PBST for 5 min each, DAPI (Sigma-Aldrich) was added to the final wash of PBST to stain the nucleus, and the coverslips were mounted with antifade mounting medium (Vectashield, 2BScientific) before fluorescent microscope imaging using multimodal Imaging Platform Dragonfly (Andor technologies, Belfast UK). Images were acquired using a 20X or 40X lens equipped with 405, 488, 561, and 640 nm lasers built on a Nikon Eclipse Ti-E inverted microscope body with Perfect focus system (Nikon Instruments, Japan). Data were collected in Spinning Disk 25 μm pinhole mode on the Zyla 4.2 sCMOS camera using a Bin of 1 and no frame averaging using Andor Fusion acquisition software.
For ICC on flow cytometry sorted ALDHHigh and ALDHLow cells, Aldefluor-sorted cells were resuspended in normal culture media and allow to attach on the collagen I coated coverslip glasses (VWR) in 6-well plates for 4–6 h before fixed to ensure the ALDH activity states.
For interrogating ALDH1A3-TFAP2B-ACSS2 co-localisation, primary antibodies raised in the same species, i.e. anti-ALDH1A3 and anti-ACSS2 Rabbit IgG, were pre-conjugated to different fluorescence dye (Alexa Fluor 488 and Alexa Fluor 647) separately following the manufacturer’s instructions (Zenon Rabbit IgG labelling kits, Thermo Fisher) before incubation with the samples together with Mouse anti-TFAP2B primary antibody for 2 h at room temperature. The cells were then washed three times in PBS and incubated with Donkey-anti-mouse conjugated Alexa Fluor 568 antibodies for 0.5 h at room temperature (Invitrogen). Cells were washed, with nuclei stained with DAPI (Sigma) and mounted in Vectashield mounting media before imaging. Super-resolution images were acquired using instant Structured Illumination Microscopy (SIM)130 with Nikon SoRa system. Imaging was carried out using an SR HP Plan Apo λS 100x 1.35NA Silicone lens (Nikon Instruments). The CMOS cameras used for acquisition were Teledyne Photometrics Prime 95B (Teledyne Photometrics 3440 E.Britannia Drive, Tucson AZ) and 405/488/514/561/640nm laser lines. Z-step size for Z stacks was set to 0.120 μm as required by manufacturers software. Acquisition of images and deconvolution was carried out using the (3D algorithm) Nikon NIS Elements Advanced Research software. Settings for acquisition and reconstruction were identical in all images. Line scanning signal correlation analysis were carried out in Fiji by taking the intensity from each channel across the scanning line as an individual variable and conducting Pearson correlation test.
13C6-glucose tracing via targeted UPLC-MRM/MS
For 13C6-glucose tracing experiment, DMEM with no glucose, no glutamine, no phenol red (Gibco) was purchased and then supplemented with 4.5 g/L 13C6-glucose (Merck Life Sciences), 2 mM L-glutamine, and 10% FCS (referred to from now on as the 13C6-glucose DMEM). To trace 13C6-glucose in A375 ALDHHigh and ALDHLow cells, A375 melanoma cells were cultured in T175 flasks (Corning) until reaching 70% confluence, then incubated in 13C6-glucose DMEM for 12 h before dissociated for Aldefluor staining and live sorted by FACS Aria II (BD Biosciences). Every sample contains ∼0.5 million sorted cells, which was immediately snap frozen in liquid nitrogen upon sorting. To trace 13C6-glucose in A375 Cas9 control and ALDH1A3 knockout cells, cells were seeded in 6-well plates until reaching 50% confluence, then incubated in 13C6-glucose DMEM for 24 h before trypsin dissociation and liquid nitrogen snap frozen. Metabolites extraction, derivation, and targeted UPLC-MRM/MS profiling the central carbon metabolites were performed as described in Han et al., 2013131 by the service at Metabolomics Innovation Center, University of Victoria.
Histone acetylation profiling using bottom-up mass spectrometry
Histone extraction and derivatization workflow was optimised based on Sidoli et al., protocol.132 Briefly, nuclei from live attached melanoma cells were isolated by 5-min incubation on ice with NIB buffer (15 mM Tris, 60 mM KCl, 15 mM NaCl, 5 mM MgCl2, 1 mM CaCl2, 250 mM sucrose, pH adjusted to 7.5, supplemented with 1 mM DTT, 0.5 mM PMSF, 0.05 μM NaF, 0.05 μM NaVO4 and 10 mM sodium butyrate, 0.1% NP-40) followed by scraping. Nuclei were spin down by centrifuging at 1000 rcf for 5 min at 4°C. The nuclei pellets were washed twice by NIB without NP-40. Histone proteins were extracted by adding 0.2 M H2SO4 in a 1:4 ratio of nuclear pellet to H2SO4 and incubated for 4 h at 4°C. Histones were then precipitated by adding 1:3 v/v Trichloroacetic acid (TCA) and incubated overnight at 4°C. For chemical derivatization, precipitated histone proteins were air-dried by vacuum centrifuge and rinsed with ice-cold acetone prior to four rounds of propionylation, with the last two rounds of propionylation carried out on histone peptides post trypsin digestion. Propionlated peptides were transferred to C18 staging tips for desalting and eluted using 80% acetonitrile (ACN) with 0.1% trifluoracetic acid (TFA) before LC-MS analysis.
Peptides resulting from all digestions were separated by nanoscale C18 reverse-phase liquid chromatography using an UltiMate 3000 RSLCnano system coupled online to an Orbitrap Fusion Lumos Tribrid mass spectrometer (Lumos) (all Thermo Fisher Scientific). HPLC buffers- 0.1% formic acid in HPLC-grade water (buffer A); 0.1% formic acid in HPLC-grade acetonitrile (buffer B) were prepared. HPLC method was programmed as follows: from 0 to 30% buffer B in 30 min, from 30 to 100% B for the next 5 min and at isocratic 100% B for 8 min the flow rate was set to 250–300 nL/min.
Acquisitions were carried out in data independent acquisition mode (DIA) using Tune application 3.5.3890 (Thermo Scientific). A nanoelectrospray ion source (Sonation) was used for ionisation in positive mode. Chromatography was carried out at a flow rate of 250–300 nL/min using 50 cm fused silica emitters (CoAnn Technologies) packed in house with reverse phase Reprosil Pur Basic 1.9 μm (Dr. Maisch GmbH). The emitter was heated to 50°C using a column oven (Sonation), and an Active Background Ion Reduction Device (ABIRD) was used to decrease air contaminants signal level. Peptides were eluted with a 60-min two-step gradient, over a total run time of 90 min. A full scan was acquired at a resolution of 60,000 at 200 m/z, over mass range of 300–1100 m/z, followed by a DIA scan. All precursors were fragmented using 15 consecutive windows with 50 Da width, allowing for a 1 m/z overlap, covering a mass range from 349.5 to 1100.5 m/z. Higher energy collisional dissociation fragmentation spectra were recorded at 15,000 resolution at 200 m/z. All ions were fragmented using normalised collision energy of 28%, for a maximum injection time of 54 ms, or a normalised AGC target of 1000%.
Data analysis was performed on MATLAB using the EpiProfile2.1_1Basic package (https://doi.org/10.1021/acs.jproteome.8b00133) using label-free settings (nsource = 1) or for histone H3 acetylation and 13C2-acetyl incorporation analysis the C13 on acetylation group (nsource = 3). Isotopic correction was performed by MATLAB as implemented in EpiProfile.
Acetyl-CoA extraction and LC-MS analysis
To extract acetyl-CoA from whole cell lysates and nuclear department, samples were collected as described by Trefely et al., protocol.133 Briefly, live attached melanoma cells were isolated by 5-min incubation on ice with NIB buffer (15 mM Tris, 60 mM KCl, 15 mM NaCl, 5 mM MgCl2, 1 mM CaCl2, 250 mM sucrose, pH adjusted to 7.5, supplemented with 1 mM DTT and 0.1% NP-40) followed by scraping. 10% of each sample were removed and quenched in 1 mL ice-cold 10% TCA as total lysates. Nuclei were spun down by centrifuging at 600 rcf for 5 min at 4°C. The nuclei pellets were washed twice by NIB without NP-40 and then quenched in 1 mL 10% TCA. Acetyl-CoA was extracted using solid phase extraction to remove TCA. Extraction cartridges (Oasis HLB 1cc (30 mg)) were conditioned by running 1000 μL of methanol (MeOH) following by 1000 μL of water (H2O). On the cartridges, 100 μL of samples were then loaded, washed with 1000 μL of H2O and eluted with 500 μL of MeOH. The extracts were then dried under nitrogen and reconstituted in 80% ACN: 20% H2O (20 mM ammonium carbonate 0.1% ammonium hydroxide solution 25%).
Samples were analyzed on a Dionex UltiMate 3000 LC System (Thermo Scientific, Waltham, Massachusetts, EUA) coupled to a Q Exactive Orbitrap Mass Spectrometer (Thermo Scientific, Waltham, Massachusetts, EUA) operating in negative polarity with scan range from 806 to 815 m/z. Chromatographic separation was achieved using a ZIC-pHILIC 150 × 2.1 mm column (Merck Millipore Sigma, Burlington, Massachusetts, EUA) at 45°C using a gradient starting from 20% buffer A (20 mM ammonium carbonate 0.1% ammonium hydroxide solution 25%), and 80% B (acetonitrile) to 80% buffer A, 20% buffer B at 9.5 min and reconditioning the column to the initial condition until 14.5 min. Mass spectrometry data were processed using Skyline134 on a targeted fashion by matching accurate mass and retention time with standard.
A375 acetyl-histone H3 ChIP-Seq
The control and ALDH1A3 KO melanoma cells were cultured to 80% confluency and harvested by dissociation with trypsin in PBS/EDTA. Cells were resuspended in PBS and immediately fixed in 1% formaldehyde in PBS for 10 min at room temperature. The fixation was terminated by adding glycine and incubated for an additional 5 min. After being washed in cold PBS, cell pellets were resuspended in 150 μL chilled lysis buffer (1% SDS, 10mM EDTA, 50 mM Tris-HCl pH8.1, 1x protease inhibitor cocktail, 1x PhosSTOP phosphatase inhibitors (Roche), 5 mM sodium butyrate (Sigma) and fresh 1mM DTT) and supplemented with 850 μL 1% Triton X- IP dilution buffer (1% Triton X-, 20mM Tris-HCl pH8.1, 150mM NaCl, 2mM EDTA, 1x protease inhibitor cocktail (Roche), 1x PhosSTOP phosphatase inhibitors (Roche), 1mM DTT, 5 mM sodium butyrate and 1 mM PMSF) and incubated on ice for 10 min. Lysed cells were sonicated on ice for 8 × 30 s on/30 s off burst cycles with a probe sonicator (SoniPrep150) in a chilled ice-water bath (12 Amplitude) to yield chromatin fragments ranging between 200 and 800 bp in length. Sheared chromatin was centrifuged at 16,000xg for 10 min at 4°C and the soluble supernatant transferred to new tubes. Each 500 μL chromatin samples were supplemented with 5 μL (5 mg/ml) BSA. 10% of the input was stored and the rest was used for the immunoprecipitation.
Rabbit anti-acetyl-Histone H3 Antibody (Millipore) were pre-bound to magnetic SureBeads (BioRad) in 10% w/v BSA in PBS according to the manufacturer’s instructions for approximately 1h at 4°C with rotation, following which free antibody was removed with 3 washes of cold 10% w/v BSA in PBS. Chromatin and proteinG beads were combined and incubated over night at 4°C (at a ratio of 500 ng of bead bound antibody per 1 million cell equivalents of chromatin). Samples were washes at 4°C with rotation through the following series: 2 times in 1% Triton X- IP dilution buffer, 2 times with ChIP wash A (50mM HEPES ph7.9, 500mM NaCl, 1mM EDTA, 1% Triton X-100, 0.1% Na-deoxycholate, 0.1% SDS. 1x protease inhibitor cocktail, 1x PhosSTOP phosphatase inhibitors (Roche) and fresh 1mM DTT) and 2 times with ChIP wash B (20mM Tris pH 8.0, 1mM EDTA, 250mM LiCl, 1% NP-40, 0.1% Na-deoxycholate, 1x protease inhibitor cocktail, 1x PhosSTOP phosphatase inhibitors (Roche) and fresh 1mM DTT). Finally, the samples were washed with TE (1mM EDTA, 10mM Tris pH8.0). The samples were resuspended in TE and supplemented with preheated 37°C Extraction buffer (0.1M NaHCO3 and 1% SDS), vortexed and incubated for 15 min at 37°C on a vibrating platform.
The pH of the extracted chromatin was adjusted by adding 6μL 2M Tris-HCl pH6.8 following which both the ChIP and input samples were incubated with 20μg RNAse A (NEB) at 65°C for 1 h. Cross-links were reversed and the protein degraded by the addition of 20μg Proteinase K and incubation at 65°C for 6–8 h. Following removal of the magnetic SureBeads from the ChIP samples, DNA was purified using a Qiagen PCR cleanup kit following manufacturer’s instructions. DNA libraries were prepared using NEBNext Ultra II DNA Library Prep Kit for Illumina and NEBNext Multiplex Oligos for Illumina (Index Primers Set 1) following manufacturer’s instructions. Sequencing was performed using the NextSeq 500/550 High-Output v2.5 (150 cycle) Kit (#20024907) on the NextSeq 550 platform (Illumina Inc, #SY-415-1002). PhiX Control v3 (Illumina, #FC-110-3001) was spiked into the library pool at a concentration of ∼1% to enable troubleshooting in the event of any issues with the run.
ChIP-seq data analysis pipeline
Basecall data produced by the NextSeq 550 is automatically uploaded to BaseSpace, a cloud-based data management and analysis service provided by Illumina. Here it is converted into FASTQ files and mapped to was mapped to the human genome (GRCh19) using bowtie2 (bwa-0.7.9) applications directly accessible through BaseSpace. BAM files were uploaded to the open access bioinformatic community platform Galaxy (the public server at usegalaxy.org) for downstream analysis.120 All datasets and analysis history can be accessed (via https://usegalaxy.org/u/yuting_lu/h/a375-acetyl-histone-h3-chipseq-wt-vs-aldh1a3-knockout).
Briefly, mapped regions (due to fragment processing) extended beyond the end of the chromosomes were removed using SAMtools. MACS2 calling broadpeak algorithm was used to identify histone H3 acetylation regions, with each ChIP BAM file paired with the input control, cut off -- mfold 5 50, bandwidth --bw 500, FDR --qvalue 0.05. Call peak results (gapped peaks) were used for differential binding (histone acetylation in this case) analysis between A375 WT and ALDH1A3 knockout cells using the DiffBind.117 R package ChIPseeker135 was used for adjacent gene annotation and genomic distribution analysis. To visualise the histone H3 acetylation sites on the genome browser UCSC136 mapped reads were converted to bigWig files (.bw) using the bamCoverage (deepTools2) algorithm,116 with replicants for each condition merged.
ACSS2 ChIP qPCR
ACSS2 bound chromatin were pulled down using rabbit anti-ACSS2 antibody (Cell Signaling Technology) with the same ChIP protocol described above in A375 acetyl-Histone H3 ChIP-seq, ChIP-ACSS2 DNA and input control were purified using the QIAquick PCR Purification Kit (Qiagen) and used for qPCR with the same LightCycler 480 SYBR Green (Roche) system as described above in the qPCR method for RT-qPCR. The ChIP qPCR primer sequences are listed in Table S6.
MPD002 ALDH1A3 knockdown
ALDH1A3 knockdown was achieved using siRNA Transfection. In brief, MPD002 cells were seeded in 6-well plate at a density of 5 × 10⁴ cells/well and incubated overnight for attachment. Cells were then incubated with 10 nM ALDH1A3 siRNA or scrambled control (Life Technology) in 0.7 mL Opti-MEM media with Lipofectamine RNAiMAX (4.5μL/well)(Invitrogen) for 6 h. Medium was then changed to normal culture condition for another 42–64 h (48-72h in total post transfection) and the cells were collected for downstream analysis.
MPD002 acetyl-histone H3K23 and H3K27 CUT&TAG
The CUT&TAG experiments were performed following the protocol established by the Henikoff lab137 in principle. In brief, the control and ALDH1A3 knockdown melanoma cells as well as spike-in control mouse embryonic stem cells (mESCs) were cultured to 90% confluency in 6-well plate and harvested by dissociation with trypsin in PBS/EDTA. Cells were resuspended in PBS supplemented with 5 mM sodium butyrate (Sigma) and counted. For each sample, 50,000 target cells (MPD002) and 5,000 spike-in control cells (mESCs) were combined and aliquoted for nuclei extraction (50 μL per sample, 20 mM HEPES pH7.5; 10 mM KCl; 0.5 mM Spermidine; 0.1% Triton; 1× Protease inhibitor cocktail; 20% v/v glycerol; 10 min on ice). Nuclei pellets were then collected by centrifuge for 4 min at 1,300 × g at 4°C and washed once in PBS supplemented with 5 mM sodium butyrate (Sigma) before binding to prepared concanavalin A coated magnetic beads (Bangs Laboratories, add 3.5 μl per sample to 50 μL binding buffer: 20 mM HEPES pH 8.0; 10 mM KCl; 1 mM CaCl2; 1 mM MnCl2; incubate 20 min at RT). The bead-bound nuclei were resuspended in 25 μL Wash Buffer (20 mM HEPES pH 7.5; 150 mM NaCl; 0.5 mM Spermidine; 1× Protease inhibitor cocktail) and the appropriate primary antibodies were added at 1:50 dilution ratio (Rabbit anti-H3K23ac, Invitorgen; Rabbit anti-H3K27ac, Cell Signaling Technology; CUT&TAG IgG control, Cell Signaling Technology). Primary antibody incubation was performed on a rotating platform overnight at 4 °C. Unbound primary antibodies were removed by placing the sample tubes to magnet stand and discarding all supernatant liquid. Next, 25 μL of 1:100 diluted goat anti-rabbit unconjugated secondary antibodies (Abcam) were added to each sample to increase the number of Protein A binding sites, with samples incubated on a rotating platform at RT for 1 h. Samples were then rinsed in Wash Buffer for 2–3 times before 1:200 dilution of pA-Tn5 adapter complex (EpiCypher) were prepared in high salt wash buffer (20 mM HEPES, pH 7.5, 300 mM NaCl, 0.5 mM Spermidine, 1× Protease inhibitor cocktail) and added to each sample (1.25 μl for each 25 μl reaction volume). pA-Tn5 incubation was performed at RT for 1 h on a rotating platform, before the unbound pA-Tn5 enzymes were removed by washing the beads using Wash Buffer on a magnet stand. Finally, tagmentation reaction were performed by resuspending the pA-Tn5 bound samples in 50 μL tagmentation buffer (High Salt Wash Buffer plus 10 mM MgCl2) and incubate at 37°C for 1 h. Tagmentation was terminated by removing the tagmentation buffer using magnet stand and wash once in TAPS wash buffer (10 mM TAPS, 0.2 mM EDTA). To release the DNA, 5 μL SDS release buffer was added to each sample (0.1% SDS in 10 mM TAPS, 0.2 mM EDTA) with samples incubated at 58°C for 1 h in a PCR cycler.
To prepare the libraries for sequencing, 15 μL of 0.67% Triton water solution were added directly to the bead slurry, plus 2.5 μL each of 10 μM uniquely barcoded i5 primer and i7 primers, using a different barcode combination for each sample. Next, 25 μL NEBNext HiFi 2× PCR Master mix (NEB) was immediately added and mixed before proceeding to PCR cycles (58 °C for 5 min (gap filling); 72 °C for 5 min (gap filling); 98 °C for 30 s; 14 cycles of 98 °C for 10 s and 60 °C for 10 s; final extension at 72 °C for 1 min and hold at 10 °C). Post-PCR clean-up was performed by adding 1.3× volume (65 μL) of Ampure XP beads (Beckman Counter) to the PCR reaction (50 μL) and incubating for 15 min at RT. The beads were then washed twice in 80% ethanol, with the final DNA libraries eluted in 22 μL 10 mM Tris pH 8.0. Library quality and fragment sizes were examined by high sensitivity TapeStation (Agilent) before sequencing.
CUT&TAG data analysis pipeline
Basecall data produced by the NextSeq 550 is automatically uploaded to BaseSpace. The FASTQ files were mapped to the human genome (GRCh38) and the spike-in control genome (mm9) using bowtie2 (bwa-0.7.9). The mapped read counts splitting between target species (human) and spike-in control (mm9) were then used for calculating the scaling factors. Next, mapped regions were filtered using SAMtools for the flag of PCR duplication. Filtered BAM files were used for MACS2 calling broadpeak algorithm to identify histone H3K23 and H3K27 acetylation regions respectively, with each BAM file paired with the IgG control from the matching experiment group, (cut off -- mfold 2 50, bandwidth --bw 300, FDR --qvalue 0.05). Peak calling results (gapped peaks) were used for differential peak analysis by applying edgeR differential analysis (fold change >1, FDR-q <0.05) between the control and ALDH1A3 knockdown master list peak reads (n = 2), which were compiled by retrieving the filtered BAM reads count from the gapped peak bed coordinates, normalised by sequencing depth, and calibrated using the corresponding scaling factor. R package ChIPseeker135 was used for adjacent gene annotation and genomic distribution analysis. Representative peak on gene tracks were visualised using UCSC genome browser following bigwigAverage combining the replicate sample bigwig output from filtered BAM alignment files, which were individually normalised by genome coverage and calibrated using scale factors (bamCoverage --normalizeUsing RPGC --scaleFactor).
AlphaFold Multimer modeling of ALD6-ACS2 and ALDH1A3-ACSS2 interaction
Canonical sequences of yeast ALD6 (UniProt: P54115) and ACS2 (UniProt: P52910) and human ALDH1A3 (UniProt: P47895) and ACSS2 (UniProt: Q9NR19) were retrieved.121 Disordered N-termini of the human proteins, the first 24 residues of each, were removed to facilitate complex prediction. AlphaFold-Multimer76 predictions were performed with LocalColabFold (https://github.com/YoshitakaMo/localcolabfold), running ColabFold version 1.5.2122 on a single 350GB NVIDIA A100 GPU. Both yeast and human sequences were run as dimers of ALD6/ALDH1A3 and monomers of ACS2/ACSS2 because of sequence length limitations. We used templates available in the Protein Data Bank138 and the “mmseqs2_uniref” option for the –msa-mode flag. For both yeast and human complexes, we generated 3 models with 5 recycles and excluded models that were incompatible with the tetrameric structure of ALDH1A3. Confidence is 45% for yeast and 47% for the human complexes, calculated as 0.2 × pTM +0.8 × ipTM.76 The highest ranking models of each complex were further refined with GalaxyRefineComplex,123 using default settings of protocol 2. Solvent accessible surface was calculated at residue level with FreeSASA 2.0.3124 with the buried surface area defined as the difference in solvent accessible surface area between the monomer and the complex. Homologous residues were determined via sequence alignment with MUSCLE.139 Conservation of ACS2/ACSS2 interface with ALD6/ALDH1A3 was determined by calculating the Pearson correlation between the buried surface area values of homologous residues. ATP/CoA binding pocket of ACSS2 was visualised by structural alignment of AlphaFill-optimized125 protein-ligand complexes (ATP donor: PDB: 5k8f; CoA donor: PDB: 3gpc) to the AlphaFold-Multimer predicted model. Visualisation of protein structures was performed with UCSF ChimeraX version 1.6.126
Zebrafish melanoma ALDH activity measurement
Zebrafish melanoma live cells were dissociated from freshly dissected tumor samples as described in Travnickova et al., 2019.12 Cell suspensions were sized to 1 million cell count per mL and incubated with AldeRed (ThermoFisher Technologies) following the instruction by the manufacturer. After incubation of 1 h at 28°C, the AldeRed activity was measured using flow cytometry (Fortessa, BD Biosciences). For cell sorting to establish the zebrafish ALDHHigh and ALDHLow cells, the stained cells were sorted by FACS Aria II (BD Biosciences) and the population with the highest and lowest 5% ALDH activity (ALDHHigh and ALDHLow) were collected, as is described for AldeFluor guided ALDH subpopulation selection.
Zebrafish drug pellet treatment
To perform drug treatment on adult zebrafish bearing melanoma, we produced fish bite-size drug pellets as described in our previous publication81 and fed single-housed individual fish with fish food agar pellets containing DMSO (Sigma Aldrich), vemurafenib (SelleckChem), and/or Nifuroxazide (Merck Millipore) once per day. Zebrafish under the drug treatment procedure were fed daily in the AM and early PM with artemia, and then fed the drug pellets in the late PM (6–8 p.m.). Zebrafish actively sought for and consumed the drug pellets voluntarily without any handling. Zebrafish under continuous drug treatment were imaged one day pre-treatment and once every week to track tumor size change.
Imaging of adult zebrafish tumor and size measurement
Zebrafish were briefly anesthetised (Tricaine in PBS 1:10,000 concentration) for no longer than 10 min per session and fully recovered in fresh system water. Brightfield images were taken for each fish positioned on both sides. Images of fish lesions were captured at the same magnification scale every week using a Nikon COOLPIX5400 camera attached to a brightfield microscope (Nikon SMZ1500). The size of each lesion was quantified by using the manual field selection in Fiji on each tumor image, then compared to the matching pre-treatment lesion to calculate the relative percentage change. Lesions that could be observed from both sides of the fish were measured by combining the area number averaged from both sides.
Zebrafish histology and IHC quantification
Zebrafish melanoma samples were collected, fixed, and processed as described in our earlier publications.12,19,140 The slides of Haematoxylin and Eosin staining were imaged using a Hamamatsu NanoZoomer SlideScanner, and the images were processed using NDP.3 software. Aldh1a3 expression was assessed using Rabbit polyclonal anti-ALDH1A3 primary antibody (1:200, Abcam). Following secondary fluorescent antibody incubation (Donkey anti-mouse conjugated Alexa Fluor 568, Donkey anti-Rabbit conjugated Alexa Fluor 488 or 647, Invitrogen), nuclei were stained with DAPI dye (1:1000, Life Technologies). Stained tissue slides were mounted with antifade mounting medium (Vectashield, 2BScientific) before fluorescent microscope imaging using multimodal Imaging Platform Dragonfly (Andor technologies, Belfast UK). Similar to ICC imaging, images were acquired using a 20X lens equipped with 405, 488, 561, and 640 nm lasers built on a Nikon Eclipse Ti-E inverted microscope body with Perfect focus system (Nikon Instruments, Japan). Data were collected in Spinning Disk 25 μm pinhole mode on the Zyla 4.2 sCMOS camera using a Bin of 1 and no frame averaging using Andor Fusion acquisition software. Standard deviation intensity (STD) projection of a confocal z stack was performed in Fiji to allow intensity quantification and cell subpopulation assessment.
Quantification and statistical analysis
All statistical methods used in the paper are described in the figure legends and, where indicated, additional details are provided in the method details. Definitions of sample size, measures of center and dispersion, and precision measures are also indicated in figure legends. Statistics were computed using R and GraphPad Prism. When appropriate, corrections for multiple comparisons were implemented as indicated in the figure legends.
Acknowledgments
We thank James Chen (Stanford University), Kevin Myant (Edinburgh), and Wendy Bickmore (MRC HGU) for helpful discussions; Sergio Lilla for MS proteomic analysis (CRUK Beatson Institute Advanced Technology Facilities grant A17196); the Wellcome Trust Clinical Research Facility (WTCRF) for the next-generation sequencing service; Gerry Brien and Anthony Doherty (MRC HGU), Faith Robison (University of Washington), and Jun Han (Metabolomics Innovation Centre, University of Victoria) for experimental assistance; David Adams (Sanger Institute) for human melanoma cells; Craig Nicol and Uta Mackensen for the graphical assistance; Christina Lilliehook and Javier Carmona for editing assistance; the MRC HGU zebrafish facility; the MRC HGU Flow Cytometry facility and Technical Service staff; the MRC HGU imaging facility; and the IGC bioinformatic core.
We acknowledge the following funding: RSI: MRC Career Development award (MR/S007644/1) and the Simons Initiative for the Developing Brain (SFARI - 529085); A.V.K., Wellcome Trust (Multiuser Equipment 208402/Z/17); Z.K., Melville Trust for Cancer Research (studentship M00109.0001/TZH/MHR); F.R., Melanoma Research Alliance and the Wolfgang & Gertrud Boettcher Foundation; J.A.M., European Research Council (101001169); C.J.S., CRUK (C8717/A18245 and C8717/A28285) and the Wellcome Trust (106244/Z/14/Z); and E.E.P., Medical Research Council (MC_UU_00035/13), the European Research Council (ZF-MEL-CHEMBIO-648489), and Melanoma Research Alliance and Rosetrees Trust (MRA Awards 687306 and 917226). The generation of patient-derived cell lines was supported by funds from the Wellcome Trust (100282/Z/12/Z) to R.M. This work was supported by the CRUK Scotland Centre (CTRQQR-2021\100006).
Author contributions
Conceptualization, Y.L., A.C., and E.E.P.; data curation, Y.L., Z.K., J.A.M., and A.V.K.; formal analysis, Y.L., M.B., F.R., and P.L.; funding acquisition, F.R., A.V.K., J.A.M., C.J.S., O.J.S., R.I., and E.E.P.; investigation, Y.L., M.B., F.R., A.C., and Z.K.; methodology, Y.L., J.T., M.B., Z.K., J.A.M., L.M., and A.V.K.; project administration, Y.L. and E.E.P.; resources, Y.L., J.T., P.G.-M., A.H.Y.C., C.J.S., R.M., V.S.P., O.J.S., and E.E.P.; supervision, A.V.K., C.J.S., J.A.M., V.S.P., R.I., and E.E.P.; validation, Y.L. and R.I.; visualization, Y.L., M.B., F.R., and E.E.P.; writing – original draft, Y.L., M.B., R.I., and E.E.P.; writing – review & editing, Y.L., J.T., A.V.K., C.J.S., R.I., and E.E.P.
Declaration of interests
Richard Marais is a founder, director, and the CSO of Oncodrug Ltd, which has a drug discovery program targeting ALDH1A3.
Published: July 3, 2024
Footnotes
Supplemental information can be found online at https://doi.org/10.1016/j.celrep.2024.114406.
Supplemental information
References
- 1.Marine J.C., Dawson S.J., Dawson M.A. Non-genetic mechanisms of therapeutic resistance in cancer. Nat. Rev. Cancer. 2020;20:743–756. doi: 10.1038/s41568-020-00302-4. [DOI] [PubMed] [Google Scholar]
- 2.Rambow F., Marine J.C., Goding C.R. Melanoma plasticity and phenotypic diversity: therapeutic barriers and opportunities. Genes Dev. 2019;33:1295–1318. doi: 10.1101/gad.329771.119. [DOI] [PMC free article] [PubMed] [Google Scholar]
- 3.Hugo W., Shi H., Sun L., Piva M., Song C., Kong X., Moriceau G., Hong A., Dahlman K.B., Johnson D.B., et al. Non-genomic and Immune Evolution of Melanoma Acquiring MAPKi Resistance. Cell. 2015;162:1271–1285. doi: 10.1016/j.cell.2015.07.061. [DOI] [PMC free article] [PubMed] [Google Scholar]
- 4.Hugo W., Zaretsky J.M., Sun L., Song C., Moreno B.H., Hu-Lieskovan S., Berent-Maoz B., Pang J., Chmielowski B., Cherry G., et al. Genomic and Transcriptomic Features of Response to Anti-PD-1 Therapy in Metastatic Melanoma. Cell. 2016;165:35–44. doi: 10.1016/j.cell.2016.02.065. [DOI] [PMC free article] [PubMed] [Google Scholar]
- 5.Baggiolini A., Callahan S.J., Montal E., Weiss J.M., Trieu T., Tagore M.M., Tischfield S.E., Walsh R.M., Suresh S., Fan Y., et al. Developmental chromatin programs determine oncogenic competence in melanoma. Science. 2021;373 doi: 10.1126/science.abc1048. [DOI] [PMC free article] [PubMed] [Google Scholar]
- 6.Boshuizen J., Vredevoogd D.W., Krijgsman O., Ligtenberg M.A., Blankenstein S., de Bruijn B., Frederick D.T., Kenski J.C.N., Parren M., Brüggemann M., et al. Reversal of pre-existing NGFR-driven tumor and immune therapy resistance. Nat. Commun. 2020;11:3946. doi: 10.1038/s41467-020-17739-8. [DOI] [PMC free article] [PubMed] [Google Scholar]
- 7.Kaufman C.K., Mosimann C., Fan Z.P., Yang S., Thomas A.J., Ablain J., Tan J.L., Fogley R.D., van Rooijen E., Hagedorn E.J., et al. A zebrafish melanoma model reveals emergence of neural crest identity during melanoma initiation. Science. 2016;351 doi: 10.1126/science.aad2197. [DOI] [PMC free article] [PubMed] [Google Scholar]
- 8.Landsberg J., Kohlmeyer J., Renn M., Bald T., Rogava M., Cron M., Fatho M., Lennerz V., Wölfel T., Hölzel M., Tüting T. Melanomas resist T-cell therapy through inflammation-induced reversible dedifferentiation. Nature. 2012;490:412–416. doi: 10.1038/nature11538. [DOI] [PubMed] [Google Scholar]
- 9.Lee J.H., Shklovskaya E., Lim S.Y., Carlino M.S., Menzies A.M., Stewart A., Pedersen B., Irvine M., Alavi S., Yang J.Y.H., et al. Transcriptional downregulation of MHC class I and melanoma de- differentiation in resistance to PD-1 inhibition. Nat. Commun. 2020;11:1897. doi: 10.1038/s41467-020-15726-7. [DOI] [PMC free article] [PubMed] [Google Scholar]
- 10.Marin-Bejar O., Rogiers A., Dewaele M., Femel J., Karras P., Pozniak J., Bervoets G., Van Raemdonck N., Pedri D., Swings T., et al. Evolutionary predictability of genetic versus nongenetic resistance to anticancer drugs in melanoma. Cancer Cell. 2021;39:1135–1149.e8. doi: 10.1016/j.ccell.2021.05.015. [DOI] [PubMed] [Google Scholar]
- 11.Shaffer S.M., Dunagin M.C., Torborg S.R., Torre E.A., Emert B., Krepler C., Beqiri M., Sproesser K., Brafford P.A., Xiao M., et al. Rare cell variability and drug-induced reprogramming as a mode of cancer drug resistance. Nature. 2017;546:431–435. doi: 10.1038/nature22794. [DOI] [PMC free article] [PubMed] [Google Scholar]
- 12.Travnickova J., Wojciechowska S., Khamseh A., Gautier P., Brown D.V., Lefevre T., Brombin A., Ewing A., Capper A., Spitzer M., et al. Zebrafish MITF-Low Melanoma Subtype Models Reveal Transcriptional Subclusters and MITF-Independent Residual Disease. Cancer Res. 2019;79:5769–5784. doi: 10.1158/0008-5472.CAN-19-0037. [DOI] [PMC free article] [PubMed] [Google Scholar]
- 13.Curti B.D., Faries M.B. Recent Advances in the Treatment of Melanoma. N. Engl. J. Med. 2021;384:2229–2240. doi: 10.1056/NEJMra2034861. [DOI] [PubMed] [Google Scholar]
- 14.Atkins M.B., Lee S.J., Chmielowski B., Tarhini A.A., Cohen G.I., Truong T.G., Moon H.H., Davar D., O'Rourke M., Stephenson J.J., et al. Combination Dabrafenib and Trametinib Versus Combination Nivolumab and Ipilimumab for Patients With Advanced BRAF-Mutant Melanoma: The DREAMseq Trial-ECOG-ACRIN EA6134. J. Clin. Oncol. 2023;41:186–197. doi: 10.1200/JCO.22.01763. [DOI] [PMC free article] [PubMed] [Google Scholar]
- 15.Larkin J., Chiarion-Sileni V., Gonzalez R., Grob J.J., Rutkowski P., Lao C.D., Cowey C.L., Schadendorf D., Wagstaff J., Dummer R., et al. Five-Year Survival with Combined Nivolumab and Ipilimumab in Advanced Melanoma. N. Engl. J. Med. 2019;381:1535–1546. doi: 10.1056/NEJMoa1910836. [DOI] [PubMed] [Google Scholar]
- 16.Robert C., Grob J.J., Stroyakovskiy D., Karaszewska B., Hauschild A., Levchenko E., Chiarion Sileni V., Schachter J., Garbe C., Bondarenko I., et al. Five-Year Outcomes with Dabrafenib plus Trametinib in Metastatic Melanoma. N. Engl. J. Med. 2019;381:626–636. doi: 10.1056/NEJMoa1904059. [DOI] [PubMed] [Google Scholar]
- 17.Robert C., Ribas A., Schachter J., Arance A., Grob J.J., Mortier L., Daud A., Carlino M.S., McNeil C.M., Lotem M., et al. Pembrolizumab versus ipilimumab in advanced melanoma (KEYNOTE-006): post-hoc 5-year results from an open-label, multicentre, randomised, controlled, phase 3 study. Lancet Oncol. 2019;20:1239–1251. doi: 10.1016/S1470-2045(19)30388-2. [DOI] [PubMed] [Google Scholar]
- 18.Rambow F., Rogiers A., Marin-Bejar O., Aibar S., Femel J., Dewaele M., Karras P., Brown D., Chang Y.H., Debiec-Rychter M., et al. Toward Minimal Residual Disease-Directed Therapy in Melanoma. Cell. 2018;174:843–855.e19. doi: 10.1016/j.cell.2018.06.025. [DOI] [PubMed] [Google Scholar]
- 19.Travnickova J., Muise S., Wojciechowska S., Brombin A., Zeng Z., Young A.I.J., Wyatt C., Patton E.E. Fate mapping melanoma persister cells through regression and into recurrent disease in adult zebrafish. Dis. Model. Mech. 2022;15 doi: 10.1242/dmm.049566. [DOI] [PMC free article] [PubMed] [Google Scholar]
- 20.Diener J., Sommer L. Reemergence of neural crest stem cell-like states in melanoma during disease progression and treatment. Stem Cells Transl. Med. 2021;10:522–533. doi: 10.1002/sctm.20-0351. [DOI] [PMC free article] [PubMed] [Google Scholar]
- 21.Chauvistre H., Shannan B., Daignault-Mill S.M., Ju R.J., Picard D., Egetemaier S., Varaljai R., Gibhardt C.S., Sechi A., Kaschani F., et al. Persister state-directed transitioning and vulnerability in melanoma. Nat. Commun. 2022;13:3055. doi: 10.1038/s41467-022-30641-9. [DOI] [PMC free article] [PubMed] [Google Scholar]
- 22.Emert B.L., Cote C.J., Torre E.A., Dardani I.P., Jiang C.L., Jain N., Shaffer S.M., Raj A. Variability within rare cell states enables multiple paths toward drug resistance. Nat. Biotechnol. 2021;39:865–876. doi: 10.1038/s41587-021-00837-3. [DOI] [PMC free article] [PubMed] [Google Scholar]
- 23.Kong X., Kuilman T., Shahrabi A., Boshuizen J., Kemper K., Song J.Y., Niessen H.W.M., Rozeman E.A., Geukes Foppen M.H., Blank C.U., Peeper D.S. Cancer drug addiction is relayed by an ERK2-dependent phenotype switch. Nature. 2017;550:270–274. doi: 10.1038/nature24037. [DOI] [PMC free article] [PubMed] [Google Scholar]
- 24.Strub T., Ghiraldini F.G., Carcamo S., Li M., Wroblewska A., Singh R., Goldberg M.S., Hasson D., Wang Z., Gallagher S.J., et al. SIRT6 haploinsufficiency induces BRAF(V600E) melanoma cell resistance to MAPK inhibitors via IGF signalling. Nat. Commun. 2018;9:3440. doi: 10.1038/s41467-018-05966-z. [DOI] [PMC free article] [PubMed] [Google Scholar]
- 25.Du K., Wei S., Wei Z., Frederick D.T., Miao B., Moll T., Tian T., Sugarman E., Gabrilovich D.I., Sullivan R.J., et al. Pathway signatures derived from on-treatment tumor specimens predict response to anti-PD1 blockade in metastatic melanoma. Nat. Commun. 2021;12:6023. doi: 10.1038/s41467-021-26299-4. [DOI] [PMC free article] [PubMed] [Google Scholar]
- 26.Fischer G.M., Jalali A., Kircher D.A., Lee W.C., McQuade J.L., Haydu L.E., Joon A.Y., Reuben A., de Macedo M.P., Carapeto F.C.L., et al. Molecular Profiling Reveals Unique Immune and Metabolic Features of Melanoma Brain Metastases. Cancer Discov. 2019;9:628–645. doi: 10.1158/2159-8290.CD-18-1489. [DOI] [PMC free article] [PubMed] [Google Scholar]
- 27.Liu S., Dharanipragada P., Lomeli S.H., Wang Y., Zhang X., Yang Z., Lim R.J., Dumitras C., Scumpia P.O., Dubinett S.M., et al. Multi-organ landscape of therapy-resistant melanoma. Nat. Med. 2023;29:1123–1134. doi: 10.1038/s41591-023-02304-9. [DOI] [PMC free article] [PubMed] [Google Scholar]
- 28.Piskounova E., Agathocleous M., Murphy M.M., Hu Z., Huddlestun S.E., Zhao Z., Leitch A.M., Johnson T.M., DeBerardinis R.J., Morrison S.J. Oxidative stress inhibits distant metastasis by human melanoma cells. Nature. 2015;527:186–191. doi: 10.1038/nature15726. [DOI] [PMC free article] [PubMed] [Google Scholar]
- 29.Shen S., Faouzi S., Souquere S., Roy S., Routier E., Libenciuc C., André F., Pierron G., Scoazec J.Y., Robert C. Melanoma Persister Cells Are Tolerant to BRAF/MEK Inhibitors via ACOX1-Mediated Fatty Acid Oxidation. Cell Rep. 2020;33 doi: 10.1016/j.celrep.2020.108421. [DOI] [PubMed] [Google Scholar]
- 30.Tasdogan A., Faubert B., Ramesh V., Ubellacker J.M., Shen B., Solmonson A., Murphy M.M., Gu Z., Gu W., Martin M., et al. Metabolic heterogeneity confers differences in melanoma metastatic potential. Nature. 2020;577:115–120. doi: 10.1038/s41586-019-1847-2. [DOI] [PMC free article] [PubMed] [Google Scholar]
- 31.Ubellacker J.M., Tasdogan A., Ramesh V., Shen B., Mitchell E.C., Martin-Sandoval M.S., Gu Z., McCormick M.L., Durham A.B., Spitz D.R., et al. Lymph protects metastasizing melanoma cells from ferroptosis. Nature. 2020;585:113–118. doi: 10.1038/s41586-020-2623-z. [DOI] [PMC free article] [PubMed] [Google Scholar]
- 32.Pathria G., Scott D.A., Feng Y., Sang Lee J., Fujita Y., Zhang G., Sahu A.D., Ruppin E., Herlyn M., Osterman A.L., Ronai Z.A. Targeting the Warburg effect via LDHA inhibition engages ATF4 signaling for cancer cell survival. EMBO J. 2018;37 doi: 10.15252/embj.201899735. [DOI] [PMC free article] [PubMed] [Google Scholar]
- 33.Arner E.N., Rathmell J.C. Metabolic programming and immune suppression in the tumor microenvironment. Cancer Cell. 2023;41:421–433. doi: 10.1016/j.ccell.2023.01.009. [DOI] [PMC free article] [PubMed] [Google Scholar]
- 34.Varum S., Baggiolini A., Zurkirchen L., Atak Z.K., Cantù C., Marzorati E., Bossart R., Wouters J., Häusel J., Tuncer E., et al. Yin Yang 1 Orchestrates a Metabolic Program Required for Both Neural Crest Development and Melanoma Formation. Cell Stem Cell. 2019;24:637–653.e9. doi: 10.1016/j.stem.2019.03.011. [DOI] [PubMed] [Google Scholar]
- 35.Fischer G.M., Vashisht Gopal Y.N., McQuade J.L., Peng W., DeBerardinis R.J., Davies M.A. Metabolic strategies of melanoma cells: Mechanisms, interactions with the tumor microenvironment, and therapeutic implications. Pigment Cell Melanoma Res. 2018;31:11–30. doi: 10.1111/pcmr.12661. [DOI] [PMC free article] [PubMed] [Google Scholar]
- 36.Li J., Song J.S., Bell R.J.A., Tran T.N.T., Haq R., Liu H., Love K.T., Langer R., Anderson D.G., Larue L., Fisher D.E. YY1 regulates melanocyte development and function by cooperating with MITF. PLoS Genet. 2012;8 doi: 10.1371/journal.pgen.1002688. [DOI] [PMC free article] [PubMed] [Google Scholar]
- 37.Bhattacharya D., Khan B., Simoes-Costa M. Neural crest metabolism: At the crossroads of development and disease. Dev. Biol. 2021;475:245–255. doi: 10.1016/j.ydbio.2021.01.018. [DOI] [PMC free article] [PubMed] [Google Scholar]
- 38.Santoriello C., Sporrij A., Yang S., Flynn R.A., Henriques T., Dorjsuren B., Custo Greig E., McCall W., Stanhope M.E., Fazio M., et al. RNA helicase DDX21 mediates nucleotide stress responses in neural crest and melanoma cells. Nat. Cell Biol. 2020;22:372–379. doi: 10.1038/s41556-020-0493-0. [DOI] [PMC free article] [PubMed] [Google Scholar]
- 39.Sporrij A., Zon L.I. Nucleotide stress responses in neural crest cell fate and melanoma. Cell Cycle. 2021;20:1455–1467. doi: 10.1080/15384101.2021.1947567. [DOI] [PMC free article] [PubMed] [Google Scholar]
- 40.White R.M., Cech J., Ratanasirintrawoot S., Lin C.Y., Rahl P.B., Burke C.J., Langdon E., Tomlinson M.L., Mosher J., Kaufman C., et al. DHODH modulates transcriptional elongation in the neural crest and melanoma. Nature. 2011;471:518–522. doi: 10.1038/nature09882. [DOI] [PMC free article] [PubMed] [Google Scholar]
- 41.Johansson J.A., Marie K.L., Lu Y., Brombin A., Santoriello C., Zeng Z., Zich J., Gautier P., von Kriegsheim A., Brunsdon H., et al. PRL3-DDX21 Transcriptional Control of Endolysosomal Genes Restricts Melanocyte Stem Cell Differentiation. Dev. Cell. 2020;54:317–332.e9. doi: 10.1016/j.devcel.2020.06.013. [DOI] [PMC free article] [PubMed] [Google Scholar]
- 42.Sarvi S., Crispin R., Lu Y., Zeng L., Hurley T.D., Houston D.R., von Kriegsheim A., Chen C.H., Mochly-Rosen D., Ranzani M., et al. ALDH1 Bio-activates Nifuroxazide to Eradicate ALDH(High) Melanoma-Initiating Cells. Cell Chem. Biol. 2018;25:1456–1469.e6. doi: 10.1016/j.chembiol.2018.09.005. [DOI] [PMC free article] [PubMed] [Google Scholar]
- 43.Ginestier C., Hur M.H., Charafe-Jauffret E., Monville F., Dutcher J., Brown M., Jacquemier J., Viens P., Kleer C.G., Liu S., et al. ALDH1 is a marker of normal and malignant human mammary stem cells and a predictor of poor clinical outcome. Cell Stem Cell. 2007;1:555–567. doi: 10.1016/j.stem.2007.08.014. [DOI] [PMC free article] [PubMed] [Google Scholar]
- 44.Luo Y., Dallaglio K., Chen Y., Robinson W.A., Robinson S.E., McCarter M.D., Wang J., Gonzalez R., Thompson D.C., Norris D.A., et al. ALDH1A isozymes are markers of human melanoma stem cells and potential therapeutic targets. Stem Cell. 2012;30:2100–2113. doi: 10.1002/stem.1193. [DOI] [PMC free article] [PubMed] [Google Scholar]
- 45.Gulati G.S., Sikandar S.S., Wesche D.J., Manjunath A., Bharadwaj A., Berger M.J., Ilagan F., Kuo A.H., Hsieh R.W., Cai S., et al. Single-cell transcriptional diversity is a hallmark of developmental potential. Science. 2020;367:405–411. doi: 10.1126/science.aax0249. [DOI] [PMC free article] [PubMed] [Google Scholar]
- 46.Karras P., Bordeu I., Pozniak J., Nowosad A., Pazzi C., Van Raemdonck N., Landeloos E., Van Herck Y., Pedri D., Bervoets G., et al. A cellular hierarchy in melanoma uncouples growth and metastasis. Nature. 2022;610:190–198. doi: 10.1038/s41586-022-05242-7. [DOI] [PMC free article] [PubMed] [Google Scholar]
- 47.Tirosh I., Izar B., Prakadan S.M., Wadsworth M.H., 2nd, Treacy D., Trombetta J.J., Rotem A., Rodman C., Lian C., Murphy G., et al. Dissecting the multicellular ecosystem of metastatic melanoma by single-cell RNA-seq. Science. 2016;352:189–196. doi: 10.1126/science.aad0501. [DOI] [PMC free article] [PubMed] [Google Scholar]
- 48.Pozniak J., Pedri D., Landeloos E., Van Herck Y., Antoranz A., Vanwynsberghe L., Nowosad A., Roda N., Makhzami S., Bervoets G., et al. A TCF4-dependent gene regulatory network confers resistance to immunotherapy in melanoma. Cell. 2024;187:166–183.e25. doi: 10.1016/j.cell.2023.11.037. [DOI] [PubMed] [Google Scholar]
- 49.Liu D., Lin J.R., Robitschek E.J., Kasumova G.G., Heyde A., Shi A., Kraya A., Zhang G., Moll T., Frederick D.T., et al. Evolution of delayed resistance to immunotherapy in a melanoma responder. Nat. Med. 2021;27:985–992. doi: 10.1038/s41591-021-01331-8. [DOI] [PMC free article] [PubMed] [Google Scholar]
- 50.Bhattacharya D., Azambuja A.P., Simoes-Costa M. Metabolic Reprogramming Promotes Neural Crest Migration via Yap/Tead Signaling. Dev. Cell. 2020;53:199–211.e6. doi: 10.1016/j.devcel.2020.03.005. [DOI] [PMC free article] [PubMed] [Google Scholar]
- 51.Brombin A., Simpson D.J., Travnickova J., Brunsdon H., Zeng Z., Lu Y., Young A.I.J., Chandra T., Patton E.E. Tfap2b specifies an embryonic melanocyte stem cell that retains adult multifate potential. Cell Rep. 2022;38 doi: 10.1016/j.celrep.2021.110234. [DOI] [PMC free article] [PubMed] [Google Scholar]
- 52.Cancer Genome Atlas Network Genomic Classification of Cutaneous Melanoma. Cell. 2015;161:1681–1696. doi: 10.1016/j.cell.2015.05.044. [DOI] [PMC free article] [PubMed] [Google Scholar]
- 53.Cirenajwis H., Ekedahl H., Lauss M., Harbst K., Carneiro A., Enoksson J., Rosengren F., Werner-Hartman L., Törngren T., Kvist A., et al. Molecular stratification of metastatic melanoma using gene expression profiling: Prediction of survival outcome and benefit from molecular targeted therapy. Oncotarget. 2015;6:12297–12309. doi: 10.18632/oncotarget.3655. [DOI] [PMC free article] [PubMed] [Google Scholar]
- 54.Jonsson G., Busch C., Knappskog S., Geisler J., Miletic H., Ringner M., Lillehaug J.R., Borg A., Lonning P.E. Gene expression profiling-based identification of molecular subtypes in stage IV melanomas with different clinical outcome. Clin. Cancer Res. 2010;16:3356–3367. doi: 10.1158/1078-0432.CCR-09-2509. [DOI] [PubMed] [Google Scholar]
- 55.Lauss M., Nsengimana J., Staaf J., Newton-Bishop J., Jönsson G. Consensus of Melanoma Gene Expression Subtypes Converges on Biological Entities. J. Invest. Dermatol. 2016;136:2502–2505. doi: 10.1016/j.jid.2016.05.119. [DOI] [PubMed] [Google Scholar]
- 56.Luke J.J., Flaherty K.T., Ribas A., Long G.V. Targeted agents and immunotherapies: optimizing outcomes in melanoma. Nat. Rev. Clin. Oncol. 2017;14:463–482. doi: 10.1038/nrclinonc.2017.43. [DOI] [PubMed] [Google Scholar]
- 57.Dutton-Regester K., Aoude L.G., Nancarrow D.J., Stark M.S., O'Connor L., Lanagan C., Pupo G.M., Tembe V., Carter C.D., O'Rourke M., et al. Identification of TFG (TRK-fused gene) as a putative metastatic melanoma tumor suppressor gene. Genes Chromosomes Cancer. 2012;51:452–461. doi: 10.1002/gcc.21932. [DOI] [PubMed] [Google Scholar]
- 58.Vassalli G. Aldehyde Dehydrogenases: Not Just Markers, but Functional Regulators of Stem Cells. Stem Cell. Int. 2019;2019 doi: 10.1155/2019/3904645. [DOI] [PMC free article] [PubMed] [Google Scholar]
- 59.Rabinowitz J.D., Enerbäck S. Lactate: the ugly duckling of energy metabolism. Nat. Metab. 2020;2:566–571. doi: 10.1038/s42255-020-0243-4. [DOI] [PMC free article] [PubMed] [Google Scholar]
- 60.Torrini C., Nguyen T.T.T., Shu C., Mela A., Humala N., Mahajan A., Seeley E.H., Zhang G., Westhoff M.A., Karpel-Massler G., et al. Lactate is an epigenetic metabolite that drives survival in model systems of glioblastoma. Mol. Cell. 2022;82:3061–3076.e6. doi: 10.1016/j.molcel.2022.06.030. [DOI] [PMC free article] [PubMed] [Google Scholar]
- 61.Guertin D.A., Wellen K.E. Acetyl-CoA metabolism in cancer. Nat. Rev. Cancer. 2023;23:156–172. doi: 10.1038/s41568-022-00543-5. [DOI] [PMC free article] [PubMed] [Google Scholar]
- 62.Schug Z.T., Vande Voorde J., Gottlieb E. The metabolic fate of acetate in cancer. Nat. Rev. Cancer. 2016;16:708–717. doi: 10.1038/nrc.2016.87. [DOI] [PMC free article] [PubMed] [Google Scholar]
- 63.Liu X., Cooper D.E., Cluntun A.A., Warmoes M.O., Zhao S., Reid M.A., Liu J., Lund P.J., Lopes M., Garcia B.A., et al. Acetate Production from Glucose and Coupling to Mitochondrial Metabolism in Mammals. Cell. 2018;175:502–513.e13. doi: 10.1016/j.cell.2018.08.040. [DOI] [PMC free article] [PubMed] [Google Scholar]
- 64.Raudvere U., Kolberg L., Kuzmin I., Arak T., Adler P., Peterson H., Vilo J. g:Profiler: a web server for functional enrichment analysis and conversions of gene lists (2019 update) Nucleic Acids Res. 2019;47:W191–W198. doi: 10.1093/nar/gkz369. [DOI] [PMC free article] [PubMed] [Google Scholar]
- 65.Etchegaray J.P., Mostoslavsky R. Interplay between Metabolism and Epigenetics: A Nuclear Adaptation to Environmental Changes. Mol. Cell. 2016;62:695–711. doi: 10.1016/j.molcel.2016.05.029. [DOI] [PMC free article] [PubMed] [Google Scholar]
- 66.Hsieh W.C., Sutter B.M., Ruess H., Barnes S.D., Malladi V.S., Tu B.P. Glucose starvation induces a switch in the histone acetylome for activation of gluconeogenic and fat metabolism genes. Mol. Cell. 2022;82:60–74.e5. doi: 10.1016/j.molcel.2021.12.015. [DOI] [PMC free article] [PubMed] [Google Scholar]
- 67.Ye C., Tu B.P. Sink into the Epigenome: Histones as Repositories That Influence Cellular Metabolism. Trends Endocrinol. Metabol. 2018;29:626–637. doi: 10.1016/j.tem.2018.06.002. [DOI] [PMC free article] [PubMed] [Google Scholar]
- 68.McBrian M.A., Behbahan I.S., Ferrari R., Su T., Huang T.W., Li K., Hong C.S., Christofk H.R., Vogelauer M., Seligson D.B., Kurdistani S.K. Histone acetylation regulates intracellular pH. Mol. Cell. 2013;49:310–321. doi: 10.1016/j.molcel.2012.10.025. [DOI] [PMC free article] [PubMed] [Google Scholar]
- 69.Kurdistani S.K. Chromatin: a capacitor of acetate for integrated regulation of gene expression and cell physiology. Curr. Opin. Genet. Dev. 2014;26:53–58. doi: 10.1016/j.gde.2014.06.002. [DOI] [PMC free article] [PubMed] [Google Scholar]
- 70.Aibar S., González-Blas C.B., Moerman T., Huynh-Thu V.A., Imrichova H., Hulselmans G., Rambow F., Marine J.C., Geurts P., Aerts J., et al. SCENIC: single-cell regulatory network inference and clustering. Nat. Methods. 2017;14:1083–1086. doi: 10.1038/nmeth.4463. [DOI] [PMC free article] [PubMed] [Google Scholar]
- 71.Cai L., Sutter B.M., Li B., Tu B.P. Acetyl-CoA induces cell growth and proliferation by promoting the acetylation of histones at growth genes. Mol. Cell. 2011;42:426–437. doi: 10.1016/j.molcel.2011.05.004. [DOI] [PMC free article] [PubMed] [Google Scholar]
- 72.Szklarczyk D., Gable A.L., Lyon D., Junge A., Wyder S., Huerta-Cepas J., Simonovic M., Doncheva N.T., Morris J.H., Bork P., et al. STRING v11: protein-protein association networks with increased coverage, supporting functional discovery in genome-wide experimental datasets. Nucleic Acids Res. 2019;47:D607–D613. doi: 10.1093/nar/gky1131. [DOI] [PMC free article] [PubMed] [Google Scholar]
- 73.Gavin A.C., Aloy P., Grandi P., Krause R., Boesche M., Marzioch M., Rau C., Jensen L.J., Bastuck S., Dümpelfeld B., et al. Proteome survey reveals modularity of the yeast cell machinery. Nature. 2006;440:631–636. doi: 10.1038/nature04532. [DOI] [PubMed] [Google Scholar]
- 74.Alexander D.C., Corman T., Mendoza M., Glass A., Belity T., Wu R., Campbell R.R., Han J., Keiser A.A., Winkler J., et al. Targeting acetyl-CoA metabolism attenuates the formation of fear memories through reduced activity-dependent histone acetylation. Proc. Natl. Acad. Sci. USA. 2022;119 doi: 10.1073/pnas.2114758119. [DOI] [PMC free article] [PubMed] [Google Scholar]
- 75.Mews P., Donahue G., Drake A.M., Luczak V., Abel T., Berger S.L. Acetyl-CoA synthetase regulates histone acetylation and hippocampal memory. Nature. 2017;546:381–386. doi: 10.1038/nature22405. [DOI] [PMC free article] [PubMed] [Google Scholar]
- 76.Evans R., O’Neill M., Pritzel A., Antropova N., Senior A., Green T., Žídek A., Bates R., Blackwell S., Yim J., et al. Protein complex prediction with AlphaFold-Multimer. bioRxiv. 2022 doi: 10.1101/2021.10.04.463034. Preprint at. [DOI] [Google Scholar]
- 77.Chan A.H.Y., Ho T.C.S., Fathoni I., Pope R., Saliba K.J., Leeper F.J. Inhibition of Thiamine Diphosphate-Dependent Enzymes by Triazole-Based Thiamine Analogues. ACS Med. Chem. Lett. 2023;14:621–628. doi: 10.1021/acsmedchemlett.3c00047. [DOI] [PMC free article] [PubMed] [Google Scholar]
- 78.Zachar Z., Marecek J., Maturo C., Gupta S., Stuart S.D., Howell K., Schauble A., Lem J., Piramzadian A., Karnik S., et al. Non-redox-active lipoate derivates disrupt cancer cell mitochondrial metabolism and are potent anticancer agents in vivo. J. Mol. Med. 2011;89:1137–1148. doi: 10.1007/s00109-011-0785-8. [DOI] [PubMed] [Google Scholar]
- 79.Patton E.E., Widlund H.R., Kutok J.L., Kopani K.R., Amatruda J.F., Murphey R.D., Berghmans S., Mayhall E.A., Traver D., Fletcher C.D.M., et al. BRAF mutations are sufficient to promote nevi formation and cooperate with p53 in the genesis of melanoma. Curr. Biol. 2005;15:249–254. doi: 10.1016/j.cub.2005.01.031. [DOI] [PubMed] [Google Scholar]
- 80.Travnickova J., Patton E.E. Deciphering Melanoma Cell States and Plasticity with Zebrafish Models. J. Invest. Dermatol. 2021;141:1389–1394. doi: 10.1016/j.jid.2020.12.007. [DOI] [PMC free article] [PubMed] [Google Scholar]
- 81.Lu Y., Patton E.E. Long-term non-invasive drug treatments in adult zebrafish that lead to melanoma drug resistance. Dis. Model. Mech. 2022;15 doi: 10.1242/dmm.049401. [DOI] [PMC free article] [PubMed] [Google Scholar]
- 82.Goyal Y., Busch G.T., Pillai M., Li J., Boe R.H., Grody E.I., Chelvanambi M., Dardani I.P., Emert B., Bodkin N., et al. Diverse clonal fates emerge upon drug treatment of homogeneous cancer cells. Nature. 2023;620:651–659. doi: 10.1038/s41586-023-06342-8. [DOI] [PMC free article] [PubMed] [Google Scholar]
- 83.Hodskinson M.R., Bolner A., Sato K., Kamimae-Lanning A.N., Rooijers K., Witte M., Mahesh M., Silhan J., Petek M., Williams D.M., et al. Alcohol-derived DNA crosslinks are repaired by two distinct mechanisms. Nature. 2020;579:603–608. doi: 10.1038/s41586-020-2059-5. [DOI] [PMC free article] [PubMed] [Google Scholar]
- 84.Wang M., Dingler F.A., Patel K.J. Genotoxic aldehydes in the hematopoietic system. Blood. 2022;139:2119–2129. doi: 10.1182/blood.2019004316. [DOI] [PubMed] [Google Scholar]
- 85.Garaycoechea J.I., Crossan G.P., Langevin F., Mulderrig L., Louzada S., Yang F., Guilbaud G., Park N., Roerink S., Nik-Zainal S., et al. Alcohol and endogenous aldehydes damage chromosomes and mutate stem cells. Nature. 2018;553:171–177. doi: 10.1038/nature25154. [DOI] [PMC free article] [PubMed] [Google Scholar]
- 86.Garaycoechea J.I., Crossan G.P., Langevin F., Daly M., Arends M.J., Patel K.J. Genotoxic consequences of endogenous aldehydes on mouse haematopoietic stem cell function. Nature. 2012;489:571–575. doi: 10.1038/nature11368. [DOI] [PubMed] [Google Scholar]
- 87.Langevin F., Crossan G.P., Rosado I.V., Arends M.J., Patel K.J. Fancd2 counteracts the toxic effects of naturally produced aldehydes in mice. Nature. 2011;475:53–58. doi: 10.1038/nature10192. [DOI] [PubMed] [Google Scholar]
- 88.Rosado I.V., Langevin F., Crossan G.P., Takata M., Patel K.J. Formaldehyde catabolism is essential in cells deficient for the Fanconi anemia DNA-repair pathway. Nat. Struct. Mol. Biol. 2011;18:1432–1434. doi: 10.1038/nsmb.2173. [DOI] [PubMed] [Google Scholar]
- 89.Chen C.H., Kraemer B.R., Mochly-Rosen D. ALDH2 variance in disease and populations. Dis. Model. Mech. 2022;15 doi: 10.1242/dmm.049601. [DOI] [PMC free article] [PubMed] [Google Scholar]
- 90.Oberbeck N., Langevin F., King G., de Wind N., Crossan G.P., Patel K.J. Maternal aldehyde elimination during pregnancy preserves the fetal genome. Mol. Cell. 2014;55:807–817. doi: 10.1016/j.molcel.2014.07.010. [DOI] [PMC free article] [PubMed] [Google Scholar]
- 91.Dingler F.A., Wang M., Mu A., Millington C.L., Oberbeck N., Watcham S., Pontel L.B., Kamimae-Lanning A.N., Langevin F., Nadler C., et al. Two Aldehyde Clearance Systems Are Essential to Prevent Lethal Formaldehyde Accumulation in Mice and Humans. Mol. Cell. 2020;80:996–1012.e9. doi: 10.1016/j.molcel.2020.10.012. [DOI] [PMC free article] [PubMed] [Google Scholar]
- 92.Hira A., Yabe H., Yoshida K., Okuno Y., Shiraishi Y., Chiba K., Tanaka H., Miyano S., Nakamura J., Kojima S., et al. Variant ALDH2 is associated with accelerated progression of bone marrow failure in Japanese Fanconi anemia patients. Blood. 2013;122:3206–3209. doi: 10.1182/blood-2013-06-507962. [DOI] [PMC free article] [PubMed] [Google Scholar]
- 93.Wang M., Brandt L.T.L., Wang X., Russell H., Mitchell E., Kamimae-Lanning A.N., Brown J.M., Dingler F.A., Garaycoechea J.I., Isobe T., et al. Genotoxic aldehyde stress prematurely ages hematopoietic stem cells in a p53-driven manner. Mol. Cell. 2023;83:2417–2433.e7. doi: 10.1016/j.molcel.2023.05.035. [DOI] [PMC free article] [PubMed] [Google Scholar]
- 94.Pontel L.B., Rosado I.V., Burgos-Barragan G., Garaycoechea J.I., Yu R., Arends M.J., Chandrasekaran G., Broecker V., Wei W., Liu L., et al. Endogenous Formaldehyde Is a Hematopoietic Stem Cell Genotoxin and Metabolic Carcinogen. Mol. Cell. 2015;60:177–188. doi: 10.1016/j.molcel.2015.08.020. [DOI] [PMC free article] [PubMed] [Google Scholar]
- 95.Mews P., Egervari G., Nativio R., Sidoli S., Donahue G., Lombroso S.I., Alexander D.C., Riesche S.L., Heller E.A., Nestler E.J., et al. Alcohol metabolism contributes to brain histone acetylation. Nature. 2019;574:717–721. doi: 10.1038/s41586-019-1700-7. [DOI] [PMC free article] [PubMed] [Google Scholar]
- 96.Kriss C.L., Gregory-Lott E., Storey A.J., Tackett A.J., Wahls W.P., Stevens S.M., Jr. In Vivo Metabolic Tracing Demonstrates the Site-Specific Contribution of Hepatic Ethanol Metabolism to Histone Acetylation. Alcohol Clin. Exp. Res. 2018;42:1909–1923. doi: 10.1111/acer.13843. [DOI] [PMC free article] [PubMed] [Google Scholar]
- 97.Shen X., Wang R., Kim M.J., Hu Q., Hsu C.C., Yao J., Klages-Mundt N., Tian Y., Lynn E., Brewer T.F., et al. A Surge of DNA Damage Links Transcriptional Reprogramming and Hematopoietic Deficit in Fanconi Anemia. Mol. Cell. 2020;80:1013–1024.e6. doi: 10.1016/j.molcel.2020.11.040. [DOI] [PMC free article] [PubMed] [Google Scholar]
- 98.Wit N., Gogola E., West J.A., Vornbäumen T., Seear R.V., Bailey P.S.J., Burgos-Barragan G., Wang M., Krawczyk P., Huberts D.H.E.W., et al. A histone deacetylase 3 and mitochondrial complex I axis regulates toxic formaldehyde production. Sci. Adv. 2023;9 doi: 10.1126/sciadv.adg2235. [DOI] [PMC free article] [PubMed] [Google Scholar]
- 99.Burgos-Barragan G., Wit N., Meiser J., Dingler F.A., Pietzke M., Mulderrig L., Pontel L.B., Rosado I.V., Brewer T.F., Cordell R.L., et al. Mammals divert endogenous genotoxic formaldehyde into one-carbon metabolism. Nature. 2017;548:549–554. doi: 10.1038/nature23481. [DOI] [PMC free article] [PubMed] [Google Scholar]
- 100.Brunsdon H., Brombin A., Peterson S., Postlethwait J.H., Patton E.E. Aldh2 is a lineage-specific metabolic gatekeeper in melanocyte stem cells. Development. 2022;149 doi: 10.1242/dev.200277. [DOI] [PMC free article] [PubMed] [Google Scholar]
- 101.Schede H.H., Natarajan P., Chakraborty A.K., Shrinivas K. A model for organization and regulation of nuclear condensates by gene activity. Nat. Commun. 2023;14:4152. doi: 10.1038/s41467-023-39878-4. [DOI] [PMC free article] [PubMed] [Google Scholar]
- 102.Louphrasitthiphol P., Siddaway R., Loffreda A., Pogenberg V., Friedrichsen H., Schepsky A., Zeng Z., Lu M., Strub T., Freter R., et al. Tuning Transcription Factor Availability through Acetylation-Mediated Genomic Redistribution. Mol. Cell. 2020;79:472–487.e10. doi: 10.1016/j.molcel.2020.05.025. [DOI] [PMC free article] [PubMed] [Google Scholar]
- 103.Louphrasitthiphol P., Loffreda A., Pogenberg V., Picaud S., Schepsky A., Friedrichsen H., Zeng Z., Lashgari A., Thomas B., Patton E.E., et al. Acetylation reprograms MITF target selectivity and residence time. Nat. Commun. 2023;14:6051. doi: 10.1038/s41467-023-41793-7. [DOI] [PMC free article] [PubMed] [Google Scholar]
- 104.Reddy J., Fonseca M.A.S., Corona R.I., Nameki R., Segato Dezem F., Klein I.A., Chang H., Chaves-Moreira D., Afeyan L.K., Malta T.M., et al. Predicting master transcription factors from pan-cancer expression data. Sci. Adv. 2021;7 doi: 10.1126/sciadv.abf6123. [DOI] [PMC free article] [PubMed] [Google Scholar]
- 105.Ling I.T.C., Sauka-Spengler T. Early chromatin shaping predetermines multipotent vagal neural crest into neural, neuronal and mesenchymal lineages. Nat. Cell Biol. 2019;21:1504–1517. doi: 10.1038/s41556-019-0428-9. [DOI] [PMC free article] [PubMed] [Google Scholar]
- 106.Sanjana N.E., Shalem O., Zhang F. Improved vectors and genome-wide libraries for CRISPR screening. Nat. Methods. 2014;11:783–784. doi: 10.1038/nmeth.3047. [DOI] [PMC free article] [PubMed] [Google Scholar]
- 107.Dobin A., Davis C.A., Schlesinger F., Drenkow J., Zaleski C., Jha S., Batut P., Chaisson M., Gingeras T.R. STAR: ultrafast universal RNA-seq aligner. Bioinformatics. 2013;29:15–21. doi: 10.1093/bioinformatics/bts635. [DOI] [PMC free article] [PubMed] [Google Scholar]
- 108.DeLuca D.S., Levin J.Z., Sivachenko A., Fennell T., Nazaire M.D., Williams C., Reich M., Winckler W., Getz G. RNA-SeQC: RNA-seq metrics for quality control and process optimization. Bioinformatics. 2012;28:1530–1532. doi: 10.1093/bioinformatics/bts196. [DOI] [PMC free article] [PubMed] [Google Scholar]
- 109.Subramanian A., Tamayo P., Mootha V.K., Mukherjee S., Ebert B.L., Gillette M.A., Paulovich A., Pomeroy S.L., Golub T.R., Lander E.S., Mesirov J.P. Gene set enrichment analysis: a knowledge-based approach for interpreting genome-wide expression profiles. Proc. Natl. Acad. Sci. USA. 2005;102:15545–15550. doi: 10.1073/pnas.0506580102. [DOI] [PMC free article] [PubMed] [Google Scholar]
- 110.Hao Y., Hao S., Andersen-Nissen E., Mauck W.M., 3rd, Zheng S., Butler A., Lee M.J., Wilk A.J., Darby C., Zager M., et al. Integrated analysis of multimodal single-cell data. Cell. 2021;184:3573–3587.e29. doi: 10.1016/j.cell.2021.04.048. [DOI] [PMC free article] [PubMed] [Google Scholar]
- 111.Yuan Z.F., Sidoli S., Marchione D.M., Simithy J., Janssen K.A., Szurgot M.R., Garcia B.A. EpiProfile 2.0: A Computational Platform for Processing Epi-Proteomics Mass Spectrometry Data. J. Proteome Res. 2018;17:2533–2541. doi: 10.1021/acs.jproteome.8b00133. [DOI] [PMC free article] [PubMed] [Google Scholar]
- 112.Heinz S., Benner C., Spann N., Bertolino E., Lin Y.C., Laslo P., Cheng J.X., Murre C., Singh H., Glass C.K. Simple combinations of lineage-determining transcription factors prime cis-regulatory elements required for macrophage and B cell identities. Mol. Cell. 2010;38:576–589. doi: 10.1016/j.molcel.2010.05.004. [DOI] [PMC free article] [PubMed] [Google Scholar]
- 113.Wang Q., Li M., Wu T., Zhan L., Li L., Chen M., Xie W., Xie Z., Hu E., Xu S., Yu G. Exploring Epigenomic Datasets by ChIPseeker. Curr. Protoc. 2022;2 doi: 10.1002/cpz1.585. [DOI] [PubMed] [Google Scholar]
- 114.Li H., Handsaker B., Wysoker A., Fennell T., Ruan J., Homer N., Marth G., Abecasis G., Durbin R., 1000 Genome Project Data Processing Subgroup The Sequence Alignment/Map format and SAMtools. Bioinformatics. 2009;25:2078–2079. doi: 10.1093/bioinformatics/btp352. [DOI] [PMC free article] [PubMed] [Google Scholar]
- 115.Feng J., Liu T., Qin B., Zhang Y., Liu X.S. Identifying ChIP-seq enrichment using MACS. Nat. Protoc. 2012;7:1728–1740. doi: 10.1038/nprot.2012.101. [DOI] [PMC free article] [PubMed] [Google Scholar]
- 116.Ramirez F., Ryan D.P., Gruning B., Bhardwaj V., Kilpert F., Richter A.S., Heyne S., Dundar F., Manke T. deepTools2: a next generation web server for deep-sequencing data analysis. Nucleic Acids Res. 2016;44:W160–W165. doi: 10.1093/nar/gkw257. [DOI] [PMC free article] [PubMed] [Google Scholar]
- 117.Ross-Innes C.S., Stark R., Teschendorff A.E., Holmes K.A., Ali H.R., Dunning M.J., Brown G.D., Gojis O., Ellis I.O., Green A.R., et al. Differential oestrogen receptor binding is associated with clinical outcome in breast cancer. Nature. 2012;481:389–393. doi: 10.1038/nature10730. [DOI] [PMC free article] [PubMed] [Google Scholar]
- 118.McCarthy D.J., Chen Y., Smyth G.K. Differential expression analysis of multifactor RNA-Seq experiments with respect to biological variation. Nucleic Acids Res. 2012;40:4288–4297. doi: 10.1093/nar/gks042. [DOI] [PMC free article] [PubMed] [Google Scholar]
- 119.Hanzelmann S., Castelo R., Guinney J. GSVA: gene set variation analysis for microarray and RNA-seq data. BMC Bioinf. 2013;14:7. doi: 10.1186/1471-2105-14-7. [DOI] [PMC free article] [PubMed] [Google Scholar]
- 120.Galaxy Community The Galaxy platform for accessible, reproducible and collaborative biomedical analyses: 2022 update. Nucleic Acids Res. 2022;50:W345–W351. doi: 10.1093/nar/gkac247. [DOI] [PMC free article] [PubMed] [Google Scholar]
- 121.UniProt Consortium UniProt: the Universal Protein Knowledgebase in 2023. Nucleic Acids Res. 2023;51:D523–D531. doi: 10.1093/nar/gkac1052. [DOI] [PMC free article] [PubMed] [Google Scholar]
- 122.Mirdita M., Schütze K., Moriwaki Y., Heo L., Ovchinnikov S., Steinegger M. ColabFold: making protein folding accessible to all. Nat. Methods. 2022;19:679–682. doi: 10.1038/s41592-022-01488-1. [DOI] [PMC free article] [PubMed] [Google Scholar]
- 123.Heo L., Lee H., Seok C. GalaxyRefineComplex: Refinement of protein-protein complex model structures driven by interface repacking. Sci. Rep. 2016;6 doi: 10.1038/srep32153. [DOI] [PMC free article] [PubMed] [Google Scholar]
- 124.Mitternacht S. FreeSASA: An open source C library for solvent accessible surface area calculations. F1000Res. 2016;5:189. doi: 10.12688/f1000research.7931.1. [DOI] [PMC free article] [PubMed] [Google Scholar]
- 125.Hekkelman M.L., de Vries I., Joosten R.P., Perrakis A. AlphaFill: enriching AlphaFold models with ligands and cofactors. Nat. Methods. 2023;20:205–213. doi: 10.1038/s41592-022-01685-y. [DOI] [PMC free article] [PubMed] [Google Scholar]
- 126.Pettersen E.F., Goddard T.D., Huang C.C., Meng E.C., Couch G.S., Croll T.I., Morris J.H., Ferrin T.E. UCSF ChimeraX: Structure visualization for researchers, educators, and developers. Protein Sci. 2021;30:70–82. doi: 10.1002/pro.3943. [DOI] [PMC free article] [PubMed] [Google Scholar]
- 127.Otasek D., Morris J.H., Bouças J., Pico A.R., Demchak B. Cytoscape Automation: empowering workflow-based network analysis. Genome Biol. 2019;20:185. doi: 10.1186/s13059-019-1758-4. [DOI] [PMC free article] [PubMed] [Google Scholar]
- 128.Gillespie M., Jassal B., Stephan R., Milacic M., Rothfels K., Senff-Ribeiro A., Griss J., Sevilla C., Matthews L., Gong C., et al. The reactome pathway knowledgebase 2022. Nucleic Acids Res. 2022;50:D687–D692. doi: 10.1093/nar/gkab1028. [DOI] [PMC free article] [PubMed] [Google Scholar]
- 129.Shannon P., Markiel A., Ozier O., Baliga N.S., Wang J.T., Ramage D., Amin N., Schwikowski B., Ideker T. Cytoscape: a software environment for integrated models of biomolecular interaction networks. Genome Res. 2003;13:2498–2504. doi: 10.1101/gr.1239303. [DOI] [PMC free article] [PubMed] [Google Scholar]
- 130.Azuma T., Kei T. Super-resolution spinning-disk confocal microscopy using optical photon reassignment. Opt Express. 2015;23:15003–15011. doi: 10.1364/OE.23.015003. [DOI] [PubMed] [Google Scholar]
- 131.Han J., Gagnon S., Eckle T., Borchers C.H. Metabolomic analysis of key central carbon metabolism carboxylic acids as their 3-nitrophenylhydrazones by UPLC/ESI-MS. Electrophoresis. 2013;34:2891–2900. doi: 10.1002/elps.201200601. [DOI] [PMC free article] [PubMed] [Google Scholar]
- 132.Sidoli S., Bhanu N.V., Karch K.R., Wang X., Garcia B.A. Complete Workflow for Analysis of Histone Post-translational Modifications Using Bottom-up Mass Spectrometry: From Histone Extraction to Data Analysis. J. Vis. Exp. 2016;111 doi: 10.3791/54112. [DOI] [PMC free article] [PubMed] [Google Scholar]
- 133.Trefely S., Huber K., Liu J., Noji M., Stransky S., Singh J., Doan M.T., Lovell C.D., von Krusenstiern E., Jiang H., et al. Quantitative subcellular acyl-CoA analysis reveals distinct nuclear metabolism and isoleucine-dependent histone propionylation. Mol. Cell. 2022;82:447–462.e6. doi: 10.1016/j.molcel.2021.11.006. [DOI] [PMC free article] [PubMed] [Google Scholar]
- 134.MacLean B., Tomazela D.M., Shulman N., Chambers M., Finney G.L., Frewen B., Kern R., Tabb D.L., Liebler D.C., MacCoss M.J. Skyline: an open source document editor for creating and analyzing targeted proteomics experiments. Bioinformatics. 2010;26:966–968. doi: 10.1093/bioinformatics/btq054. [DOI] [PMC free article] [PubMed] [Google Scholar]
- 135.Yu G., Wang L.G., He Q.Y. ChIPseeker: an R/Bioconductor package for ChIP peak annotation, comparison and visualization. Bioinformatics. 2015;31:2382–2383. doi: 10.1093/bioinformatics/btv145. [DOI] [PubMed] [Google Scholar]
- 136.Kent W.J., Sugnet C.W., Furey T.S., Roskin K.M., Pringle T.H., Zahler A.M., Haussler D. The human genome browser at UCSC. Genome Res. 2002;12:996–1006. doi: 10.1101/gr.229102. [DOI] [PMC free article] [PubMed] [Google Scholar]
- 137.Kaya-Okur H.S., Wu S.J., Codomo C.A., Pledger E.S., Bryson T.D., Henikoff J.G., Ahmad K., Henikoff S. CUT&Tag for efficient epigenomic profiling of small samples and single cells. Nat. Commun. 2019;10:1930. doi: 10.1038/s41467-019-09982-5. [DOI] [PMC free article] [PubMed] [Google Scholar]
- 138.Berman H.M., Westbrook J., Feng Z., Gilliland G., Bhat T.N., Weissig H., Shindyalov I.N., Bourne P.E. The Protein Data Bank. Nucleic Acids Res. 2000;28:235–242. doi: 10.1093/nar/28.1.235. [DOI] [PMC free article] [PubMed] [Google Scholar]
- 139.Edgar R.C. MUSCLE: multiple sequence alignment with high accuracy and high throughput. Nucleic Acids Res. 2004;32:1792–1797. doi: 10.1093/nar/gkh340. [DOI] [PMC free article] [PubMed] [Google Scholar]
- 140.Lister J.A., Capper A., Zeng Z., Mathers M.E., Richardson J., Paranthaman K., Jackson I.J., Elizabeth Patton E. A conditional zebrafish MITF mutation reveals MITF levels are critical for melanoma promotion vs. regression in vivo. J. Invest. Dermatol. 2014;134:133–140. doi: 10.1038/jid.2013.293. [DOI] [PMC free article] [PubMed] [Google Scholar]
Associated Data
This section collects any data citations, data availability statements, or supplementary materials included in this article.
Supplementary Materials
Data Availability Statement
The RNA-seq, ChIP-seq, and CUTandTAG data generated in this study have been deposited at GEO and are publicly available as of the date of publication. Accession numbers are listed in the key resources table. The PDB files of ACSS2-ALDH1A3 and Acs2-Ald6 from AlphaFold-Multimer modeling are released on ModelArchive and are publicly available as of the date of publication with the DOI listed in the key resources table. No original code had been generated for this paper. Any additional information required to reanalyse the data reported in this paper is available from the lead contact upon request.