

Abstract
Orsay virus infection in the nematode Caenorhabditis elegans presents an opportunity to study host-virus interactions in an easily culturable, whole-animal host. Previously, a major limitation of C. elegans as a model for studying anti-viral immunity was the lack of viruses known to naturally infect the worm. With the discovery in 2011 of the Orsay virus, a naturally occurring viral pathogen, C. elegans has emerged as a compelling model for research on anti-viral defense. From the perspective of the host, the genetic tractability of C. elegans enables mechanistic studies of anti- viral immunity while the transparency of this animal allows for the observation of subcellular processes in vivo. Preparing infective virus filtrate and performing infections can be achieved with relative ease in a laboratory setting. Moreover, several tools are available to measure the outcome of infection. Here, we describe workflows for generating infective virus filtrate, achieving reproducible infection of C. elegans, and assessing the outcome of viral infection using molecular biology approaches and immunofluorescence.
Basic Protocol 1: Preparation of Orsay virus filtrate
Support Protocol 1: Synchronize C. elegans development by bleaching
Basic Protocol 2: Orsay virus infection
Basic Protocol 3: Quantification of Orsay virus RNA1/RNA2 transcript levels by qRT-PCR
Basic Protocol 4: Quantification of infection rate and fluorescence in situ hybridization (FISH) fluorescence intensity
Basic Protocol 5: Immunofluorescent labeling of dsRNA in virus-infected intestinal tissue
Keywords: Orsay virus, C. elegans, virus filtrate preparation, virus infection, anti-dsRNA immunofluorescence
INTRODUCTION
Isolated from wild strains of the nematode C. elegans, the Orsay virus is the only natural virus known to infect this nematode (Félix et al., 2011; Félix and Wang, 2019). Belonging to the Nodaviridae family, the Orsay virus is a positive-sense, single-stranded RNA virus with a genome that consists of two segments–RNA1 and RNA2. At ~3.4 kb, the RNA1 segment contains a gene that encodes the RNA-dependent RNA polymerase (RdRP), which controls viral replication. The 2.6 kb RNA2 segment encodes the viral capsid protein as well as a capsid-delta fusion protein (Jiang et al., 2014). Viral replication occurs within intestinal cells, and horizontal transmission from animal-to-animal enables viral spread; no vertical transmission has yet been reported for Orsay virus. As many canonical defense factors are absent in C. elegans, the study of immune responses in this nematode host has the potential to uncover novel anti-viral defense pathways.
Several factors make C. elegans a powerful model for investigating cell-intrinsic as well as systemic (tissue-to-tissue) immune responses to viral infection in an intact animal. With a body plan of approximately 1,000 cells, C. elegans has a fully described invariant cell (Corsi et al., 2018). Facilitated by the small size of the organism, a fast generation time and selfing hermaphrodite reproduction, C. elegans genetics enables high-throughput screening and mechanistic studies. The field also has an international, collaborative community of researchers with well-developed protocols, genetic tools, and the Caenorhabditis Genetics Center that catalogues and distributes wild-type and mutant strains to investigators. The C. elegans model also provides specific strengths to the study of intestinal immunity. For example, C. elegans and mammals share similarities in intestinal cell structure and function, increasing the potential for translational studies (Pukkila-Worley and Ausubel, 2012; Dimov and Maduro, 2019). The intestinal tissue tropism of the Orsay virus enables investigations of the mechanisms that shape intestinal immunity against viral pathogens. Moreover, the absence of known professional immune cells (e.g. macrophages, dendritic cells, T cells, B cells) presents an opportunity to explore how non-professional immune cells, including epithelial cells, coordinate organismal defense against a natural viral pathogen.
Fluorescent labeling of viruses offers a method to assess viral infection levels with spatial and temporal resolution. Unfortunately, it has not yet been possible to genetically encode a fluorescent tag within the Orsay virus genome, which would enable live labeling of the virus. Therefore, current methods for measuring the Orsay virus rely on fixation and fluorescence in situ hybridization (FISH) (Rivera et al., 2022). Although not possible in vivo, FISH labeling provides robust spatial and temporal resolution to assess viral infection. In addition to FISH, qRT-PCR has been used across several laboratories to measure viral load and/or infection rate (Jiang et al., 2014, 2017; Le Pen et al., 2018; Sandoval et al., 2019; Jiang et al., 2020; Sowa et al., 2020). Immunofluorescence has also enabled the detection of viral proteins (Franz et al., 2014). However, standardized approaches for performing and measuring infection have not been described in detail. Here, we provide a centralized resource that outlines methods for infecting C. elegans with the Orsay virus (Basic Protocols 1–2) and quantifying the outcome of viral infection in a reproducible manner (Basic Protocols 3–4).
A distinctive feature of single-stranded RNA virus replication is the generation of double-stranded RNA (dsRNA) intermediates. Importantly, dsRNA is considered a ‘non-self’ molecule by the immune system and thus can serve as a key trigger of innate immune responses in mammalian cells (Chen and Hur, 2022), where immunofluorescence can be used to detect dsRNA (Son et al., 2015). A key advantage of C. elegans is that immunofluorescence can be used to assess subcellular components in intact animals. Here, we provide a detailed approach that combines FISH with immunofluorescence to simultaneously visualize viral RNA and dsRNA within adult intestinal cells (Basic Protocol 5).
With a biomass equivalent to 82% of total human biomass, nematodes are among the most abundant organisms on this planet (van den Hoogen et al., 2019), yet we have a relatively limited understanding of their anti-viral defenses. Findings from multiple laboratories have demonstrated a role for RNA interference (RNAi) in anti-viral defense in C. elegans (Lu et al., 2009; Félix et al., 2011; Guo et al., 2013; Ashe et al., 2013; Gammon, 2017). For example, loss-of-function mutations in the RNAi component RDE-1 results in increased susceptibility to virus. Independent of RNAi-mediated defense, a C. elegans terminal uridylyltransferase, CDE-1, promotes anti-viral activity through uridylation and subsequent degradation of the Orsay virus genome (Le Pen et al., 2018). Orsay virus infection also induces an anti-viral transcriptional immune response, termed the Intracellular Pathogen Response (IPR), that is distinct from RNAi (Bakowski et al., 2014; Reddy et al., 2017; Sowa et al., 2020). However, the relative contributions of these different pathways to anti-viral defense remain unclear. We also have a limited understanding of the spatial relationships between host and viral proteins. To address these outstanding questions, the application of the protocols described below will enable further investigation of the C. elegans response to viral infection.
In this article, we describe five main protocols to facilitate studies of Orsay virus infection in C. elegans (Fig. 1). Basic Protocol 1 provides detailed steps to generate a large batch of Orsay virus filtrate for use in infection assays. Basic Protocol 2 describes a method for performing viral infections in synchronized first and fourth larval stage (L1 and L4) animals, although all post- embryonic stages of C. elegans are susceptible to infection. Basic Protocols 3–4 provide standardized approaches to assess the outcome of infection using qRT-PCR and FISH. Finally, Basic Protocol 5 describes steps to combine FISH and immunofluorescence to simultaneously visualize viral RNA and dsRNA in intestinal tissue.
Figure 1.
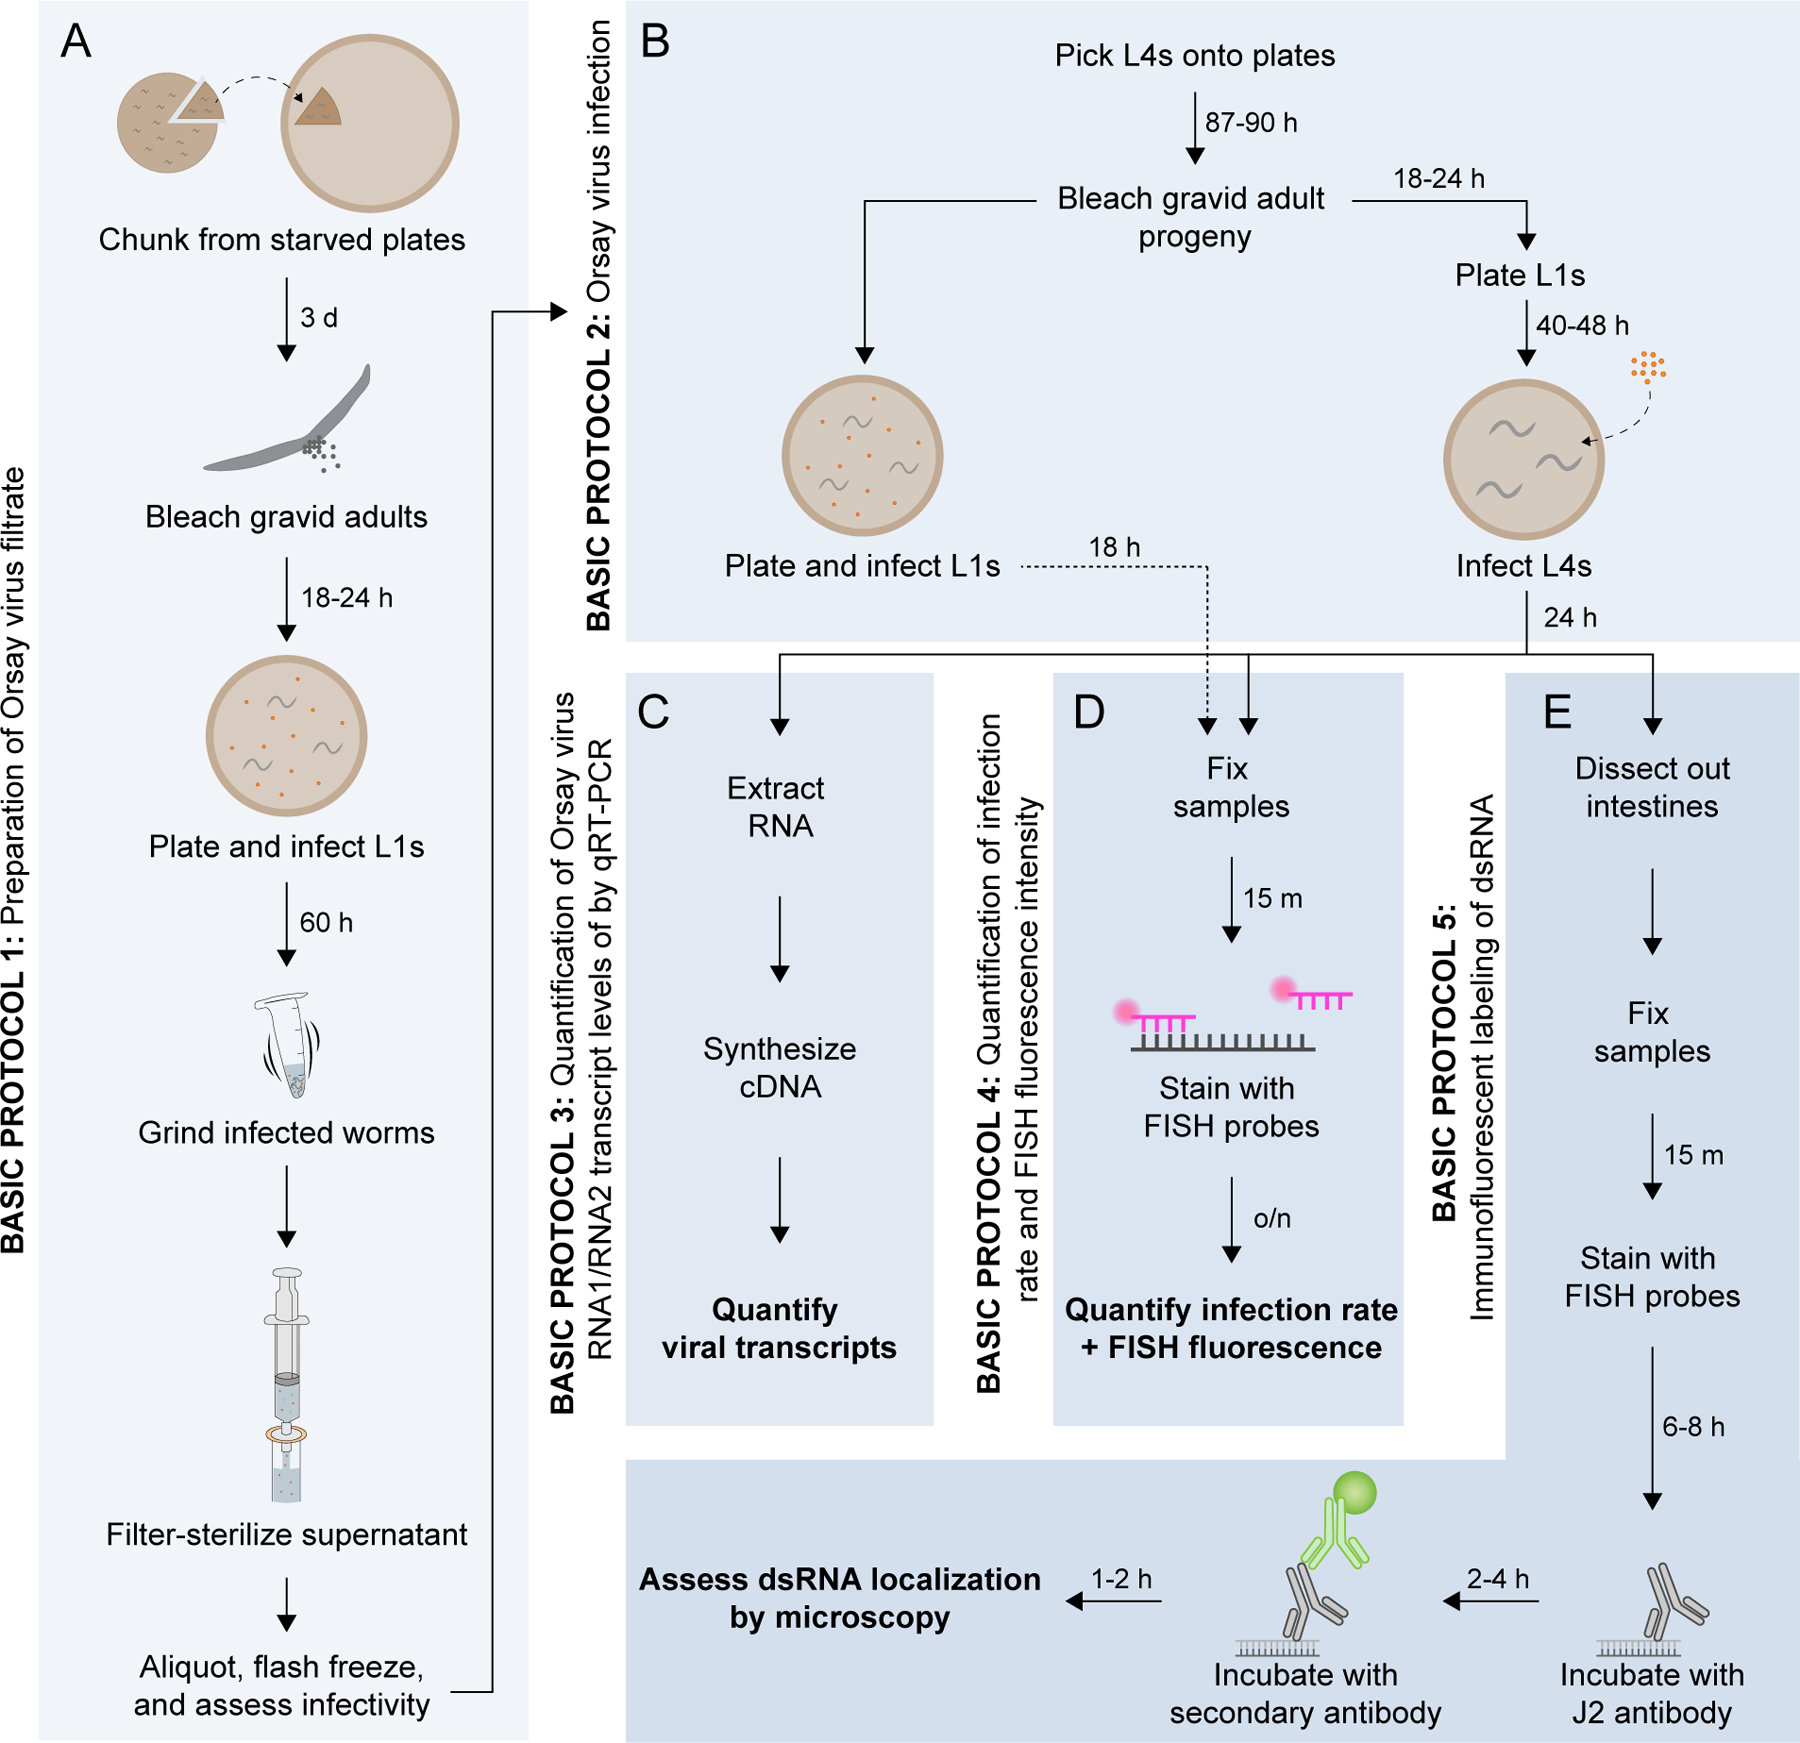
Overview of Basic Protocols 1–5. (A) Basic Protocol 1: Preparation of Orsay virus filtrate. (B) Basic Protocol 2: Orsay virus infection. (C) Basic Protocol 3: Quantification of Orsay virus RNA1 transcript levels by qRT-PCR. (D) Basic Protocol 4: Quantification of infection rate and fluorescence in situ hybridization (FISH) fluorescence intensity. (E) Basic Protocol 5: Immunofluorescent labeling of dsRNA in virus-infected intestinal tissue.
BASIC PROTOCOL 1: Preparation of Orsay virus filtrate
Because C. elegans is the only known host of the Orsay virus, and no tissue culture systems exist for this host, the virus must be fed to and amplified inside of C. elegans animals, which are grown on agar plates seeded with an Escherichia coli food source. As an alternate to agar plates, infected worms can be grown in liquid culture to amplify virus (Jiang et al., 2014). After amplification within C. elegans, virus filtrate can be extracted, aliquoted, and flash frozen in large batches to ensure reproducible infection across experiments (Fig. 1A). To increase the total number of viral particles generated, filtrate preparations are best performed in animals defective in RNAi and thus exhibiting higher viral load compared to N2 animals. For example, our lab uses RNAi-defective rde-1 mutant animals. Virus filtrate preparations can also be performed in animals that express the pals-5p::GFP reporter (as part of the integrated transgene jyIs8). A member of the IPR gene family, pals-5 is highly upregulated during viral infection. Therefore, the pals- 5p::GFP reporter provides a visual indicator of infection that can be useful when preparing virus filtrate and determining an optimal viral titer for downstream assays.
Materials
Standard 10 cm Nematode Growth Medium (NGM) plates seeded with E. coliOP50-1
10x concentrated E. coli OP50-1 (grown in LB at 37ºC and 200–300 rpm overnight, concentrated by pelleting and removing supernatant)
C. elegans strains (jyIs8 and rde-1; jyIs8) Sterile M9 buffer
Bleaching solution (Support Protocol 1)
Orsay virus filtrate (to obtain virus, contact Emily Troemel etroemel@ucsd.edu, Marie-Anne Felix felix@bio.ens.psl.eu, or Dave Wang davewang@wustl.edu)
Sterile 1.0 mm dia. silicon carbide beads (BioSpec Products, cat. no. 11079110sc)
Liquid nitrogen
6-well NGM plate
20ºC incubator
15 mL and 50 mL conical tubes
Nutator (Labquake Shaker Rotisserie, Model 4125110)
10 mL repeater pipette (5 mL tips)
Laminar flow hood Glass Pasteur pipette
1.5 mL centrifuge tubes
Bead beater (Scientific Industries Disruptor Genie, Model SI-D236) Table-top centrifuge
10 mL syringe
0.22 µm filter
Fluorescence microscope
Obtain a population of developmentally synchronized worms
-
1Chunk (i.e. cut pieces of agar containing large numbers of C. elegans) from two 6 cm freshly starved plates of rde-1; jyIs8 worms onto ten 10 cm seeded NGM plates. For a detailed review on worm husbandry, refer to the WormBook chapter titled “Maintenance of C. elegans” (Stiernagle, 2006).Divide each 6 cm plate into fifths and chunk each fifth onto a 10 cm plate.
-
2
Incubate at 20ºC for 3 d.
-
3Bleach gravid adults to release eggs.See Support Protocol 1 for a detailed protocol on bleaching worms.
-
4Incubate embryos in 3 mL M9 buffer at 20ºC with rotation on a nutator overnight (18–24 h) to yield a synchronized population of L1 stage animals.We typically observe a yield of ~600,000 embryos, although this number can vary depending on the number of starved animals on each 6 cm plate in Step 1.
Plate and infect L1s
-
5In a 50 mL conical tube, prepare an infection master mix containing L1 worms, 10x E. coli OP50-1, Orsay virus filtrate (OVF), and M9. Prepare enough infection mix for at least thirty plates (1 mL per plate).Each plate should contain 20,000 L1s, 250 µL 10x E. coli OP50-1, 20 µL undiluted OVF, and M9 in a total volume of 1 mL.
-
6
In a laminar flow hood, use a repeater pipette to dispense 1 mL of infection mix onto (at least) thirty 10 cm plates. Tilt to spread liquid evenly across the surface of the plate.
-
7Allow plates to dry uncovered in laminar flow hood until all liquid disappears.It should take ~30 min. for plates to dry.
-
8Cover plates and incubate at 20ºC until L1s are gravid adults (~60 h).To prevent worms from starving, feed once daily with 500 µL of 100x concentrated E. coli OP50-1, which is made by concentrating the volume of OP50-1 culture 100-fold. Dry plates uncovered in laminar flow hood after adding 100x OP50-1. Monitor plates closely and supplement with food as necessary to prevent starvation.
Grind infected worms
-
9Confirm infection by fluorescence microscope.If infection is successful, worms should express pals-5p::GFP, which can be visualized using a fluorescence dissecting microscope.
-
10
Use M9 to collect worms into 15 mL conical tubes, pooling three plates into one tube. Begin by adding 7 mL of M9 to one plate and tilt to collect worms into solution. Then, pour liquid from the first plate onto the second plate and tilt to collect worms into solution. Repeat with the third plate. Transfer the worms to a 15 mL conical tube by pouring or by using a glass Pasteur pipette (instead of plastic, because worms adhere less to glass than to plastic). Repeat the process with an additional 7 mL of M9 to collect any remaining worms on the three plates.
-
11
Wash worms 2x with M9. Pellet worms at 1,500 x g for 30 s, remove supernatant to ~2 mL, and resuspend in 10 mL of M9. Repeat steps for the second wash.
-
12
Pellet worms, resuspend in 1 mL of M9, and transfer to 1.5 mL microcentrifuge tubes.
-
13Add a scoop of sterile silicon carbide beads to each 1.5 mL tube.The scoop size should be equivalent to the size of a pencil eraser.Other protocols call for ~10 individual beads, but the density of worms using this protocol requires more beads to keep the grinding time reasonable.Ensure that the addition of beads does not overfill the tube.
-
14Transfer tubes to the bead beater and shake for ~30 min. at full speed (3,000 rpm). Check for homogeneity under a microscope. Not all worm tissue will be dissolved, but ensure that no large chunks remain (Fig. 2A).Leave worms in bead beater until homogenized. The timing may vary depending on the worm density.
Figure 2.
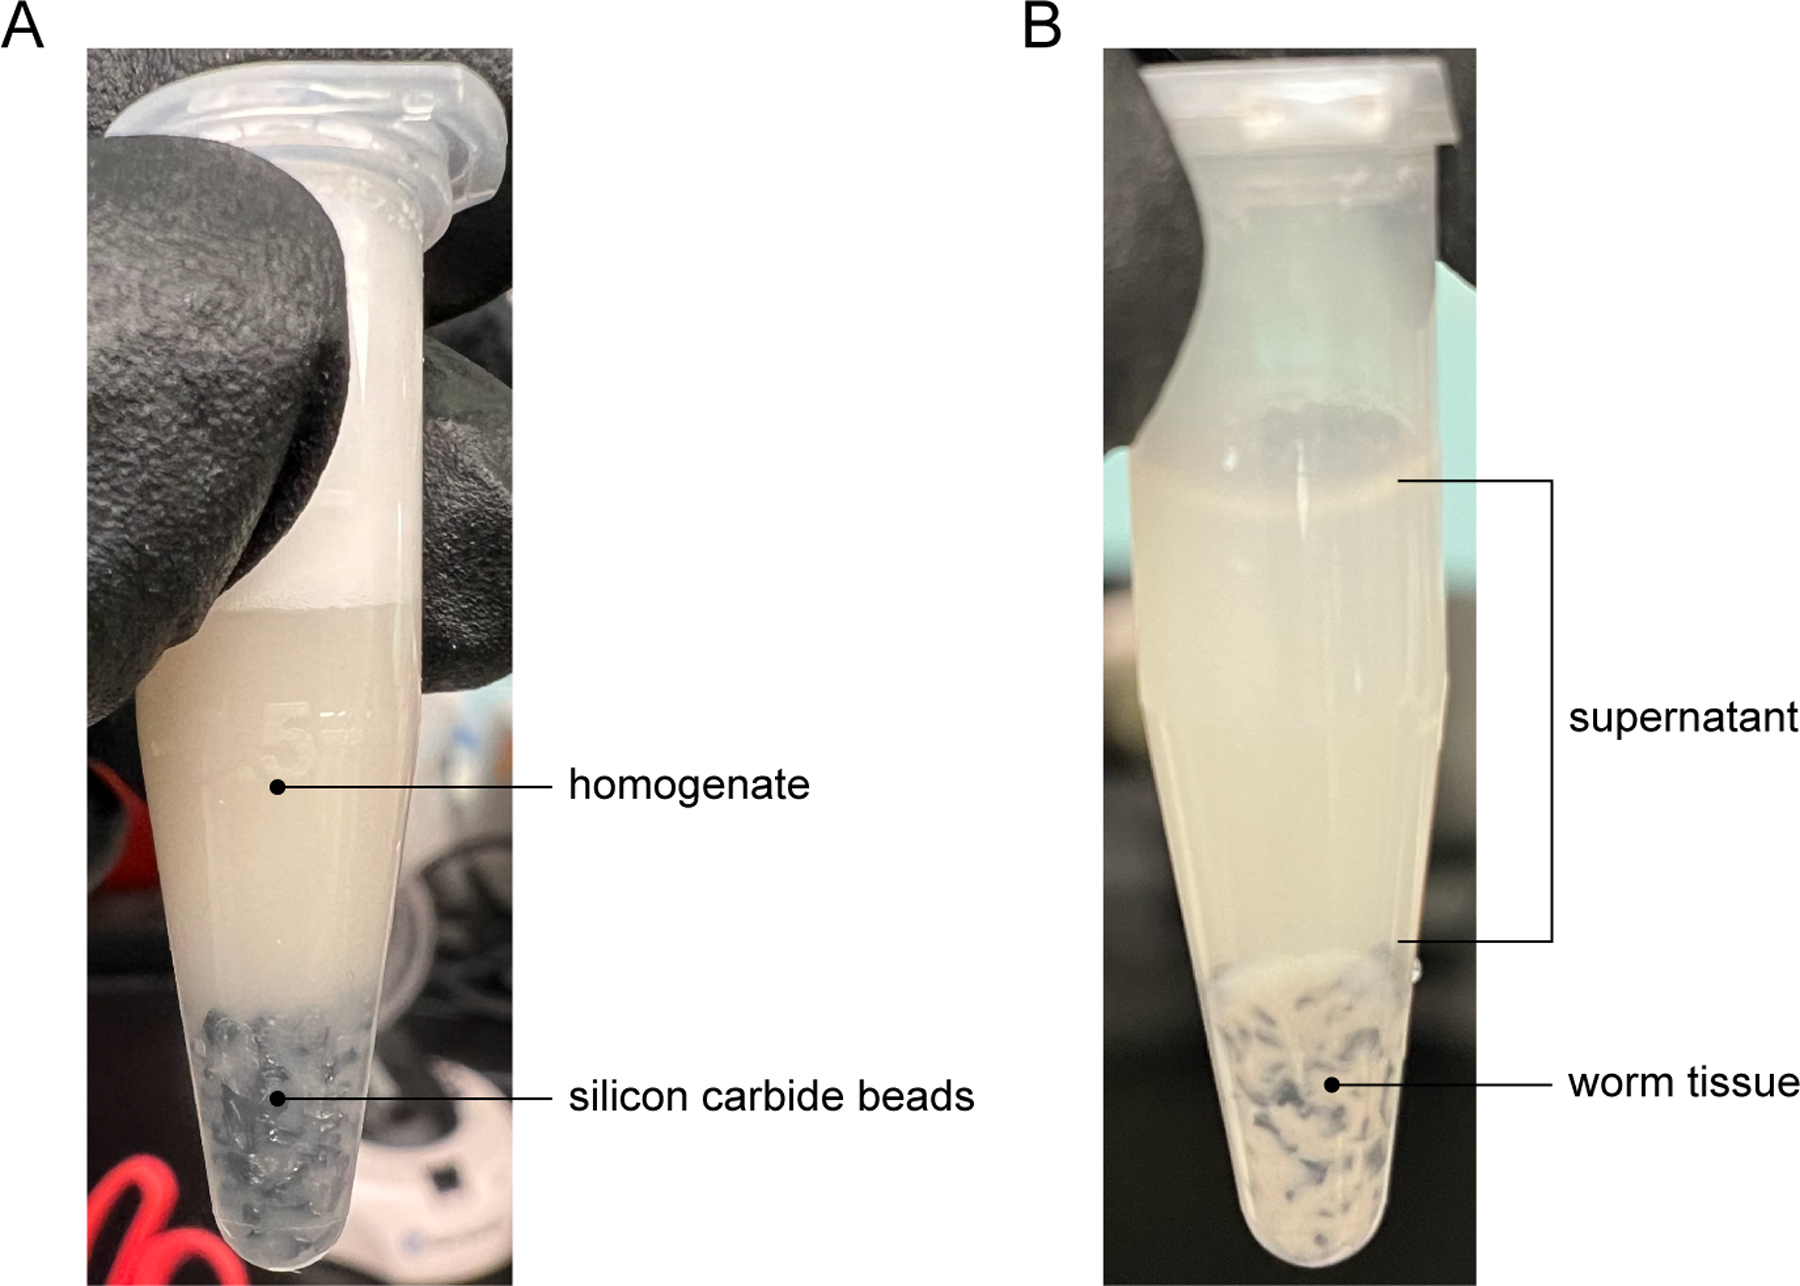
Bead beater homogenization of infected worms. (A) After bead beating, the homogenate should be uniform with no large chunks remaining. Silicon carbide beads will settle at the bottom of the tube. (B) After separating out remaining worm tissue by centrifugation, the supernatant should then be filter-sterilized.
Filter supernatant
-
15
Spin tubes in table-top centrifuge at maximum speed for 2 min.
-
16
Transfer supernatant from 1.5 mL tubes into a 50 mL conical tube (Fig. 2B).
-
17Use a 0.22 µm filter and 10 mL syringe to filter-sterilize 10 mL of the supernatant into a fresh 50 mL conical tube on ice.Be cautious of knocking the conical tube over, as vacuum pressure may make it difficult to push liquid through the filter.
-
18In a sterile environment and on ice, aliquot 100 µL of filtrate into each 1.5 mL tube.The use of a repeater pipette is recommended here.
Flash freeze aliquots
-
19Flash freeze aliquots in liquid nitrogen.Ensure that tubes do not spend more than a few seconds in liquid nitrogen, as lids may pop open.
-
20Once frozen, place tubes into a box labeled with the lot number, date of preparation, and initials. Store at −80ºC. Virus has been shown to remain viable after 8 years of storage at −80ºC (Dave Wang, personal communication).Keep box on dry ice until transferring to −80ºC.
Assess infectivity of virus filtrate
NOTE: Perform infections at the L4 stage and assess infectivity at 24 h post-inoculation (hpi).
Seed 6-well NGM plates with 200 µL 10x E. coli OP50-1 per well. Incubate at room temperature (RT) for 2 days. Store at 4ºC until L1s are ready to be plated.
- Pick 20–40 L4 stage worms onto 10 cm NGM plates seeded with E. coli OP50-1.Worms must be grown without undergoing starvation for at least one generation prior to plating.
Incubate worms at 20ºC for 87–90 h until progeny become gravid adults.
- Bleach gravid adults to release eggs.See Support Protocol 1 for a detailed protocol on bleaching worms.
Incubate eggs at 20ºC with rotation overnight (18–24 h) to yield a synchronized population of L1s.
- Plate 200 L1s in each well of the seeded 6-well NGM plates. Incubate at 20ºC for 40–48 h until worms reach the L4 stage.Set up at least three 6-well plates for each strain.
Set up an infection dosage curve by performing serial 10-fold dilutions of the virus filtrate across seeded 6-well NGM plates. Each well should contain 50 µL of 10x E. coli OP50-1, 3 µL virus filtrate, and 47 µL M9 in a total volume of 100 µL. Set up triplicates for each of the following OVF dilutions: 100, 10−1, 10−2, 10−3, 10−4, and 0.
Add 100 µL of infection mix to each well containing L4 animals.
Incubate at 20ºC for 24 h.
- Using a fluorescence microscope, determine the percentage of animals expressing pals- 5p::GFP across the different virus filtrate dilutions.A recommended working dilution is one that results in ~50% of animals expressing pals-5p::GFP.
- To determine the infectivity of the virus filtrate, proceed to Basic Protocols 3 and 4 to carry out qRT-PCR and fluorescence in situ hybridization (FISH), respectively.For qRT-PCR measurements and FISH staining, perform infections with the dilution of virus filtrate that results in ~50% of animals expressing pals-5p::GFP.
SUPPORT PROTOCOL 1: Synchronize C. elegans development by bleaching
The steps below describe how to synchronize a population of C. elegans animals at the L1 larval stage. In this protocol, gravid adults are exposed to bleach to dissolve the worm cuticle. By limiting the duration of bleach exposure, this technique results in the release of eggs without killing the embryos, as the egg shells provide protection against bleach. Eggs are then allowed to hatch in minimal media overnight to obtain starved L1 animals. Once exposed to food, L1s resume synchronous growth.
Materials
Standard 10 cm NGM plates seeded with E. coli OP50-1
10x concentrated E. coli OP50-1 Sterile M9 buffer
5.65–6% sodium hypochlorite (Fisher Chemical, cat. no. SS290) 5N sodium hydroxide (Fisher Chemical, cat. no. SS256)
Glass Pasteur pipette
15 mL conical tubes
Clinical centrifuge (Thermo Scientific Sorvall ST 8R Centrifuge, cat. no. 75007203)
Nutator (Labquake Shaker Rotisserie, Model 4125110)
Bleach gravid adults
NOTE: Bleach loses potency over time due to oxidation. If the bleach is old, worms may need to be exposed to bleach for a greater duration than recommended below in order to dissolve the cuticle.
- Pick 20–40 L4 stage worms onto standard 10 cm NGM plates seeded with E. coli OP50-1. Supplement plates with 1 mL of 10x E. coli OP50-1.Worms must be grown without undergoing starvation for at least one generation prior to plating.The number of worms plated may vary depending on brood size.
Incubate plates at 20ºC for 87–90 h until the majority of the progeny become gravid adults.
- Wash gravid adults off the plate with 15 mL of M9 and transfer worms into a 15 mL conical tube using a sterile glass Pasteur pipette.Because worms adhere to plastic, using glass pipettes, instead of plastic tips, minimizes the loss of worms during the transfer.
Pellet worms in clinical centrifuge at 1,500 x g for 30 s.
Remove supernatant until there is ~2 mL of liquid remaining in the tube.
- Add 800 µL of 5.65–6% sodium hypochlorite and 200 µL of 5 M NaOH to the worm suspension. Shake or vortex vigorously. Observe worms with a dissecting microscope until they break apart and release eggs.Worms should be lysed but not dissolved.The amount of time required to break worms open may vary depending on several factors (e.g. worm strain, the amount of worms, reagents). A recommended starting point is 90 s.Over-bleaching affects the health of the eggs, and thus the hatched L1s, so proceed to next step once worms have broken apart but undissolved corpses are still present. Experimental results will be impacted if bleaching results in unhealthy L1s.
Add M9 to a volume of 14 mL. Perform this step quickly.
Spin down sample at 1,500 x g for 30 s.
- Remove supernatant by decanting.Ensure that pellet remains intact while pouring out liquid. Inverting the tube once will not disturb the pellet, but the pellet will be resuspended as soon as the tube is righted again. Do not invert the tube at this point.
Repeat Steps 7–9 for a total of 5x washes.
Resuspend eggs in 3–5 mL M9.
- Incubate eggs at 20ºC with rotation overnight (18–24 h) to yield a synchronized population of L1s.Eggs will hatch into starved L1s that are best used the day after bleaching. While it is possible to use L1s on the second day after bleaching, worms will be less healthy, exhibit delays in restoring development and thus will be less synchronized.
After 18–24 h, determine the concentration of L1s in M9 by pipetting 5 µL of the L1 suspension onto a glass slide. Count the number of L1s in the drop. Repeat two more times and calculate the total number of L1s per µL. If the L1 density is too low, concentrate L1s by spinning at 1,500 x g for 30 s. If the density is too high, dilute with M9.
BASIC PROTOCOL 2: Orsay virus infection
Orsay virus infections are performed by feeding C. elegans a mixture of E. coli OP50-1 as a food source, together with virus filtrate, which can be prepared by following Basic Protocol 1. While infections can be performed at any developmental stage, the protocol below describes the steps for performing infections at both L1 and L4 stages (Fig. 1B). Advantages of infecting L1s, compared to infecting animals at later stages, are that worms can be used immediately after hatching and plated simultaneously with food and virus. Thus, L1 infections do not require pre- seeded plates. An advantage of performing L4 infections is the ability to compare the outcome of viral infection with the outcome of infection by other pathogens, especially as bacterial infections are commonly performed at the L4 stage. Additionally, L4 infections are ideal if downstream analysis includes qRT-PCR, as L4s and adults yield greater amounts of RNA than younger animals. Depending on the experimental setup, infections can be performed using various plate formats. Here, we describe protocols for setting up infections on 6-well, 6 cm, and 10 cm plates.
Materials
Unseeded 6-well, 6 cm, or 10 cm NGM plates Standard 10 cm NGM plates seeded with OP50-1 10x concentrated E. coli OP50-1
Orsay virus filtrate (Basic Protocol 1) Sterile M9 buffer
Bleaching solution
20ºC incubator
15 mL conical tubes
Nutator (Labquake Shaker Rotisserie, Model 4125110) Laminar flow hood
Seed NGM plates with OP50-1 (L4 infections only)
NOTE: Seeded plates will be used for performing L4 infections (see ‘Perform infection’ section below).
-
1
Proceed to Step 4 for L1 infections or Step 2 for L4 infections.
-
2If using 6-well or 6 cm plates, add 200 µL of 10x E. coli OP50-1 to plates and incubate at room temperature (RT) for 2 d. If using 10 cm plates, add 500 µL of 10x OP50-1 to plates and incubate at RT for 5 d.Allow plates to dry uncovered in laminar flow hood until all liquid disappears.
-
3After incubation, use plates immediately or store at 4ºC for up to one month.Bring plates to RT prior to plating worms.
Obtain developmentally synchronized populations of worms
-
4Pick 20–40 L4 stage worms onto 10 cm NGM plates seeded with E. coli OP50-1.Worms must be grown without undergoing starvation for at least one generation prior to plating.The number of worms plated may vary depending on brood size.
-
5Incubate worms at 20ºC for 87–90 h until progeny become gravid adults.The incubation time may vary depending on the growth rate of the worm strain.
-
6Bleach gravid adults to release eggs.See Support Protocol 1 for a more detailed protocol on bleaching worms.
-
7
Incubate eggs at 20ºC with rotation overnight (18–24 h) to yield a synchronized population of L1s.
Perform infection
NOTE: Bring 10x E. coli OP50-1 to RT prior to making up master mix. The working dilution for virus filtrate will depend on the preparation described in Basic Protocol 1.
-
8
Proceed to Step 9 for L1 infections or Step 11 for L4 infections.
-
9For L1 infections, make up an infection master mix containing L1 worms, 10x OP50-1, Orsay virus filtrate, and sterile M9. Additionally, make up an uninfected control master mix by replacing Orsay virus filtrate with sterile M9.The viral titer can be adjusted depending on the goal of the experiment.If using 6-well plates, each well should contain 400 L1s, 50 µL 10x OP50-1, 3 µL Orsay virus filtrate, and sterile M9 in a total volume of 100 µL.If using 6 cm plates, each plate should contain 1200 L1s, 150 µL 10x OP50-1, 10 µL Orsay virus filtrate, and sterile M9 in a total volume of 300 µL.If using 10 cm plates, each plate should contain 3600 L1s, 450 µL 10x OP50-1, 30 µL Orsay virus filtrate, and sterile M9 in a total volume of 900 µL.
-
10Add 100 µL per well (6-well plate), 300 µL (6 cm plate), or 900 µL (10 cm plate) of infection mix to each plate and tilt to spread liquid evenly across the surface of the plate. Proceed to Step 15.Spreading out the liquid across the surface of the plate reduces the drying time and provides a more even distribution of viral particles across the plate.
-
11
For L4 infections, plate the following number of worms onto each pre-seeded plate: 200 L1s per well (6-well plates), 700 L1s (6 cm plates), or 2000 L1s (10 cm plates). See Steps 2–3 for seeding plates.
-
12
Incubate plates at 20ºC for 40–48 h until worms reach the L4 stage.
-
13Make up an infection master mix containing 10x OP50-1, Orsay virus filtrate, and sterile M9. Additionally, make up an uninfected control master mix by replacing Orsay virus filtrate with sterile M9.The viral titer can be adjusted depending on the goal of the experiment.If using 6-well plates, each well should contain 50 µL 10x OP50-1, 3 µL Orsay virus filtrate, and sterile M9 in a total volume of 100 µL.If using 6 cm plates, each plate should contain 50 µL 10x OP50-1, 10 µL Orsay virus filtrate, and sterile M9 in a total volume of 300 µL.If using 10 cm plates, each plate should contain 150 µL 10x OP50-1, 30 µL Orsay virus filtrate, and sterile M9 in a total volume of 900 µL.
-
14Add 100 µL per well (6-well plate), 300 µL (6 cm plate), or 900 µL (10 cm plate) of infection mix to each plate and tilt to spread liquid evenly across the surface of the plate.Spreading out the liquid across the surface of the plate reduces the drying time and provides a more even distribution of viral particles across the plate.
-
15Allow plates to dry uncovered in laminar flow hood until all liquid disappears.Drying time can range from 30 m - 1 h. Once liquid is no longer visible, cover plates to prevent over-drying. Aim to keep drying time consistent between experiments.
-
16Incubate plates at 20ºC for 18 h (L1 infections) or 24 h (L4 infections).For L4 infections with N2 animals, the infection rate is generally higher at 24 h post- inoculation (hpi) when compared to the infection rate at 48 hpi or 72 hpi.
-
17
Assess infection outcomes (see Basic Protocols 3–4).
BASIC PROTOCOL 3: Quantification of Orsay virus RNA1/RNA2 transcript levels by qRT-PCR
The outcome of viral infection can be quantified using several different approaches, including qRT-PCR (Fig. 1C) and/or fluorescence in situ hybridization (FISH) (Fig. 1D). Choosing which method(s) to use for analysis depends on the expected magnitude of the effect, although this magnitude may not be known prior to performing the experiment. In Basic Protocol 3, we describe how to measure Orsay virus RNA1 and RNA2 transcript levels with qRT-PCR. Analysis by qRT-PCR is a direct measurement of viral load and provides useful information when large differences are expected between samples.
CAUTION: TRI Reagent is highly toxic. Avoid exposure to the skin and airways.
CAUTION: BCP Phase Separation Reagent is a flammable liquid and is toxic if ingested or inhaled. Use in a well-ventilated area and keep away from open flames.
Materials
10 cm plates containing infected C. elegans (from Basic Protocol 2)
Sterile M9 buffer (Reagents and Solutions)
TRI Reagent (MRC, cat. no. TR118)
BCP Phase Separation Reagent (MRC, cat. no. BP151) Isopropanol (Sigma, cat. no. I9516-500ML)
Ethanol, 200 proof (Volu-Sol, cat. no. VAE-016)
Rnase Free Surface Decontaminant (Apex Bioresearch Products, cat. no. 10–228) HyPure Molecular Biology Grade Water (GE Life Science, cat. no. SH30528.03) iScript cDNA Synthesis Kit (Bio-Rad, cat. no. 1708890)
iQ SYBR Green Supermix (Bio-Rad, cat. no. 1708880) qPCR primers (Table 1)
Table 1.
qRT-PCR primers
| Target | Primer name | Sequence | Source |
|---|---|---|---|
| RNA1 | GW194 | ACCTCACAACTGCCATCTACA | Félix et al., 2011 |
| GW195 | GACGCTTCCAAGATTGGTATTGGT | ||
| RNA2 | GW303 | CCGGCGACAATGTGTACCA | Jiang et al., 2014 |
| GW304 | CCAGCCCTCCGTTGACAA |
Glass Pasteur pipette and bulb
Clinical centrifuge (Thermo Scientific Sorvall ST 8R Centrifuge, cat. no. 75007203)
Sterile 15 mL conical tubes
Filter pipet tips
Sterile 1.5 mL microcentrifuge tubes
0.2 mL PCR tubes
PCR thermocycler
96-well qPCR plate
Microseal ‘B’ PCR plate sealing film (Bio-Rad)
Real-time PCR System
Extract RNA
NOTE: This protocol is optimized for measuring mRNA transcript levels in L4s and adults. 1000 L4 animals yield ~10 µg total RNA. Always use filter pipet tips when working with performing RNA extractions. Keep RNA tubes and reagents separate from other reagents. RNA is most vulnerable once it has been extracted from cells.
-
1
Add 15 mL M9 to a 10 cm plate containing infected worms (from Basic Protocol 2).
-
2Use a glass Pasteur pipette to transfer worms to a 15 mL conical tube.Because worms adhere to plastic, using glass pipettes, instead of plastic tips, minimizes the loss of worms during the transfer.
-
3
Pellet worms at 1,500 x g for 30 s and aspirate supernatant to 100 µL.
-
4Add 15 mL M9, pellet worms at 1,500 x g for 30 s, and aspirate supernatant to 100 µL.If supernatant is still cloudy, perform an additional wash.
-
5
Wipe down work area, reagents, and equipment with RNase Free Surface Decontaminant.
-
6Using filter pipet tips, add 1 mL TRI Reagent to 100 µL of packed worms and homogenize by slowly pipetting up and down 10 times. Transfer mixture to a 1.5 mL microcentrifuge tube.We do not recommend vortexing samples, as this may lead to nuclear DNA contamination.
-
7Store homogenate at room temperature for 10–30 min.Optional: Sample can be frozen at this point and remaining steps can be continued at a later time.
-
8
Add 100 µL of BCP to each sample, press down against the lid of the tube to prevent leaking, and shake vigorously for 15 s.
-
9
Store mixture at room temperature for 2–15 min.
-
10
Spin at 12,000 x g for 15 min. at 4ºC.
-
11Transfer the aqueous phase (clear layer) to a new tube without disturbing the interphase (cloudy layer), which contains genomic DNA.Avoid DNA contamination by leaving ~20% of aqueous phase behind. Spin tubes again if necessary.
-
12
Add 500 µL isopropanol, mix by inverting tubes, and store at room temperature for 5–10 min. to precipitate the RNA.
-
13
Spin at 12,000 x g for 15 min. at 4ºC. Remove the supernatant by pipetting.
-
14Add 1 mL of 75% ethanol to wash the RNA pellet.The pellet should appear whiter and larger after adding ethanol.
-
15
Centrifuge at 7,500 x g for 5 min. at 4ºC.
-
16
Remove the ethanol first with a large-bore pipet tip (i.e. 1000 µL). Spin tubes in a centrifuge and remove any remaining ethanol with a smaller pipet tip (i.e. 200 µL or 10 µL), making sure not to disturb the pellet. A white pellet should be visible if RNA yield is >10 µg.
-
17Leave tubes uncovered and monitor until the pellet becomes translucent, which indicates that all ethanol has evaporated.White indicates the presence of ethanol. Do not allow pellet to over-dry, as this makes it difficult to re-solubilize.
-
18As soon as the pellet becomes translucent, resuspend in 20–30 µL nuclease-free water (HyPure Molecular Biology Grade Water) and incubate at RT for 10 m to dissolve pellet. Store RNA samples at −80ºC.The incubation step can be performed at a higher temperature (i.e. ~50ºC) to promote re-solubilization of the RNA pellet.Storing the RNA samples at −80ºC for at least 1 h reduces the variability when measuring the concentration using a Nanodrop.
Synthesize cDNA
NOTE: cDNA synthesis is performed with the iScript cDNA Synthesis Kit.
-
19
Measure the concentration of RNA on a Nanodrop.
-
20Make up a master mix containing iScript reverse transcriptase, 1X iScript buffer, and nuclease-free water.Each cDNA synthesis reaction should contain 0.5 µL iScript reverse transcriptase, 2 µL 5X iScript buffer, and 2.5 µL nuclease-free water.
-
21
In a 0.2 mL PCR tube, add 5 µL iScript master mix, 500 ng RNA, and nuclease-free water to a total volume of 10 µL.
-
22
Run the reaction protocol on a thermocycler following the kit instructions.
Run qRT-PCR
-
23Make up a master mix containing iQ SYBR Supermix and primers targeting Orsay virus RNA1 and/or RNA2 (Table 1). Make up an additional master mix using primers targeting the housekeeping gene. Include a minimum of duplicate reactions per sample.Each reaction should contain 5 µL iQ SYBR Green Supermix, 1 µL forward primer, 1 µL reverse primer, and 3 µL cDNA. It is recommended to use a 1:100 dilution of cDNA from Step 10.It is recommended to use snb-1 as the housekeeping gene.
-
24
In a 96-well qPCR plate, pipet 10 µL of reaction mix into each well. Seal plate with film.
-
25
Run the reaction protocol on a real-time PCR system.
BASIC PROTOCOL 4: Quantification of infection rate and FISH fluorescence intensity
This protocol will describe how to measure the percentage of infected worms within a population by FISH staining (Part 1) and how to quantify FISH fluorescence intensity as a proxy for pathogen load (Part 2). By assessing individuals within a population, FISH analyses are better able to distinguish small differences in viral resistance. Analysis by qRT-PCR analysis can lack sensitivity in discriminating modest differences, as qRT-PCR measures the viral load of an entire sample without accounting for individual heterogeneity within the sample. For example, several heavily infected worms within a population can skew the viral load measurement, thus obscuring the effects of uninfected worms, which is more clearly detected by FISH.
CAUTION: Paraformaldehyde is a carcinogenic substance that becomes toxic when exposed to the skin and airways. Any steps involving paraformaldehyde should be performed in a fume hood or well-ventilated area.
Materials
C. elegans strains
16% paraformaldehyde (Electron Microscopy Sciences, cat. no. 15710)
Orsay virus RNA1 and RNA2 FISH probes (Biosearch Technologies) (Table 2) FISH hybridization and wash buffers (Reagents and Solutions)
Table 2.
FISH probes
| Target gene | Fluorophore | Sequence | Source |
|---|---|---|---|
| RNA1 | Cal Fluor Red 610 (CF610) | GACATATGTGATGCCGAGAC | Biosearch Technologies |
| Quasar 670 (Q670) | |||
| RNA2 | Cal Fluor Red 610 (CF610) | GTAGTGTCATTGTAGGCAGC | |
| Quasar 670 (Q670) |
Agarose
(Optional) VECTASHIELD Antifade Mounting Medium (Vector Laboratories, cat. no. H-1000-10)
Glass microscope slides 22mm x 22mm cover slip Fluorescence microscope
Fiji (see Internet Resources)
Hybridize FISH probes
-
1Perform FISH staining following the protocol detailed in Rivera et al., 2022. Use probes targeting Orsay virus RNA1 and RNA2 genomic segments (Table 2).We recommend fixing samples in 4% paraformaldehyde (PFA) for 15 min; longer fixation times may quench the fluorescence of proteins like GFP.To increase FISH signal, perform staining with both RNA1 and RNA2 probes, or use multiple probes (also known as “single-molecule FISH probes”). A recommended final concentration for each probe is 10 ng/µL.
-
2
Proceed to Part 1 to measure the infection rate and Part 2 to quantify FISH fluorescence intensity.
Part 1: Quantification of the percentage of worms with any evidence of infection by FISH staining
-
3Add ~5 µL of sample onto a glass microscope slide and place a 22 mm x 22 mm cover slip on topOptional: Add 1–2 µL Vectashield antifade mounting medium to worms.
-
4Under a fluorescence microscope, manually score animals and record the percentage of animals that show positive FISH staining. As a control for positive staining, it is recommended to include a condition in which highly susceptible animals, such as rde-1 mutants, are infected with virus. As a negative control, FISH staining should also be performed on uninfected animals.We recommend scoring a minimum of 100 animals to ensure an accurate representation of the population.
Part 2: Quantification of FISH fluorescence intensity
-
5
Make a 5% agarose pad on a glass microscope slide. Dissolve agarose in water to make a 5% agarose solution. Using a glass Pasteur pipette, add a drop of the agarose solution to a glass microscope slide. Immediately place another glass slide on top of the drop to create a circular pad. Once the agarose has dried, carefully separate both slides while leaving the agarose intact on one of the slides.
-
6Add ~5 µL of sample onto the agarose pad and place a 22 mm x 22 mm cover slip on top of the sample.Ensure that worms do not overlap with one another.Optional: Add 1–2 µL of Vectashield antifade mounting medium directly to sample on the agarose pad prior to placing the coverslip over sample.Worms can also be imaged in 96-well plates using an automated imaging platform (i.e. ImageXpress Nano Automated Imaging System, Molecular Devices) (Nyaanga et al., 2021).
-
7
Acquire images on a fluorescence microscope.
-
8
Using Fiji software, quantify background-corrected mean fluorescence intensity (MFI) by following Steps 9–17.
-
9
Open images for all channels by dragging and dropping image files into Fiji.
-
10
Merge transmitted light (TL) and fluorescent channels by selecting “Image” > “Color” > “Merge Channels…”.
-
11
To set measurement parameters, select “Analyze” > “Set Measurements…”.
-
12
Select “Mean gray value” > “OK”.
-
13
Within the image stack, switch over to the fluorescence channel corresponding to the fluorescent probe used for FISH staining.
-
14Use the polygon selection tool to trace around the border of the worm.Only trace worms that are fully visible and remained motionless during imaging. Do not trace overlapping worms or those that touch the border of the well.
-
15
Select “Analyze” > “Measure” to record the mean gray value, or mean fluorescence intensity (MFI), of the worm.
-
16
To measure background fluorescence, left click and drag the polygon shape to an empty space in the well next to the worm. Select “Analyze” > “Measure”.
-
17
Calculate background-corrected fluorescence by subtracting the background fluorescence from the worm fluorescence: MFIcorrected = MFIworm – MFIbackground
BASIC PROTOCOL 5: Immunofluorescent labeling of dsRNA in virus-infected intestinal tissue
Performing immunohistochemistry in adult C. elegans intestinal cells is not straightforward due to challenges in efficiently delivering antibody across the worm cuticle and into cells, in addition to the high levels of autofluorescence in adult intestinal cells. Here, we describe how to dissect out the intestine in order to provide increased antibody permeability and perform immunofluorescence in the intestinal tissue of adult C. elegans using the J2 antibody, which targets dsRNA. In addition, we describe how to combine dsRNA immunofluorescence with FISH staining to enable visualization of dsRNA in virus-infected cells (Fig. 1E).
CAUTION: Paraformaldehyde is a carcinogenic substance that becomes toxic when exposed to the skin and airways. Any steps involving paraformaldehyde should be performed in a fume hood or well-ventilated area.
CAUTION: The blocking solution used in this protocol contains sodium azide, which is a hazardous compound that forms a toxic gas when mixed with water or acid. Work in a fume hood when handling sodium azide.
Materials
C. elegans strains Sterile M9 buffer
100 µM levamisole (MP Biomedicals, cat. no. 155228)
16% paraformaldehyde (Electron Microscopy Sciences, cat. no. 15710) 10x PBS
Tween 20 (Thermo Scientific, cat. no. AC233362500) Blocking solution (Reagents and Solutions)
Mouse anti-dsRNA antibody clone rJ2 (Sigma, cat. no. #MABE1134-25UL)
Goat anti-mouse IgG(H+L) Cross-Adsorbed Secondary Antibody, Alexa Fluor 488 (Invitrogen, #A-11001)
Agarose (Sigma-Aldrich, cat no. A9539)
15 mL conical tube
Table-top centrifuge
25 gauge needle
1.5 mL microcentrifuge tubes
Glass Pasteur pipette
Glass microscope slide
22 mm x 22 mm cover slip
Fluorescence microscope
Infect worms with virus
NOTE: This protocol is optimized for staining intestines from adult animals.
-
1Perform infections at the L4 stage for 24 h following steps outlined in Basic Protocol 2.Infect 2,000 worms on a 10 cm plate.
Dissect out intestines
-
2
For each treatment condition, wash worms off of plates with 15 mL M9 and transfer to a 15 mL conical tube.
-
3
Pellet worms at 2,000 x g for 1 min. and then aspirate supernatant.
-
4
Wash samples by adding 15 mL M9 to each tube. Pellet worms and aspirate supernatant. Repeat wash if supernatant is cloudy.
-
5Pipet 50 µL worms and 5 µL 100µM levamisole onto a microscope slide.Pipet directly from worm pellet.
-
6
Dissect out 100–200 intestines using a 25 gauge needle (Fig. 3). Holding the needle at an angle, use the sharp edge to cut off the head and/or tail of each worm. The internal pressure of the worm will cause the intestine and gonad to ooze out.
-
7Transfer dissected intestines to 1.5 mL microcentrifuge tubes using a glass Pasteur pipette.If necessary, add 50 µL M9 to the glass slide to collect any remaining intestines and transfer the liquid to the 1.5 mL tube using a glass pipette.
-
8
Spin down tubes at 2,000 x g for 1 min. and carefully aspirate supernatant without disturbing dissected intestines. Resuspend in a total volume of 100 µL M9.
Figure 3.
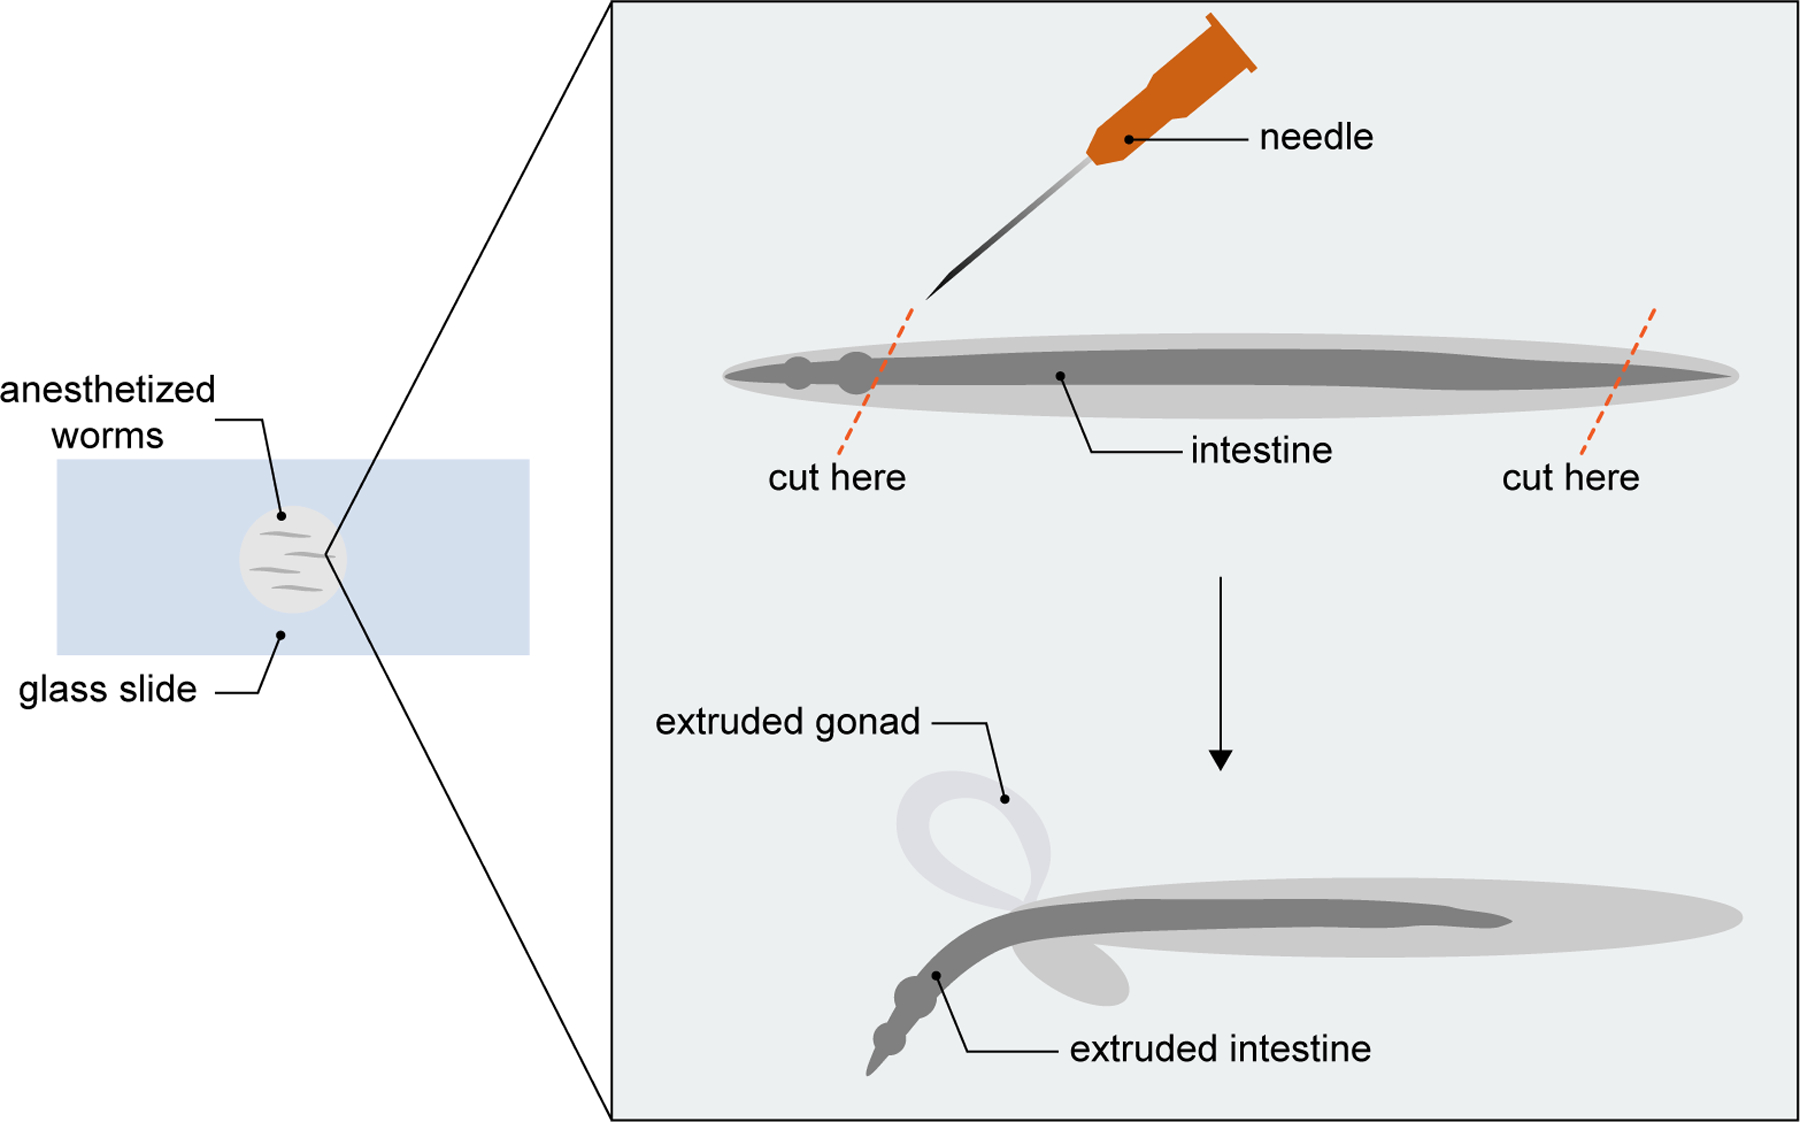
Schematic of C. elegans intestinal dissection. Add worms to a glass slide and anesthetize with levamisole. Position the needle at an angle and cut at either or both of the indicated cut sites (orange dashed lines) by touching the worm with the sharp edge of the needle. A single touch should be sufficient to cause extrusion of the intestine (and gonad).
Fix samples and stain with FISH probes
-
9
Add 33 µL of 16% PFA to 100 µL of sample to achieve a final concentration of 4% PFA. Incubate at RT for 15 min.
-
10Wash samples twice with 1x PBS + 0.1% Tween 20. For each wash, add 1 mL 1x PBS + 0.1% Tween 20, pellet worms, and aspirate the supernatant.Make up 1x PBS by diluting 10x PBS stock solution in water and adding 0.1% v/v Tween 20.
-
11Perform FISH staining as described in Rivera et al., 2022.Incubate with FISH probe at 47ºC for 6–8 h or overnight.
Add primary and secondary antibodies
-
12
Add 200 µL blocking solution to each sample and incubate overnight at 4ºC.
-
13Spin down tubes and aspirate supernatant.Remove supernatant down to ~100 µL.
-
14Add mouse anti-dsRNA J2 antibody and incubate at RT for 1–2 h.The amount of antibody may need to be adjusted, but a recommended starting point is a 1:400 dilution of J2 antibody in blocking solution.
-
15
Wash samples 4x with 1x PBS + 0.1% Tween 20. For each wash, add 200 µL 1x PBS + 0.1% Tween 20, spin down tubes, and remove supernatant down to ~100 µL.
-
16Add 4–10 µg/mL goat anti-mouse IgG(H+L) Alexa Fluor 488 secondary antibody and incubate in the dark at RT for 1–2 h.It is possible to add anywhere from 4–10 µg/mL secondary antibody depending on the outcome of staining. A recommended starting concentration is 10 µg/mL of secondary antibody diluted in blocking solution.
-
17
Wash samples 5x with 200 µL 1x PBS + 0.1% Tween 20.
-
18
Add 100 µL 1x PBS + 0.1% Tween 20 and store samples at 4ºC.
Acquire confocal images
-
19
Make a 5% agarose pad on a glass microscope slides. Dissolve agarose in water to make a 5% agarose solution. Using a glass Pasteur pipette, add a drop of the agarose solution to a glass microscope slide. Immediately place another glass slide on top of the drop to create a circular pad. Once the agarose has dried, carefully separate both slides while leaving the agarose intact on one of the slides.
-
20
Pipet ~5 µL of sample onto the agarose pad and place a cover slip on top of the sample.
-
21
Acquire images on a confocal microscope.
REAGENTS AND SOLUTIONS
M9 Buffer
5.8 g Na2HPO4
3.0 g KH2PO4
0.5 g NaCl
1.0 g NH4Cl
1 L ddH2O
Autoclave sterilize and store at room temperature
This recipe makes 1 L of buffer.
Blocking solution
1x PBS (100 mL)
0.5% Tween 20 (0.5 mL)
5% BSA (5 g)
0.05% NaN3 (0.05 g)
Filter sterilize and store at 4ºC
FISH hybridization buffer
180 µL 5 M NaCl
20 µL 1 M Tris (pH 7.5)
800 µL ddH2O
2 µL 10% SDS
Buffer should be made up fresh for each experiment, otherwise precipitation will occur.
This recipe makes 1 mL of buffer, and 200 µL buffer is needed per sample. Scale up accordingly.
FISH wash buffer
180 µL 5 M NaCl
20 µL 1 M Tris (pH 7.5)
10 µL 0.5 M EDTA
790 µL ddH2O
2 µL 10% SDS
Buffer should be made up fresh for each experiment, otherwise precipitation will occur.
This recipe makes 1 mL of buffer, and 200 µL buffer is needed per sample. Scale up accordingly.
COMMENTARY
Background Information
In non-mammalian hosts, the study of anti-viral defense has led to landmark discoveries, including CRISPR and RNA interference (RNAi). Until the discovery of the Orsay virus in 2011 (Félix et al., 2011), the absence of a known viral pathogen capable of infecting and undergoing its entire life cycle inside C. elegans presented a limitation to the use of C. elegans as a model organism for studying host-virus interactions. In early work, studies of anti-viral defense were carried out using genetic (Lu et al., 2005), ex vivo (Schott et al., 2005; Wilkins et al., 2005), or artificial approaches (Liu et al., 2006) to model viral infection in C. elegans. The isolation of the Orsay virus and the development of standardized protocols, including those presented above, expands the potential of C. elegans as an experimental system for studying host-virus interactions.
In addition to advancing what is known about anti-viral RNAi, which has been extensively studied, the investigation of Orsay virus infection within the last decade has revealed additional genes and pathways that participate in C. elegans anti-viral defense. For example, mutagenesis and RNAi screens have uncovered host factors (sid-3, viro-2, nck-1, and hipr-1) that regulate the outcome of viral infection at early, prereplication life stages of the virus (Jiang et al., 2017, 2020). Follow- up studies have demonstrated that these proteins share conserved function with their mammalian homologs (Jiang et al., 2019, 2020). Recent studies have also implicated a role for structural proteins (i.e. actin, collagen) and the endoplasmic reticulum in mediating anti-viral defense (Zhou et al., 2024; Efstathiou et al., 2022). Curiously, several of the collagen components identified as anti-viral factors in C. elegans are homologs of human proteins involved in innate immune responses (Zhou et al., 2024). These findings lend support to the potential of the C. elegans-virus model for discovering novel anti-viral factors that are conserved in mammals. Future work can clarify the functional role of these proteins in C. elegans anti-viral defense.
The study of viral infection in C. elegans has facilitated the discovery of novel host immune responses, such as the Intracellular Pathogen Response (IPR), which is induced by infection with intracellular pathogens, including the Orsay virus. While the IPR is distinct from the well-studied anti-viral RNAi response, the regulation of both the IPR and RNAi during infection involves DRH- 1, a mammalian RIG-I-like receptor (RLR) homolog. In mammals, RLRs function as cytosolic RNA sensors that detect viral infection and promote signaling to induce type I interferons. RLR- mediated regulation is one of several similarities shared by the type I interferon response and the IPR (Lažetić et al., 2023). However, downstream components of the canonical RLR pathway are absent in C. elegans, presenting an opportunity for the discovery of non-canonical signaling factors that regulate transcriptional responses to viral infection. Taken together, these findings highlight exciting avenues for further exploration into the evolution of host immune responses and the fundamental principles of anti-viral immunity.
The techniques presented above offer several advantages for investigating anti-viral immunity. One of the central advantages includes the use of microscopy-based tools to visualize viral infection in the context of an entire organism. Furthermore, the rapid life cycle of C. elegans, along with the rapid spread of Orsay virus infection, enables experiments to be performed on a relatively short timescale. Further streamlining infection workflows, Orsay virus filtrate can be generated and stored in large batches, and infection can be easily achieved through feeding. Despite the strengths of this model system, we acknowledge that there are limitations to the protocols described in this article. Namely, the inability to label Orsay virus with a genetically encoded fluorescent tag remains a major obstacle in understanding viral dynamics, which is challenging to assess by FISH due to the need for sample fixation. Another limitation is the lack of a tissue culture system that supports amplification and characterization of the Orsay virus.
While immunofluorescence methods for C. elegans have been previously described, our workflow (Basic Protocol 5) enables simultaneous staining of dsRNA and viral RNA in the intestine of adult worms. Earlier work pioneered the use of immunofluorescence to target viral proteins in the tissue of intact animals (Franz et al., 2014). This study was the first to report the localization of viral proteins in a natural C. elegans infection model. Findings from this study defined the tissue tropism of the Orsay virus as well as the subcellular localization of viral proteins within an intact animal. Viral proteins were visualized in larvae, as the authors noted that performing immunofluorescence on adult animals was challenging due to considerable levels of non-specific staining. Here, we optimize an immunofluorescence assay for staining dsRNA in adult intestinal cells with high specificity, in combination with FISH staining for viral RNA. A limitation of Basic Protocol 5 is the need to dissect intestines for performing immunofluorescence, which increases the duration of the protocol and can introduce unintended effects caused by manipulation of the tissue. While it can be labor-intensive, dissection increases the efficiency of antibody uptake into intestinal cells, allowing for more robust staining. Applications of the immunofluorescence workflow described in Basic Protocol 5 are not limited to dsRNA staining, as this workflow can be adapted for use with an antibody against any desired target.
Critical parameters
For Orsay virus infections, several experimental parameters might influence the infection outcome, including lot-to-lot variation of virus filtrate preparations, handling of virus filtrate, feeding rate, bacterial food source, and overbleaching embryos. Prior to setting up an experiment, the optimal dose of virus filtrate should be empirically determined. Experiments should be performed using the same lot of virus filtrate. Of note, virus filtrate loses infectivity with each freeze-thaw cycle. To maintain infectivity of Orsay virus filtrate preparations, the filtrate should be divided into small aliquots for a single use (Basic Protocol 1). Discard the aliquot once it has been thawed. As Orsay virus infection is established through feeding, any changes to the feeding rate of the C. elegans strain or treatment group may impact the rate of inoculation. Similarly, changes to bacterial food sources, which can influence the feeding rate, can also affect the infection rate. Other factors that can influence the outcome of infection are overbleaching gravid adults and/or incomplete removal of the bleaching solution once eggs are released. Prolonged exposure to bleach can result in the death of the released embryos. Similarly, residual bleach left overnight can kill hatched larvae or cause asynchronous development, introducing variability to infection assays.
Troubleshooting
The tables below list potential solutions for problems that may occur when performing RNA extraction (Table 3), FISH staining (Table 4), and dsRNA immunofluorescence (Table 5).
Table 3.
Troubleshooting Guide for RNA Extraction
| Problem | Possible Cause | Solution |
|---|---|---|
| Low RNA yield | Insufficient starting sample | Collect RNA from at least 1,000 L4s or adults per sample for optimal yields. Adults yield more RNA compared to L4s |
| Incomplete resolubilization of RNA pellet | After obtaining RNA pellet, perform 10 m incubation at a higher temperature (i.e. ~50ºC) and store at −80ºC overnight to promote resolubilization |
Table 4.
Troubleshooting Guide for FISH Staining
| Problem | Possible Cause | Solution |
|---|---|---|
| High background fluorescence | Insufficient removal of FISH probe | Increase duration and/or number of washes following hybridization step (e.g. wash 3x with 500 µL wash buffer) |
Table 5.
Troubleshooting Guide for Visualization of dsRNA by Immunofluorescence
| Problem | Possible Cause | Solution |
|---|---|---|
| Little to no sample remaining at the end of protocol | Loss of sample during wash steps | Increase centrifugation time, ensure pellet is visible after each wash |
| Increase sample size (i.e. number of dissected intestines) | ||
| High background fluorescence | Antibody concentrations too high | Set up antibody titration to determine concentration that yields optimal signal- to-noise ratio |
| Antibody incubation time too long | Decrease incubation time (i.e. 1 h at RT) | |
| Insufficient blocking | Make up fresh blocking buffer | |
| Insufficient removal of unbound secondary antibody | Increase number of washes following secondary antibody incubation |
Understanding results
For each virus filtrate preparation (Basic Protocol 1), a dose-response curve should be performed to determine the optimal dose of virus filtrate for downstream experiments (Fig. 4A). The magnitude of the immune response, as measured by pals-5p::GFP, is dependent on the starting concentration of virus. An optimal dynamic range for infection assays (Basic Protocol 2) can be achieved by determining a working dilution of virus filtrate that results in ~50% pals-5p::GFP activation in a wild-type population. For example, a dilution of 0.1 results in ~50% wild-type pals- 5p::GFP induction in the virus filtration preparation shown in Fig. 4A. At this dilution, the sensitivity of the assay is sufficient to detect differences between the percentage of pals-5p::GFP+ animals when comparing wild-type (jyIs8) and susceptible (rde-1; jyIs8) mutants. When animals are treated with a higher concentration of virus, the difference in pals-5p::GFP activation between wild-type and susceptible animals is no longer detected (Fig. 4A).
Figure 4.
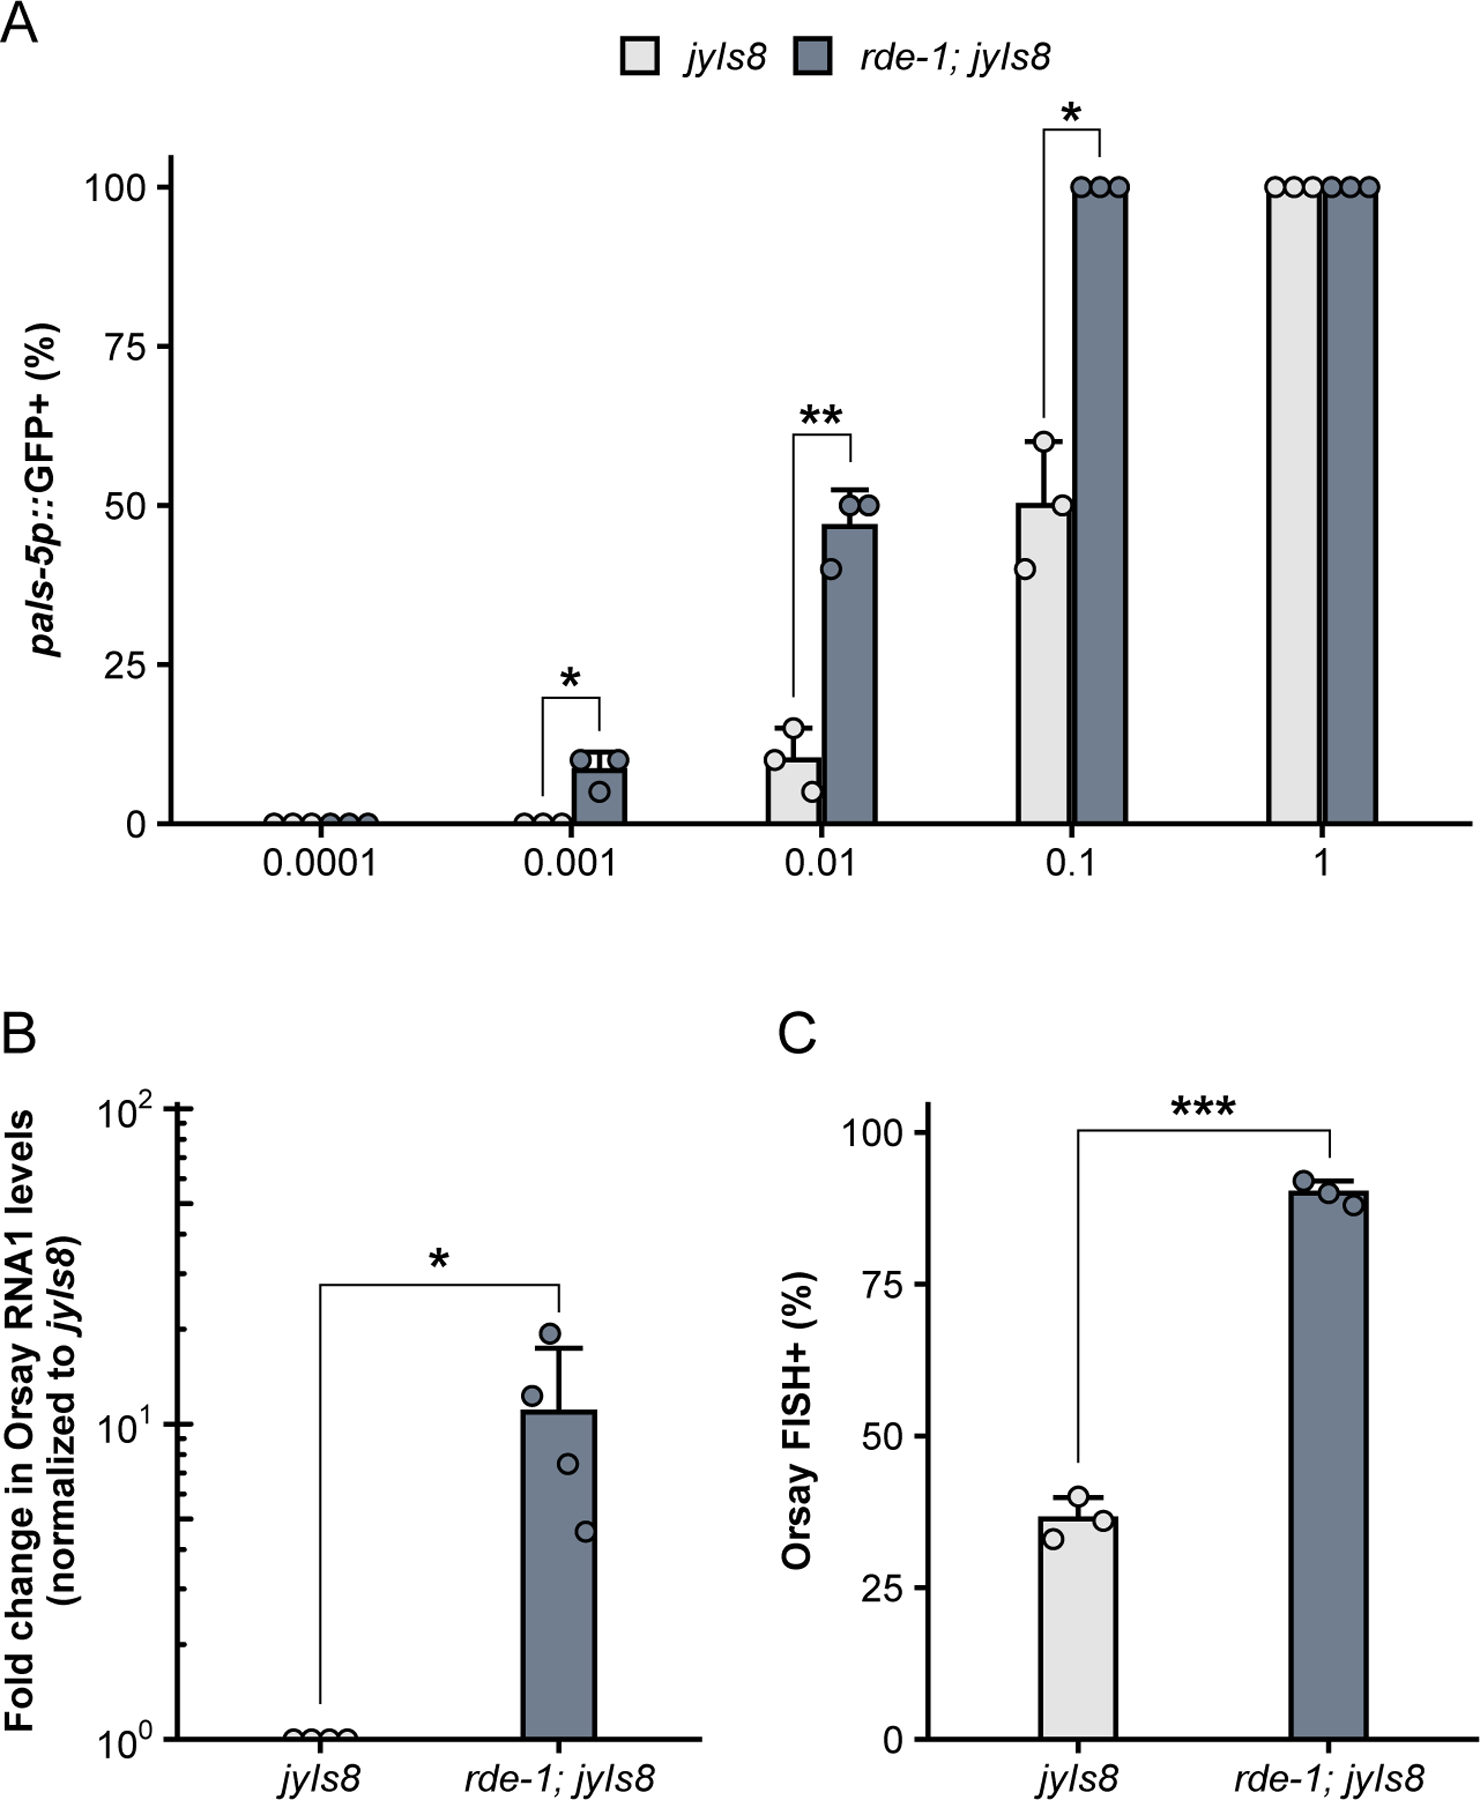
Assessing outcomes of viral infection. (A) Percentage of animals expressing pals- 5p::GFP following inoculation with different dilutions of virus filtrate. A two-tailed t-test was used to calculate p-values; *p<0.05, **p<0.01. (B) qRT-PCR analysis of viral load in rde-1; jyIs8 and jyIs8 animals at 24 hpi. Animals were infected at the L4 stage. rde-1 mutants exhibit increased viral RNA1 transcript levels compared to rde-1 wild-type animals. Fold change in gene expression was determined relative to jyIs8. A one-tailed t-test was used to calculate p-values; *p<0.05. (C) Percentage of animals that show Orsay FISH staining at 18 hpi following L1 infection. The percentage of infected animals is significantly increased in rde-1 mutants compared to rde-1 wild- type animals. A two-tailed t-test was used to determine statistical significance; ***p<0.001. For all plots, each dot represents an experimental replicate; three to four independent experimental replicates were performed. Bars represent the mean across experimental replicates; error bars indicate standard deviation.
Differences in viral load and infection rate can be quantified by qRT-PCR (Basic Protocol 3) and FISH staining (Basic Protocol 4). Consistent with increased pals-5p::GFP activation, the level of Orsay virus RNA1 transcripts is elevated in rde-1 mutants compared to wild-type animals (Fig. 4B). Furthermore, the percentage of animals exhibiting Orsay FISH staining is also significantly increased in rde-1 mutants relative to wild-type animals (Fig. 4C). In addition to measuring infection rate within a population, FISH fluorescence can also be used as a readout for infection levels within individual animals. Previous work has demonstrated that pals-22 mutants exhibit a significant decrease in the infection rate, or percentage of FISH+ animals, relative to wild-type animals (Fig. 5A) (Reddy et al., 2019). Here, we demonstrate how mean FISH fluorescence can also be used to quantify the increased resistance in pals-22 mutants (Fig. 5B) and provide a distribution of fluorescence levels within a population.
Figure 5.
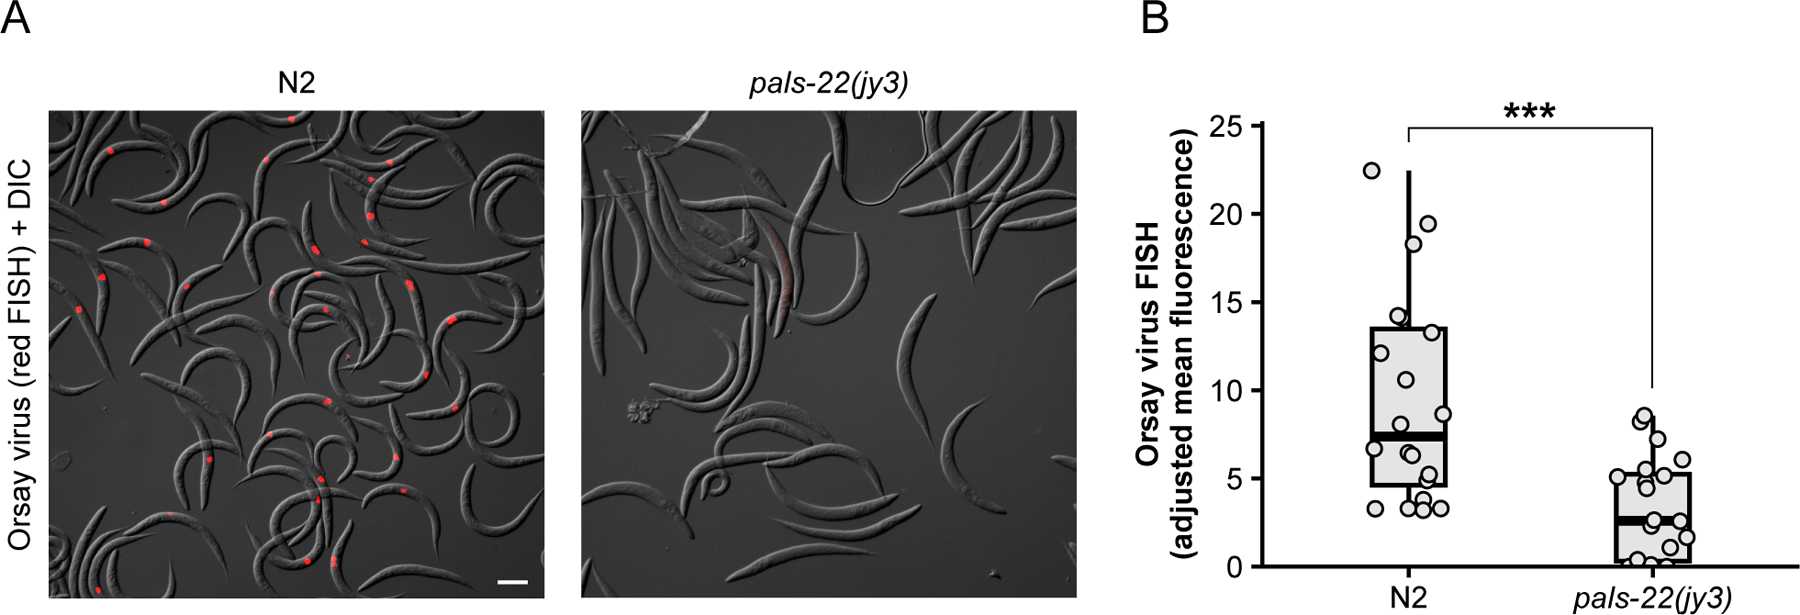
Quantification of fluorescence by FISH staining. (A) Representative images of WT and pals-22(jy3) animals stained with CF610-conjugated Orsay FISH probes (red) targeting the RNA1 and RNA2 viral genomic segments. Animals were infected at the L1 stage, and images were taken at 18 hpi. Scale bar = 100 µm. (B) Quantification of background-corrected mean fluorescence in (A). Each dot represents an individual animal; 20 animals were analyzed for each strain. Horizontal lines in box-and-whisker plots represent median values, and the box reflects the 25th to 75th percentiles. A Mann-Whitney U test was used to determine statistical significance; ***p<0.001.
In combination with FISH, immunohistochemistry enables the visualization of both viral RNA and dsRNA at subcellular resolution (Basic Protocol 5). Infected intestinal tissue exhibit bright dsRNA puncta, which are not present in uninfected intestinal cells (Fig. 6) (Batachari et al., 2024). Distributed throughout the cytosol, dsRNA foci are ubiquitous and form ring-like structures. In infected animals, dsRNA is predominantly observed in viral FISH+ cells, whereas neighboring FISH- cells exhibit minimal or no dsRNA fluorescence (Fig. 6), supporting a model in which dsRNA is a product of viral replication. Collectively, Basic Protocols 3–5 provide both quantitative and spatial approaches to assessing the outcome of Orsay virus infection.
Figure 6.
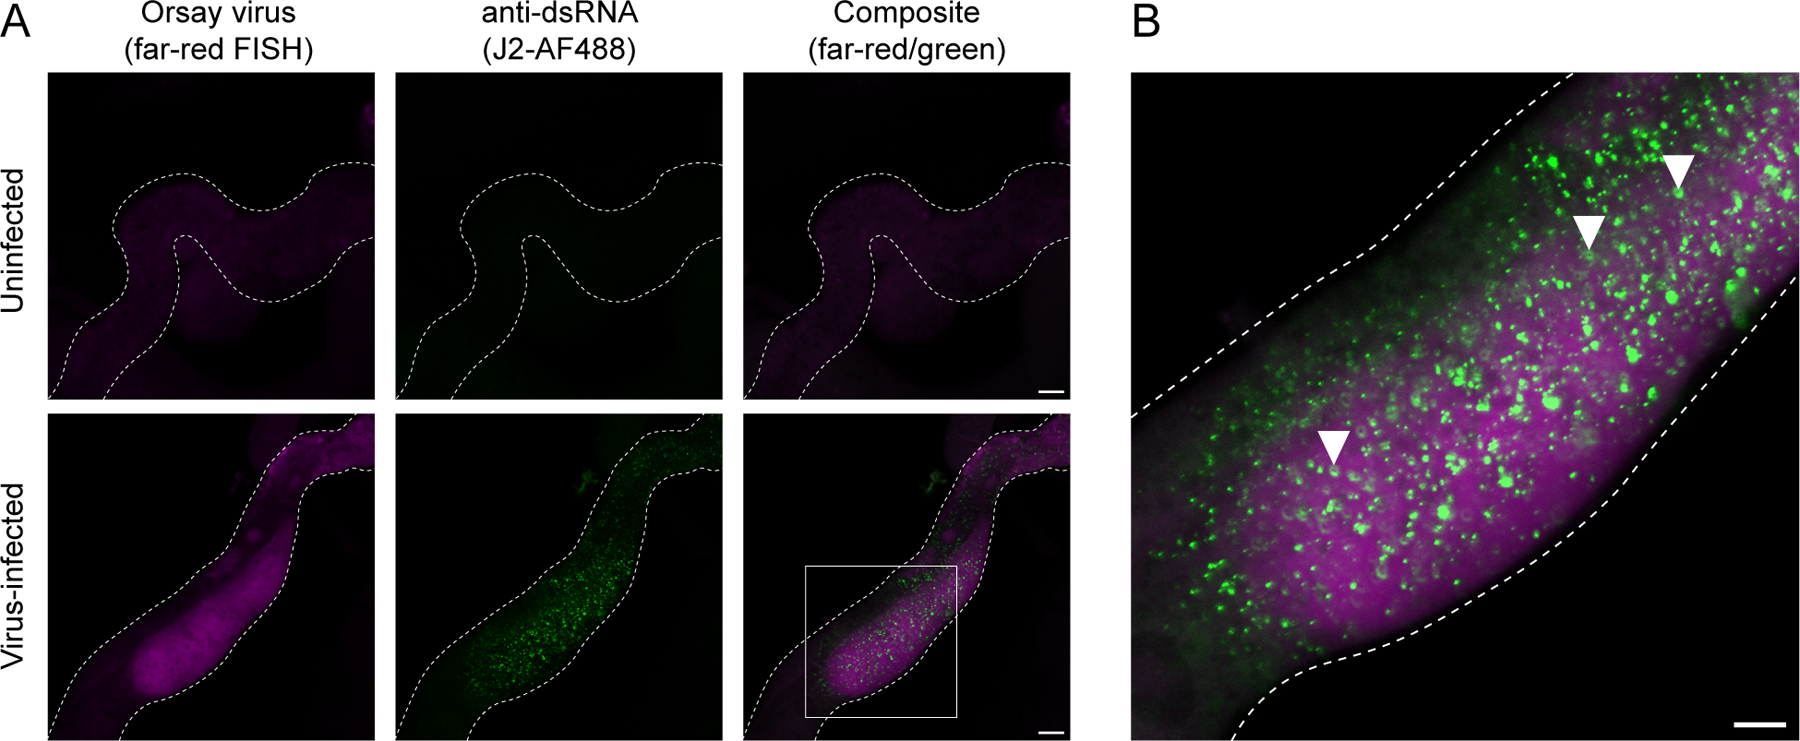
Viral FISH and dsRNA staining in dissected intestines. (A) Representative images of intestines (white dotted outline) from uninfected or virus-infected animals. Viral RNA was visualized using Quasar 670-conjugated (far-red) FISH probes targeting the Orsay virus RNA1 and RNA2 genomic segments. Samples were incubated with the J2 antibody to visualize dsRNA (green). Scale bar = 25 µm. (B) Magnification of region outlined by white box in (A). White arrowheads indicate dsRNA forming ring-like structures in cells that exhibit Orsay FISH staining. Scale bar = 25 µm.
Time Considerations
The preparation of Orsay virus filtrate (Basic Protocol 1) can be completed in eight days. Assessing the infectivity of the filtrate may take up to an additional two weeks depending on which assays are performed. Performing Orsay virus infections (Basic Protocol 2) may take anywhere from 1–2 weeks depending on whether infections are performed at the L1 or L4 larval stage. If combining infections with RNAi, the duration of the assay depends on whether RNAi is performed for one or more generations prior to infections. Time estimates should also account for the growth rate of the C. elegans strain used in the experiment. Assays for measuring viral RNA1 and RNA2 transcript levels by qRT-PCR (Basic Protocol 3), FISH fluorescence intensity (Basic Protocol 4), and infection rate (Basic Protocol 4) can be completed in two days. Combining FISH staining with dsRNA immunofluorescence can take 2–3 days (Basic Protocol 5).
ACKNOWLEDGEMENTS
We thank Brenda Bass, Marie-Anne Félix, Aundrea Koger, Katie Li, Deevya Raman, Supraja Ranganthan, Max Strul, and David Wang for providing helpful feedback on this manuscript. This work was supported by NIH under R01 AG052622, GM114139, AI176639 and by NSF 2301657 to E.R.T. N.W. is supported by Deutsche Forschungsgemeinschaft (DFG, German Research Foundation) under Project 510766555.
Footnotes
CONFLICT OF INTEREST STATEMENT
The authors declare no conflict of interest.
INTERNET RESOURCES
Fiji software download: https://imagej.net/software/fiji/downloads
DATA AVAILABILITY STATEMENT
The data that support the findings of this study are available from the corresponding author upon reasonable request.
LITERATURE CITED
- Ashe A, Bélicard T, Le Pen J, Sarkies P, Frézal L, Lehrbach NJ, Félix M-A, and Miska EA 2013. A deletion polymorphism in the Caenorhabditis elegans RIG-I homolog disables viral RNA dicing and antiviral immunity. eLife 2:e00994. [DOI] [PMC free article] [PubMed] [Google Scholar]
- Bakowski MA, Desjardins CA, Smelkinson MG, Dunbar TA, Lopez-Moyado IF, Rifkin SA, Cuomo CA, and Troemel ER 2014. Ubiquitin-Mediated Response to Microsporidia and Virus Infection in C. elegans. PLOS Pathogens 10:e1004200. [DOI] [PMC free article] [PubMed] [Google Scholar]
- Batachari LE, Dai AY, and Troemel ER 2024. C. elegans RIG-I-like receptor DRH-1 signals via CARDs to activate anti-viral immunity in intestinal cells. 2024.02.05.578694. Available at: https://www.biorxiv.org/content/10.1101/2024.02.05.578694v1 [Accessed April 14, 2024]. [DOI] [PMC free article] [PubMed]
- Chen YG, and Hur S 2022. Cellular origins of dsRNA, their recognition and consequences. Nature Reviews Molecular Cell Biology 23:286–301. [DOI] [PMC free article] [PubMed] [Google Scholar]
- Corsi AK, Wightman B, and Chalfie M 2018. A Transparent window into biology: A primer on Caenorhabditis elegans. In WormBook: The Online Review of C. elegans Biology [Internet] WormBook Available at: https://www.ncbi.nlm.nih.gov/books/NBK299460/ [Accessed March 26, 2024]. [DOI] [PMC free article] [PubMed]
- Dimov I, and Maduro MF 2019. The C. elegans intestine: organogenesis, digestion, and physiology. Cell and Tissue Research 377:383–396. [DOI] [PubMed] [Google Scholar]
- Efstathiou S, Ottens F, Schütter L-S, Ravanelli S, Charmpilas N, Gutschmidt A, Le Pen J, Gehring NH, Miska EA, Bouças J, et al. 2022. ER-associated RNA silencing promotes ER quality control. Nature Cell Biology 24:1714–1725. [DOI] [PMC free article] [PubMed] [Google Scholar]
- Félix M-A, Ashe A, Piffaretti J, Wu G, Nuez I, Bélicard T, Jiang Y, Zhao G, Franz CJ, Goldstein LD, et al. 2011. Natural and experimental infection of Caenorhabditis nematodes by novel viruses related to nodaviruses. PLoS biology 9:e1000586. [DOI] [PMC free article] [PubMed] [Google Scholar]
- Félix M-A, and Wang D 2019. Natural Viruses of Caenorhabditis Nematodes. Annual Review of Genetics 53:313–326. [DOI] [PubMed] [Google Scholar]
- Franz CJ, Renshaw H, Frezal L, Jiang Y, Félix M-A, and Wang D 2014. Orsay, Santeuil and Le Blanc viruses primarily infect intestinal cells in Caenorhabditis nematodes. Virology 448:255–264. [DOI] [PubMed] [Google Scholar]
- Gammon DB 2017. Caenorhabditis elegans as an Emerging Model for Virus-Host Interactions. Journal of Virology 91:e00509–17. [DOI] [PMC free article] [PubMed] [Google Scholar]
- Guo X, Zhang R, Wang J, Ding S-W, and Lu R 2013. Homologous RIG-I–like helicase proteins direct RNAi-mediated antiviral immunity in C. elegans by distinct mechanisms. Proceedings of the National Academy of Sciences 110:16085–16090. [DOI] [PMC free article] [PubMed] [Google Scholar]
- van den Hoogen J, Geisen S, Routh D, Ferris H, Traunspurger W, Wardle DA, de Goede RGM, Adams BJ, Ahmad W, Andriuzzi WS, et al. 2019. Soil nematode abundance and functional group composition at a global scale. Nature 572:194–198. [DOI] [PubMed] [Google Scholar]
- Jiang H, Chen K, Sandoval LE, Leung C, and Wang D 2017. An Evolutionarily Conserved Pathway Essential for Orsay Virus Infection of Caenorhabditis elegans. mBio 8:e00940–17. [DOI] [PMC free article] [PubMed] [Google Scholar]
- Jiang H, Franz CJ, Wu G, Renshaw H, Zhao G, Firth AE, and Wang D 2014. Orsay virus utilizes ribosomal frameshifting to express a novel protein that is incorporated into virions. Virology 450:213–221. [DOI] [PMC free article] [PubMed] [Google Scholar]
- Jiang H, Leung C, Tahan S, and Wang D 2019. Entry by multiple picornaviruses is dependent on a pathway that includes TNK2, WASL, and NCK1. eLife 8:e50276. [DOI] [PMC free article] [PubMed] [Google Scholar]
- Jiang H, Sandoval Del Prado LE, Leung C, and Wang D 2020. Huntingtin-interacting protein family members have a conserved pro-viral function from Caenorhabditis elegans to humans. Proceedings of the National Academy of Sciences of the United States of America 117:22462–22472. [DOI] [PMC free article] [PubMed] [Google Scholar]
- Lažetić V, Batachari LE, Russell AB, and Troemel ER 2023. Similarities in the induction of the intracellular pathogen response in Caenorhabditis elegans and the type I interferon response in mammals. BioEssays: News and Reviews in Molecular, Cellular and Developmental Biology 45:e2300097. [DOI] [PMC free article] [PubMed] [Google Scholar]
- Le Pen J, Jiang H, Di Domenico T, Kneuss E, Kosałka J, Leung C, Morgan M, Much C, Rudolph KLM, Enright AJ, et al. 2018. Terminal uridylyltransferases target RNA viruses as part of the innate immune system. Nature Structural & Molecular Biology 25:778–786. [DOI] [PMC free article] [PubMed] [Google Scholar]
- Liu W-H, Lin Y-L, Wang J-P, Liou W, Hou RF, Wu Y-C, and Liao C-L 2006. Restriction of vaccinia virus replication by a ced-3 and ced-4-dependent pathway in Caenorhabditis elegans. Proceedings of the National Academy of Sciences of the United States of America 103:4174–4179. [DOI] [PMC free article] [PubMed] [Google Scholar]
- Lu R, Maduro M, Li F, Li H, Broitman-Maduro G, Li W, and Ding S 2005. Animal virus replication and RNAi-mediated antiviral silencing in C elegans. Nature 436:1040–1043. [DOI] [PMC free article] [PubMed] [Google Scholar]
- Lu R, Yigit E, Li W-X, and Ding S-W 2009. An RIG-I-Like RNA Helicase Mediates Antiviral RNAi Downstream of Viral siRNA Biogenesis in Caenorhabditis elegans. PLOS Pathogens 5:e1000286. [DOI] [PMC free article] [PubMed] [Google Scholar]
- Nyaanga J, Crombie TA, Widmayer SJ, and Andersen EC 2021. easyXpress: An R package to analyze and visualize high-throughput C. elegans microscopy data generated using CellProfiler. PLOS ONE 16:e0252000. [DOI] [PMC free article] [PubMed] [Google Scholar]
- Pukkila-Worley R, and Ausubel FM 2012. Immune defense mechanisms in the Caenorhabditis elegans intestinal epithelium. Current opinion in immunology 24:3–9. [DOI] [PMC free article] [PubMed] [Google Scholar]
- Reddy KC, Dror T, Sowa JN, Panek J, Chen K, Lim ES, Wang D, and Troemel ER 2017. An intracellular pathogen response pathway promotes proteostasis in C. elegans. Current biology : CB 27:3544–3553.e5. [DOI] [PMC free article] [PubMed] [Google Scholar]
- Reddy KC, Dror T, Underwood RS, Osman GA, Elder CR, Desjardins CA, Cuomo CA, Barkoulas M, and Troemel ER 2019. Antagonistic paralogs control a switch between growth and pathogen resistance in C. elegans. PLOS Pathogens 15:e1007528. [DOI] [PMC free article] [PubMed] [Google Scholar]
- Rivera DE, Lažetić V, Troemel ER, and Luallen RJ 2022. RNA Fluorescence in situ Hybridization (FISH) to Visualize Microbial Colonization and Infection in Caenorhabditis elegans Intestines. Journal of visualized experiments : JoVE: 10.3791/63980. [DOI] [PMC free article] [PubMed] [Google Scholar]
- Sandoval LE, Jiang H, and Wang D 2019. The Dietary Restriction-Like Gene drl-1, Which Encodes a Putative Serine/Threonine Kinase, Is Essential for Orsay Virus Infection in Caenorhabditis elegans. Journal of Virology 93:e01400–18. [DOI] [PMC free article] [PubMed] [Google Scholar]
- Schott DH, Cureton DK, Whelan SP, and Hunter CP 2005. An antiviral role for the RNA interference machinery in Caenorhabditis elegans. Proceedings of the National Academy of Sciences of the United States of America 102:18420–18424. [DOI] [PMC free article] [PubMed] [Google Scholar]
- Son K-N, Liang Z, and Lipton HL 2015. Double-Stranded RNA Is Detected by Immunofluorescence Analysis in RNA and DNA Virus Infections, Including Those by Negative-Stranded RNA Viruses. Journal of Virology 89:9383–9392. [DOI] [PMC free article] [PubMed] [Google Scholar]
- Sowa JN, Jiang H, Somasundaram L, Tecle E, Xu G, Wang D, and Troemel ER 2020. The Caenorhabditis elegans RIG-I Homolog DRH-1 Mediates the Intracellular Pathogen Response upon Viral Infection. Journal of Virology 94. Available at: https://jvi.asm.org/content/94/2/e01173-19 [Accessed January 18, 2021]. [DOI] [PMC free article] [PubMed] [Google Scholar]
- Stiernagle T 2006. Maintenance of C. elegans. In WormBook: The Online Review of C. elegans Biology [Internet] WormBook Available at: https://www.ncbi.nlm.nih.gov/books/NBK19649/ [Accessed February 22, 2024]. [DOI] [PMC free article] [PubMed] [Google Scholar]
- Wilkins C, Dishongh R, Moore SC, Whitt MA, Chow M, and Machaca K 2005. RNA interference is an antiviral defence mechanism in Caenorhabditis elegans. Nature 436:1044–1047. [DOI] [PubMed] [Google Scholar]
- Zhou Y, Chen H, Zhong W, and Tao YJ 2024. Collagen and actin network mediate antiviral immunity against Orsay virus in C. elegans intestinal cells. PLOS Pathogens 20:e1011366. [DOI] [PMC free article] [PubMed] [Google Scholar]
Associated Data
This section collects any data citations, data availability statements, or supplementary materials included in this article.
Data Availability Statement
The data that support the findings of this study are available from the corresponding author upon reasonable request.