

Abstract

Static electric fields play a considerable role in a variety of molecular nanosystems as diverse as single-molecule junctions, molecules supporting electrostatic catalysis, and biological cell membranes incorporating proteins. External electric fields can be applied to nanoscale samples with a conductive atomic force microscopy (AFM) probe in contact mode, but typically, no structural information is retrieved. Here we combine photothermal expansion infrared (IR) nanospectroscopy with electrostatic AFM probes to measure nanometric volumes where the IR field enhancement and the static electric field overlap spatially. We leverage the vibrational Stark effect in the polymer poly(methyl methacrylate) for calibrating the local electric field strength. In the relevant case of membrane protein bacteriorhodopsin, we observe electric-field-induced changes of the protein backbone conformation and residue protonation state. The proposed technique also has the potential to measure DC currents and IR spectra simultaneously, insofar enabling the monitoring of the possible interplay between charge transport and other effects.
Keywords: IR nanospectroscopy, electric-field-induced molecular dynamics, electrostatic AFM probe, vibrational Stark effect, membrane proteins
Static electric fields play a considerable role in a variety of molecular nanosystems as diverse as single-molecule junctions,1−3 molecules supporting electrostatic catalysis,4−6 and biological cell membranes incorporating membrane proteins.7−9 In these contexts, the use of nanoelectrodes, often in the form of conducting scanning probe tips, has been widely exploited to apply a controlled electric field to single molecules and ultrathin molecular layers.3,10−16 Depending on the specific molecular system, the application of an oriented static field results in diverse effects, such as charge transport,1−3,17,18 catalysis of chemical reactions,4−6 reorientation of intramolecular dipoles, modifications of the molecule conformation,7,19−21 and the shift of the vibrational energy levels known as the vibrational Stark effect (VSE).22,23 Although optical spectroscopies are, in principle, sensitive to most of these effects,24−30 rarely have they been performed in the near-field in the presence of a controlled external electric field. Using a conducting scanning probe both as nanoelectrode and as near-field optical sensor is then an ideal strategy to achieve this aim, since it allows one to apply a controlled electric field to a well-defined nanoscale volume. In few cases, Raman spectroscopy has been applied to nanosystems as a function of applied voltage bias, either in the form of tip-enhanced Raman spectroscopy (TERS) combined with scanning tunneling microscopy (STM)31−35 or by means of surface-enhanced Raman spectroscopy (SERS) configurations based on purposely designed metallic nanostructures.36−41 In the case of IR absorption spectroscopy, however, comparable nanoscale voltage-dependent vibrational studies have not been reported to date; however, there are classes of molecules for which IR spectroscopy becomes necessary, e.g., proteins. Indeed, the amide-I band between 1600 and 1700 cm–1 (photon energy of ∼0.2 eV) is a very sensitive IR spectroscopy fingerprint of subtle protein conformational changes and also of the protein backbone orientation, if compared to other optical spectroscopies.42−45 The interaction between proteins and an external field can lead to changes of their conformation, or it can affect their dynamical behavior with potential impact on their biological functions.7,19−21 Despite this, there are only a few experimental studies capable of resolving the conformational changes of proteins while retaining control over the actual electric field value and direction.20,46,47
In this work, we demonstrate an IR nanospectroscopy technique that achieves the simultaneous overlap of a static electric field and an enhanced IR probing field in the nanogap between a metallic scanning probe tip and a metal-coated substrate. The proposed approach relies on a simple but innovative concept: the combination of photothermal expansion IR nanospectroscopy (AFM-IR) in constant-contact AFM mode that reaches molecular monolayer sensitivity,48 with an electrostatic AFM probe that applies an external potential bias. To do this, we originally implemented in our setup an external conductive-AFM circuit,49 which however has never been combined with an IR nanospectroscopic approach. To validate the novel experimental configuration, we start by detecting the electric-field-dependent changes in the carbonyl stretching band of poly(methyl methacrylate) (PMMA) films, interpreting them in the theoretical framework of the VSE to calibrate the absolute electric field value. Then, we report relevant results on individual 10 nm-thick lipid bilayer membranes incorporating bacteriorhodopsin (BR), a prototype membrane protein regulating proton transport across the membrane50 and relevant also for nanoelectronics applications.51 We perform IR difference nanospectroscopy of the amide-I band to detect electric-field-induced conformational changes, which we compare spectroscopically to the better-known light-induced conformational changes of BR. Although not shown here due to the negligible DC current of the chosen molecular systems (PMMA and BR), a DC current/IR correlation study would be relevant for all those systems capable of electron transport,49 including proteins.17,52−54 One may notice that for all IR nanospectroscopy approaches based on noncontact AFM modes,55,56 a similar approach would be much more challenging to realize as the electric field intensity would be modulated by the tapping frequency and, in addition, one could not simultaneously measure the DC current.
Starting from an existing AFM-IR platform (Bruker-Anasys nanoIR224) we have built an external electric circuit,49 as shown in Figure 1a (details of the electrical setup in the SI). We record AFM-IR spectra A(ν) at constant bias Vi and at zero bias and subsequently calculate δA(ν)i = A(ν)|Vi – A(ν)|0. The acquisition sequence is schematically reported in Figure 1b. For each Vi the acquisition is repeated ∼10 times and the IR difference absorption spectrum ΔA(ν)i is obtained by average. The requirement of a conductive tip with IR field enhancement and suitable mechanical properties for AFM-IR translates into the choice of conducting silicon AFM probes with a pyramidal tip, coated with a gold layer added by evaporation. For our experimental purposes, we have further modified them to obtain a flat-top shape (width ∼80 nm) by melting the small portion of gold coating forming the tip apex, which we did by passing a high DC current through the probe while in contact mode with a conducting sample49 (see Figure 2a).
Figure 1.

(a) Schematic
of the DC circuit integrated in the AFM-IR setup.
(b) Time scheme of the procedure followed for the acquisition of
difference-spectroscopy data δA(ν)i. Δton represents the time interval for the AFM-IR spectra acquisition
(in Figures 1c and 2h,i Δton ∼ 20 s), and Δtoff represents the voltage ramp time plus a settle
time for static charge removal (Δtoff ∼ Δton). (c) Representative AFM-IR spectra recorded on
the 55 nm-thick PMMA film with the flat tip in the absence (black)
and in the presence (yellow) of an applied external voltage V. (d) ΔA(ν)i acquired on the 55 nm-thick PMMA film for different values
of the applied voltage Vi (gray dotted curves) and the best VSE fitting curves reported (blue
lines). A smoothing spline algorithm has been applied to the AFM-IR
data. (e) Schematic representation of the effect of an electric field
on the vibrational transition energy in the case of an anharmonic
molecular potential (left panel) and of the line shape broadening
of an absorption peak for an isotropic sample because of the VSE (right
panel). (f) Plot of the second derivative coefficients  (empty circles) obtained from
the fitting
curves in (d) using eq 1, highlighting the linear dependence on
(empty circles) obtained from
the fitting
curves in (d) using eq 1, highlighting the linear dependence on  .
.
Figure 2.

(a, b) SEM images of the flat tip and the sharp tip, respectively. (c, d) Numerical simulations of the static electric field Fstat applied with the flat tip and the sharp tip, respectively, on the 55 nm-thick PMMA sample for a voltage V = 1.0 V. (e, f) Electromagnetic simulations of the IR field FIR enhancement at λ = 5.8 μm in the same experimental conditions of (c) and (d). The maps are saturated to the maximum field intensity in the PMMA layer. (g) Representative AFM-IR spectrum acquired on the 23 nm-thick sample with the flat tip and the relative first derivative (continuous black line, 30×) and second derivative (dashed black line, ×150). (h) Comparison of the difference spectra ΔA(ν)i obtained with the flat tip (gray dotted curves) and (i) with the sharp tip (light-blue dotted curves) on the 55 nm-thick PMMA sample (top panel) and on the 23 nm-thick PMMA sample (bottom panel). A smoothing spline algorithm has been applied to the AFM-IR data.
PMMA can be used as the calibration sample because under the application of an external static electric field it shows modifications of the IR spectra due to a single effect, namely, the VSE.57 The VSE is the vibrational counterpart of the fundamental Stark effect, typically expressed in quantum mechanics as the frequency shift of an optical transition under the effect of an electric field, and it becomes a dominant effect when molecules have a negligible freedom of movement. In VSE, due to the anharmonicity of the molecular potential, the dipole moment μ⃗ is slightly larger in the vibrational excited state than in the ground state; hence the corresponding energy levels shift differently in an electric field F⃗. As sketched in Figure 1e, left panel, this effect leads to a red or blue shift of the vibrational transition frequency Δν = −F⃗ ·Δμ⃗, where Δμ⃗ is the dipole moment change. In the case of isotropic molecule dipole moment distribution with respect to the field, as for PMMA films, neither a red or blue Stark shift is expected, but rather a line broadening proportional to the square of the static electric field (see Figure 1e, right panel).22,58−60 Note that, in principle, also the change of the electronic polarizability can contribute to the VSE, but this effect is typically negligible compared to that due to the change of dipole moment.61
PMMA films of two different thicknesses d = 55
and 23 nm were spin-coated over gold surfaces on conductive silicon
wafers (see details in SI). In Figure 1c a typical AFM-IR
spectrum of the C=O stretching line of PMMA is shown together
with the ΔA(ν)i curves for increasing Vi values in Figure 1d. Because d = 55 nm is smaller than the
flat tip width of 80 nm, one can use the parallel-plate capacitor
model to calculate the static applied electric field  and the VSE theory for an isotropic immobilized
medium22,62−64 to fit the following
equation to the data in Figure 1d (blue curves):
and the VSE theory for an isotropic immobilized
medium22,62−64 to fit the following
equation to the data in Figure 1d (blue curves):
| 1 |
where f is
a local field correction factor between 1.0 and 2.0, χ is the
angle between F⃗stat and the radiation field F⃗IR, and Aχ, Bχ, and Cχ are molecular-bond-dependent coefficients. Bχ takes into account the field-dependent effect due to
the change of polarizability, while Cχ is expected to be the VSE dominant contribution since Cχ ∝Δμ2. If we now
plot the best-fit values of Cχ·(fFstat)2 vs  (Figure 1f), we observe
an approximate linear dependence because,
in first-order perturbation theory, Δμ⃗ does not depend on the field strength. As detailed in SI, assuming f = 1.0, we find
Δμ = (6.5 ± 0.6) × 10–2 Debye
(electric dipole moment unit equal to 3.34 × 10⁻³⁰ C·m), which is compatible with the values reported in refs (57) and (62). This is strong experimental
evidence that a homogeneous field in the probed nanovolume with strength
(Figure 1f), we observe
an approximate linear dependence because,
in first-order perturbation theory, Δμ⃗ does not depend on the field strength. As detailed in SI, assuming f = 1.0, we find
Δμ = (6.5 ± 0.6) × 10–2 Debye
(electric dipole moment unit equal to 3.34 × 10⁻³⁰ C·m), which is compatible with the values reported in refs (57) and (62). This is strong experimental
evidence that a homogeneous field in the probed nanovolume with strength  is a good approximation for d =
55 nm, as also confirmed by the Poisson equation simulations of Figure 2c and the electromagnetic
simulations of Figure 2e (details in SI). One can reasonably
assume that the modification of the electric field value in the nanogap
due to the photothermal expansion can be safely neglected.65
is a good approximation for d =
55 nm, as also confirmed by the Poisson equation simulations of Figure 2c and the electromagnetic
simulations of Figure 2e (details in SI). One can reasonably
assume that the modification of the electric field value in the nanogap
due to the photothermal expansion can be safely neglected.65
We have then explored the ultimate limits of field enhancement that can be reached with our technique, using AFM probes with a much sharper apex prepared by gold ion cluster evaporation (NextTip, Spain, SEM images in Figure 2b, red mark showing a curvature radius of 8 nm). Electrostatic and electromagnetic simulations of the sharp tip (Figure 2d,f) show an increase in both the static and IR field intensities at the tip apex, with a rapid decrease along the z axis. The nanoscale volume contributing to the difference signal is expected to be much smaller than that probed by the flat tip, with a radial extension set by the curvature radius of the tip, as is typical in near-field microscopy. In Figure 2h we compare the ΔA (ν)i spectra measured on the 55 nm-thick calibration sample with the flat and sharp tips at Vi = 16.5 V and Vi = 11 V, respectively. One can see that the VSE line broadening observation is confirmed, but with f > 1 for the sharp tip, confirming the increase of the actual electric field in the probed volume. Interestingly, on a thinner PMMA sample (d = 23 nm, Figure 2i) the line shape of ΔA(ν) is qualitatively different compared to the d = 55 nm sample for both the flat and the sharp tip, resembling a first-derivative rather than a second-derivative signal (see Figure 2g). Indeed, for a PMMA film thickness comparable to the typical end-to-end distance of the polymer chain (around 22 nm in our case66), a large orientational freedom is expected67,68 and the results cannot anymore be interpreted in the framework of VSE. The observed ΔA(ν) featuring a first-derivative shape can therefore be ascribed to molecule reorientation that likely results in a change of the dipole–dipole interaction between the C=O bonds and consequent shift of the vibrational mode.69,70
We now move to the relevant case of proteins embedded in the lipid cell membrane, which represent the perfect prototype of molecules natively subjected to an electric field.71 It is known indeed that the transmembrane electric field exerts forces on the molecular structure, which can affect and even trigger functional conformational changes.7,9,72 We have selected the prototype proton-pump bacteriorhodopsin (BR) protein as a test sample to demonstrate a potential use of our technique.
We have prepared individual BR-containing purple membranes dispersed on ultraflat gold (details in SI), featuring a high BR-filling factor (75%). We recall that, in the BR molecule, seven antiparallel helix structures run from the extracellular (EC) to the cytoplasmic (CP) side of the cell membrane and that BR proteins are arranged in a hexagonal pattern of BR trimers. This results in a total C=O dipole moment μ⃗ for the entire BR protein almost parallel to the normal to the membrane patch and a static dipole moment μ⃗stat pointing from the CP side to the EC side (see simplified sketch in Figure 3a). In Figure 3 we report the results obtained on the BR sample with our novel setup on a selected stack of two purple membrane patches with a total thickness of 10 nm, as shown by the AFM topography map in Figure 3b. From surface roughness estimation by AFM imaging, one can conclude that the two stacked membrane patches are both oriented with the CP side up75,76 (see also SI). In Figure 3c we report a representative AFM-IR spectrum in the amide-I band range, which mainly arises from coupled C=O stretching along the protein backbone.42 The central frequency of this band (∼1665 cm–1) is in agreement with previous AFM-IR24 and s-SNOM77 papers, and it is a confirmation of the good quality of our samples in terms of protein arrangement within the lipid bilayer.78
Figure 3.
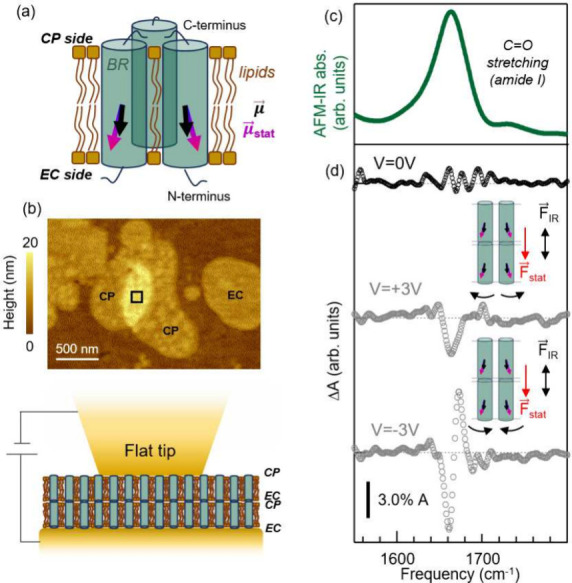
(a) Sketch reporting μ⃗ and μ⃗stat for two representative BR molecules belonging to the same trimer. The direction of μ⃗stat has been obtained using the software described in ref (73) with PDB-ID Code 1FBB and that of μ⃗ from ref (74). (b) Top: AFM topography of the two overlapping cell membranes exposing the CP side on which the AFM-IR measurement has been conducted. Cell membrane patches showing the less rough EC side can also be also identified. Bottom: sketch of two purple membranes placed in the nanogap between the flat tip and ultraflat gold substrate. (c) Amide-I band (green curve) of a representative AFM-IR spectrum acquired on the area pointed out by the black square in (b). (d) ΔA(ν)0 (black dotted curve) and ΔA(ν)±3V (gray dotted curves) obtained in the double membrane of panel (b). A smoothing spline algorithm has been applied to the AFM-IR data.
Electric-field-induced IR absorption changes ΔA of a few percent of the maximum absorption peak at 1665
cm–1 (see Figure 3e) were
obtained at bias Vi =
±3 V. These relative changes are comparable in intensity to those
observed in the IR difference spectra of PMMA samples in Figures 1 and 2 at slightly higher Vi. For the stack of membrane patches we can again assume, as
for the PMMA films,  (no DC current was measured in the tip–substrate
bias circuit, see SI). It is worth highlighting
that, despite such high value of the electric field,79,80 no electroporation occurred during the experiments. This can be
explained considering that the high protein-filling factor of BR is
expected to result in an increase of the voltage breakdown for membranes.80,81 By looking at the ΔA(ν)±3V reported in Figure 3d, one can clearly observe that very different features
are obtained for the two polarities in the amide-I band range. Similarly
to the case of 23 nm-thick PMMA film, here one can safely rule out
the VSE as a dominant effect due to the large freedom of orientation
of BR molecules71 (see also SI). To explain the observed amide-I features,
we then have to resort to changes of the protein backbone orientation
and/or conformation in external electric fields.82,83 Modifications of the individual helices (such as change of helix
length, tilt, and partial unfolding), as well as of the intermolecular
interactions, would all produce IR difference signals at the amide-I
maximum.42,78 We believe that the dominant effect is the
protein orientation, given the nonzero μ⃗stat of BR proteins. BR orientation is
expected to be different for opposite polarities due to two effects
that break the dipole orientation symmetry under opposite F⃗stat directions along
the protein axis: the offset position of the center of μ⃗stat toward the EC side with respect
to the center of mass of the protein, and the different steric hindrance
in the two orientation directions. Further contribution to the different
ΔA(ν) is expected from the nonlinear
dependence of the intermolecular coupling on the intermolecular and
interhelix distances.78 In the SI we provide a phenomenological model pointing
to different dominant effects, depending on the polarization of the
applied bias. For Vi =
+3 V, the negative dip is compatible with an increase of ∼1°
between μ⃗stat and F⃗IR resulting in a reduction of the signal due to the selection rule,
while the observed frequency shift of ∼9 cm–1 observed for Vi = −3
V is compatible with an increase of the intermolecular coupling due
to the close-packing of the BR proteins and of the helices within
each molecules.78 However, molecular dynamics
calculations are required in order to identify the specific electric-field-induced
changes of the BR backbone, but this is beyond the scope of the present
work.
(no DC current was measured in the tip–substrate
bias circuit, see SI). It is worth highlighting
that, despite such high value of the electric field,79,80 no electroporation occurred during the experiments. This can be
explained considering that the high protein-filling factor of BR is
expected to result in an increase of the voltage breakdown for membranes.80,81 By looking at the ΔA(ν)±3V reported in Figure 3d, one can clearly observe that very different features
are obtained for the two polarities in the amide-I band range. Similarly
to the case of 23 nm-thick PMMA film, here one can safely rule out
the VSE as a dominant effect due to the large freedom of orientation
of BR molecules71 (see also SI). To explain the observed amide-I features,
we then have to resort to changes of the protein backbone orientation
and/or conformation in external electric fields.82,83 Modifications of the individual helices (such as change of helix
length, tilt, and partial unfolding), as well as of the intermolecular
interactions, would all produce IR difference signals at the amide-I
maximum.42,78 We believe that the dominant effect is the
protein orientation, given the nonzero μ⃗stat of BR proteins. BR orientation is
expected to be different for opposite polarities due to two effects
that break the dipole orientation symmetry under opposite F⃗stat directions along
the protein axis: the offset position of the center of μ⃗stat toward the EC side with respect
to the center of mass of the protein, and the different steric hindrance
in the two orientation directions. Further contribution to the different
ΔA(ν) is expected from the nonlinear
dependence of the intermolecular coupling on the intermolecular and
interhelix distances.78 In the SI we provide a phenomenological model pointing
to different dominant effects, depending on the polarization of the
applied bias. For Vi =
+3 V, the negative dip is compatible with an increase of ∼1°
between μ⃗stat and F⃗IR resulting in a reduction of the signal due to the selection rule,
while the observed frequency shift of ∼9 cm–1 observed for Vi = −3
V is compatible with an increase of the intermolecular coupling due
to the close-packing of the BR proteins and of the helices within
each molecules.78 However, molecular dynamics
calculations are required in order to identify the specific electric-field-induced
changes of the BR backbone, but this is beyond the scope of the present
work.
Finally, we have employed our technique to monitor the conformational changes of BR together with protonation changes of amino acids by keeping the membranes in high-hydration conditions to accumulate sufficient hydration water molecules in the proximity of the membrane stack.84,85 In Figure 4 we show the ΔA(ν)−3V spectrum obtained in dark conditions on another individual purple membrane stack with the same CP-up orientation and high hydration. For comparison, in Figure 4 we also plot the light-induced IR difference spectrum previously acquired using the same AFM-IR setup without any static field applied but under visible light illumination.24 Both spectra display some protein conformational change features (yellow shade) and a peak at around ∼1760 cm–1 (red shade), which is the marker of the protonation change of individual amino acid residues. Obviously, the retinal photoisomerization and Schiff-base features (blue shade)86 appear only in the photocycle spectrum (green curve), which also explains the peak around ∼1760 cm–1, known to be related to the protonation of the amino acid Asp-85 acting as proton acceptor.87 The presence of the protonation change marker in the gray curve indicates a modulation of the protonation equilibrium of a protein residue, likely Asp-85, here induced by the electric force88 rather than by the absorption of visible photons. Interestingly, the protein conformational change features are quite different in the two cases. Also, the feature in the gray curve is different from the one observed in Figure 3d, with external electric field but in a condition of low hydration. Again, molecular dynamics simulations will help to clarify the nature of the protein backbone orientation in the presence of electric fields, with varying hydration conditions. In any case, our technique is perfectly suited to unambiguously measure electric-field-induced IR difference spectroscopy data on individual membranes, with known CP/EC orientation provided by simultaneous AFM imaging.
Figure 4.
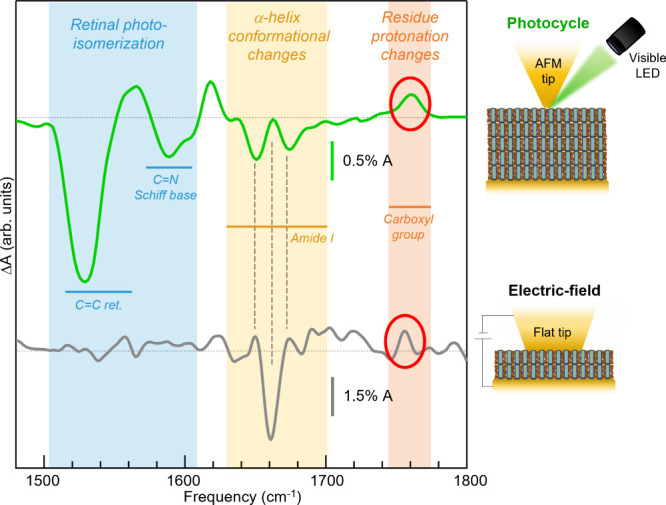
Comparison of two AFM-IR difference spectra (data smoothed with a spline algorithm). The green curve is the light-induced ΔA acquired on a purple membrane stack. The gray curve is an electric-field-induced ΔA(ν)−3V acquired with a flat AFM tip on a stack of two overlapping purple membranes in high-hydration condition. The blue, yellow, and red shaded regions indicate the spectral range of the features related to retinal photoisomerization, protein conformational changes, and protonation of a carbonyl group, respectively.86
Beyond this preliminary experiment,
future research along these
lines may explain the dependence on an applied external electric field
of the proton transport efficiency of BR-based photovoltaic devices,89 and, more in general, it may clarify the complex
interplay between light-induced conformational changes, protonation
dynamics of amino acid residues, and proton transport.51,85 One can envision that further improvements of the technique will
allow to reach the sensitivity required to monitor spectral variations
under electric field values closer to physiological ones ( rather than
  achieved here for an
individual membrane),
to increase the biological relevance of the results.
achieved here for an
individual membrane),
to increase the biological relevance of the results.
In conclusion,
we have demonstrated mid-infrared vibrational nanospectroscopy
using metal-coated scanning probes in the presence of external electric
fields. The probe tip apex in contact-AFM mode acts as both the nanoelectrode
(with the metal-coated substrate acting as counterelectrode) and the
IR field-enhancement structure, required to achieve nanoscale resolution
in photothermal expansion spectroscopy. A sharper tip apex leads to
higher electric field values, hence stronger IR difference signal
for the same applied bias. We investigated the vibrational Stark effect
in thin PMMA films and used the IR difference-spectroscopy data to
calibrate the absolute electric field value, on the order of 3  for an applied voltage bias of 10 to 3
V depending on sample thickness, using a flat tip. On individual 10
nm-thick cell membrane stacks containing the proton-transport protein
bacteriorhodopsin, we observed the field-induced conformational changes
and the protonation of amino acid residues. The proposed technique
permits one to apply well-defined and homogeneous electric fields
to the controlled nanoscale volumes probed by infrared nanospectroscopy,
and as such, it may find application in molecular electronics, electrostatic
catalysis, fundamental studies of an electric potential on the cell
transmembrane proteins, and protein studies in general.
for an applied voltage bias of 10 to 3
V depending on sample thickness, using a flat tip. On individual 10
nm-thick cell membrane stacks containing the proton-transport protein
bacteriorhodopsin, we observed the field-induced conformational changes
and the protonation of amino acid residues. The proposed technique
permits one to apply well-defined and homogeneous electric fields
to the controlled nanoscale volumes probed by infrared nanospectroscopy,
and as such, it may find application in molecular electronics, electrostatic
catalysis, fundamental studies of an electric potential on the cell
transmembrane proteins, and protein studies in general.
Acknowledgments
The authors thank Prof. Peter Hegemann and Dr. Matthias Broser for reading the manuscript and for providing the BRD96N protein sample. T.V., H.H., C.C., M.P., A.N., F.M., M.O., and V.G. acknowledge funding by the European Innovation Council (NEHO, 101046329). Views and opinions expressed are however those of the authors only and do not necessarily reflect those of the European Union or EIC. Neither the European Union nor the granting authority can be held responsible for them.
Supporting Information Available
The Supporting Information is available free of charge at https://pubs.acs.org/doi/10.1021/acs.nanolett.4c01387.
Additional experimental details, materials, and methods including electromagnetic simulations (PDF)
The authors declare no competing financial interest.
Supplementary Material
References
- Xin N.; Guan J.; Zhou C.; Chen X.; Gu C.; Li Y.; Ratner M. A.; Nitzan A.; Stoddart J. F.; Guo X. Concepts in the design and engineering of single-molecule electronic devices. Nature Reviews Physics 2019, 1, 211–230. 10.1038/s42254-019-0022-x. [DOI] [Google Scholar]
- Chen H.; Fraser Stoddart J. From molecular to supramolecular electronics. Nature Reviews Materials 2021, 6, 804–828. 10.1038/s41578-021-00302-2. [DOI] [Google Scholar]
- Song H.; Reed M. A.; Lee T. Single molecule electronic devices. Adv. Mater. 2011, 23, 1583–1608. 10.1002/adma.201004291. [DOI] [PubMed] [Google Scholar]
- Aragones A. C.; Haworth N. L.; Darwish N.; Ciampi S.; Bloomfield N. J.; Wallace G. G.; Diez-Perez I.; Coote M. L. Electrostatic catalysis of a Diels–Alder reaction. Nature 2016, 531, 88–91. 10.1038/nature16989. [DOI] [PubMed] [Google Scholar]
- Joy J.; Stuyver T.; Shaik S. Oriented external electric fields and ionic additives elicit catalysis and mechanistic crossover in oxidative addition reactions. J. Am. Chem. Soc. 2020, 142, 3836–3850. 10.1021/jacs.9b11507. [DOI] [PubMed] [Google Scholar]
- Huang X.; Tang C.; Li J.; Chen L.-C.; Zheng J.; Zhang P.; Le J.; Li R.; Li X.; Liu J.; et al. Electric field–induced selective catalysis of single-molecule reaction. Science. Advances 2019, 5, eaaw3072. 10.1126/sciadv.aaw3072. [DOI] [PMC free article] [PubMed] [Google Scholar]
- Bezanilla F. How membrane proteins sense voltage. Nat. Rev. Mol. Cell Biol. 2008, 9, 323–332. 10.1038/nrm2376. [DOI] [PubMed] [Google Scholar]
- Cournia Z.; Allen T. W.; Andricioaei I.; Antonny B.; Baum D.; Brannigan G.; Buchete N.-V.; Deckman J. T.; Delemotte L.; Del Val C.; et al. Membrane protein structure, function, and dynamics: a perspective from experiments and theory. J. Membr. Biol. 2015, 248, 611–640. 10.1007/s00232-015-9802-0. [DOI] [PMC free article] [PubMed] [Google Scholar]
- Catterall W. A. Structure and function of voltage-gated ion channels. Annual review of biochemistry 1995, 64, 493–531. 10.1146/annurev.bi.64.070195.002425. [DOI] [PubMed] [Google Scholar]
- Kelley T. W.; Granstrom E.; Frisbie C. D. Conducting probe atomic force microscopy: A characterization tool for molecular electronics. Adv. Mater. 1999, 11, 261–264. . [DOI] [Google Scholar]
- Fan F.-R. F.; Yang J.; Cai L.; Price D. W. Jr; Dirk S. M.; Kosynkin D. V.; Yao Y.; Rawlett A. M.; Tour J. M.; Bard A. J. Charge transport through self-assembled monolayers of compounds of interest in molecular electronics. J. Am. Chem. Soc. 2002, 124, 5550–5560. 10.1021/ja017706t. [DOI] [PubMed] [Google Scholar]
- Seferos D. S.; Blum A. S.; Kushmerick J. G.; Bazan G. C. Single-molecule charge-transport measurements that reveal technique-dependent perturbations. J. Am. Chem. Soc. 2006, 128, 11260–11267. 10.1021/ja062898j. [DOI] [PubMed] [Google Scholar]
- Kim B.; Choi S. H.; Zhu X.-Y.; Frisbie C. D. Molecular tunnel junctions based on π-conjugated oligoacene thiols and dithiols between Ag, Au, and Pt contacts: effect of surface linking group and metal work function. J. Am. Chem. Soc. 2011, 133, 19864–19877. 10.1021/ja207751w. [DOI] [PubMed] [Google Scholar]
- Hui F.; Lanza M. Scanning probe microscopy for advanced nanoelectronics. Nature electronics 2019, 2, 221–229. 10.1038/s41928-019-0264-8. [DOI] [Google Scholar]
- Gorenskaia E.; Turner K. L.; Martín S.; Cea P.; Low P. J. Fabrication of metallic and non-metallic top electrodes for large-area molecular junctions. Nanoscale 2021, 13, 9055–9074. 10.1039/D1NR00917F. [DOI] [PubMed] [Google Scholar]
- Romero-Muñiz C.; Vilhena J. G.; Pérez R.; Cuevas J.; Zotti L. Recent advances in understanding the electron transport through metal-azurin-metal junctions. Frontiers in Physics 2022, 10, 950929. 10.3389/fphy.2022.950929. [DOI] [Google Scholar]
- Jiang T.; Zeng B.-F.; Zhang B.; Tang L. Single-molecular protein-based bioelectronics via electronic transport: fundamentals, devices and applications. Chem. Soc. Rev. 2023, 52, 5968–6002. 10.1039/D2CS00519K. [DOI] [PubMed] [Google Scholar]
- Sukegawa J.; Schubert C.; Zhu X.; Tsuji H.; Guldi D. M.; Nakamura E. Electron transfer through rigid organic molecular wires enhanced by electronic and electron–vibration coupling. Nat. Chem. 2014, 6, 899–905. 10.1038/nchem.2026. [DOI] [PubMed] [Google Scholar]
- Jiang Z.; You L.; Dou W.; Sun T.; Xu P. Effects of an electric field on the conformational transition of the protein: A molecular dynamics simulation study. Polymers 2019, 11, 282. 10.3390/polym11020282. [DOI] [PMC free article] [PubMed] [Google Scholar]
- Hekstra D. R.; White K. I.; Socolich M. A.; Henning R. W.; Šrajer V.; Ranganathan R. Electric-field-stimulated protein mechanics. Nature 2016, 540, 400–405. 10.1038/nature20571. [DOI] [PMC free article] [PubMed] [Google Scholar]
- Xie Y.; Liao C.; Zhou J. Effects of external electric fields on lysozyme adsorption by molecular dynamics simulations. Biophys. Chem. 2013, 179, 26–34. 10.1016/j.bpc.2013.05.002. [DOI] [PubMed] [Google Scholar]
- Boxer S. G. Stark realities. J. Phys. Chem. B 2009, 113, 2972–2983. 10.1021/jp8067393. [DOI] [PubMed] [Google Scholar]
- Mohrmann H.; Kube I.; Lorenz-Fonfria V. A.; Engelhard M.; Heberle J. Transient conformational changes of sensory rhodopsin II investigated by vibrational stark effect probes. J. Phys. Chem. B 2016, 120, 4383–4387. 10.1021/acs.jpcb.6b01900. [DOI] [PubMed] [Google Scholar]
- Giliberti V.; Polito R.; Ritter E.; Broser M.; Hegemann P.; Puskar L.; Schade U.; Zanetti-Polzi L.; Daidone I.; Corni S.; et al. Tip-enhanced infrared difference-nanospectroscopy of the proton pump activity of bacteriorhodopsin in single purple membrane patches. Nano Lett. 2019, 19, 3104–3114. 10.1021/acs.nanolett.9b00512. [DOI] [PMC free article] [PubMed] [Google Scholar]
- Dery S.; Gross E. Ir nanospectroscopy in catalysis research. Ambient Pressure Spectroscopy in Complex Chemical Environments 2021, 1396, 147–173. 10.1021/bk-2021-1396.ch007. [DOI] [Google Scholar]
- Sonntag M. D.; Klingsporn J. M.; Garibay L. K.; Roberts J. M.; Dieringer J. A.; Seideman T.; Scheidt K. A.; Jensen L.; Schatz G. C.; Van Duyne R. P. Single-molecule tip-enhanced Raman spectroscopy. J. Phys. Chem. C 2012, 116, 478–483. 10.1021/jp209982h. [DOI] [Google Scholar]
- Jaculbia R. B.; Imada H.; Miwa K.; Iwasa T.; Takenaka M.; Yang B.; Kazuma E.; Hayazawa N.; Taketsugu T.; Kim Y. Single-molecule resonance Raman effect in a plasmonic nanocavity. Nat. Nanotechnol. 2020, 15, 105–110. 10.1038/s41565-019-0614-8. [DOI] [PubMed] [Google Scholar]
- Mahapatra S.; Ning Y.; Schultz J. F.; Li L.; Zhang J.-L.; Jiang N. Angstrom scale chemical analysis of metal supported trans-and cis-regioisomers by ultrahigh vacuum tip-enhanced Raman mapping. Nano Lett. 2019, 19, 3267–3272. 10.1021/acs.nanolett.9b00826. [DOI] [PubMed] [Google Scholar]
- Pollard B.; Muller E. A.; Hinrichs K.; Raschke M. B. Vibrational nano-spectroscopic imaging correlating structure with intermolecular coupling and dynamics. Nat. Commun. 2014, 5, 3587. 10.1038/ncomms4587. [DOI] [PMC free article] [PubMed] [Google Scholar]
- Giliberti V.; Badioli M.; Nucara A.; Calvani P.; Ritter E.; Puskar L.; Aziz E. F.; Hegemann P.; Schade U.; Ortolani M.; et al. Heterogeneity of the transmembrane protein conformation in purple membranes identified by infrared nanospectroscopy. Small 2017, 13, 1701181. 10.1002/smll.201701181. [DOI] [PubMed] [Google Scholar]
- Liu Z.; Ding S.-Y.; Chen Z.-B.; Wang X.; Tian J.-H.; Anema J. R.; Zhou X.-S.; Wu D.-Y.; Mao B.-W.; Xu X.; et al. Revealing the molecular structure of single-molecule junctions in different conductance states by fishing-mode tip-enhanced Raman spectroscopy. Nat. Commun. 2011, 2, 305. 10.1038/ncomms1310. [DOI] [PMC free article] [PubMed] [Google Scholar]
- Zhang R.; Zhang Y.; Dong Z.; Jiang S.; Zhang C.; Chen L.; Zhang L.; Liao Y.; Aizpurua J.; Luo Y. e.; et al. Chemical mapping of a single molecule by plasmon-enhanced Raman scattering. Nature 2013, 498, 82–86. 10.1038/nature12151. [DOI] [PubMed] [Google Scholar]
- Zhang R.; Zhang X.; Wang H.; Zhang Y.; Jiang S.; Hu C.; Zhang Y.; Luo Y.; Dong Z. Distinguishing individual DNA bases in a network by non-resonant tip-enhanced Raman scattering. Angew. Chem. 2017, 129, 5653–5656. 10.1002/ange.201702263. [DOI] [PubMed] [Google Scholar]
- Cirera B.; Wolf M.; Kumagai T. Joule Heating in Single-Molecule Point Contacts Studied by Tip-Enhanced Raman Spectroscopy. ACS Nano 2022, 16, 16443–16451. 10.1021/acsnano.2c05642. [DOI] [PubMed] [Google Scholar]
- Kradolfer S.; Lipiec E.; Baldacchini C.; Bizzarri A. R.; Cannistraro S.; Zenobi R. Vibrational changes induced by electron transfer in surface bound azurin metalloprotein studied by tip-enhanced Raman spectroscopy and scanning tunneling microscopy. ACS Nano 2017, 11, 12824–12831. 10.1021/acsnano.7b07768. [DOI] [PubMed] [Google Scholar]
- Di Martino G.; Turek V.; Lombardi A.; Szabó I.; De Nijs B.; Kuhn A.; Rosta E.; Baumberg J. Tracking nanoelectrochemistry using individual plasmonic nanocavities. Nano Lett. 2017, 17, 4840–4845. 10.1021/acs.nanolett.7b01676. [DOI] [PubMed] [Google Scholar]
- Kaneko S.; Yasuraoka K.; Kiguchi M. Bias Voltage Induced Surface-Enhanced Raman Scattering Enhancement on the Single-Molecule Junction. J. Phys. Chem. C 2019, 123, 6502–6507. 10.1021/acs.jpcc.8b11595. [DOI] [Google Scholar]
- Wang M.; Wang T.; Ojambati O. S.; Duffin T. J.; Kang K.; Lee T.; Scheer E.; Xiang D.; Nijhuis C. A. Plasmonic phenomena in molecular junctions: Principles and applications. Nature Reviews Chemistry 2022, 6, 681–704. 10.1038/s41570-022-00423-4. [DOI] [PubMed] [Google Scholar]
- Cui L.; Liu B.; Vonlanthen D.; Mayor M.; Fu Y.; Li J.-F.; Wandlowski T. In situ gap-mode Raman spectroscopy on single-crystal Au (100) electrodes: tuning the torsion angle of 4, 4-biphenyldithiols by an electrochemical gate field. J. Am. Chem. Soc. 2011, 133, 7332–7335. 10.1021/ja2020185. [DOI] [PubMed] [Google Scholar]
- Kos D.; Di Martino G.; Boehmke A.; de Nijs B.; Berta D.; Földes T.; Sangtarash S.; Rosta E.; Sadeghi H.; Baumberg J. J. Optical probes of molecules as nano-mechanical switches. Nat. Commun. 2020, 11, 5905. 10.1038/s41467-020-19703-y. [DOI] [PMC free article] [PubMed] [Google Scholar]
- Bi H.; Palma C.-A.; Gong Y.; Hasch P.; Elbing M.; Mayor M.; Reichert J.; Barth J. V. Voltage-driven conformational switching with distinct Raman signature in a single-molecule junction. J. Am. Chem. Soc. 2018, 140, 4835–4840. 10.1021/jacs.7b12818. [DOI] [PubMed] [Google Scholar]
- Barth A.; Zscherp C. What vibrations tell about proteins. Q. Rev. Biophys. 2002, 35, 369–430. 10.1017/S0033583502003815. [DOI] [PubMed] [Google Scholar]
- Lorenz-Fonfria V. A. Infrared difference spectroscopy of proteins: from bands to bonds. Chem. Rev. 2020, 120, 3466–3576. 10.1021/acs.chemrev.9b00449. [DOI] [PubMed] [Google Scholar]
- Zhang J.; Yan Y.-B. Probing conformational changes of proteins by quantitative second-derivative infrared spectroscopy. Analytical biochemistry 2005, 340, 89–98. 10.1016/j.ab.2005.01.053. [DOI] [PubMed] [Google Scholar]
- Acharyya A.; DiGiuseppi D.; Stinger B. L.; Schweitzer-Stenner R.; Vaden T. D. Structural destabilization of azurin by imidazolium chloride ionic liquids in aqueous solution. J. Phys. Chem. B 2019, 123, 6933–6945. 10.1021/acs.jpcb.9b04113. [DOI] [PubMed] [Google Scholar]
- Jiang X.; Zaitseva E.; Schmidt M.; Siebert F.; Engelhard M.; Schlesinger R.; Ataka K.; Vogel R.; Heberle J. Resolving voltage-dependent structural changes of a membrane photoreceptor by surface-enhanced IR difference spectroscopy. Proc. Natl. Acad. Sci. U. S. A. 2008, 105, 12113–12117. 10.1073/pnas.0802289105. [DOI] [PMC free article] [PubMed] [Google Scholar]
- Birdsall E. R.; Petti M. K.; Saraswat V.; Ostrander J. S.; Arnold M. S.; Zanni M. T. Structure changes of a membrane polypeptide under an applied voltage observed with surface-enhanced 2D IR spectroscopy. journal of physical chemistry letters 2021, 12, 1786–1792. 10.1021/acs.jpclett.0c03706. [DOI] [PMC free article] [PubMed] [Google Scholar]
- Schwartz J. J.; Jakob D. S.; Centrone A. A guide to nanoscale IR spectroscopy: resonance enhanced transduction in contact and tapping mode AFM-IR. Chem. Soc. Rev. 2022, 51, 5248–5267. 10.1039/D2CS00095D. [DOI] [PubMed] [Google Scholar]
- Venanzi T.; Giliberti V.; Temperini M.; Sotgiu S.; Polito R.; Mattioli F.; Pitanti A.; Mišeikis V.; Coletti C.; Roddaro S.; et al. Mid-infrared photocurrent nano-spectroscopy exploiting the thermoelectric effect in graphene. Appl. Phys. Lett. 2023, 123, 153509. 10.1063/5.0162631. [DOI] [Google Scholar]
- Lanyi J. K. Bacteriorhodopsin. Annu. Rev. Physiol. 2004, 66, 665–688. 10.1146/annurev.physiol.66.032102.150049. [DOI] [PubMed] [Google Scholar]
- Jin Y.; Friedman N.; Sheves M.; He T.; Cahen D. Bacteriorhodopsin (bR) as an electronic conduction medium: Current transport through bR-containing monolayers. Proc. Natl. Acad. Sci. U. S. A. 2006, 103, 8601–8606. 10.1073/pnas.0511234103. [DOI] [PMC free article] [PubMed] [Google Scholar]
- Bostick C. D.; Mukhopadhyay S.; Pecht I.; Sheves M.; Cahen D.; Lederman D. Protein bioelectronics: A review of what we do and do not know. Rep. Prog. Phys. 2018, 81, 026601 10.1088/1361-6633/aa85f2. [DOI] [PubMed] [Google Scholar]
- Amdursky N.; Marchak D.; Sepunaru L.; Pecht I.; Sheves M.; Cahen D. Electronic transport via proteins. Adv. Mater. 2014, 26, 7142–7161. 10.1002/adma.201402304. [DOI] [PubMed] [Google Scholar]
- Fereiro J. A.; Bendikov T.; Pecht I.; Sheves M.; Cahen D. Protein binding and orientation matter: Bias-induced conductance switching in a mutated azurin junction. J. Am. Chem. Soc. 2020, 142, 19217–19225. 10.1021/jacs.0c08836. [DOI] [PMC free article] [PubMed] [Google Scholar]
- Keilmann F.; Hillenbrand R.; Zayats A.; Richard D. Near-field nanoscopy by elastic light scattering from a tip. Nano-optics and near-field optical microscopy 2009, 235–265. [Google Scholar]
- Sifat A. A.; Jahng J.; Potma E. O. Photo-induced force microscopy (PiFM)–principles and implementations. Chem. Soc. Rev. 2022, 51, 4208–4222. 10.1039/D2CS00052K. [DOI] [PubMed] [Google Scholar]
- Takashima K.; Furukawa Y. Vibrational Stark effect (VSE) on the infrared spectrum of a poly (methyl methacrylate) thin film. Vib. Spectrosc. 2015, 78, 54–59. 10.1016/j.vibspec.2015.03.006. [DOI] [Google Scholar]
- Chattopadhyay A.; Boxer S. G. Vibrational Stark effect spectroscopy. J. Am. Chem. Soc. 1995, 117, 1449–1450. 10.1021/ja00109a038. [DOI] [Google Scholar]
- Levinson N. M.; Fried S. D.; Boxer S. G. Solvent-induced infrared frequency shifts in aromatic nitriles are quantitatively described by the vibrational Stark effect. J. Phys. Chem. B 2012, 116, 10470–10476. 10.1021/jp301054e. [DOI] [PMC free article] [PubMed] [Google Scholar]
- Schneider S. H.; Boxer S. G. Vibrational stark effects of carbonyl probes applied to reinterpret IR and raman data for enzyme inhibitors in terms of electric fields at the active site. J. Phys. Chem. B 2016, 120, 9672–9684. 10.1021/acs.jpcb.6b08133. [DOI] [PMC free article] [PubMed] [Google Scholar]
- Park E. S.; Boxer S. G. Origins of the sensitivity of molecular vibrations to electric fields: Carbonyl and nitrosyl stretches in model compounds and proteins. J. Phys. Chem. B 2002, 106, 5800–5806. 10.1021/jp0203043. [DOI] [Google Scholar]
- Andrews S. S.; Boxer S. G. Vibrational stark effects of nitriles I. Methods and experimental results. J. Phys. Chem. A 2000, 104, 11853–11863. 10.1021/jp002242r. [DOI] [Google Scholar]
- Fried S. D.; Boxer S. G. Measuring electric fields and noncovalent interactions using the vibrational Stark effect. Accounts of chemical research 2015, 48, 998–1006. 10.1021/ar500464j. [DOI] [PMC free article] [PubMed] [Google Scholar]
- Fried S. D.; Zheng C.; Mao Y.; Markland T. E.; Boxer S. G. Solvent Organization and Electrostatics Tuned by Solute Electronic Structure: Amide versus Non-Amide Carbonyls. J. Phys. Chem. B 2022, 126, 5876–5886. 10.1021/acs.jpcb.2c03095. [DOI] [PMC free article] [PubMed] [Google Scholar]
- Lu F.; Jin M.; Belkin M. A. Tip-enhanced infrared nanospectroscopy via molecular expansion force detection. Nat. Photonics 2014, 8, 307–312. 10.1038/nphoton.2013.373. [DOI] [Google Scholar]
- Aoki H.; Mori K.; Takahashi T.; Ito S. Quantitative analysis of end-to-end distance of single polymer chain in ultra-thin film by super-resolution fluorescence imaging. Chem. Phys. 2013, 419, 54–58. 10.1016/j.chemphys.2012.12.026. [DOI] [Google Scholar]
- Wübbenhorst M.; Murray C.; Dutcher J. Dielectric relaxations in ultrathin isotactic PMMA films and PS-PMMA-PS trilayer films. Eur. Phys. J. E 2003, 12, 109–112. 10.1140/epjed/e2003-01-025-1. [DOI] [PubMed] [Google Scholar]
- Li B.; Zhang S.; Andre J. S.; Chen Z. Relaxation behavior of polymer thin films: Effects of free surface, buried interface, and geometrical confinement. Prog. Polym. Sci. 2021, 120, 101431. 10.1016/j.progpolymsci.2021.101431. [DOI] [Google Scholar]
- Kazarian S. G.; Vincent M. F.; Bright F. V.; Liotta C. L.; Eckert C. A. Specific intermolecular interaction of carbon dioxide with polymers. J. Am. Chem. Soc. 1996, 118, 1729–1736. 10.1021/ja950416q. [DOI] [Google Scholar]
- Kawahara K.; Matsuno H.; Tanaka K. Aggregation States and Segmental Dynamics of Poly (methyl methacrylate) in Nanofiber Mats. Langmuir 2023, 39, 7192–7200. 10.1021/acs.langmuir.3c00698. [DOI] [PubMed] [Google Scholar]
- Guidotti G. Membrane proteins. Annual review of biochemistry 1972, 41, 731–752. 10.1146/annurev.bi.41.070172.003503. [DOI] [PubMed] [Google Scholar]
- Zhang X. C.; Li H. Interplay between the electrostatic membrane potential and conformational changes in membrane proteins. Protein Sci. 2019, 28, 502–512. 10.1002/pro.3563. [DOI] [PMC free article] [PubMed] [Google Scholar]
- Felder C. E.; Prilusky J.; Silman I.; Sussman J. L. A server and database for dipole moments of proteins. Nucleic acids research 2007, 35, W512–W521. 10.1093/nar/gkm307. [DOI] [PMC free article] [PubMed] [Google Scholar]
- Marsh D.; Pali T. Infrared dichroism from the x-ray structure of bacteriorhodopsin. Biophysical journal 2001, 80, 305–312. 10.1016/S0006-3495(01)76015-8. [DOI] [PMC free article] [PubMed] [Google Scholar]
- Knapp H. F.; Mesquida P.; Stemmer A. Imaging the surface potential of active purple membrane. Surface and Interface Analysis: An International Journal devoted to the development and application of techniques for the analysis of surfaces, interfaces and thin films 2002, 33, 108–112. 10.1002/sia.1172. [DOI] [Google Scholar]
- Payam A. F.; Ramos J. R.; Garcia R. Molecular and nanoscale compositional contrast of soft matter in liquid: interplay between elastic and dissipative interactions. ACS Nano 2012, 6, 4663–4670. 10.1021/nn2048558. [DOI] [PubMed] [Google Scholar]
- Berweger S.; Nguyen D. M.; Muller E. A.; Bechtel H. A.; Perkins T. T.; Raschke M. B. Nano-chemical infrared imaging of membrane proteins in lipid bilayers. J. Am. Chem. Soc. 2013, 135, 18292–18295. 10.1021/ja409815g. [DOI] [PubMed] [Google Scholar]
- Karjalainen E.-L.; Barth A. Vibrational Coupling between Helices Influences the Amide I Infrared Absorption of Proteins: Application to Bacteriorhodopsin and Rhodopsin. J. Phys. Chem. B 2012, 116, 4448–4456. 10.1021/jp300329k. [DOI] [PubMed] [Google Scholar]
- Akinlaja J.; Sachs F. The breakdown of cell membranes by electrical and mechanical stress. Biophysical journal 1998, 75, 247–254. 10.1016/S0006-3495(98)77511-3. [DOI] [PMC free article] [PubMed] [Google Scholar]
- Kotnik T.; Rems L.; Tarek M.; Miklavčič D. Membrane electroporation and electropermeabilization: mechanisms and models. Annual review of biophysics 2019, 48, 63–91. 10.1146/annurev-biophys-052118-115451. [DOI] [PubMed] [Google Scholar]
- van Uitert I.; Le Gac S.; van den Berg A. The influence of different membrane components on the electrical stability of bilayer lipid membranes. Biochimica et Biophysica Acta (BBA)-Biomembranes 2010, 1798, 21–31. 10.1016/j.bbamem.2009.10.003. [DOI] [PubMed] [Google Scholar]
- Della Valle E.; Marracino P.; Pakhomova O.; Liberti M.; Apollonio F. Nanosecond pulsed electric signals can affect electrostatic environment of proteins below the threshold of conformational effects: The case study of SOD1 with a molecular simulation study. PLoS One 2019, 14, e0221685 10.1371/journal.pone.0221685. [DOI] [PMC free article] [PubMed] [Google Scholar]
- Daidone I.; Aschi M.; Zanetti-Polzi L.; Di Nola A.; Amadei A. On the origin of IR spectral changes upon protein folding. Chem. Phys. Lett. 2010, 488, 213–218. 10.1016/j.cplett.2010.02.020. [DOI] [Google Scholar]
- Dencher N. A.; Sass H. J.; Büldt G. Water and bacteriorhodopsin: structure, dynamics, and function. Biochimica et Biophysica Acta (BBA)-Bioenergetics 2000, 1460, 192–203. 10.1016/S0005-2728(00)00139-0. [DOI] [PubMed] [Google Scholar]
- Bera S.; Fereiro J. A.; Saxena S. K.; Chryssikos D.; Majhi K.; Bendikov T.; Sepunaru L.; Ehre D.; Tornow M.; Pecht I.; et al. Near-Temperature-Independent Electron Transport Well beyond Expected Quantum Tunneling Range via Bacteriorhodopsin Multilayers. J. Am. Chem. Soc. 2023, 145, 24820–24835. [DOI] [PMC free article] [PubMed] [Google Scholar]
- Heberle J. Proton transfer reactions across bacteriorhodopsin and along the membrane. Biochimica et Biophysica Acta (BBA)-Bioenergetics 2000, 1458, 135–147. 10.1016/S0005-2728(00)00064-5. [DOI] [PubMed] [Google Scholar]
- Lazarova T.; Sanz C.; Querol E.; Padrós E. Fourier transform infrared evidence for early deprotonation of Asp85 at alkaline pH in the photocycle of bacteriorhodopsin mutants containing E194Q. Biophys. J. 2000, 78, 2022–2030. 10.1016/S0006-3495(00)76749-X. [DOI] [PMC free article] [PubMed] [Google Scholar]
- Bombarda E.; Becker T.; Ullmann G. M. Influence of the membrane potential on the protonation of bacteriorhodopsin: insights from electrostatic calculations into the regulation of proton pumping. J. Am. Chem. Soc. 2006, 128, 12129–12139. 10.1021/ja0619657. [DOI] [PubMed] [Google Scholar]
- Lv Y.; Liang D.; Lu S.; Aurbach D.; Xiang Y. Unidirectional electron injection and accelerated proton transport in bacteriorhodopsin based Bio-pn junctions. Biosens. Bioelectron. 2021, 173, 112811. 10.1016/j.bios.2020.112811. [DOI] [PubMed] [Google Scholar]
Associated Data
This section collects any data citations, data availability statements, or supplementary materials included in this article.