

Abstract
Background and Purpose
Multiple system atrophy (MSA) is a progressive, adult‐onset neurodegenerative disorder clinically characterized by combinations of autonomic failure, parkinsonism, cerebellar ataxia and pyramidal signs. Although a few genetic factors have been reported to contribute to the disease, its mutational profiles have not been systemically studied.
Methods
To address the genetic profiles of clinically diagnosed MSA patients, exome sequencing and triplet repeat detection was conducted in 205 MSA patients, including one familial case. The pathogenicity of variants was determined according to the American College of Medical Genetics and Genomics and the Association for Molecular Pathology guidelines.
Results
In the familial patient, a novel heterozygous COQ2 pathogenic variant (p.Ala351Thr) was identified in the MSA pedigree. In the sporadic patients, 29 pathogenic variants were revealed in 21 genes, and the PARK7 p.Ala104Thr variant was significantly associated with MSA (p = 0.0018). Moreover, burden tests demonstrated that the pathogenic variants were enriched in cerebellar ataxia‐related genes in patients. Furthermore, repeat expansion analyses revealed that two patients carried the pathogenic CAG repeat expansion in the CACNA1A gene (SCA6), one patient carried the (ACAGG)exp/(ACAGG)exp expansion in RFC1 and one carried the GAA‐pure expansion in FGF14 gene.
Conclusion
In conclusion, a novel COQ2 pathogenic variant was identified in a familial MSA patient, and repeat expansions in CACNA1A, RFC1 and FGF14 gene were detected in four sporadic patients. Moreover, a PARK7 variant and the burden of pathogenic variants in cerebellar ataxia‐related genes were associated with MSA.
Keywords: multiple system atrophy, COQ2, PARK7, spinocerebellar ataxia repeat 6, RFC1 and FGF14 repeats
INTRODUCTION
Multiple system atrophy (MSA) is a progressive, adult‐onset neurodegenerative disorder clinically characterized by combinations of autonomic failure, parkinsonism, cerebellar ataxia and pyramidal signs. The pathological hallmark of MSA is α‐synuclein‐positive glial cytoplasmic inclusion in the oligodendroglia [1, 2]. Clinical diagnoses of probable and possible MSA have been standardized by international criteria, which also defined two categories based on the predominant phenotype: MSA‐P with parkinsonism signs and MSA‐C with cerebellar features [3]. The average age at onset (AAO) is approximately 55 years, and the disease follows a rapid clinical course, progressing from initial symptom onset to death within typically 6–10 years [4]. To date, our understanding of the aetiology and mechanism of MSA remains limited and there is no effective therapy.
Whilst MSA occurs mostly in sporadic cases, emerging evidence has suggested that genetic variants may increase its susceptibility [5]. In 2013, a homozygous pathogenic variant (M128V‐V393A/M128V‐V393A) and compound heterozygous variants (R387X/ V393A) in COQ2 (OMIM 609825) were identified in two multiplex Japanese families. In addition, a common (V393A) and multiple rare variants in COQ2 were associated with sporadic MSA in Japanese and Chinese [6, 7]. Moreover, the enzyme activity of parahydroxybenzoate‐polyprenyl transferase (encoded by COQ2 and essential for the biosynthesis of coenzyme Q10, CoQ10) was reduced in MSA but not in other parkinsonian disorders [8, 9, 10]. However, these results were not confirmed in other populations [11], and a large genome‐wide association study (GWAS) has refuted the association of COQ2 and SNCA variants with MSA [12]. Moreover, even the EDN1, MAPT, FBXO47, ELOVL7, ZIC1 and ZIC4 variants proposed to be associated with MSA in the GWAS study were not replicated by a large Chinese study [13, 14]. Another recent GWAS study showed genetic aetiology between MSA and inflammatory bowel disease with an important role of the C7 gene in both phenotypes [15], but the results have not been validated in other ethnicities. In addition, variants in other genes associated with Parkinson's disease (PD), including SNCA [16, 17], GBA [18], PINK1 [19] and LRRK2 [20, 21, 22], have also been investigated for association with MSA, but the results were controversial.
In addition, MSA and spinocerebellar ataxias (SCAs) are both progressive neurodegenerative disorders which can manifest cerebellar dysfunctions and parkinsonism‐related symptoms but are clinically different, such as in age at onset and progression. There is a diagnostic dilemma resulting from analogous manifestations between MSA and SCAs [23, 24]. Most of the SCAs, for example SCA1, SCA2, SCA3, SCA6, SCA17, dentatorubral‐pallidoluysian atrophy (DRPLA) and Friedreich ataxia (FRDA), are polyglutamine diseases caused by expansions of the trinucleotide repeats. A study showed a higher percentage of longer normal SCA1 allele repeats in MSA‐C compared to MSA‐P [25]. Several other studies suggested an association between MSA and repeat expansions in SCA6, SCA8 and SCA17 [24, 26, 27, 28]. Thus, studies indicate that genetic testing for SCAs should be included for patients with MSA, especially for the MSA‐C subtype. On the other hand, abnormal repeat expansions in RFC1 [29] and FGF14 [30, 31, 32] genes were also reported in MSA patients.
All genetic association studies in MSA carried out to date were conducted in comparatively small patient cohorts with a limited number of genetic markers. Large‐scale exome/genome sequencing has not been reported. Here, whole‐exome sequencing (WES) and the SCAs, RFC1 and FGF14 repeat expansion analyses were simultaneously performed in a Chinese cohort of 205 clinically diagnosed MSA patients (one familial and 204 sporadic). Several variants associated with the disease have been identified, highlighting the importance of genetic analysis for the disease aetiology.
MATERIALS AND METHODS
Study design and participants
A total of 204 sporadic and 1 familial MSA patients were recruited from May 2017 to January 2022 in Xuanwu Hospital of Capital Medical University. All the patients were evaluated by at least one senior neurologist and the diagnosis was based on the diagnostic guidelines [3]. Moreover, motor symptoms were assessed using the Unified Multiple System Atrophy Rating Scale (UMSARS) I, II, IV. Non‐motor symptoms were assessed using the Non‐Motor Symptoms Scale (NMSS), Scales for Outcomes in Parkinson's Disease—Autonomic (SCOPA‐AUT), Montreal Cognitive Assessment (MoCA), Rapid Eye Movement Sleep Behaviour Disorder Screening Questionnaire—Hong Kong (RBDQ‐HK), Hamilton Depression Scale (HAMD) and Hamilton Anxiety Scale (HAMA). In addition, 552 healthy subjects were assessed as normal controls.
This study was approved by the Institutional Review Board and Ethics Committee of the Xuanwu Hospital of Capital Medical University. Written informed consent was obtained from each participant or their legal guardian before they were included in the study.
Exome sequencing
For exome sequencing, whole‐blood‐derived DNA from all the recruited subjects was captured to generate a sequencing library using the Agilent SureSelect Human All Exon V6 Kit (Agilent Technologies, Santa Clara, CA, USA) according to the manufacturer's protocol. The prepared libraries were sequenced on the HiSeq‐2000 platform (Illumina, San Diego, CA, USA). The sequenced reads were aligned to the human genome (GRCh37/hg19). Reads were then aligned to the targeted regions and collected for single nucleotide polymorphism (SNP) calling and subsequent analysis using the Burrows–Wheeler Aligner software. The low‐quality variations (quality control preprocessing including adaptor reads ratio, low‐quality reads ratio, cycle number of AT or GC severe separation, ratio of AT or GC separation, quality score (Q20/Q30) and GC content) were filtered out. Variants were annotated using Realigner Target Creator in the Genome Analysis Toolkit and the ANNOVAR [33] program, and all variants were annotated for minor‐allele frequency (MAF) variant effect; Exome Aggregation Consortium (http://exac.broadinstitute.org/) and Genome Aggregation Database (https://gnomad‐sg.org/) were employed as the sources of reference variant frequencies. SIFT, PolyPhen‐2 and Rare Exome Variant Ensemble Learner (REVEL) pathogenicity prediction algorithms were utilized to estimate the variants' effect on protein function.
Bioinformatic analysis of the exome sequencing
According to the American College of Medical Genetics and Genomics and the Association for Molecular Pathology (ACMG/AMP) criteria [34] and updated advice in ClinGen [35], the potential rare (MAF <0.01) coding variants were defined based on the Bayesian classification framework [36]. In general, all the variants were evaluated via the population frequency data, literature/database query (including specificity of phenotype or family history, case–control data/rare variant, segregation data, de novo occurrence, allelic data, experimental evidence), variant‐type‐specific analysis, pathogenicity prediction algorithms and hot spot and/or functional domain evidence. Finally, each variant was classified into one of the following five categories: pathogenic (P), likely pathogenic (LP), uncertain significance (VUS), likely benign (LB) and benign (B).
The rare pathogenic coding variants in genes categorized into the following types were analysed for their association with MSA. As listed by Online Mendelian Inheritance in Man (OMIM, https://omim.org), GeneReviews online website (https://www.ncbi.nlm.nih.gov/books/) and reliable literatures, 85 genes were listed to be associated with MSA, including 13 CoQ10 biosynthetic pathway‐related genes, 15 PD‐related genes and 57 cerebellar ataxia‐related genes. In addition, genes involved in other popular neurodegenerative disorders, including Alzheimer's disease (AD), amyotrophic lateral sclerosis (ALS), hereditary spastic paraplegia (HSP), dystonia, neurodegeneration with brain iron accumulation and cardiovascular disease, were analysed. In sum, a total of 216 genes were analysed (Appendix S1).
Exome‐wide copy number variants (CNVs) analysis
Exome‐wide copy number variants (CNVs) were identified with the CNVkit [37]. High‐candidate CNVs were indicated by the following criteria: (1) CNV size >10 kb and <1 Mb; (2) CNVs across exon probes >10; (3) log 2 ratios <−1.1 for deletion and >1.1 for duplication; (4) only keep high‐level amplifications (five copies or more) and homozygous deletions (0 copies). CNVs with 1 bp overlap amongst different individuals were merged using BEDTools [38]. The frequency of CNVs in healthy controls was calculated by the proportion of individuals with CNVs located in the merged CNV region.
Repeat expansion analysis for SCA loci
All the MSA patients were tested for pathogenically expanded repeat insertions in genes (ATXN1, ATXN2, ATXN3, CACNA1A, ATXN7, ATXN8OS, PPP2R2B, TBP, ATN1 and FXN) known to cause SCAs. The CAG/CTG repeats in each gene were amplified using fluorescence‐based polymerase chain reaction (PCR) amplification [39]. The amplified fluorescence‐labelled PCR products were analysed by capillary electrophoresis on an ABI sequencer (Applied Biosystems). The repeat lengths were calculated using the fragment analysis tool in the GeneMarker® HTS (USA) and confirmed by Sanger sequencing using unlabelled primers (Appendix S2).
Repeat expansion analysis for FGF14
The FGF14 repeat locus was amplified by long‐range flanking PCR. The number of repeat units was estimated by means of agarose gel electrophoresis in a 3730xL Genetic Analyzer (Applied Biosystems). The motif of the repeat locus in patients and controls who had large amplification products on long‐range flanking PCR was analysed by repeat‐primed PCR to ascertain the presence of a GAA repeat expansion. Allele sizes were determined using GeneScan 1200 LIZ Size Standard (Applied Biosystems).
Repeat expansion analysis for RFC1
The polymerase chain reaction (PCR) assays were performed as previously described [29]. Briefly, DNA was tested by long‐range flanking PCR and repeat‐primed PCR in RFC1. Long‐range flanking PCR was utilized for the preliminary screening, and repeat‐primed PCR was performed for qualitative assessment of motifs, including (AAAAG)exp, (AAAGGG)exp, (AAAGG)exp, (AAGGG)exp, (ACAGG)exp and (AGGGG)exp. The PCR products were subjected to capillary electrophoresis utilizing the 3730xL Genetic Analyzer (Applied Biosystems). Allele sizes were determined using GeneScan 1200 LIZ Size Standard (Applied Biosystems).
Statistical analysis
Low‐frequency and common variants located in the coding region in all genes were tested for deviations from Hardy–Weinberg equilibrium using PLINK [40]. Nominal p values were corrected for the number of variants tested using Bonferroni correction. The burden test for pathogenic rare coding variants was performed using the sequence kernel association test (SKAT‐O) with EPACTS 3.2.6 software (https://csg.sph.umich.edu/kang/epacts/download/).
Normal distribution was evaluated using the Shapiro–Wilk test. All data were compared between groups according to the normality of their distributions. The t test was used for normally distributed data, and the Kruskal–Wallis test was used for skewed data to compare differences between groups. All statistical analyses were performed using IBM SPSS Statistics® v22.0.0.0 (2013, SPSS Inc., Chicago, IL, USA) and GraphPad Prism® v6.0 (2009, GraphPad Software Inc., La Jolla, CA, USA). p values less than 0.05 were considered statistically significant.
RESULTS
Demographic data of the participants
The demographic and clinical features of the participants are listed in Table 1. All the sporadic patients received detailed clinical interviews and physical examinations. The mean AAO of motor symptoms was 56.1 ± 8.0 years, the average age at cohort entry was 59.2 ± 8.3 years and the average age at first diagnosis was 58.2 ± 9.3 years. The disease durations were 3.0 ± 2.6 years. In addition, 44.6% (n = 91) of patients had orthostatic hypotension and 79.9% (n = 163) of patients had a urinary disorder. Amongst all the patients, 63 (30.8%) were classified as MSA‐P and 141 (69.1%) as MSA‐C subtype. For treatment, 7.4% (n = 15) of patients were responsive to l‐dopamine, 8% (n = 18) were responsive for short time and 79.9% (n = 163) were irresponsive. The patients had severe non‐motor symptoms which were assessed by scales including the NMSS (40.1 ± 24.8), SCOPA‐AUT (14.4 ± 9.4), MoCA (21.7 ± 5.5), RBDQ‐HK (24.3 ± 16.8), HAMD (7.4 ± 5.9) and HAMA (8.0 ± 5.8). Moreover, most of the patients had severe motor symptoms (part I 16.3 ± 9.8, part II 19.8 ± 10.9 and part IV 2 (2, 3) (median, 25th to 75th percentile)).
TABLE 1.
The demographic and clinical features of the study participants.
| Clinical features | MSA (n = 204) | Controls (n = 552) |
|---|---|---|
| Demographic data | ||
| Gender, n (%) | ||
| Male | 112 (54.9%) | 217 (39.3%) |
| Female | 92 (45.1%) | 335 (60.7%) |
| Education, years ± SD | 9.6 ± 4.0 | 10.8 ± 3.3 |
| Age at motor onset, mean ± SD | 56.1 ± 8.0 | NA |
| Age at cohort entry, mean ± SD | 59.2 ± 8.3 (35,84) | 69.8 ± 7.7 (51,93) |
| Age at first diagnosis, mean ± SD | 58.2 ± 9.3 | NA |
| Disease duration, mean ± SD | 3.0 ± 2.6 | NA |
| Orthostatic hypotension (yes, %) | 91, 44.6% | NA |
| Urinary disorder (yes, %) | 163, 79.9% | 255, 46.2% |
| Disease subtypes, n (%) | ||
| MSA‐C | 141, 69.1% | NA |
| MSA‐P | 63, 30.8% | NA |
| Response to l‐dopamine (yes, %) | ||
| Effective | 15, 7.4% | NA |
| Initially effective | 18, 8.8% | NA |
| Not effective | 163, 79.9% | NA |
| Not taking l‐dopamine | 8, 3.9% | NA |
| Clinical assessment | ||
| NMSS | 40.1 ± 24.8 | 20.4 ± 17.6 |
| SCOPA‐AUT | 14.4 ± 9.4 | 4.8 ± 4.3 |
| MoCA | 21.7 ± 5.5 | 24.4 ± 3.9 |
| RBDQ‐HK | 24.3 ± 16.8 | 8.5 ± 9.8 |
| HAMD | 7.4 ± 5.9 | 3.5 ± 4.1 |
| HAMA | 8.0 ± 5.8 | 5.4 ± 4.8 |
| UMSARS | ||
| Part I | 16.3 ± 9.8 | 0.5 ± 1.4 |
| Part II | 19.8 ± 10.9 | 0.2 ± 0.9 |
| Part IV (median (25th, 75th percentile) | 2 (2, 3) | 1 (1, 1) |
Abbreviations: HAMA, Hamilton Anxiety Scale; HAMD, Hamilton Depression Scale; MoCA, Montreal Cognitive Assessment; MSA, multiple system atrophy; NMSS, Non‐Motor Symptoms Scale; RBDQ‐HK, Rapid Eye Movement Sleep Behaviour Disorder Questionnaire—Hong Kong; SCOPA‐AUT, Scales for Outcomes in Parkinson's Disease—Autonomic Questionnaire; UMSARS, Unified Multiple System Atrophy Rating Scale.
Familial MSA patients caused by a heterozygous pathogenic variant in COQ2
In our study, a heterozygous c.901G>A (p.Ala301Thr) variant was found in a family of five patients with MSA (III‐4 and III‐5) or prominent idiopathic rapid eye movement sleep behaviour disorder (RBD) symptoms (II‐3, II‐4 and IV‐1) (Figure 1a). The 47‐year‐old proband (III‐4) mainly presented with parkinsonism (rigidity, bradykinesia and postural instability), autonomic (orthostatic hypotension, diarrhoea, frequent and urgent urination) and non‐motor symptoms (sleep movement disorder, fatigue, cognition decline, depression and anxiety) since his 20s. Brain magnetic resonance imaging (MRI) showed mild cerebellar and brainstem atrophy (Figure 1b). His 45‐year‐old younger brother (III‐5) displayed more severe autonomic symptoms (orthostatic hypotension, diarrhoea, frequent urination) and non‐motor symptoms (polysomnography confirmed RBD, fatigue, depression and anxiety) at onset since his 20s. With the disease progression, parkinsonian (prominent postural instability and mild tremor) and cerebellar (ataxia and slurred speech) symptoms occurred in the recent 2 years. In addition, II‐4 (the proband's mother) had only RBD symptoms since her 30s and did not develop other symptoms; she died at 74 years old. Her CoQ10 level in serum was 463 μg/L, which was close to the lower normal level (normal range 400–1600 μg/L). Similarly, II‐3 (the proband's uncle) and IV‐1 (the proband's son) had complained about sleep movement disorder and urination function disturbance since youth. However, II‐3 did not develop motor symptoms before death. Further, IV‐2 (the proband's niece) carried the variant but did not display any symptoms at 16 years old. For treatment, a large dose of CoQ10 supplement (200–500 mg/day) was given to III‐4, III‐5 and IV‐1 4 years ago, and the motor symptoms were alleviated significantly in III‐4 and III‐5 (Figure 1c). The serum CoQ10 concentrations were all in the normal range in these three patients.
FIGURE 1.

The genetic and clinical characteristics of the family with clinically diagnosed MSA. (a) The pedigree chart and Sanger sequencing. (b) The brain MRI of III‐4 and III‐5. (c) The demographic features, motor and non‐motor symptoms and medication condition of four symptomatic patients and one pre‐symptomatic subject in the family. (d) Structure of the COQ2. AAO, age at onset; MRI, magnetic resonance imaging; MSA, multiple system atrophy; RBD, rapid eye movement sleep behaviour disorder.
As for the variant, the COQ2 p.Ala351Thr was categorized as LP according to ACMG/AMP guidelines [34] and Sequence Variant Interpretation (SVI) advice: two pathogenic moderate (PM) and two pathogenic supporting (PP) pieces of evidence. The details were as follows:
PP4_Moderate (2 points): highly specific phenotypes in patients carrying variants in COQ2, but not other genes related to CoQ10 deficiency, with good response to CoQ10 supplement.
PM1 (2 points): well‐studied functional domain without benign variation, as indicated by the 3D structural analysis (Figure 1d).
PM2_Supporting (1 point): absence in multiple ethnic populations in the Genome Aggregation Database, 1000 Genomes Project or Exome Aggregation Consortium.
PP1 (1 point): three segregations.
Pathogenic rare variants and CNVs in genes related to MSA
Exome sequencing was performed in DNA samples from all sporadic MSA patients and controls. The overall sequencing data size was 13.44 Gb in the cases and 14.65 Gb in controls. The mean sequencing depth was 124.64× in cases and 129.75× in controls. The mean coverage of reads with a sequencing depth of ≥20× was 96.61% in cases and 95.15% in controls. The on‐target rate was 52.05% in cases and 53.69% in controls (Appendix S3).
As described in Table 2, in total 29 LP/P heterozygous variants were found in 21 of 80 known MSA‐associated genes, including three CoQ10‐related genes (COQ2, COQ8A, COQ8B), seven parkinsonism‐related genes (PARK7, ATP13A2, PINK1, GBA, LRRK2, VPS13C, PRKN) and 11 cerebellar‐ataxia‐related genes (COX20, POLR3A, TPP1, CAPN1, ATM, SACS, PNKP, XRCC1, SYNE1, RNF216, SETX). According to OMIM, LRRK2 is associated with the autosomal dominantly inherited disease (PARK8); COQ2 and SETX are associated with autosomal dominant/autosomal recessive conditions, and the remaining 18 genes are all associated with autosomal recessive conditions. Of all the variants, 51.7% were missense, 24.1% were frameshift, 13.8% were stop_gained and 10.3% were splicing variants. According to the ACMG/AMP (2015) classification, 10 variants were defined as P and 19 as LP, and 19 were reported in the ClinVar database. The association study showed that only one pathogenic variant, PARK7 p.Ala104Thr, was significantly associated with MSA (p = 0.0018). All the five cases (four female and one male) carrying the variant were diagnosed with MSA‐C, and the AAOs ranged from 44 to 74 years (Table 3).
TABLE 2.
LP/P variants identified in MSA‐related genes.
| Gene | AA changes | MAF | Variant classification | ACMG/AMP evidence | Frequency | p value | |
|---|---|---|---|---|---|---|---|
| Case | Control | ||||||
| CoQ10‐deficiency‐related genes (n = 4) | |||||||
| COQ2 | R221* | LP | PVS1 + PM2_PP | 1 | 0 | 0.0998 | |
| COQ8A | S616Lfs*114 | 6.40E‐04 | P | PVS1 + PM2_PP + PM3 | 1 | 0 | 0.0998 |
| COQ8A | c.655 + 1G>A | LP | PVS1 + PM2_PP | 1 | 0 | 0.0998 | |
| COQ8B | S246N | 1.90E‐03 | P | PM1 + PM2_PP + PM3_VS + PP1_S | 1 | 1 | 0.4628 |
| Parkinsonism‐related genes (n = 11) | |||||||
| PARK7 | A104T | 2.60E‐03 | P | PM2_PP + PP2 + PP3 + PS3 + PM3_S | 5 | 1 | 0.0018 |
| ATP13A2 | A746T | 1.70E‐03 | P | PM2_PP + PS3_PP + PM3_VS | 3 | 4 | 0.3418 |
| PINK1 | R407Q | 9.80E‐04 | LP | PP3 + PM3 + PM2_PP + PP1_S | 1 | 2 | 0.8039 |
| GBA | T408M | 7.60E‐03 | LP | PM1 + PP3 + PS4_M + PM2_PP | 1 | 0 | 0.0998 |
| GBA | F252I | 3.20E‐05 | LP | PP3 + PM2_PP + PS4_PP + PS3 | 2 | 0 | 0.0198 |
| LRRK2 | P755L | 9.50E‐03 | P | PS4 + PP1_S + PM5 | 5 | 7 | 0.2481 |
| LRRK2 | E1874* | P | PVS1 + PM2_PP + PS4_PP | 1 | 0 | 0.0998 | |
| VPS13C | R567* | 3.20E‐05 | LP | PVS1 + PM2_PP | 1 | 0 | 0.0998 |
| PRKN | L272I | 1.60E‐03 | LP | PM1 + PP3 + PM5 + PM3 + PM2_PP | 1 | 0 | 0.0998 |
| PRKN | A82E | 4.7E‐03 | LP | PM1 + PM3_PP + PP3 + PS3_PP + PP1 | 1 | 0 | 0.0998 |
| Cerebellar‐ataxia‐related genes (n = 14) | |||||||
| COX20 | K14R | 3.23E‐05 | P | PM3_S + PM2_PP + PS3_PP + PP1_M | 1 | 0 | 0.0998 |
| POLR3A | L1122Ffs*19 | LP | PVS1 + PM2_PP | 1 | 0 | 0.0998 | |
| TPP1 | R266W | 2.60E‐04 | LP | PM1 + PM5 + PM2_PP + PP3 + PM3_PP | 1 | 0 | 0.0998 |
| CAPN1 | c.‐2 + 1G > A | 1.10E‐04 | LP | PVS1 + PM2_PP | 1 | 0 | 0.0998 |
| CAPN1 | R618W | 6.10E‐04 | LP | PM3_S + PS3_PP + PM2_PP + PP1 | 1 | 0 | 0.0998 |
| ATM | N1650S | 9.00E‐03 | LP | PM2_PP + BP4 + PP1 + PM3 + PS3_PP + PP4 | 4 | 7 | 0.4802 |
| ATM | P453Tfs*34 | LP | PVS1 + PM2_PP | 1 | 0 | 0.0998 | |
| SACS | R728* | 1.20E‐04 | P | PVS1 + PM2_PP + PM3 + PP1 | 1 | 0 | 0.0998 |
| PNKP | V69Sfs*2 | 0 | LP | PVS1 + PM2_PP | 1 | 0 | 0.0998 |
| XRCC1 | S525* | LP | PVS1 + PM2_PP | 1 | 1 | 0.4628 | |
| SYNE1 | N8640Ifs*7 | LP | PVS1 + PM2_PP | 1 | 0 | 0.0998 | |
| RNF216 | c.1224 + 2C > T | 6.40E‐04 | LP | PVS1 + PM2_PP | 1 | 0 | 0.0998 |
| SETX | p.E1770Ifs*15 | 3.18E‐05 | P | PVS1 + PM2_PP + PP1_S + PM3_PP | 1 | 0 | 0.0998 |
| SETX | p.R502W | 8.10E‐04 | LP | PM2_PP + PP3 + PS4_M + PP1_M | 1 | 0 | 0.0998 |
Abbreviations: ACMG/AMP, American College of Medical Genetics and Genomics and the Association for Molecular Pathology; LP, likely pathogenic; Mallele frequency; P, pathogenic; PP, supporting; S, strong; VS, very strong.
TABLE 3.
Clinical information in five cases with PARK7 p.A104T variant.
| Case no. | Sex | Age at onset (years) | Education (years) | Subtype | Duration (years) | MoCA | RBDQ‐HK | UMSARS | NMSS | ||
|---|---|---|---|---|---|---|---|---|---|---|---|
| I | II | IV | |||||||||
| M051 | Female | 44 | 5 | MSA‐C | 3 | 25 | 58 | 11 | 10 | 1 | 66 |
| M141 | Female | 53 | 0 | MSA‐C | 0.1 | 5 | 36 | 23 | 52 | 4 | 72 |
| M126 | Female | 59 | 11 | MSA‐C | 1 | 30 | 49 | 10 | 7 | 1 | 21 |
| 19009260 | Male | 61 | 8 | MSA‐C | 1 | 27 | 38 | 12 | 11 | 1 | 36 |
| M020 | Female | 74 | 14 | MSA‐C | 3 | 29 | 69 | 8 | 7 | 1 | 48 |
Abbreviations: MoCA, Montreal Cognitive Assessment; MSA‐C, multiple system atrophy with predominant cerebellar ataxia; NMSS, Non‐Motor Symptoms Scale; RBDQ‐HK, Rapid Eye Movement Sleep Behaviour Disorder Questionnaire—Hong Kong; UMSARS, Unified Multiple System Atrophy Rating Scale.
The burden tests suggested that rare pathogenic coding variants were significantly enriched in cerebellar‐ataxia‐related genes (p = 1.56E‐05; adjusted p = 8.89E‐04) in MSA patients, followed by the parkinsonism‐related genes (p = 0.0124; adjusted p = 0.186) and CoQ10‐deficiency‐related genes (p = 0.0204; adjusted p = 0.265) (Appendix S4). Furthermore, amongst 216 genes associated with other neurodegenerative disorders, a total of 26 LP/P variants were identified in 17 genes (Appendix S5). These variants were significantly enriched in MSA patients (28/204, 13.7%), compared with the controls (28/552, 5.07%) (p = 2.34E‐04; odds ratio 4.42, 95% confidence interval 2.64–7.11) (Appendix S5). Furthermore, a WES‐based CNV detection was also performed, and no pathogenic CNV was observed (Appendix S6).
Repeat expansions in SCA, FGF14 and RFC1 genes
In the repeat expansion analysis, two of 204 patients (0.98%) were found to carry the abnormal SCA6 expanded repeats (patient M034 14/21; patient M126 14/19; normal range 4–18); one patient (patient M132) (0.49%) carried a pathogenic (ACAGG)exp/(ACAGG)exp in RFC1 and one patient (patient M084) (0.49%) carried an uninterrupted GAA‐pure expansion with >300 repeats in FGF14 (Figure 2a). For the two SCA6 patients, patient M034 was diagnosed with MSA‐P and showed mild cerebellar and brainstem atrophy in brain MRI (Figure 2b). In contrast, patient M126 was diagnosed with MSA‐C. She had onset of ataxia at 59 years of age and 1 year later developed severe ataxia and inability to walk alone. Moreover, she also had RBD and orthostatic hypotension. Brain MRI showed cerebellar and brainstem atrophy (‘cross sign’) (Figure 2c) and her motor symptoms were severe, as indicated by UMSARS I, II and IV. For the two patients carrying abnormal variants in the RFC1 and FGF14 genes, they showed prominent cerebellar and brainstem atrophy (Figure 2d,e) and were clinically diagnosed as MSA‐mixed.
FIGURE 2.
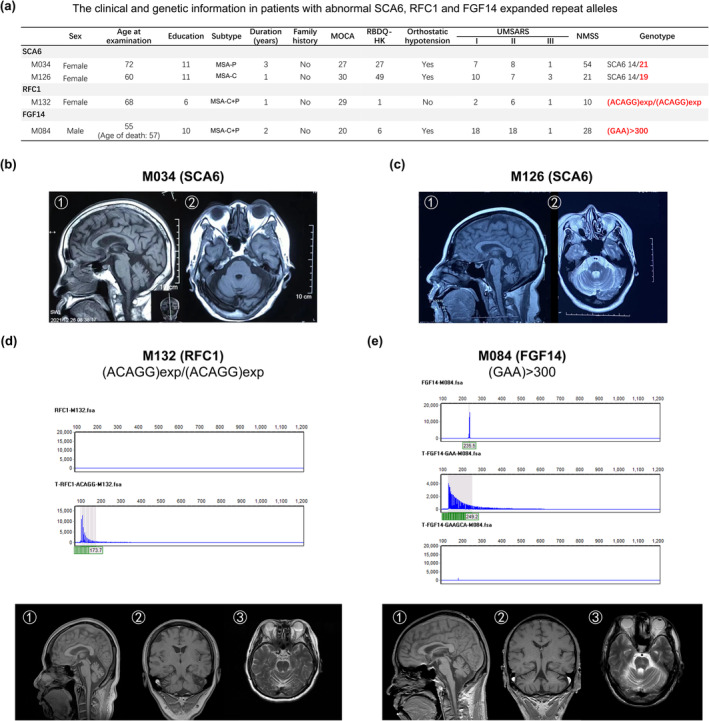
The clinical characteristics of two patients with SCA6, RFC1 and FGF14 abnormal expanded repeat alleles. (a) The clinical scale scores and genetic data. MRI, magnetic resonance imaging. (b), (c) Routine brain MRI of the two patients with SCA6: (b) patient M034; (c) patient M126. (d) The sequencing data and brain MRI of patient M132. (e) The sequencing data and brain MRI of patient M084. MSA‐P, MSA with predominant parkinsonism; MSA‐C, MSA with predominant cerebellar ataxia; MSA‐C + P, MSA with predominant cerebellar ataxia and parkinsonism; MoCA, Montreal Cognitive Assessment; NMSS, Non‐Motor Symptoms Scale; RBDQ‐HK, Rapid Eye Movement Sleep Behaviour Disorder Questionnaire—Hong Kong; UMSARS, Unified Multiple System Atrophy Rating Scale.
DISCUSSION
In our cohort of clinically diagnosed MSA patients, a novel COQ2 pathogenic variant in a family with MSA and a PARK7 variant associated with the sporadic cases were identified. Abnormal repeat expansions of SCA6 (CACNA1A gene) in two patients, RFC1 gene in one patient and FGF14 gene in one patient were also detected. Moreover, significantly enriched rare P/LP coding variants were found in genes related to cerebellar ataxia in MSA. Combined, these results demonstrated that the genetic aetiology of cerebellar ataxia, parkinsonism and other neurodegenerative disorders may contribute to the development of MSA.
Large numbers of studies have been reported concerning the genetic basis and pathogenesis of MSA. Multiple categories of genes have been identified ad proposed: (i) PD‐related genes, such as SNCA [17, 41, 42], GBA [18], LRRK2, DDC, TH and NMD3; (ii) oxidative‐stress‐related genes, such as COQ2 [6, 7, 41, 43, 44, 45, 46, 47] and SLC1A4; (iii) genes with short‐tandem repeat expansion, such as SCAs (SCA1, 2, 3, 6, 7, 8, 10, 12, 17, 36, DRPLA, FRDA), C9orf72, RFC1, FGF14 and NOTCH2NLC; (iv) GWAS‐identified genes MAPT [12, 48], FBXO47, ELOVL7, EDN1, USP38‐DT, KCTD7 and lnc‐KCTD7‐2. Amongst these [5], the C9orf72 GGGGCC repeat expansion and several SNCA variants were associated with MSA in a European population, but these findings could not be replicated in Asian populations. In contrast, COQ2 variants (e.g., V393A, S107T, M128R, M128V) have been reported to be associated with MSA‐C in East Asians, but none of these was replicated in European, North American or Caucasian populations. Variants in GBA, MAPT, SLC1A4, NOTCH2NLC and other genes were reported to be associated with the disease, but most did not survive replications in diverse populations [5]. Thus, although these are interesting observations from genetic studies in MSA, they must be interpreted with caution. To date, no large familial MSA pedigrees and monogenic forms have been identified.
Our findings added new evidence supporting that a heterozygous variant in the COQ2 gene may cause familial MSA. In the MSA family, all patients carrying the A301T variant sequentially developed the RBD symptoms and symptoms of autonomic dysfunction, ataxia and parkinsonism in the 30s–40s, supporting the diagnosis of MSA. Accumulating evidence has demonstrated the associations of COQ2 variants with MSA, although the causative biallelic variants were only reported in Japanese MSA families [6]. However, the molecular mechanisms of the COQ2 variant in MSA remain unclear. A study showed that certain COQ2 and SNCA SNPs interact with common environmental factors to modulate MSA aetiology [41]. A Japanese study suggested that a CoQ10 decrease was related to neuronal death in cells derived from induced pluripotent stem cells (iPSCs) of patients carrying the R387*/V393A variant [46]. However, our and others' studies suggested that the heterozygous A301T variant also caused the reduced CoQ10 level and the development of MSA [8, 9, 10]. Moreover, there were studies suggesting that CoQ10 may inhibit the recycling of vitamin E and lead to ataxia [46, 49]. However, it remains undetermined how the reduction of CoQ10 causes degeneration of the dopaminergic neurons.
Our results provide evidence for the association of the PARK7 Ala104Thr variant with MSA, which is similar to that with PD [50]. In addition, there is a study demonstrating that cerebrospinal fluid DJ‐1 (PARK7) levels performed well in distinguishing MSA from PD and controls (area under the curve 0.84 and 0.94, respectively) [51]. DJ‐1 is a small multifunctional protein that functions primarily as an antioxidant and plays roles in the modulation of anti‐apoptotic and anti‐inflammatory pathways. It is abundantly expressed in reactive astrocytes of patients with neurodegenerative diseases. Biochemical studies indicated the presence of modified DJ‐1 protein in the sarcosyl‐insoluble fractions prepared from MSA brain [52]. The X‐ray structure revealed that the Ala104Thr variant may perturb the central β‐sheet and cause a loss of dimerization, which further leads to deficits in inhibiting α‐synuclein fibrillization [53]. Moreover, the variant could affect the methylglyoxal detoxification activity of DJ‐1 [54]. However, this variant is relatively common in the East Asian (0.001754) and Latino/Admixed American (0.001467) populations. In our study, there was one carrier in the control subjects but he did not show ataxic, autonomous or parkinsonian symptoms. These observations suggest that this a risk, but not a causative, variant.
In our study, two sporadic MSA patients with an expansion of the CAG repeats in SCA6 (CACNA1A) were found. Usually, 20–33 CAG repeats are considered to be pathogenic, and fewer than 18 repeats are benign [55, 56]. SCA6 was previously considered as an almost purely cerebellar disease characterized by isolated cerebellar ataxia without major non‐ataxia signs [57]. However, there have been some SCA6 cases with mixed manifestations, including urinary dysfunction, parkinsonism and so on [28, 58, 59]. Distinguishing MSA‐C from SCA is difficult in clinical practice due to the phenotype overlap [60], and SCA6 is recognized as the most common (36%) dominant SCA mutation in sporadic cerebellar ataxia [61]. Thus, it is conceivable that the misdiagnosis of these two diseases is very common. Therefore, the genetic testing for SCAs, especially SCA6, should be included in the diagnosis of MSA.
Multiple system atrophy is clinically and pathologically related to cerebellar ataxia. In this study, it was found that pathogenic rare coding variants amongst cerebellar‐ataxia‐related genes were highly enriched in MSA patients, especially in MSA‐C. Consistent with our cohort, natural history studies indicated that the majority of MSA patients diagnosed in Asia have predominant cerebellar ataxia [62]. Imaging screening demonstrates that the degree of morphological changes in the Purkinje cells is more pronounced in MSA‐C than MSA‐P and PD [63]. In our findings, COX20, POLR3A and SYNE1 are mainly expressed in cerebellum (https://www.gtexportal.org/) and encode proteins involving the assembly of mitochondrial complex IV [64], the expression of RNA polymerase III [65] and linking the nuclear plasma membrane to the actin cytoskeleton [66], which may be involved in MSA. The enrichment of pathogenic variants in genes provided strong genetic evidence supporting the mechanistic link between MSA, cerebellar ataxia and other neurodegenerative diseases. These observations provide direct evidence supporting the polygenic mechanism of MSA, and functional studies involving multiple events in cerebellar dysfunction and other neurodegenerations are warranted to explore the mechanisms of the disease. Expansions in RFC1 in one patient and FGF14 gene in another were also identified. These validated the previous findings that the mutations in these two genes can be identified in 1%–2% of MSA patients [31, 67]. The findings also highlighted the importance of screening the mutations using the long‐read sequencing strategies as a regular genetic testing of MSA.
In conclusion, by WES and repeat expansion analysis, a novel COQ2 pathogenic variant in familial MSA and a pathogenic repeat expansion variant of SCA6 gene in two sporadic MSA cases were identified. A variant significantly associated with the disease was also identified and the significantly enriched P/LP rare variants in genes causative for cerebellar ataxia and neurodegenerative disorder in the MSA patients were revealed. However, one of the limitations in our study is that the follow‐up data, such as early dropout and death, are absent in our cohort. These findings highlight the genetic aetiology of MSA and provide direct evidence for a polygenic basis of the disorder.
AUTHOR CONTRIBUTIONS
Xu‐Ying Li: Conceptualization; formal analysis; investigation; writing – original draft; funding acquisition; software; methodology; data curation. Hong Lai: Data curation; formal analysis; software; investigation; methodology. Xian Li: Data curation; methodology. Fanxi Xu: Methodology; data curation. Yang Song: Resources; validation. Zhanjun Wang: Validation; resources. Qibin Li: Methodology; software; visualization. Ruichai Lin: Formal analysis; visualization. Zhiheng Xu: Conceptualization; funding acquisition; supervision; writing – review and editing; validation. Chaodong Wang: Conceptualization; funding acquisition; project administration; validation; supervision; writing – review and editing.
FUNDING INFORMATION
This study was supported by grants from the National Key Research and Development Program (2022YFC2009600, 2022YFC2009601) to Dr Xu‐Ying Li, National Natural Science Foundation of China (NSFC) (No. 82171412) to Dr Chaodong Wang, NSFC (No. 31921002, 31730108, 32061143026) and the Strategic Priority Research Program and Innovation Program of the Chinese Academy of Sciences (No. XDB32020100, YJKYYQ20200052) to Dr Zhiheng Xu.
CONFLICT OF INTEREST STATEMENT
The authors declare no actual or potential conflicts of interest in this paper.
Supporting information
Appendix S1: The gene lists for identification of pathogenic rare coding variants.
Appendix S2: The primers used for SCA repeat expansion testing.
Appendix S3: The summary of whole‐exome sequencing data.
Appendix S4: Burden test for the rare damaging coding variants.
Appendix S5: P/LP variants identified in MSA patients.
Appendix S6: The rare CNVs detected in WES data of MSA patients.
ACKNOWLEDGEMENTS
The patients and their families are appreciated for their cooperation and colleagues are appreciated for their work in this study. There were no AI and AI‐assisted technologies in the writing process of our manuscript.
Li X‐Y, Lai H, Li X, et al. Genetic profiles of multiple system atrophy revealed by exome sequencing, long‐read sequencing and spinocerebellar ataxia repeat expansion analysis. Eur J Neurol. 2024;31:e16441. doi: 10.1111/ene.16441
Contributor Information
Zhiheng Xu, Email: zhxu@genetics.ac.cn.
Chaodong Wang, Email: cdongwang@xwhosp.org.
DATA AVAILABILITY STATEMENT
Data sharing is not applicable to this article as no new data were created or analyzed in this study.
REFERENCES
- 1. Ahmed Z, Asi YT, Sailer A, et al. The neuropathology, pathophysiology and genetics of multiple system atrophy. Neuropathol Appl Neurobiol. 2012;38:4‐24. [DOI] [PubMed] [Google Scholar]
- 2. Trojanowski JQ, Revesz T, Neuropathology Working Group on MSA . Proposed neuropathological criteria for the post mortem diagnosis of multiple system atrophy. Neuropathol Appl Neurobiol. 2007;33:615‐620. [DOI] [PubMed] [Google Scholar]
- 3. Gilman S, Wenning GK, Low PA, et al. Second consensus statement on the diagnosis of multiple system atrophy. Neurology. 2008;71:670‐676. [DOI] [PMC free article] [PubMed] [Google Scholar]
- 4. Fanciulli A, Wenning GK. Multiple‐system atrophy. N Engl J Med. 2015;372:249‐263. [DOI] [PubMed] [Google Scholar]
- 5. Tseng FS, Foo JQX, Mai AS, Tan EK. The genetic basis of multiple system atrophy. J Transl Med. 2023;21:104. [DOI] [PMC free article] [PubMed] [Google Scholar]
- 6. Multiple‐System Atrophy Research Collaboration . Mutations in COQ2 in familial and sporadic multiple‐system atrophy. N Engl J Med. 2013;369:233‐244. [DOI] [PubMed] [Google Scholar]
- 7. Porto KJ, Hirano M, Mitsui J, et al. COQ2 V393A confers high risk susceptibility for multiple system atrophy in east Asian population. J Neurol Sci. 2021;429:117623. [DOI] [PubMed] [Google Scholar]
- 8. Barca E, Kleiner G, Tang G, et al. Decreased coenzyme Q10 levels in multiple system atrophy cerebellum. J Neuropathol Exp Neurol. 2016;75:663‐672. [DOI] [PMC free article] [PubMed] [Google Scholar]
- 9. Schottlaender LV, Bettencourt C, Kiely AP, et al. Coenzyme Q10 levels are decreased in the cerebellum of multiple‐system atrophy patients. PLoS One. 2016;11:e0149557. [DOI] [PMC free article] [PubMed] [Google Scholar]
- 10. Kasai T, Tokuda T, Ohmichi T, et al. Serum levels of coenzyme Q10 in patients with multiple system atrophy. PLoS One. 2016;11:e0147574. [DOI] [PMC free article] [PubMed] [Google Scholar]
- 11. Sharma M, Wenning G, Kruger R, European Multiple‐System Atrophy Study Group . Mutant COQ2 in multiple‐system atrophy. N Engl J Med. 2014;371:80‐81. [DOI] [PubMed] [Google Scholar]
- 12. Sailer A, Scholz SW, Nalls MA, et al. A genome‐wide association study in multiple system atrophy. Neurology. 2016;87:1591‐1598. [DOI] [PMC free article] [PubMed] [Google Scholar]
- 13. Gu X, Chen Y, Zhou Q, et al. Analysis of GWAS‐linked variants in multiple system atrophy. Neurobiol Aging. 2018;67:201.e1‐201.e4. [DOI] [PubMed] [Google Scholar]
- 14. Hopfner F, Tietz AK, Ruf VC, et al. Common variants near ZIC1 and ZIC4 in autopsy‐confirmed multiple system atrophy. Mov Disord. 2022;37:2110‐2121. [DOI] [PMC free article] [PubMed] [Google Scholar]
- 15. Shadrin AA, Mucha S, Ellinghaus D, et al. Shared genetics of multiple system atrophy and inflammatory bowel disease. Mov Disord. 2021;36:449‐459. [DOI] [PMC free article] [PubMed] [Google Scholar]
- 16. Pasanen P, Myllykangas L, Siitonen M, et al. Novel alpha‐synuclein mutation A53E associated with atypical multiple system atrophy and Parkinson's disease‐type pathology. Neurobiol Aging. 2014;35(2180):e2181‐e2185. [DOI] [PubMed] [Google Scholar]
- 17. Scholz SW, Houlden H, Schulte C, et al. SNCA variants are associated with increased risk for multiple system atrophy. Ann Neurol. 2009;65:610‐614. [DOI] [PMC free article] [PubMed] [Google Scholar]
- 18. Wernick AI, Walton RL, Koga S, et al. GBA variation and susceptibility to multiple system atrophy. Parkinsonism Relat Disord. 2020;77:64‐69. [DOI] [PubMed] [Google Scholar]
- 19. Brooks JA, Houlden H, Melchers A, et al. Mutational analysis of parkin and PINK1 in multiple system atrophy. Neurobiol Aging. 2011;32(548):e545‐e547. [DOI] [PMC free article] [PubMed] [Google Scholar]
- 20. Lee K, Nguyen KD, Sun C, et al. LRRK2 p.Ile1371Val mutation in a case with neuropathologically confirmed multi‐system atrophy. J Parkinsons Dis. 2018;8:93‐100. [DOI] [PubMed] [Google Scholar]
- 21. Yuan X, Chen Y, Cao B, et al. An association analysis of the R1628P and G2385R polymorphisms of the LRRK2 gene in multiple system atrophy in a Chinese population. Parkinsonism Relat Disord. 2015;21:147‐149. [DOI] [PubMed] [Google Scholar]
- 22. Carrer T, Bonato G, Sandre M, et al. Rapidly progressive multiple system atrophy in a patient carrying LRRK2 G2019S mutation. Neurol Sci. 2024;45:309‐313. [DOI] [PubMed] [Google Scholar]
- 23. Li M, Ma Q, Zhao X, et al. Dilemma of multiple system atrophy and spinocerebellar ataxias. J Neurol. 2018;265:2764‐2772. [DOI] [PubMed] [Google Scholar]
- 24. Kim H‐J, Jeon BS, Shin J, et al. Should genetic testing for SCAs be included in the diagnostic workup for MSA? Neurology. 2014;83:1733‐1738. [DOI] [PubMed] [Google Scholar]
- 25. Mongelli A, Sarro L, Rizzo E, et al. Multiple system atrophy and CAG repeat length: a genetic screening of polyglutamine disease genes in Italian patients. Neurosci Lett. 2018;678:37‐42. [DOI] [PubMed] [Google Scholar]
- 26. Lin IS, Wu RM, Lee‐Chen GJ, Shan DE, Gwinn‐Hardy K. The SCA17 phenotype can include features of MSA‐C, PSP and cognitive impairment. Parkinsonism Relat Disord. 2007;13:246‐249. [DOI] [PubMed] [Google Scholar]
- 27. Munhoz RP, Teive HA, Raskin S, Werneck LC. CTA/CTG expansions at the SCA 8 locus in multiple system atrophy. Clin Neurol Neurosurg. 2009;111:208‐210. [DOI] [PubMed] [Google Scholar]
- 28. Hanna Al‐Shaikh R, Wernick AI, Strongosky AJ, et al. Spinocerebellar ataxia type 6 family with phenotypic overlap with multiple system atrophy. Neurol Neurochir Pol. 2020;54:350‐355. [DOI] [PubMed] [Google Scholar]
- 29. Cortese A, Simone R, Sullivan R, et al. Biallelic expansion of an intronic repeat in RFC1 is a common cause of late‐onset ataxia. Nat Genet. 2019;51:649‐658. [DOI] [PMC free article] [PubMed] [Google Scholar]
- 30. Indelicato E, Boesch S. GAA/FGF14 ataxia: an ode to the phenotype‐first approach. EBioMedicine. 2024;103:105131. [DOI] [PMC free article] [PubMed] [Google Scholar]
- 31. Ouyang R, Wan L, Pellerin D, et al. The genetic landscape and phenotypic spectrum of GAA‐FGF14 ataxia in China: a large cohort study. EBioMedicine. 2024;102:105077. [DOI] [PMC free article] [PubMed] [Google Scholar]
- 32. Wirth T, Bonnet C, Delvallée C, et al. Does spinocerebellar ataxia 27B mimic cerebellar multiple system atrophy? J Neurol. 2024;271:2078‐2085. [DOI] [PubMed] [Google Scholar]
- 33. Wang K, Li M, Hakonarson H. ANNOVAR: functional annotation of genetic variants from high‐throughput sequencing data. Nucleic Acids Res. 2010;38:e164. [DOI] [PMC free article] [PubMed] [Google Scholar]
- 34. Richards S, Aziz N, Bale S, et al. Standards and guidelines for the interpretation of sequence variants: a joint consensus recommendation of the American College of Medical Genetics and Genomics and the Association for Molecular Pathology. Genet Med. 2015;17:405‐424. [DOI] [PMC free article] [PubMed] [Google Scholar]
- 35. Zhang J, Yao Y, He H, Shen J. Clinical interpretation of sequence variants. Curr Protoc Hum Genet. 2020;106:e98. [DOI] [PMC free article] [PubMed] [Google Scholar]
- 36. Brnich SE, Rivera‐Munoz EA, Berg JS. Quantifying the potential of functional evidence to reclassify variants of uncertain significance in the categorical and Bayesian interpretation frameworks. Hum Mutat. 2018;39:1531‐1541. [DOI] [PMC free article] [PubMed] [Google Scholar]
- 37. Talevich E, Shain AH, Botton T, Bastian BC. CNVkit: genome‐wide copy number detection and visualization from targeted DNA sequencing. PLoS Comput Biol. 2016;12:e1004873. [DOI] [PMC free article] [PubMed] [Google Scholar]
- 38. Quinlan AR, Hall IM. BEDTools: a flexible suite of utilities for comparing genomic features. Bioinformatics (Oxford, England). 2010;26:841‐842. [DOI] [PMC free article] [PubMed] [Google Scholar]
- 39. Warner JP, Barron LH, Goudie D, et al. A general method for the detection of large CAG repeat expansions by fluorescent PCR. J Med Genet. 1996;33:1022‐1026. [DOI] [PMC free article] [PubMed] [Google Scholar]
- 40. Purcell S, Neale B, Todd‐Brown K, et al. PLINK: a tool set for whole‐genome association and population‐based linkage analyses. Am J Hum Genet. 2007;81:559‐575. [DOI] [PMC free article] [PubMed] [Google Scholar]
- 41. Kuo MC, Lu YC, Tai CH, et al. COQ2 and SNCA polymorphisms interact with environmental factors to modulate the risk of multiple system atrophy and subtype disposition. Eur J Neurol. 2022;29:2956‐2966. [DOI] [PubMed] [Google Scholar]
- 42. Yun JY, Lee W‐W, Lee J‐Y, Kim HJ, Park SS, Jeon BS. SNCA variants and multiple system atrophy. Ann Neurol. 2010;67:554‐555. [DOI] [PubMed] [Google Scholar]
- 43. Ronchi D, Di Biase E, Franco G, et al. Mutational analysis of COQ2 in patients with MSA in Italy. Neurobiol Aging. 2016;45:213.e1‐213.e2. [DOI] [PubMed] [Google Scholar]
- 44. Sun Z, Ohta Y, Yamashita T, et al. New susceptible variant of COQ2 gene in Japanese patients with sporadic multiple system atrophy. Neurol Genet. 2016;2:e54. [DOI] [PMC free article] [PubMed] [Google Scholar]
- 45. Mitsui J, Koguchi K, Momose T, et al. Three‐year follow‐up of high‐dose ubiquinol supplementation in a case of familial multiple system atrophy with compound heterozygous COQ2 mutations. Cerebellum. 2017;16:664‐672. [DOI] [PMC free article] [PubMed] [Google Scholar]
- 46. Nakamoto FK, Okamoto S, Mitsui J, et al. The pathogenesis linked to coenzyme Q10 insufficiency in iPSC‐derived neurons from patients with multiple‐system atrophy. Sci Rep. 2018;8:14215. [DOI] [PMC free article] [PubMed] [Google Scholar]
- 47. Chia R, Ray A, Shah Z, et al. Genome sequence analyses identify novel risk loci for multiple system atrophy. Neuron. 2024;112:2142‐2156.e5. [DOI] [PMC free article] [PubMed] [Google Scholar]
- 48. Vilariño‐Güell C, Soto‐Ortolaza AI, Rajput A, et al. MAPT H1 haplotype is a risk factor for essential tremor and multiple system atrophy. Neurology. 2011;76:670‐672. [DOI] [PMC free article] [PubMed] [Google Scholar]
- 49. Kagan VE, Arroyo A, Tyurin VA, Tyurina YY, Villalba JM, Navas P. Plasma membrane NADH‐coenzyme Q0 reductase generates semiquinone radicals and recycles vitamin E homologue in a superoxide‐dependent reaction. FEBS Lett. 1998;428:43‐46. [DOI] [PubMed] [Google Scholar]
- 50. Kilarski LL, Pearson JP, Newsway V, et al. Systematic review and UK‐based study of PARK2 (parkin), PINK1, PARK7 (DJ‐1) and LRRK2 in early‐onset Parkinson's disease. Mov Disord. 2012;27:1522‐1529. [DOI] [PubMed] [Google Scholar]
- 51. Herbert MK, Eeftens JM, Aerts MB, et al. CSF levels of DJ‐1 and tau distinguish MSA patients from PD patients and controls. Parkinsonism Relat Disord. 2014;20:112‐115. [DOI] [PubMed] [Google Scholar]
- 52. Neumann M, Muller V, Gorner K, Kretzschmar HA, Haass C, Kahle PJ. Pathological properties of the Parkinson's disease‐associated protein DJ‐1 in alpha‐synucleinopathies and tauopathies: relevance for multiple system atrophy and Pick's disease. Acta Neuropathol. 2004;107:489‐496. [DOI] [PubMed] [Google Scholar]
- 53. Lakshminarasimhan M, Maldonado MT, Zhou W, Fink AL, Wilson MA. Structural impact of three parkinsonism‐associated missense mutations on human DJ‐1. Biochemistry. 2008;47:1381‐1392. [DOI] [PMC free article] [PubMed] [Google Scholar]
- 54. Matsuda N, Kimura M, Queliconi BB, et al. Parkinson's disease‐related DJ‐1 functions in thiol quality control against aldehyde attack in vitro. Sci Rep. 2017;7:12816. [DOI] [PMC free article] [PubMed] [Google Scholar]
- 55. Shizuka M, Watanabe M, Ikeda Y, Mizushima K, Okamoto K, Shoji M. Molecular analysis of a de novo mutation for spinocerebellar ataxia type 6 and (CAG)n repeat units in normal elder controls. J Neurol Sci. 1998;161:85‐87. [DOI] [PubMed] [Google Scholar]
- 56. Mariotti C, Gellera C, Grisoli M, Mineri R, Castucci A, Di Donato S. Pathogenic effect of an intermediate‐size SCA‐6 allele (CAG)(19) in a homozygous patient. Neurology. 2001;57:1502‐1504. [DOI] [PubMed] [Google Scholar]
- 57. Rentiya Z, Hutnik R, Mekkam YQ, Bae J. The pathophysiology and clinical manifestations of spinocerebellar ataxia type 6. Cerebellum (London, England). 2020;19:459‐464. [DOI] [PubMed] [Google Scholar]
- 58. Kim J‐M, Lee J‐Y, Kim HJ, et al. The wide clinical spectrum and nigrostriatal dopaminergic damage in spinocerebellar ataxia type 6. J Neurol Neurosurg Psychiatry. 2010;81:529‐532. [DOI] [PubMed] [Google Scholar]
- 59. Lee WY, Jin DK, Oh MR, et al. Frequency analysis and clinical characterization of spinocerebellar ataxia types 1, 2, 3, 6, and 7 in Korean patients. Arch Neurol. 2003;60:858‐863. [DOI] [PubMed] [Google Scholar]
- 60. Jang M, Kim H‐J, Kim A, Jeon B. Urinary symptoms and urodynamic findings in patients with spinocerebellar ataxia. Cerebellum (London, England). 2020;19:483‐486. [DOI] [PubMed] [Google Scholar]
- 61. Sakakibara R, Tateno F, Kishi M, et al. Genetic screening for spinocerebellar ataxia genes in a Japanese single‐hospital cohort. J Movement Disorders. 2017;10:116‐122. [DOI] [PMC free article] [PubMed] [Google Scholar]
- 62. Ozawa T, Revesz T, Paviour D, et al. Difference in MSA phenotype distribution between populations: genetics or environment? J Parkinsons Dis. 2012;2:7‐18. [DOI] [PubMed] [Google Scholar]
- 63. Rusholt EHL, Salvesen L, Brudek T, Tesfay B, Pakkenberg B, Olesen MV. Pathological changes in the cerebellum of patients with multiple system atrophy and Parkinson's disease—a stereological study. Brain Pathol. 2020;30:576‐588. [DOI] [PMC free article] [PubMed] [Google Scholar]
- 64. Szklarczyk R, Wanschers BF, Nijtmans LG, et al. A mutation in the FAM36A gene, the human ortholog of COX20, impairs cytochrome c oxidase assembly and is associated with ataxia and muscle hypotonia. Hum Mol Genet. 2013;22:656‐667. [DOI] [PubMed] [Google Scholar]
- 65. Bernard G, Chouery E, Putorti ML, et al. Mutations of POLR3A encoding a catalytic subunit of RNA polymerase pol III cause a recessive hypomyelinating leukodystrophy. Am J Hum Genet. 2011;89:415‐423. [DOI] [PMC free article] [PubMed] [Google Scholar]
- 66. Baumann M, Steichen‐Gersdorf E, Krabichler B, et al. Homozygous SYNE1 mutation causes congenital onset of muscular weakness with distal arthrogryposis: a genotype–phenotype correlation. Eur J Hum Genet. 2017;25:262‐266. [DOI] [PMC free article] [PubMed] [Google Scholar]
- 67. Wan L, Chen Z, Wan N, et al. Biallelic intronic AAGGG expansion of RFC1 is related to multiple system atrophy. Ann Neurol. 2020;88:1132‐1143. [DOI] [PubMed] [Google Scholar]
Associated Data
This section collects any data citations, data availability statements, or supplementary materials included in this article.
Supplementary Materials
Appendix S1: The gene lists for identification of pathogenic rare coding variants.
Appendix S2: The primers used for SCA repeat expansion testing.
Appendix S3: The summary of whole‐exome sequencing data.
Appendix S4: Burden test for the rare damaging coding variants.
Appendix S5: P/LP variants identified in MSA patients.
Appendix S6: The rare CNVs detected in WES data of MSA patients.
Data Availability Statement
Data sharing is not applicable to this article as no new data were created or analyzed in this study.