

Abstract
Despite advances in immune checkpoint inhibitors (ICIs), chemotherapy remains the standard therapy for patients with pancreatic ductal adenocarcinoma (PDAC). As the combinations of chemotherapy, including the FOLFIRINOX (5-fluorouracil (5FU), irinotecan, and oxaliplatin) regimen, and ICIs have failed to demonstrate clinical benefit in patients with metastatic PDAC tumors, there is increasing interest in identifying therapeutic approaches to potentiate ICI efficacy in PDAC patients. In this study, we report that neoadjuvant FOLFRINOX-treated human PDAC tumors exhibit increased MEK/ERK activation. We also show elevated MEK/ERK signaling in ex vivo PDAC slice cultures and cell lines treated with a combination of 5FU (F), irinotecan (I), and oxaliplatin (O) (FIO). In addition, we find that the KPC-FIO cells, established from repeated treatment of mouse PDAC cell lines with 6–8 cycles of FIO, display enhanced ERK phosphorylation and demonstrate increased sensitivity to MEK inhibition in vitro and in vivo. Significantly, the KPC-FIO cells develop tumors with a pro-inflammatory immune profile similar to human PDAC tumors following neoadjuvant FOLFIRINOX treatment. Furthermore, we found that the MEK inhibitor Trametinib enables additional infiltration of highly functional CD8+ T cells into the KPC-FIO tumors and potentiates the efficacy of anti-PD-1 antibody in syngeneic mouse models. Our findings provide a rationale for combining Trametinib and anti-PD-1 antibodies in PDAC patients following neoadjuvant or short-term FOLFIRINOX treatment to achieve effective anti-tumor responses.
Introduction
Pancreatic ductal adenocarcinoma (PDAC) is one of the deadliest malignancies, with a current 5-year overall survival of 13% 1,2. Chemotherapy, including the combination regimen of FOLFIRINOX (5-fluorouracil (5FU), irinotecan, and oxaliplatin), remains the first-line therapy for patients with advanced PDAC 3. In addition, trials evaluating neoadjuvant FOLFIRINOX in patients with localized PDAC, including patients with borderline resectable tumors, have demonstrated promising results 4–6. Notably, neoadjuvant FOLFIRINOX can shift the PDAC tumor immune microenvironment (TiME) towards a T cell-inflamed, anti-tumorigenic profile 7–9. As a result, there is increasing interest in employing immunotherapy, such as anti-PD-1/PD-L1 immune checkpoint inhibitors (ICIs), to further enhance T cell activity and achieve optimal anti-tumor responses 9. However, ICIs, as single-agent and in combination with chemotherapy, have failed to demonstrate clinical benefits in patients with advanced PDAC 10,11. Hence, while the results of clinical trials evaluating ICIs and chemotherapy in patients with localized PDAC are still pending (NCT05132504), it is critical to identify additional approaches to potentiate ICI efficacy following treatment with chemotherapy.
The mitogen-activated protein kinase (MAPK) MEK/ERK pathway has been implicated in several cancer types where it contributes to cancer progression 12,13. Preclinical studies demonstrate that MEK inhibitors can enhance the efficacy of current ICIs through diverse mechanisms, including an increase in tumor cell immunogenicity 14,15, a decrease in immunosuppressive cells 16–18, and protection of effector T cells from apoptosis 14. Thus, several clinical trials have evaluated the effects of MEK inhibitors and ICIs in select solid cancers 13. However, recent trials in patients with colorectal cancer (IMblaze370) and biliary tract cancer showed that the combination of the anti-PD-L1 antibody atezolizumab and the MEK inhibitor Cobimetinib failed to improve overall survival rates 19,20. While patients in these trials were previously treated with one or more systemic chemotherapy regimens 19,20, it is unclear whether chemotherapy altered the TiME of the treated patients to a similar extent as seen with patients treated with the FOLFIRINOX regimen 7–9. Furthermore, MEK/ERK activity levels in patients selected for the combination treatments were not reported. Hence, it remains to be investigated the extent to which the combination of 5FU, irinotecan, and oxaliplatin activates the MEK/ERK pathway and enables a therapeutic window for the combination of MEK inhibitors and ICIs in select PDAC patients.
In the current study, we find evidence of elevated MEK/ERK signals in PDAC tumors treated with FOLFIRINOX. We also show elevated ERK phosphorylation in ex vivo PDAC slice cultures and cell lines treated with a combination of 5FU, irinotecan, and oxaliplatin (FIO). In addition, we show that KPC-FIO cells, established following treatment of mouse PDAC cell lines with 6–8 cycles of FIO, display enhanced ERK phosphorylation and demonstrate increased sensitivity to MEK inhibition in vitro and in vivo. Furthermore, the KPC-FIO cells develop tumors with an immune profile similar to neoadjuvant FOLFIRINOX-treated human PDAC tumors. Significantly, we demonstrate the MEK inhibitor Trametinib reprograms the TiME of the KPC-FIO, but not the corresponding parental tumors, to enable infiltration of highly functional CD8+ T cells and potentiate the efficacy of anti-PD-1 in subcutaneous and orthotopic models of PDAC. Our findings suggest that enhanced MEK/ERK activity in tumor cells as a response to treatment with FIO may offer a therapeutic opportunity to enhance the efficacy of ICIs in PDAC patients following neoadjuvant or short-term FOLFIRINOX treatment.
Materials & Methods
Cell culture and generation of KPC-FIO cell lines
KPC-2138, KPC-3213, and KPC-3886 cell lines were derived from PDAC tumors developing in the KPC (LSL-KrasG12D/+/LSL-Trp53R172H/+/Pdx-1-Cre) mouse model in the C57BL/6J background 21. KPC-1245 cell line was provided by David Tuveson (Cold Spring Harbor Laboratories, Cold Spring Harbor, New York, US). The cell lines were cultured in the presence of 5FU (F, 4 μM), SN-38 (I, the active metabolite of irinotecan, 12.5 nM), and oxaliplatin (O, 0.5 μM) on a 3-day on, 4-day off schedule 22. After 6–8 cycles of treatment with FIO combination, the cells were designated as KPC-FIO cells. All cell lines were cultured in DMEM supplemented with 10% Fetal Bovine Serum (FBS) and antibiotics (100 U/mL Penicillin and 100 μg/mL Streptomycin). No mycoplasma testing or cell authentication were performed.
WST-1 proliferation assay
WST-1 assays were done in 12-well (100,000 cells/mL density) or 96-well (10,000 cells/mL density) plate format. After 3 days of treatment with the different inhibitors, WST-1 reagent (Sigma-Aldrich) was added into the media at a 1:100 dilution factor. Absorbance was measured according to the manufacturer’s instructions every hour for 4 hours or until maximal absorbance was reached as previously described 23,24. All absorbance values were normalized against the vehicle-treated samples for analysis.
Cell death assays
Treated cells were collected, washed with ice-cold PBS, and stained using an Annexin-V and PI kit for 15 minutes at room temperature per manufacturer instructions (BD Biosciences). Cells were analyzed on a ThermoFisher Attune NxT Flow Cytometer, gating exclusively on cells within acceptable FSC/SSC parameters. All samples were compared to unstained and single-stained controls. At least 30,000 cells per treatment condition were collected for analysis.
Chemicals and antibodies
5-Fluorouracil was purchased from InvivoGen. Oxaliplatin and SN-38 (7-ethyl-10-hydroxycamptothecin, the active metabolite of Irinotecan) were purchased from Sigma-Aldrich. MEK inhibitor U0126 25 was purchased from Cell Signaling. MEK inhibitors Binimetinib, Cobimetinib, and Selumetinib were purchased from Selleckchem. Trametinib was purchased from MedChemExpress. For animal studies, DMSO and Trametinib were dissolved in 0.5% methylcellulose and 0.2% Tween 80 for in vivo administration. Anti-PD-1 (clone RMP1–14, RRID:AB_10949053) and the isotype-matched IgG control (RRID:AB_1107769) antibodies were purchased from BioXcell. Antibodies were stored undiluted at 4°C and diluted in InVioPure pH 7.0 Dilution Buffer from BioXCell before treating the animals.
Animal studies
For subcutaneous tumor studies, 2138, 2138-FIO, 3213, 3213-FIO, 3886 (25 × 103 cells/100 μL), and 3886-FIO (75 × 103 cells/100 μL) were injected under the skin into the flanks of 6–8-week-old C57B6/L. When tumors achieved an approximate volume of ~100–150 mm3, 2138- and 2138-FIO tumor-bearing mice were randomized and treated with DMSO dissolved in 0.5% methylcellulose and 0.2% Tween 80 (vehicle control) or Trametinib (1mg/kg, daily) dissolved in 0.5% methylcellulose and 0.2% Tween 80. To evaluate anti-PD-1 efficacy, established tumor-bearing mice were randomized to receive anti-PD-1 antibody (250 μg, 3x/week) or isotype-control IgG antibody (250 μg, 3x/week). For the combination studies, tumor-bearing mice were randomized to receive DMSO or Trametinib (1mg/kg, daily) in combination with anti-PD-1 antibody (250 μg, 3x/week) or isotype-control IgG antibody (250 μg, 3x/week). Tumor volume was calculated using the formula V = (W2 × L)/2 where V is tumor volume, W is tumor width, and L is tumor length by caliper measurement. For orthotopic tumor studies, 2138-FIO (3.5 × 10³ cells/25 μL) were injected directly into the mouse pancreas using a Hamilton microsyringe with a 30-gauge hypodermic needle following an IACUC-approved procedure. When tumors were palpable at ~10 days, mice were randomized to receive treatments as described above.
For survival studies, tumor-bearing mice were treated as described above when tumors achieved an approximate volume of ~200–250 mm3. Endpoint criteria included tumor volume exceeding 700 mm3, severe cachexia, weight loss of more than 20% body weight, and weakness or inactivity. Mice were euthanized by CO2 inhalation and cervical dislocation, and the tumors were excised and processed for downstream applications.
RNA sequencing and gene expression analysis
Total RNA was isolated with RNeasy Mini Kit (Qiagen) according to the manufacturer’s instructions. The concentration and purity of total RNA were determined by a NanoDrop spectrophotometer. mRNA library preparation and sequencing were performed by ActiveMotif®. Differential analyses to identify statistically significant differential genes were done using DESeq2. Using DESeq2 normalized gene counts, gene set enrichment analysis (GSEA) using MSigDB’s C5 (GEO geneset) was performed using default settings. DESeq2 data are provided in Supplemental Table 1.
Immunoblotting
Whole-cell extracts of cultured cells were prepared in radioimmunoprecipitation (RIPA) lysis buffer supplemented with phosphatase and protease inhibitors (Calbiochem). Protein concentration was determined by the bicinchoninic acid assay (BCA) (ThermoFisher) and separated by the SDS-PAGE technique. The following antibodies were used at the dilution recommended by the manufacturers: p-ERK1/2Thr202/Tyr204 (#9101, Cell Signaling, RRID:AB_331646), total ERK1/2 (sc-514302, RRID:AB_2571739), and HSP90 (sc-7947, Santa Cruz Biotechnology, RRID:AB_2121235 or #4877, Cell Signaling, RRID:AB_2233307). Secondary anti-mouse IgG (A4416, RRID:AB_258167) and anti-rabbit IgG (A6667, RRID:AB_258307) antibodies were purchased from Sigma-Aldrich and used a 1:4000 dilution. Images of blots were acquired on HyBlot ES Autoradiography Film (Thomas Scientific) following incubation with SuperSignal West Pico PLUS (ThermoFisher).
Immunohistochemistry staining
De-identified PDAC specimens collected at Northwestern University were stained for the following antibodies: CD8 (ab4055, 1:5000, Abcam, RRID:AB_304247), Arginase-1 (ab133543, 1:2000, Abcam), CD206 (ab64696, 1:10000, Abcam, RRID:AB_1523910), and CD68 (#76437, 1:1000, Cell Signaling, RRID:AB_2799882). Mouse tumors were stained for CD8 (#98941, 1:1000, Cell Signaling, RRID:AB_2756376), F4/80 (#70076, Cell Signaling, 1:1000), Arginase-1 (ab203490, 1:1000, Abcam), and CD206 (#24595, Cell Signaling, 1:1000, RRID:AB_2799771). To evaluate proliferation and apoptosis, tumors were stained for Ki67 (#12202, 1:1000, Cell Signaling, RRID:AB_2620142) and cleaved caspase-3 (#9664, 1:2000, Cell Signaling, RRID:AB_2070042) respectively. Antigen retrieval was carried out as previously described 23,24 with either pH 6.0 or pH 9.0 buffer according to the manufacturer’s instructions. After antigen retrieval, specimens were incubated with BLOXALL (Vector Laboratories) for 15 minutes and then incubated with the Fc receptor blocker (Innovex) for 20 minutes at room temperature. Sections were incubated with primary antibodies at the recommended dilutions in 1% BSA/PBS overnight at 4°C. ImmPRESS® Secondary HRP anti-rabbit and anti-mouse IgG (Peroxidase) Polymer Detection Kit was purchased from Vector Laboratories. Photographs were taken on either a FeinOptic microscope or a Jenoptik ProgRes C5 camera and analyzed by ImageJ.
Immunofluorescence staining
For actin filament staining, the KPC and KPC-FIO cell lines were grown on glass coverslips overnight. The next day, cells were fixed and stained for Alexa Fluor 488 phalloidin (ThermoFisher) at a ratio of 1:400 and following the manufacturer’s protocol. For tumor specimens, antigen retrieval was carried out as previously described using pH 6.0 citrate buffer 23,24. After antigen retrieval, sections were incubated with 10% normal goat serum (Agilent) for 20 minutes at room temperature, followed by incubation with 1% BSA/PBS buffer for 1 hour at room temperature. The sections were incubated with p-ERK1/2 primary antibody (#9101, 1:1000, Cell Signaling) and cytokeratin 19 (CK19, 1:200, DHSB, RRID:AB_2133570) in 1% BSA/PBS overnight at 4°C. Secondary Alexa Fluor 488 and Alexa 647 antibodies were purchased from ThermoFisher and used at 1:400–1:1000 dilution factor. DAPI was used to counterstain the nuclei. Final pictures, taken on either an EVOS™ M5000 or EVOS™ M7000 microscope, were quantified using ImageJ. At least 5 different regions were taken per section for final quantification.
Flow cytometry staining and analysis
As previously described 26, mouse tumors were mechanically digested through a 70-μm cell strainer in PBS buffer supplemented with 5% FBS. Cell pellets were pre-treated with red blood cell lysis buffer (BioLegend) and then incubated with TruStain FcX™ (1:200) (BioLegend) for 20 minutes on ice. All subsequent primary antibodies were stained for 45 minutes on ice using antibodies purchased from BioLegend and/or ThermoFisher: CD45 (BV711, RRID:AB_2564383), CD8 (PerCP-Cy5.5, RRID:AB_2075239 or PE, RRID:AB_312747), CD4 (APC-Cy7, RRID:AB_314086 or APC, RRID:AB_312696), CD11b (APC, RRID:AB_312795), F4/80 (PE, RRID:AB_893498), Ly6G (PE-Cy7, RRID:AB_1877262), Ly6C (AF700, RRID:AB_10640119), CD25 (FITC, RRID:AB_961212), FoxP3 (AF700, RRID:AB_2750493), granzyme B (PE-Cy7, RRID:AB_10853339 or FITC, RRID:AB_2114575), TNFα (AF647, RRID:AB_493330), Perforin (PE), IFNγ (BV605, RRID:AB_2734493), PD-L1 (BV605, RRID:AB_2563635), CD206 (AF594, RRID:AB_2563300), Arginase-1 (PE-Cy7, RRID:AB_2734841). In addition to the indicated antibodies, all samples were also incubated with LIVE/DEAD™ fixable violet dead cell stain (ThermoFisher) to determine viability. For intracellular staining (IFNγ, TNFα, granzyme B, perforin-1, Arginase-1), in addition to viability and surface markers, flow samples were pre-incubated with GolgiStop (1:1000) (BD Biosciences), fixed overnight, and permeabilized using eBioscience™ Foxp3/Transcription Factor Staining Buffer Set (ThermoFisher) before incubated with the corresponding antibodies for 45–60 minutes at room temperature. Samples were then acquired on a ThermoFisher Attune NxT Flow Cytometer and analyzed by the FlowJo and Graphpad software. The gating scheme is provided in Supplemental Fig. S1.
Membrane-based cytokine array
The membrane-based immunoassay was purchased from R&D Systems (catalog #ARY006). For in vivo experiments, whole-cell extracts were collected from at least three individual tumors, incubated with the membranes overnight, and analyzed for the expression of different cytokines following the manufacturer’s instructions. In vitro experiments with conditioned media were repeated at least twice with reproducible results. Pixel density was quantified by ImageJ.
Slice culture conditions and treatments
Following the previously published protocol 26,27, human and mouse PDAC tumors were sectioned into 250-μm thick slices using the Leica VT1000S Vibrating blade microtome. The slices were then placed atop collagen-coated, 0.4-μm pore membrane inserts placed in 6-well plates. The slice cultures were treated with the indicated drugs the next day for 72–96 hours. At the end of the experiment, slices were fixed with 4% PFA overnight and processed by the Pathology Core at Northwestern University. The processed tissues were then embedded and sectioned for immunohistochemistry and immunofluorescent staining following the protocols described above.
Statistical Analysis
Error bars represent the standard error of the mean (SEM) or deviation (SD) as specified. The values for p and the specific statistical test performed for each experiment (paired/unpaired t-tests, one-way and two-way ANOVA tests, multiple comparison tests) are specified in figure legends. All statistical analyses were done using GraphPad. A p<0.05 value was considered significant.
Study Approval
All animal work and procedures were approved by the Northwestern University Institutional Animal Care and Use Committee. In addition, all animal experiments were performed in accordance with relevant guidelines and regulations. For human studies, pancreatic tissue was obtained from patients with PDAC undergoing resection on a protocol approved by the Institutional Review Board of Northwestern University. Written informed consent was obtained from patients before resection. All resected specimens were deidentified.
Data Availability
The data generated in this study are available within the article and its supplementary data files.
Results
Combination of 5FU, irinotecan, and oxaliplatin increases ERK phosphorylation in human and mouse pancreatic cancer models.
Compared to PDAC tumors from upfront resection, PDAC tumors treated with neoadjuvant FOLFIRINOX chemotherapy (Fig. 1A) express higher levels of ERK1/2 phosphorylation (Fig. 1B). To investigate the extent to which the combination of 5FU, irinotecan, and oxaliplatin directly increases MAPK/ERK signaling, we established ex vivo slice cultures from up-front resected primary PDAC tumors or tumors developing spontaneously in the LSL-KRasG12D x LSL-Tp53R172H x Pdx1-Cre (KPC) mouse model 21. The 6 mm tumor cores were sectioned into 250 μm tissue slices and cultured as previously described (Fig. 1C) 26,27. The PDAC slice cultures were treated with vehicle control or the FIO combination of 5FU (F), SN-38 (active metabolite of irinotecan, I), and oxaliplatin (O). We used concentrations of 5FU (4 μM), SN-38 (12.5 nM), and oxaliplatin (0.5 μM) present in the human PDAC tumor microenvironment following systemic treatment with FOLFIRINOX 22. After 72–96 hours of treatment, the slices were processed for H&E staining and immunofluorescent staining of p-ERK1/2. Compared to the control tumor slices, the FIO-treated human PDAC tumor slices demonstrate increased p-ERK1/2 staining (Fig. 1D). Similarly, the FIO-treated slice cultures established from KPC tumors also demonstrate increased ERK1/2 phosphorylation (Fig. 1E). Notably, we also see increased p-ERK1/2 in CK19− cells, suggesting that treatment with FIO results in ERK activation in stromal cells. As ERK1/2 phosphorylation is observed in CK19+ tumor cells, we investigated the effects of FIO treatment on KPC cell lines in vitro. Short-term FIO treatment was sufficient to induce ERK1/2 phosphorylation in all the KPC cell lines tested (Fig. 1F). Taken together, these data suggest that the increased MAPK/ERK signaling is a response of PDAC tumors to long- and short-term treatment with the combination regimen of 5FU, irinotecan, and oxaliplatin.
Fig. 1. Combination of 5FU, irinotecan, and oxaliplatin increases ERK phosphorylation in human and mouse pancreatic cancer models.

A. Schematic diagram illustrating neoadjuvant treatment with FOLFIRINOX in patients with localized pancreatic ductal adenocarcinoma (PDAC). B. Tumors from PDAC patients receiving neoadjuvant FOLFIRINOX and patients undergoing up-front surgery were co-stained for p-ERKThr202/Tyr204 and cytokeratin 19 (CK19) and counterstained with DAPI. Scale bar 150 μm. The number of p-ERK+ cells as a percentage of DAPI+ cells was quantified by ImageJ and analyzed by GraphPad. Error bar ± SEM. Unpaired t-test. **, p<0.01. C. Schematic diagram depicting how slice cultures are generated. 6mm punch biopsies from mouse and human PDAC tumors are sectioned by a vibratome to 250 μm thick slices and treated with chemotherapy. After 72–96 hours, slices are collected and analyzed by H&E and immunofluorescent (IF) staining. D, E. Slice cultures from human PDAC tumors (D) and a mouse KPC tumor (E) were treated with either vehicle control (Ctrl) or a combination of 5FU (F, 4 μM), SN-38 (I, 12.5 nM), and oxaliplatin (O, 0.5 μM) (FIO). After 72–96 hours, slices were collected and analyzed for histology by H&E staining and p-ERKThr202/Tyr204/CK19/DAPI by immunofluorescent staining. Scale bar 75 μm. The number of p-ERK+ cells as a percentage of DAPI+ cells was quantified by ImageJ, normalized to the vehicle-treated samples, and analyzed by GraphPad. Paired t-test. *, p<0.05. F. Mouse KPC cell lines (2138, 3886, 1245, 3213) were treated with a combination of 5FU (F, 4 μM), SN-38 (I, 12.5 nM), and oxaliplatin (O, 0.5 μM) (FIO) for 24 hours and analyzed for ERKThr202/Tyr204 phosphorylation and total ERK by western blotting with HSP90 as loading control. Blots are representative of at least three biological replicates.
Pancreatic cancer cells treated with repeated cycles of 5FU, irinotecan, and oxaliplatin combination demonstrate increased ERK phosphorylation.
To model human tumors treated with repeated cycles of the FOLFIRINOX regimen, we treated KPC cell lines with 6–8 cycles of the FIO combination of 5FU (4 μM), SN-38 (12.5 nM), and oxaliplatin (0.5 μM) to obtain a stable population of KPC-FIO cells (Fig. 2A). The KPC-FIO cells exhibit a spindle-shaped morphology (Fig. 2B) and demonstrate decreased sensitivity when re-challenged to the FIO combination (Supplemental Fig. S2) and the individual drugs 5FU (Supplemental Fig. S3), SN-38 (I) (Supplemental Fig. S4), and O (Supplemental Fig. S5) using proliferation and apoptosis assays. We also examined the response of the KPC and KPC-FIO cells to a number of different permutations of 5FU, SN-38, and oxaliplatin combination. Compared to the parental KPC cell lines, KPC-FIO cells reduce their proliferation in response to fewer combinations tested (Supplemental Fig. S6). Significantly, gene set enrichment analysis reveals downregulation of genes known to suppress MAPK/ERK pathway in the KPC-FIO cells (Fig. 2C). Correspondingly, we found that KPC-FIO cells demonstrate higher levels of ERK phosphorylation (Fig. 2D). Furthermore, similar to neoadjuvant FOLFIRINOX-treated human tumors (Fig. 1B), tumors established from the KPC-FIO cells also show upregulation of ERK phosphorylation both in cancer cells and stromal cells relative to tumors established from the corresponding parental KPC cells (Fig. 2E).
Fig. 2. KPC-FIO cells demonstrate increased ERK phosphorylation in vitro and in vivo.

A. Schematic diagram depicting how KPC-FIO cells are generated. Parental KPC cells are cultured in the presence of 4 μM 5FU, 12.5 nM SN-38 (the active metabolite of irinotecan), and 0.5 μM oxaliplatin for 3 days, then allowed to recover in drug-free media for 4 days. KPC-FIO cells are obtained after 6–8 cycles of treatment. B. Phase (top) and actin filament (bottom) pictures of the parental KPC (2138, 3886, 3213, 1245) and the corresponding KPC-FIO cells. Cells were stained for actin filaments using phalloidin and counterstained with DAPI following protocol described in Materials & Methods. Scale bar, 50 μm. C. Gene set enrichment analysis (GSEA) comparing 3213 (n = 3) and 3213-FIO (n = 3) cells for negative regulators of the MAPK kinase pathway. NES, normalized enrichment score. D. The KPC and KPC-FIO cells were analyzed for p-ERK1/2Thr202/Tyr204 and total ERK1/2 expression by western blotting with HSP90 as loading control. Blots are representative of at least three biological replicates. E. 3213, 3213-FIO, 2138, 2138-FIO, 3886, and 3886-FIO cells were subcutaneously implanted in C57BL/6 mice and allowed to form established tumors. The resulting tumors were immunofluorescence co-stained for p-ERKThr202/Tyr204 and CK19 and counterstained with DAPI. Scale bar 75 μm. The number of p-ERK+ cells as a percentage of DAPI+ cells were quantified by ImageJ and analyzed by GraphPad. Error bar ± SEM. Unpaired t-test. ***, p<0.001 ****, p<0.0001.
Trametinib induces apoptosis in the KPC-FIO cells and tumors.
We next evaluated the effect of MEK inhibition in the KPC and KPC-FIO cells using the well-established MEK inhibitor U0126 (U) and the FDA-approved MEK inhibitors Binimetinib (Bini, B), Cobimetinib (Cobi, C), Selumetinib (Selu, S), and Trametinib (Tram, T). As previously reported 28, MEK inhibitors vary in their ability to block ERK phosphorylation (Supplemental Fig. S7). Cobimetinib and Trametinib are more potent than other MEK inhibitors at blocking ERK phosphorylation in the KPC and KPC-FIO cells at 2 hours, with Trametinib demonstrating sustained MEK inhibition at 24 hours (Supplemental Figs. S7). Cobimetinib and Trametinib are also significantly more effective than other inhibitors at blocking the proliferation of KPC and KPC-FIO cells (Fig. 3A). Since Trametinib is most effective at suppressing ERK phosphorylation, we evaluated the effect of Trametinib on cell death. Compared to KPC cells, KPC-FIO cells demonstrate increased sensitivity to Trametinib-induced apoptosis (Fig. 3B). Similarly, while Trametinib is effective at attenuating KPC-2138 tumor growth (Fig. 3C), the effect is mainly anti-proliferative and not pro-apoptotic (Fig. 3D). In contrast, the Trametinib-mediated anti-tumor effects in the 2138-FIO tumors are found to be both anti-proliferative and pro-apoptotic (Figs. 3E, 3F).
Fig. 3. Trametinib induces apoptosis in the KPC-FIO cells and tumors.

A. The KPC and KPC-FIO cells were treated with DMSO, U0126 (2 μM), Binimetinib (2 μM, Bini), Cobimetinib (2 μM, Cobi), Selumetinib (2 μM, Selu), or Trametinib (2 μM, Tram) for 72 hours. The effects of different MEK inhibitors on cell proliferation were analyzed by WST-1 assay. Error bars ± SEM. *, p<0.05 **, p<0.01 ***, p<0.001 ****, p<0.0001. B. The KPC and KPC-FIO cells were treated with either vehicle control or Trametinib at the indicated doses for 48 hours and evaluated by Annexin V/PI staining for cell death. Representative flow blots were shown for 0.2 μM Trametinib. Error bars ± SEM. *, p<0.05 **, p<0.01 ***, p<0.001 ****, p<0.0001 ns, non-significant. C-F. Mice with established 2138 (C) and 2138-FIO (E) tumors were treated with DMSO as vehicle control or Trametinib (1 mg/kg, daily). Arrow indicates start of treatment. Tumor size was measured 2–3 times/week by caliper, and tumor volume was calculated using the formula V = (W2 × L)/2. Error bar ± SEM from 8–10 tumors. Unpaired t-test. *, p<0.05 **, p<0.01 ***, p<0.001 ****, p<0.0001 ns, non-significant. At the end, tumors were collected and co-stained for p-ERKThr202/Tyr204 and CK19 and counterstained with DAPI. Scale bar 75 μm. The DMSO- or Trametinib-treated 2138 (D) and 2138-FIO (F) tumors at endpoint were evaluated for proliferation and cell death by immunohistochemistry staining of Ki67 and cleaved caspase-3 (CC3), respectively. Scale bar, 100 μm. The number of positive cells was analyzed by ImageJ. Unpaired t-test. *, p<0.05 **, p<0.01 ***, p<0.001 ns, non-significant.
Tumors established from the KPC-FIO cells demonstrate a similar immune profile to human PDAC tumors treated with neoadjuvant FOLFIRINOX.
Neoadjuvant treatment of human PDAC tumors with FOLFIRINOX modulates their TiME with an increase in effector T cells and a reduction in immunosuppressive cells 7–9. In agreement with these reports, we showed that human PDAC tumors treated with neoadjuvant FOLFIRINOX demonstrate an increased number of CD8+ T cells, decreased number of CD68+ TAMs, and reduced expression of the immunosuppressive markers CD206 and Arginase-1 (Fig. 4A). We next compared the TiME of the KPC and KPC-FIO tumors grown in immunocompetent syngeneic mice. Compared to the tumors established from the parental KPC cells, tumors from KPC-FIO cells demonstrate increased infiltration by CD8+ T cells (Figs. 4B–4D). In addition, the 2138-FIO and 3213-FIO tumors display fewer F4/80+ TAMs and lower levels of the immunosuppressive marker CD206 (Figs. 4B, 4D). The 2138-FIO tumors also exhibit increased levels of T cell chemo-attractants (e.g., CXCL9, CXCL10, CCL5, CXCL13) and decreased levels of several cytokines produced by macrophages (e.g., GM-CSF, CXCL2) (Supplemental Figs. S8A, S8C). Notably, the conditioned media collected from 2138-FIO cells in culture also demonstrate increased expression of some of these cytokines, suggesting that the tumor cells contribute to the overall cytokine profile of the established tumors (Supplemental Figs. S8B, S8C).
Fig. 4. Tumors established from KPC-FIO cells share similar clinical features with neoadjuvant FOLFIRINOX-treated human tumors.

A. Tumors from neoadjuvant FOLFIRINOX-treated PDAC patients were stained by immunohistochemistry for CD8, CD68, CD206, and Arginase-1, and compared to tumors from patient undergoing up-front surgery. Scale bar 100 μm. The number of positive cells was analyzed by ImageJ. Error bars ± SEM. Unpaired t-test. *, p<0.05. B-D. 2138, 2138-FIO (B), 3886, 3886-FIO (C), and 3213, 3213-FIO (D) cells were subcutaneously implanted in C57BL/6 mice and allowed to form established tumors. At endpoint, tumors were collected and stained by immunohistochemistry for CD8, F4/80, CD206, and Arginase-1. Scale bar 100 μm. The number of positive cells was analyzed by ImageJ. Error bars ± SEM. Unpaired t-test. *, p<0.05 **, p<0.01 ****, p<0.0001 ns, non-significant. E-G. Established 2138, 2138-FIO (E), 3886, 3886-FIO (F), and 3213, 3213-FIO (G) tumors were treated with an anti-PD-1 antibody (250 μg, 3 times/week) or a control isotype-matched IgG (250 μg, 3 times/week). Arrow indicates start of treatment. Tumor size was measured 2–3 times/week by caliper, and tumor volume was calculated using the formula V = (W2 × L)/2. Error bars ± SEM from 4–8 tumors.
We next evaluated the response of the KPC-FIO tumors to anti-PD-1 treatment. While the KPC-FIO tumors grow slower than the corresponding KPC tumors, treatment with an anti-PD-1 antibody does not affect the growth of the KPC or the KPC-FIO tumors (Figs. 4E–4G). Collectively, these results demonstrate that the KPC-FIO tumors, like the neoadjuvant FOLFIRINOX-treated human PDAC tumors 7–9, exhibit a pro-inflammatory TiME but fail to respond to single-agent anti-PD-1 antibody, suggesting additional therapies are needed for effective anti-tumor responses.
Trametinib enhances infiltration by functional CD8+ T cells in the KPC-FIO tumors.
We next evaluated the immunomodulatory effects of Trametinib treatment in the KPC and KPC-FIO tumors. While Trametinib has variable effects on CD8+ T cell infiltration in the parental KPC tumors (Figs. 5A, 5C), Trametinib consistently increases CD8+ T cell infiltration in the KPC-FIO tumors (Figs. 5B, 5D). Importantly, in contrast to the tumor-infiltrating CD8+ T cells in the parental tumors (Figs. 5A, 5C), CD8+ T cells in the Trametinib-treated KPC-FIO tumors exhibit higher levels of functional markers, including granzyme B (GzmB), TNFα, and/or Perforin-1 (Prf1) (Figs. 5B, 5D). We further found that in the KPC-FIO tumors, Trametinib simultaneously decreases the number of monocytic MDSCs (M-MDSCs) and TAMs (Supplemental Fig. S9A) and reduces their expression of select immunosuppressive markers (Supplemental Fig. S9B), indicating the ability of Trametinib to attenuate an immunosuppressive TiME. In contrast, Trametinib does not significantly affect myeloid populations in the parental tumors (Supplemental Figs. S9C, S9D).
Fig. 5. Trametinib enhances infiltration by functional CD8+ T cells into the KPC-FIO tumors.

A-D. 2138 (A), 2138-FIO (B), 3886 (C), and 3886-FIO (D) cells were subcutaneously implanted in C57BL/6 mice and allowed to form tumors. Mice with established tumors were treated with DMSO as vehicle control or Trametinib (1 mg/kg, daily) for 2 weeks. DMSO or Trametinib-treated tumors at endpoint were processed and analyzed by flow cytometry for the frequency of CD4+ T cells (CD45+CD4+), CD8+ T cells (CD45+CD8+), and CD8+ T cell functional markers (IFNγ, Granzyme B (GzmB), TNFα, and Perforin-1 (Prf1)). Error bars ± SEM. Unpaired t-test. *, p<0.05 **, p<0.01 ***, p<0.001 ns, non-significant. All cells were gated from single live cells.
In parallel studies, we evaluated the effects of Trametinib in slice cultures established from resected human PDAC tumors previously treated with neoadjuvant FOLFIRINOX. Compared to the slice cultures treated with vehicle control, Trametinib-treated slice cultures display significantly lower levels of Arginase-1 (Arg1) (Supplemental Fig. S9E).
Trametinib sensitizes KPC-FIO tumors to anti-PD-1 antibody.
Since Trametinib reprograms the KPC-FIO tumors towards a less immunosuppressive TiME with increased infiltration of functional CD8+ T cells, we evaluated whether Trametinib could enhance the response of these tumors to anti-PD-1 treatment. As shown previously (Figs. 4E–4G), treatment with single-agent anti-PD-1 antibody does not affect the growth of KPC-FIO tumors (Figs. 6A, 6D). Significantly, the combination of Trametinib and an anti-PD-1 antibody induces tumor regression in the 3886-FIO tumors (Fig. 6A) and halts the growth of the 2138-FIO tumors (Fig. 6D) with increased tumor cell apoptosis in both models (Figs. 6B, 6E). The combination treatment also significantly extends the survival of tumor-bearing mice (Figs. 6C, 6F). We also evaluated the combination of Trametinib and an anti-PD-1 antibody in the orthotopic 2138-FIO tumors. Compared to single-agent anti-PD-1 antibody treatment, tumors treated with the combination of Trametinib and anti-PD-1 show significant preservation of uninvolved pancreas and an increase in tumor cell death (Figs. 6G, 6H). Mechanistically, the combination treatment is associated with a lower M2:M1 macrophage ratio (Supplemental Figs. S10A, S10B) and fewer Arg1+ immunosuppressive cells (Supplemental Fig. S10C). Correspondingly, CD8+ T cells isolated from the combination therapy-treated tumors exhibit elevated functional activity, as measured by their co-expression of TNFα and IFNγ (Fig. 6G).
Fig. 6. Trametinib sensitizes KPC-FIO tumors to anti-PD-1 treatment.
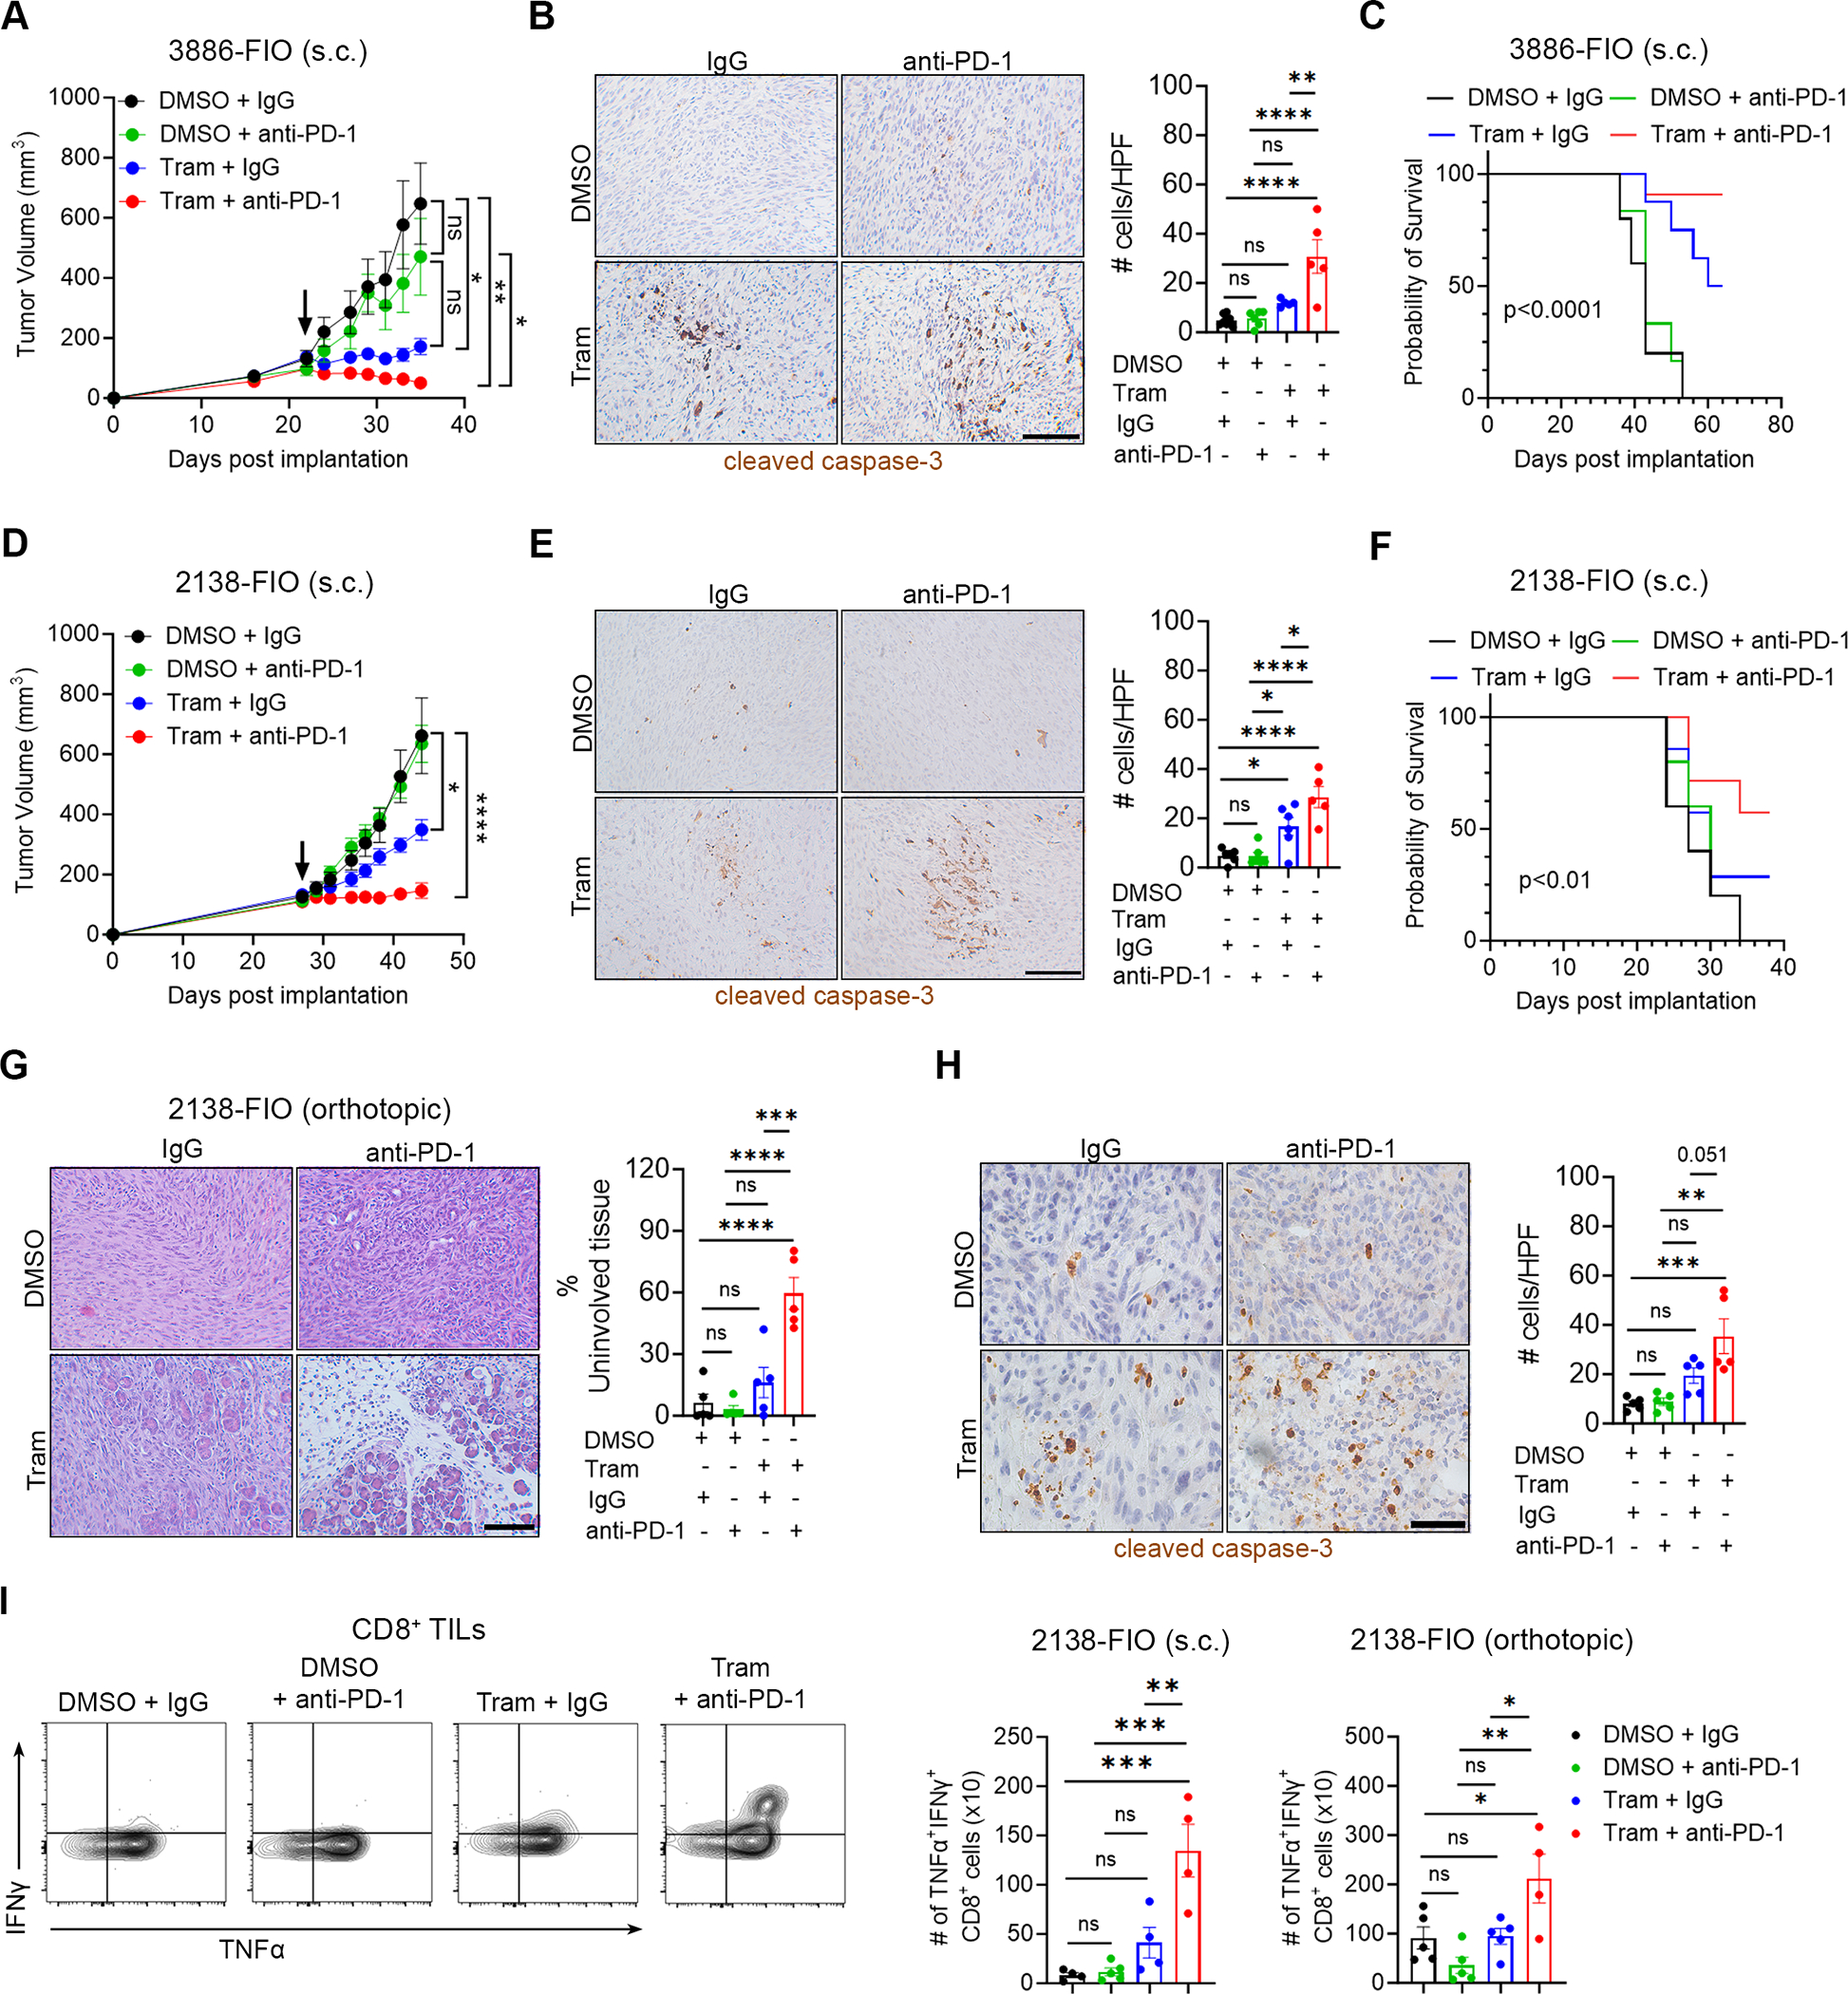
A-F. Mice with established subcutaneous (s.c.) 3886-FIO (A) and 2138-FIO (D) tumors were randomized and treated with Trametinib (Tram, 1 mg/kg, daily) or vehicle control (DMSO) in combination with an anti-PD-1 antibody (250 μg, 3 times/week) or a control isotype-matched IgG antibody (250 μg, 3 times/week). Arrow indicates the start of treatment. Tumor size was measured 2–3 times/week by caliper, and tumor volume was calculated using the formula V = (W2 × L)/2. Treated 3886-FIO (B) and 2138-FIO (E) tumors at endpoint were evaluated for cell death by immunohistochemistry staining of cleaved caspase-3. Scale bar, 100 μm. The number of positive cells was analyzed by ImageJ. The survival of tumor-bearing mice was evaluated and analyzed by Log-rank (Mantel-Cox) test (C, F). G, H. Mice with established orthotopic 2138-FIO tumors were randomized and treated with Trametinib (Tram, 1 mg/kg, daily) or DMSO as vehicle control in combination with an anti-PD-1 antibody (250 μg, 3 times/week) or a control isotype-matched IgG antibody (250 μg, 3 times/week). After 2 weeks, tumors were collected and evaluated for the extent of uninvolved pancreatic tissues by H&E staining (G) and cell death by cleaved caspase-3 staining (H). Scale bar, 100 μm. The number of positive cells was analyzed by ImageJ. I. Subcutaneous (s.c.) and orthotopic 2138-FIO tumors at study endpoint were evaluated for the absolute number of CD8+ cells (per 100,000 live cells) simultaneously expressing the activation markers IFNγ and TNFα. Error bars ± SEM. All analyses were performed using one-way ANOVA, followed by Tukey’s multiple comparison test. *, p<0.05 **, p<0.01 ***, p<0.001 ****, p<0.0001 ns, non-significant.
Discussion
PDAC is projected to become the second-leading cause of cancer-related deaths by 2030 1. Patients with localized disease often receive neoadjuvant FOLFIRINOX regimen in the hope of tumor stabilization/regression and subsequent resection 29. Several reports demonstrate neoadjuvant FOLFIRINOX can reduce pro-tumorigenic immune cells, e.g., regulatory T cells 8,9,30,31, MDSCs 7,31, and M2 TAMs 7–9, and increase the number and functions of infiltrating CD8+ T cells 7,8,30,31. As a result, there has been interest in using ICIs, e.g., anti-PD-1/PD-L1 targeting antibodies to further enable T cell responses in neoadjuvant chemotherapy-treated tumors. Given these combinations are currently being evaluated in patients with localized PDAC, it may be useful to identify additional therapeutic approaches that fully exploit the immune-modifying effects of neoadjuvant chemotherapy and potentiate ICI efficacy. We now show that human PDAC tumors treated with the FOLFIRINOX regimen exhibit increased ERK signaling and demonstrate that co-targeting MEK/ERK signaling has the potential to enhance the efficacy of ICIs following FOLFIRINOX treatment.
We show that MEK/ERK signaling is activated following treatment with a particular FIO combination regimen of 5FU, irinotecan, and oxaliplatin in several models. Short-term treatment of ex vivo slice cultures derived from human and mouse PDAC tumors as well as PDAC cell lines with this FIO regimen increases ERK phosphorylation. Long-term treatment of PDAC cell lines with FIO to model PDAC patients treated with multiple rounds of the FOLFIRINOX regimen also increases ERK phosphorylation. Like the human PDAC tumors treated with the FOLFIRINOX regimen, tumors established from these KPC-FIO cells also exhibit increased ERK signaling. Notably, we see increased ERK signaling not only in cancer cells but also in stromal cells in both FIO-treated ex vivo slice cultures and tumors established from KPC-FIO cells. Moreover, others have shown increased ERK signaling as a major mechanism conferring resistance to gemcitabine 32,33 and paclitaxel 34. Notably, in our present report, this increased ERK signaling in KPC-FIO cells and tumors predisposes them to Trametinib-mediated cell death compared to their corresponding parental KPC cells and tumors.
We demonstrate that KPC-FIO tumors exhibit a proinflammatory immune profile similar to that seen in human PDAC tumors treated with the neoadjuvant FOLFIRINOX regimen. Compared to the parental tumors, the KPC-FIO tumors have increased infiltration by CD8+ T cells, reduced immunosuppressive macrophages, and increased proinflammatory cytokines. This difference can likely be explained by the cytokine profile of the tumor cells. For instance, we have found that the KPC-2138-FIO cells produce higher levels of T cell chemoattractants (e.g., CXCL9/10, CCL5) and lower levels of monocyte chemoattractants (e.g., GM-CSF, CXCL2). This favorable TiME may be responsible for their slower growth compared to the parental tumors. However, despite this favorable immune profile, the KPC-FIO tumors fail to respond to single-agent anti-PD-1 treatment, suggesting additional therapies are needed to enhance T cell responses. We show that Trametinib facilitates additional infiltration by CD8+ T cells with enhanced cytolytic functions into the KPC-FIO tumors but not in the parental tumors. We further show that Trametinib selectively reduces M-MDSCs and TAMs and their production of Arginase-1. These findings support previous studies in breast and melanoma cancers, which propose that increased functional CD8+ T cells following treatment with MEK inhibitors may be causally linked to a reduction in M-MDSCs, accompanied by decreased Arginase-1 production 16,18.
Collectively, our data suggest that the cytokines secreted by the KPC-FIO tumor cells help increase T cell infiltration, and their sensitivity to Trametinib-induced killing further enhances cytolytic functions of the infiltrating T cells. This increase in functional CD8+ T cell infiltration in the KPC-FIO tumors but not in the parental KPC tumors could explain why Trametinib potentiates the efficacy of anti-PD-1 therapy only in the KPC-FIO tumors. The combination treatment further enhances the effector functions of CD8+ T cells, accounting for the increased tumor cell apoptosis. These data provide a strong rationale for combining MEK inhibitors, such as Trametinib, with ICIs, such as anti-PD-1/PD-L1 antibodies, in patients with localized PDAC following neoadjuvant FOLFIRINOX. However, given the recently reported suboptimal results with Cobimetinib (MEK inhibitor) and atezolizumab (anti-PD-L1 antibody), it will be crucial to ensure patients selected for the combination treatments have had their tumors sufficiently remodeled by chemotherapy with evidence of increased T cell infiltration and elevated MEK/ERK activity. Based on our preclinical findings, we expect the combination of Trametinib and anti-PD-1 antibody following FOLFIRINOX, rather than anti-PD-1 antibody alone, will be more likely to enable the most effective T cell-mediated anti-tumor responses. In addition to the neoadjuvant setting, the combination could potentially benefit advanced PDAC patients who demonstrate disease stabilization following treatment with FOLFIRINOX.
In summary, we have identified enhanced MEK/ERK signaling as a therapeutic target to potentiate anti-PD-1 efficacy and to achieve optimal T cell-mediated anti-tumor responses in PDAC tumors following FOLFIRINOX treatment.
Supplementary Material
Acknowledgements
This work was supported by NIH/NCI grants R01CA265997 and R21CA255291 (to H.G.M.), the Department of Veterans Affairs grants I01BX005595 and I21BX005693 (to. H.G.M), the NIH/NCI training grant T32CA070085 (to T.N.D.P), the Institutional Research Grant IRG-21-144-270 from the American Cancer Society (to T.N.D.P.), Lurie Cancer Center Diversity Scholars Award (to M.A.S), and the Robert and Lora Lurie Endowed Professorship (to H.G.M.). The Northwestern University pancreatic tumor bank is supported by the Michael and Pamela Gordon Family Foundation. Parts of this work were performed at the Pathology Core of the Lurie Cancer Center, which is supported by the NCI CCSG P30CA060553. The contents of this article are the responsibility of the authors and do not represent the views of the Department of Veterans Affairs or the United States Government.
Footnotes
The authors declare no potential conflicts of interest
References
- 1.Rahib L, Smith BD, Aizenberg R, Rosenzweig AB, Fleshman JM, and Matrisian LM (2014). Projecting cancer incidence and deaths to 2030: the unexpected burden of thyroid, liver, and pancreas cancers in the United States. Cancer Res 74, 2913–2921. 10.1158/0008-5472.CAN-14-0155. [DOI] [PubMed] [Google Scholar]
- 2.Siegel RL, Giaquinto AN, and Jemal A (2024). Cancer statistics, 2024. CA Cancer J Clin 74, 12–49. 10.3322/caac.21820. [DOI] [PubMed] [Google Scholar]
- 3.Conroy T, Desseigne F, Ychou M, Bouche O, Guimbaud R, Becouarn Y, Adenis A, Raoul JL, Gourgou-Bourgade S, de la Fouchardiere C, et al. (2011). FOLFIRINOX versus gemcitabine for metastatic pancreatic cancer. N Engl J Med 364, 1817–1825. 10.1056/NEJMoa1011923. [DOI] [PubMed] [Google Scholar]
- 4.Ghaneh P, Palmer D, Cicconi S, Jackson R, Halloran CM, Rawcliffe C, Sripadam R, Mukherjee S, Soonawalla Z, Wadsley J, et al. (2023). Immediate surgery compared with short-course neoadjuvant gemcitabine plus capecitabine, FOLFIRINOX, or chemoradiotherapy in patients with borderline resectable pancreatic cancer (ESPAC5): a four-arm, multicentre, randomised, phase 2 trial. Lancet Gastroenterol 8, 157–168. 10.1016/S2468-1253(22)00348-X. [DOI] [PubMed] [Google Scholar]
- 5.Katz MH, Shi Q, Ahmad SA, Herman JM, Marsh Rde W, Collisson E, Schwartz L, Frankel W, Martin R, Conway W, et al. (2016). Preoperative Modified FOLFIRINOX Treatment Followed by Capecitabine-Based Chemoradiation for Borderline Resectable Pancreatic Cancer: Alliance for Clinical Trials in Oncology Trial A021101. JAMA Surg 151, e161137. 10.1001/jamasurg.2016.1137. [DOI] [PMC free article] [PubMed] [Google Scholar]
- 6.Versteijne E, van Dam JL, Suker M, Janssen QP, Groothuis K, Akkermans-Vogelaar JM, Besselink MG, Bonsing BA, Buijsen J, Busch OR, et al. (2022). Neoadjuvant Chemoradiotherapy Versus Upfront Surgery for Resectable and Borderline Resectable Pancreatic Cancer: Long-Term Results of the Dutch Randomized PREOPANC Trial. J Clin Oncol 40, 1220–1230. 10.1200/JCO.21.02233. [DOI] [PubMed] [Google Scholar]
- 7.Dias Costa A, Vayrynen SA, Chawla A, Zhang J, Vayrynen JP, Lau MC, Williams HL, Yuan C, Morales-Oyarvide V, Elganainy D, et al. (2022). Neoadjuvant chemotherapy is associated with altered immune cell infiltration and an anti-tumorigenic microenvironment in resected pancreatic cancer. Clin Cancer Res. 10.1158/1078-0432.CCR-22-1125. [DOI] [PMC free article] [PubMed] [Google Scholar]
- 8.Michelakos T, Cai L, Villani V, Sabbatino F, Kontos F, Fernandez-Del Castillo C, Yamada T, Neyaz A, Taylor MS, Deshpande V, et al. (2021). Tumor Microenvironment Immune Response in Pancreatic Ductal Adenocarcinoma Patients Treated With Neoadjuvant Therapy. J Natl Cancer Inst 113, 182–191. 10.1093/jnci/djaa073. [DOI] [PMC free article] [PubMed] [Google Scholar]
- 9.Peng H, James CA, Cullinan DR, Hogg GD, Mudd JL, Zuo C, Takchi R, Caldwell KE, Liu J, DeNardo DG, et al. (2021). Neoadjuvant FOLFIRINOX Therapy Is Associated with Increased Effector T Cells and Reduced Suppressor Cells in Patients with Pancreatic Cancer. Clin Cancer Res 27, 6761–6771. 10.1158/1078-0432.CCR-21-0998. [DOI] [PMC free article] [PubMed] [Google Scholar]
- 10.Le DT, Durham JN, Smith KN, Wang H, Bartlett BR, Aulakh LK, Lu S, Kemberling H, Wilt C, Luber BS, et al. (2017). Mismatch repair deficiency predicts response of solid tumors to PD-1 blockade. Science 357, 409–413. 10.1126/science.aan6733. [DOI] [PMC free article] [PubMed] [Google Scholar]
- 11.O’Reilly EM, Oh DY, Dhani N, Renouf DJ, Lee MA, Sun W, Fisher G, Hezel A, Chang SC, Vlahovic G, et al. (2019). Durvalumab With or Without Tremelimumab for Patients With Metastatic Pancreatic Ductal Adenocarcinoma: A Phase 2 Randomized Clinical Trial. JAMA Oncol. 10.1001/jamaoncol.2019.1588. [DOI] [PMC free article] [PubMed] [Google Scholar]
- 12.Guo YJ, Pan WW, Liu SB, Shen ZF, Xu Y, and Hu LL (2020). ERK/MAPK signalling pathway and tumorigenesis. Exp Ther Med 19, 1997–2007. 10.3892/etm.2020.8454. [DOI] [PMC free article] [PubMed] [Google Scholar]
- 13.Kun E, Tsang YTM, Ng CW, Gershenson DM, and Wong KK (2021). MEK inhibitor resistance mechanisms and recent developments in combination trials. Cancer Treat Rev 92, 102137. 10.1016/j.ctrv.2020.102137. [DOI] [PubMed] [Google Scholar]
- 14.Ebert PJR, Cheung J, Yang Y, McNamara E, Hong R, Moskalenko M, Gould SE, Maecker H, Irving BA, Kim JM, et al. (2016). MAP Kinase Inhibition Promotes T Cell and Anti-tumor Activity in Combination with PD-L1 Checkpoint Blockade. Immunity 44, 609–621. 10.1016/j.immuni.2016.01.024. [DOI] [PubMed] [Google Scholar]
- 15.Hu-Lieskovan S, Mok S, Homet Moreno B, Tsoi J, Robert L, Goedert L, Pinheiro EM, Koya RC, Graeber TG, Comin-Anduix B, and Ribas A (2015). Improved antitumor activity of immunotherapy with BRAF and MEK inhibitors in BRAF(V600E) melanoma. Sci Transl Med 7, 279ra241. 10.1126/scitranslmed.aaa4691. [DOI] [PMC free article] [PubMed] [Google Scholar]
- 16.Allegrezza MJ, Rutkowski MR, Stephen TL, Svoronos N, Perales-Puchalt A, Nguyen JM, Payne KK, Singhal S, Eruslanov EB, Tchou J, and Conejo-Garcia JR (2016). Trametinib Drives T-cell-Dependent Control of KRAS-Mutated Tumors by Inhibiting Pathological Myelopoiesis. Cancer Res 76, 6253–6265. 10.1158/0008-5472.CAN-16-1308. [DOI] [PMC free article] [PubMed] [Google Scholar]
- 17.Poon E, Mullins S, Watkins A, Williams GS, Koopmann JO, Di Genova G, Cumberbatch M, Veldman-Jones M, Grosskurth SE, Sah V, et al. (2017). The MEK inhibitor selumetinib complements CTLA-4 blockade by reprogramming the tumor immune microenvironment. J Immunother Cancer 5, 63. 10.1186/s40425-017-0268-8. [DOI] [PMC free article] [PubMed] [Google Scholar]
- 18.Steinberg SM, Shabaneh TB, Zhang P, Martyanov V, Li Z, Malik BT, Wood TA, Boni A, Molodtsov A, Angeles CV, et al. (2017). Myeloid Cells That Impair Immunotherapy Are Restored in Melanomas with Acquired Resistance to BRAF Inhibitors. Cancer Res 77, 1599–1610. 10.1158/0008-5472.CAN-16-1755. [DOI] [PMC free article] [PubMed] [Google Scholar]
- 19.Eng C, Kim TW, Bendell J, Argiles G, Tebbutt NC, Di Bartolomeo M, Falcone A, Fakih M, Kozloff M, Segal NH, et al. (2019). Atezolizumab with or without cobimetinib versus regorafenib in previously treated metastatic colorectal cancer (IMblaze370): a multicentre, open-label, phase 3, randomised, controlled trial. Lancet Oncol 20, 849–861. 10.1016/S1470-2045(19)30027-0. [DOI] [PubMed] [Google Scholar]
- 20.Yarchoan M, Cope L, Ruggieri AN, Anders RA, Noonan AM, Goff LW, Goyal L, Lacy J, Li D, Patel AK, et al. (2021). Multicenter randomized phase II trial of atezolizumab with or without cobimetinib in biliary tract cancers. J Clin Invest 131. 10.1172/JCI152670. [DOI] [PMC free article] [PubMed] [Google Scholar]
- 21.Shields MA, Spaulding C, Metropulos AE, Khalafalla MG, Pham TND, and Munshi HG (2022). Galpha13 loss in Kras/Tp53 mouse model of pancreatic tumorigenesis promotes tumors susceptible to rapamycin. Cell Rep 38, 110441. 10.1016/j.celrep.2022.110441. [DOI] [PMC free article] [PubMed] [Google Scholar]
- 22.Hadj Bachir E, Poiraud C, Paget S, Stoup N, El Moghrabi S, Duchene B, Jouy N, Bongiovanni A, Tardivel M, Weiswald LB, et al. (2022). A new pancreatic adenocarcinoma-derived organoid model of acquired chemoresistance to FOLFIRINOX: First insight of the underlying mechanisms. Biol Cell 114, 32–55. 10.1111/boc.202100003. [DOI] [PubMed] [Google Scholar]
- 23.Pham TND, Kumar K, DeCant BT, Shang M, Munshi SZ, Matsangou M, Ebine K, and Munshi HG (2019). Induction of MNK Kinase-dependent eIF4E Phosphorylation by Inhibitors Targeting BET Proteins Limits Efficacy of BET Inhibitors. Mol Cancer Ther 18, 235–244. 10.1158/1535-7163.MCT-18-0768. [DOI] [PMC free article] [PubMed] [Google Scholar]
- 24.Pham TND, Stempel S, Shields MA, Spaulding C, Kumar K, Bentrem DJ, Matsangou M, and Munshi HG (2019). Quercetin Enhances the Anti-Tumor Effects of BET Inhibitors by Suppressing hnRNPA1. Int J Mol Sci 20. 10.3390/ijms20174293. [DOI] [PMC free article] [PubMed] [Google Scholar]
- 25.Favata MF, Horiuchi KY, Manos EJ, Daulerio AJ, Stradley DA, Feeser WS, Van Dyk DE, Pitts WJ, Earl RA, Hobbs F, et al. (1998). Identification of a novel inhibitor of mitogen-activated protein kinase kinase. J Biol Chem 273, 18623–18632. 10.1074/jbc.273.29.18623. [DOI] [PubMed] [Google Scholar]
- 26.Pham TN, Spaulding C, Shields MA, Metropulos AE, Shah DN, Khalafalla MG, Principe DR, Bentrem DJ, and Munshi HG (2022). Inhibition of MNKs promotes macrophage immunosuppressive phenotype to limit CD8+ T cell antitumor immunity. JCI Insight 7. 10.1172/jci.insight.152731. [DOI] [PMC free article] [PubMed] [Google Scholar]
- 27.Pham TND, Shields MA, Spaulding C, Principe DR, Li B, Underwood PW, Trevino JG, Bentrem DJ, and Munshi HG (2021). Preclinical Models of Pancreatic Ductal Adenocarcinoma and Their Utility in Immunotherapy Studies. Cancers (Basel) 13. 10.3390/cancers13030440. [DOI] [PMC free article] [PubMed] [Google Scholar]
- 28.Lito P, Saborowski A, Yue J, Solomon M, Joseph E, Gadal S, Saborowski M, Kastenhuber E, Fellmann C, Ohara K, et al. (2014). Disruption of CRAF-mediated MEK activation is required for effective MEK inhibition in KRAS mutant tumors. Cancer Cell 25, 697–710. 10.1016/j.ccr.2014.03.011. [DOI] [PMC free article] [PubMed] [Google Scholar]
- 29.Janssen QP, Buettner S, Suker M, Beumer BR, Addeo P, Bachellier P, Bahary N, Bekaii-Saab T, Bali MA, Besselink MG, et al. (2019). Neoadjuvant FOLFIRINOX in Patients With Borderline Resectable Pancreatic Cancer: A Systematic Review and Patient-Level Meta-Analysis. J Natl Cancer Inst 111, 782–794. 10.1093/jnci/djz073. [DOI] [PMC free article] [PubMed] [Google Scholar]
- 30.Heiduk M, Plesca I, Gluck J, Muller L, Digomann D, Reiche C, von Renesse J, Decker R, Kahlert C, Sommer U, et al. (2022). Neoadjuvant chemotherapy drives intratumoral T cells toward a proinflammatory profile in pancreatic cancer. JCI Insight 7. 10.1172/jci.insight.152761. [DOI] [PMC free article] [PubMed] [Google Scholar]
- 31.Mota Reyes C, Teller S, Muckenhuber A, Konukiewitz B, Safak O, Weichert W, Friess H, Ceyhan GO, and Demir IE (2020). Neoadjuvant Therapy Remodels the Pancreatic Cancer Microenvironment via Depletion of Protumorigenic Immune Cells. Clin Cancer Res 26, 220–231. 10.1158/1078-0432.CCR-19-1864. [DOI] [PubMed] [Google Scholar]
- 32.Zheng C, Jiao X, Jiang Y, and Sun S (2013). ERK1/2 activity contributes to gemcitabine resistance in pancreatic cancer cells. J Int Med Res 41, 300–306. 10.1177/0300060512474128. [DOI] [PubMed] [Google Scholar]
- 33.Zhu YX, Li CH, Li G, Feng H, Xia T, Wong CH, Fung FKC, Tong JH, To KF, Chen R, and Chen Y (2020). LLGL1 Regulates Gemcitabine Resistance by Modulating the ERK-SP1-OSMR Pathway in Pancreatic Ductal Adenocarcinoma. Cell Mol Gastroenterol Hepatol 10, 811–828. 10.1016/j.jcmgh.2020.06.009. [DOI] [PMC free article] [PubMed] [Google Scholar]
- 34.Huang C, Zhang X, Jiang L, Zhang L, Xiang M, and Ren H (2019). FoxM1 Induced Paclitaxel Resistance via Activation of the FoxM1/PHB1/RAF-MEK-ERK Pathway and Enhancement of the ABCA2 Transporter. Mol Ther Oncolytics 14, 196–212. 10.1016/j.omto.2019.05.005. [DOI] [PMC free article] [PubMed] [Google Scholar]
Associated Data
This section collects any data citations, data availability statements, or supplementary materials included in this article.
Supplementary Materials
Data Availability Statement
The data generated in this study are available within the article and its supplementary data files.