

Abstract
Amyloid plaques, implicated in Alzheimer’s disease, exhibit a spatial propagation pattern through interconnected brain regions, suggesting network-driven dissemination. This study utilizes PET imaging to investigate these brain connections and introduces an innovative method for analyzing the amyloid network. A modified version of a previously established method is applied to explore distinctive patterns of connectivity alterations across cognitive performance domains. PET images illustrate differences in amyloid accumulation, complemented by quantitative network indices. The normal control group shows minimal amyloid accumulation and preserved network connectivity. The MCI group displays intermediate amyloid deposits and partial similarity to normal controls and AD patients, reflecting the evolving nature of cognitive decline. Alzheimer’s disease patients exhibit high amyloid levels and pronounced disruptions in network connectivity, which are reflected in low levels of global efficiency (Eg) and local efficiency (Eloc). It is mostly in the temporal lobe where connectivity alterations are found, particularly in regions related to memory and cognition. Network connectivity alterations, combined with amyloid PET imaging, show potential as discriminative markers for different cognitive states. Dataset-specific variations must be considered when interpreting connectivity patterns. The variability in MCI and AD overlap emphasizes the heterogeneity in cognitive decline progression, suggesting personalized approaches for neurodegenerative disorders. This study contributes to understanding the evolving network characteristics associated with normal cognition, MCI, and AD, offering valuable insights for developing diagnostic and prognostic markers.
Supplementary Information
The online version contains supplementary material available at 10.1007/s10278-024-01230-7.
Keywords: Amyloid plaque, Positron emission tomography, Brain connectivity, Graph theory
Introduction
Positron emission tomography (PET) is pivotal in investigating neurological disorders, offering valuable insights into brain metabolism, perfusion, and various molecular pathways [1–3]. Increasing evidence suggests that amyloid plaques, associated with conditions like Alzheimer’s disease, exhibit a characteristic spatial pattern rather than random distribution in the brain [4]. This spatial pattern may involve the expansion of amyloid deposition into areas that receive neuronal projections from regions already displaying Aβ pathology, indicating a spread between interconnected neurons through large-scale networks [5]. Connectivity analysis methods in nuclear medicine neuroimaging, particularly in the context of PET studies, include established approaches such as seed-based correlation analysis [6], principal component analysis [7], independent component analysis [8], and methods based on pairwise covariance of brain regions [9]. These methods enable researchers to explore the intricate connectivity patterns and relationships between brain regions, providing a comprehensive understanding of the underlying neural mechanisms in neurological disorders.
In recent years, examining the brain’s organization as a large-scale network has gained significant traction, leveraging concepts from graph theory [10]. This methodology enables the construction of amyloid networks, where nodes represent the mean amyloid values from distinct brain regions, interconnected by edges that reflect the links or correlations between them. A previous study employing graph theory analyses demonstrated that Aβ accumulation in the medial temporal lobe is associated with accumulation in medial parietal, orbitofrontal, and temporal areas in individuals with low amyloid burden [11]. Furthermore, studies comparing amyloid networks between controls and individuals with mild cognitive impairment (MCI) [12, 13] or controls and Alzheimer’s disease (AD) patients [12–14] revealed network abnormalities in temporal regions [13], frontal and parietal regions [12], or occipital areas [14] within respective patient groups. These findings underscore the utility of network-based analyses in elucidating the spatial distribution of amyloid pathology in various neurological conditions.
Currently, it remains unclear whether amyloid-beta (Aβ) pathology exerts a similar impact on nodal centrality (i.e., the number of connections), integration (i.e., critical long-distance connections), or segregation (i.e., local clustering of connections) properties of network organization. Investigating the relationship between Aβ deposition in different brain regions becomes crucial, as it may provide essential clues on how Aβ pathology propagates in the brain. However, most amyloid networks have been analyzed or inferred through group-level data using functional magnetic resonance imaging (fMRI), rather than adopting an individualized approach to connectivity analysis.
Li et al. highlight the current trend in constructing amyloid networks primarily using fMRI-based networks for analysis or relying on group-level data for inference [15]. There is a notable gap in understanding individualized connectivity patterns in relation to amyloid pathology, which may contribute to a more comprehensive understanding of the impact of Aβ on brain network organization at the individual level.
Deriving meaningful insights from amyloid PET images requires the implementation of robust quantitative methods. A conventional and extensively employed strategy involves the classical method centered on regions of interest (ROIs), proving its efficacy across diverse scenarios [16, 17]. Nonetheless, a significant drawback of these univariate methods lies in their incapacity to explore the connections between brain regions, commonly referred to as connectivity. More approaches are essential to uncovering these connectivity patter to uncover these connectivity patterns. These methods have the capability to capture intricate interactions among various brain regions, offering a more comprehensive understanding of the neural architecture associated with amyloid PET imaging data.
To establish an amyloid connectivity network, we employed the methodology developed in our previous study [18]. Initially designed for PET-FDG images, this method was specifically tailored to address the challenges of generating personalized brain connectivity networks from PET data. In this study, we modified the individual metabolic brain network framework to construct a novel amyloid brain network, specifically addressing concerns regarding the potential underestimation of standardized uptake values ratio (SUVR) values in the final matrix calculation. Additionally, we refined the approach to overcome the difficulties associated with threshold determination.
This study introduces a novel methodology for constructing amyloid brain connectivity models, focusing on using amyloid PET images and graph theoretical analysis. By incorporating a diverse range of datasets from multiple hospitals, this comprehensive approach not only demonstrates the flexibility of our proposed method but also showcases its effectiveness in detecting subtle alterations in brain connectivity. This ability to identify nuanced connectivity changes is particularly evident when employing amyloid PET images within our analytical framework.
Materials and Methods
Subjects
In this study, we have used an external dataset from the Alzheimer’s Disease Neuroimaging Initiative (ADNI) database and two internally acquired datasets (Index: G1 and G2) from two institutions. The recruitment of participants from these two institutions was approved by the Institutional Review Board of Chang Gung Memorial Hospital. Table 1 lists summary statistics for the participants’ characteristics, including sex, age, number of years of education completed, Mini-Mental State Examination (MMSE) scores, and Clinical Dementia Rating (CDR).
Table 1.
Patient recruitment summary
| Normal | MCI | AD | |
|---|---|---|---|
|
ADNI Number of subjects |
69 | 591 | 164 |
| Gender (male/female) | 27/42 | 330/261 | 84/80 |
| Age (mean) | 71.95 | 73.43 | 75.21 |
| Education years (mean) | 16.77 | 16.11 | 15.46 |
| MMSE (mean) | 29.11 | 27.47 | 22.05 |
| CDR (mean) | 0.03 | 0.52 | 0.91 |
|
Institution 1 Number of subjects |
17 | 31 | 31 |
| Gender(male/female) | 10 / 7 | 18 / 13 | 10/21 |
| Age (mean) | 64.11 | 71.13 | 71.29 |
| Education years (mean) | 14.18 | 9.9 | 10.16 |
| MMSE (mean) | 28.94 | 25.71 | 22 |
| CDR (mean) | 0.19 | 0.48 | 0.68 |
|
Institution 2 Number of subjects |
19 | 60 | 45 |
| Gender(male/female) | 14/5 | 37/23 | 14/31 |
| Age (mean) | 70.9 | 68.98 | 71.65 |
| Education years (mean) | 11.5 | 8.87 | 8.92 |
| MMSE (mean) | 26.2 | 24.89 | 22.47 |
| CDR (mean) | 0.2 | 0.46 | 0.54 |
Data used to prepare this article were obtained from the Alzheimer’s Disease Neuroimaging Initiative (ADNI) database (adni.loni.usc.edu). The primary goal of ADNI has been to test whether serial magnetic resonance imaging (MRI), PET, other biological markers, and clinical and neuropsychological assessment can be combined to measure the progression of mild cognitive impairment (MCI) and early AD. The 18F-AV-45 PET and T1-weighted MRI data used in the present study were from the ADNI-1, ADNI-2, and ADNI-GO in Alzheimer’s Disease Neuroimaging Initiative (ADNI) database (http://adni.loni.usc.edu/).
The external samples consisted of non-demented individuals who were cognitively normal (CN), mild cognitive impairment (MCI), and Alzheimer's disease (AD). In brief, the included subjects were between the ages of 55 and 90 years. These subjects were recruited and assessed across different clinical sites in the USA and Canada (for a full list of ADNI's sites, see Weiner et al. 2010.
The internal study commenced in August 2019 and enrolled participants who met the criteria for three distinct groups: CN, MCI, and AD.
Exclusion criteria consisted of a history of clinical stroke, a modified Hachinski ischemic score of > 4, the presence of degenerative brain diseases other than AD, severe white matter diseases indicated by lesions on T2-weighted magnetic resonance imaging (MRI), clinically unmanaged diabetes, and diagnoses of major depressive disorder or dysthymic disorder according to the Diagnostic and Statistical Manual of Mental Disorders, fourth edition, text revision (DSM-IV-TR).
Cognitive Assessment
To evaluate cognitive function, a trained neuropsychologist conducted a series of neurobehavioral tests. These tests included the Mini-Mental State Examination (MMSE) and the Cognitive Ability Screening Instrument (CASI). The CASI consists of nine subdomains, with executive domains assessing attention, verbal fluency, abstract thinking, and mental manipulation, while non-executive domains evaluate orientation, short-term memory (STM), long-term memory, language ability, and visual construction.
Data Acquisition and Image Reconstruction
The synthesis of 18F-Florbetapir took place at the cyclotron at Chang Gung Memorial Hospital, Linkou. In Linkou, each PET acquisition consisted of two 5-min dynamic frames obtained 50–60 min post-injection in 3D mode from a Biograph mCT PET/CT System PET projection data were iteratively reconstructed using 3-D OSEM algorithm of 4 iterations, 24 subsets, post-smoothed by a Gaussian filter of 2 mm FWHM and zoom = 3, and with CT-based attenuation correction. Scatter and random correction were also performed using the correction methods provided by the manufacturer. In Kaohsiung, each PET acquisition consisted of two 5-min dynamic frames obtained 50–60 min post-injection in 3D mode from a GE discovery MI PET/CT scanner. 3D PET images were acquired and images were reconstructed with an iterative reconstruction algorithm (OSEM 4 iterations, 16 subsets) and a post hoc 5 mm Gaussian filter.
All downloaded PET and MRI data were then further processed using PMOD image analysis software (version 4.0; PMOD Technologies Ltd., Zurich, Switzerland) and spatially normalized into the Montreal Neurological Institute (MNI) space based on the AAL template from the PMOD. We are utilizing MRI data for registration in image pre-processing to mitigate the PVE. Finally, all images were automatically segmented into 90 anatomical structures (volumes of interest, VOIs) using the AAL atlas. For the standard quantification procedure of the AV-45 image, the regional radioactivity concentration was first converted to standardized uptake values (SUVs). Then, the SUVR of the mean SUVs between the target and reference regions was calculated with the entire cerebellum as the reference region. The composite mask of the cerebellum was applied to masks to remove the associated voxels susceptible to PVE spillover. Finally, each subject’s regional SUVR for each AAL structure was extracted to construct the SUVR data matrix.
Optimal Individual Amyloid Brain Network
The group-based amyloid correlation matrix provides an aggregate representation of the average connectivity within a given cohort yet overlooks individual networks. The methodology for constructing individual amyloid brain networks remains elusive, primarily due to the prevalent representation of amyloid accumulation as a singular value. This stands in contrast to functional magnetic resonance imaging (fMRI), which is time series data, facilitating the straightforward construction of correlation matrices. Consequently, we adopted an indirect approach to delineate amyloid brain networks for each subject. This involved employing a previously developed metabolic network approach, wherein each subject underwent systematic comparison with a normative group of individuals devoid of discernible amyloid pathology.
To address this limitation, we introduced metabolic brain network methodology to derive individual amyloid networks based on the effect size difference of SUVR between a singular subject and a normative control group.
The effect size method of calculations remains consistent with those published in our 2020 article [18]. In our prior publication, we modified a treatment effect measure from an independent-group pretest–posttest design to calculate the regional difference between the single-subject SUVR deviations from the mean SUVR value of normal subjects in two regions. Let xi and xj be regional SUVRs for regions i and j from one subject, and be the mean regional SUVR of the normal group, while si and sj are the corresponding standard deviations of the SUVR. we employed effect size (ES) calculations to measure the disparities between patient and normal groups [19–22].
Then, the ES difference of the SUVR deviation between the ith and jth regions from corresponding regions in the normal group can be calculated as
| 1 |
Cohen (1988) suggested using the following pooled standard deviation .
The ES values are computed for all pairs of Regions of interest (ROI), resulting in a final ES matrix of dimensions 90 × 90. Notably, ES(i, j) conforms to a bivariate normal distribution. Then, the ES(i, j) were transformed to the z score [23] using Fisher’s z-to-r transformation, which ensures an approximate normal distribution [24]. We can derive the correlation coefficient value R(i, j) between ith and jth regions can be derived as
| 2 |
The value of R(i, j) is constrained to the range of 0 to 1 and diminishes as ES(i, j) increases. Subsequently, the weighting matrix W(i, j) = 1 − R(i, j) for an individual subject.
However, the transformation formula (Eq. 2) in amyloid imaging depicts regions where amyloid accumulates, as quantified by SUVR, representing the extent of amyloid deposition. Consequently, this calculation method yields higher R(i, j) values, as these regions reflect increased amyloid burden. Nevertheless, our objective is to identify regions associated with normal neural connectivity, characterized by minimal impact from deposition. In other words, areas with higher amyloid deposition should exhibit reduced connectivity. To address this, we have introduced an adjustment by utilizing 1 − R(i, j) as a weighting factor, denoted as W(i, j), for the regional correlation coefficient between the individual subject and the normal control group.
The final individual correlation matrix for a single subject with element M(i, j) between regions i and j was then calculated as
| 3 |
where MCN (i, j) is the group-based correlation coefficient between the ith and jth regions of the normal control group, and W(i, j) = 1 − R(i, j). The final individual correlation coefficient matrix (i.e., connectivity matrix) for a single subject, and ⊙ indicates an element-by-element multiplication.
We initially employed the individual amyloid brain network (iABN) method to generate a whole-brain correlation matrix for each patient. However, challenges in network optimization persisted, leading to diverse threshold values in different literature discussing the results. Notably, due to individual variations, the application of uniform threshold values proved inappropriate. Consequently, we introduced a network optimization method to address this issue.
Applying a network threshold serves to eliminate inconsequential (or low-impact) edges and streamline the network complexity. In the case of individual correlation matrices, a thresholding procedure grounded in Orthogonal Minimal Spanning Trees (OMSTs) was incorporated to reconstruct a refined individual amyloid brain network (Optimal-iABN) for each patient. The Optimal-iABN approach optimizes the balance between network global efficiency and network cost, defined as the ratio of the total weight of existing edges to the strength of the original fully weighted graph. This methodology facilitates the generation of a personalized brain network tailored to the specific characteristics of each patient.
The processing steps for the Optimal-iABN were summarized as follows 5 steps (in Fig. 1):
Conduct spatial normalization and SUVR calculation for all amyloid PET images.
Generate a correlation coefficient matrix for the CN group and compute the mean ( and ) and standard deviation (si and sj) from amyloid PET images within the CN group.
Calculate the difference of regional ES(i, j) for each SUVR value in the amyloid PET images from each patient.
Construct the final individual correlation coefficient matrix M(i, j).
Introduce Orthogonal Minimal Spanning Tree (OMST) conditions to filter an Optimal-iABN and graph theory analysis.
Fig. 1.

Schematic workflow of calculating an individual amyloid matrix of correlation coefficients by first calculating the individual weight matrix (W) and normal matrix (MNC) from the normal group, and then multiplying both W and MNC to obtain the individual correlation coefficient matrix (M). Finally, the individual correlation coefficient matrix transfers to the optima-individual amyloid brain network by OMSTs method
For more detailed information about the iABN, please refer to our previously proposed metabolic network methodology [Huang, 2020].
Topography Analysis
In network or graph analysis, network parameters typically correspond to fixed network structures. However, different thresholds may result in varied network structures. One challenge in network analysis is determining a correct or appropriate threshold value. Consequently, most literature employs different thresholding strategies to depict variations in network parameters. In our study, we utilized the Optimal Minimum Spanning Trees (OMSTs) method to obtain the Optimal individual amyloid brain Network (Optimal-iABN). Thus, we calculate personalized network parameters directly without the need for thresholding strategies.
We utilized the functional network established based on the AAL atlas [25] and conducted network analysis using the GRETNA toolbox [26]. GRETNA facilitates the computation of the area under the curve (AUC) for each network measure, providing a scalar independent of specific threshold selections. Notably, this module specializes in the topological analysis of brain networks. [27–29].
Within the GRETNA framework, we applied seven global metrics derived from graph theoretical analysis. These metrics encompass global efficiency (Eg), local efficiency (Eloc), clustering coefficient (Cp), the gamma of a network (Gamma), the lambda of a network (Lambda), characteristic path length (Lp), and the sigma of a network (Sigma).
The brain network demonstrated the small-world property. Concerning network efficiency [27, 30], global efficiency (Eg) denoted the efficiency of parallel information transfer in the network. Local efficiency (Eloc) gauged the fault tolerance of the network. Clustering coefficients (Cp), a measure of clustered connectivity around individual nodes, and characteristic path length (Lp), an average distance measure for all possible node pairs in the network, were pivotal parameters in characterizing brain networks. The normalized clustering coefficient (gamma), representing the ratio of Cp between real and random networks, and the normalized characteristic path length (lambda), denoting the ratio of Lp between real and random networks, were defined. Additionally, small-world (sigma = gamma/lambda) served as a quantitative parameter.
Statistical Analysis
To evaluate mean differences between the two groups, we conducted a two-sample t-test, yielding varying P values. To further identify statistically significant mean differences between specific pairs, we performed a post-hoc test for multiple comparisons (The variables included Eg, Eloc, and Cp in CN, MCI, and AD). A statistically significant P value in the post-hoc test indicates at least one pair of groups exhibiting a statistically significant mean difference. All statistical analyses were performed using SPSS Statistics for Windows (version 17.0, 2008), with a significance level set at p < 0.001. The statistical significance level for Pearson’s correlation was set at P < 0.05 employing the Bonferroni correction.
Results
In constructing a connectivity network, a connectivity matrix is typically transformed into a binary matrix using a threshold, as outlined by Huang et al. (2018). In this process, links surpassing the threshold are denoted by 1, indicating the presence of an edge, while those falling below it are denoted by 0, indicating the absence of an edge. To simplify the visualization of the connectivity network in this study, the lowest threshold value for the connectivity map in the NC group, comprising 90 nodes, was uniformly applied across all groups. Importantly, the chosen threshold value, based on our previous work [18], was consistently used in all subsequent group-level analyses.
In Fig. 1, discrepancies in connectivity patterns among the datasets are notable when examining the connectivity matrices based on different datasets (first column). Particularly, variations in normal template connections are observed in the temporal lobe. The dataset from L-CG exhibits significantly reduced connectivity relative to the other two datasets. In the case of the ADNI dataset, the lower overall connectivity is limited to a few small regions. Comparable outcomes are evident in the average single-subject connectivity matrices presented in the second to fourth columns, representing the mean single-subject matrices for CN, MCI, and AD, respectively. Among all the matrices, the connectivity matrix for NC exhibits a greater number of statistically significant connections in comparison to AD. In AD, there is a noticeable reduction in connections, particularly between the temporal lobe and other regions. The connectivity patterns progressively decrease starting from NC, with the fewest connections observed in AD. Additionally, in the other two dataset groups, there is no substantial change in the number of connections between MCI and AD. Figure 3 demonstrates a significant reduction in correlation edges when comparing CN to AD (p < 0.01). Moreover, in the other two dataset groups, a trend similar to Fig. 2 is observed, with no significant difference in the patterns between MCI and AD (p > 0.01).
Fig. 2.

The data utilized in the first row of the figure, spanning from the first to the third columns, originates from (ADNI, Linkou, and Kaohsiung). Matrices depicting correlation coefficients between brain regions of the right and left hemispheres (vertical axis) are presented. The inter-hemispheric connectivity is visualized through correlation coefficient matrices between the right hemisphere (horizontal axis) and left hemisphere (vertical axis) brain regions for NC, MCI, and AD. These matrices are derived using the normal template (initial column) and average individual connectivity matrices (second to fourth columns) employing the proposed methodology
Instead of relying on a single threshold, we implemented a sparsity threshold range from 0.10 to 1, with an interval of 0.01, across all correlation matrices in our study, following the methodology outlined by Huang et al. (2018). The selection of the sparsity value range was guided by insights from previous studies. Figure 2 provides an axial view of the inter-hemispheric connectivity network derived from a binary matrix, evaluated at three correlation coefficient thresholds (0.7, 0.6, 0.65) for all three datasets.
In the ADNI dataset (first row), the lowest threshold value of 0.7 was applied to all groups (CN, MCI, and AD), resulting in a network with 90 nodes. A noticeable decrease in intra-hemispheric connections was observed in both MCI and AD, with some connections persisting in the frontal lobe. Connectivity in other brain regions exhibited a significant reduction. Figure 2, in the second and third rows, employed the same method of threshold values to illustrate the outcomes of brain region connections. Similar patterns were identified in these figure rows, with connections predominantly concentrated in the frontal lobe and a smaller proportion in inter-hemispheric connectivity (Figs. 3 and 4).
Fig. 3.

The number of edges, serving as a measure of network connectivity, reaches its peak in the NC group across a broad spectrum of correlation thresholds (0 < correlation coefficient values < 1) for three datasets (ADNI, Linkou, and Kaohsiung) in the NC, MCI, and AD conditions
Fig. 4.

Brain connectivity graphs illustrate present NC, MCI, and AD across three datasets. The inter-hemispheric connectivity graphs were visualized for the three groups in each dataset, derived from thresholding the correlation coefficient matrix. In the graphical representation, brain connections are depicted by black lines, while nodes are represented by color-coded dots. Specifically, red dots denote the central lobule, pink dots represent the frontal lobe, yellow dots correspond to the parietal lobe, green dots signify the temporal lobe, light blue dots represent the occipital lobe, deep blue dots indicate the Limbic lobe and deep red dots represent other regions. This visualization provides a comprehensive overview of the inter-hemispheric connectivity patterns in the brain for individuals in the NC, MCI, and AD groups across the three datasets
In the ADNI dataset, all three groups exhibited a small-world topology, as evidenced by the results of the two-sample t test, which revealed significant inter-group differences in small-world parameters (see Fig. 5, first row). The AD group displayed significantly lower values for global efficiency (Eg), local efficiency (Eloc), and clustering coefficient (Cp) (p value < 0.001) compared to those observed in the NC and MCI groups. Upon examining the average values of network indices across the three groups, there was a gradual decline from CN to MCI and further to AD in terms of small-world parameters. However, among the other four parameters, significant differences persisted, exhibiting a trend of gradual increase across the three groups. This observation suggests a nuanced alteration in network characteristics as individuals transition from CN to MCI and eventually to AD.
Fig. 5.

The differences in network efficiency between NC, MCI, and AD groups. NC, healthy controls; MCI, mild cognitive impairment; AD, Alzheimer’s disease; The differences in small world metrics (Eg, Eloc, Cp, Gamma, Lambda Lp, and Sigma) of the brain functional networks between NC, MCI, and AD groups. Error bars represent standard errors
Similar trends were observed in the other two datasets, with the aforementioned patterns across the three groups. In these datasets, as well, all three groups demonstrated a small-world topology. The results of the two-sample t-test indicated significant inter-group differences in small-world parameters, as illustrated in Fig. 5 (first row). Specifically, the AD group exhibited markedly lower values for global efficiency (Eg), local efficiency (Eloc), and clustering coefficient (Cp) (p value < 0.0001) compared to the NC and MCI groups. The average values of network indices across the three groups in these datasets, a gradual decline from NC to MCI and further to AD was observed in terms of small-world parameters. However, for the other four parameters, significant differences persisted, showing a gradual increase across the three groups. This consistent pattern suggests a robust trend in the alteration of network characteristics as individuals progress from CN to MCI and ultimately to AD across multiple datasets.
Each box plot provides a visual representation of the variability and central tendency of these network indices within the respective datasets. The arrangement allows for a comparative analysis of the three parameters across different datasets, providing insights into the variations and similarities in global and local efficiency, as well as the clustering coefficient, among the groups within each dataset. In Fig. 6, the box plots of the three parameters of CN, MCI, and AD, respectively, exhibit distinct and rarely overlapping ranges, particularly noticeable in the second and third datasets which the value range of CN is entirely separated from that of MCI and AD. Furthermore, the value range of MCI across different datasets shows varying degrees of overlap with the AD value range (Fig. 7).
Fig. 6.

This figure depicts three distinct datasets from top to bottom. Moving from left to right within each dataset, the box plots represent the distribution of the global efficiency (Eg), local efficiency (Eloc), and clustering coefficient (Cp) parameters
Fig. 7.
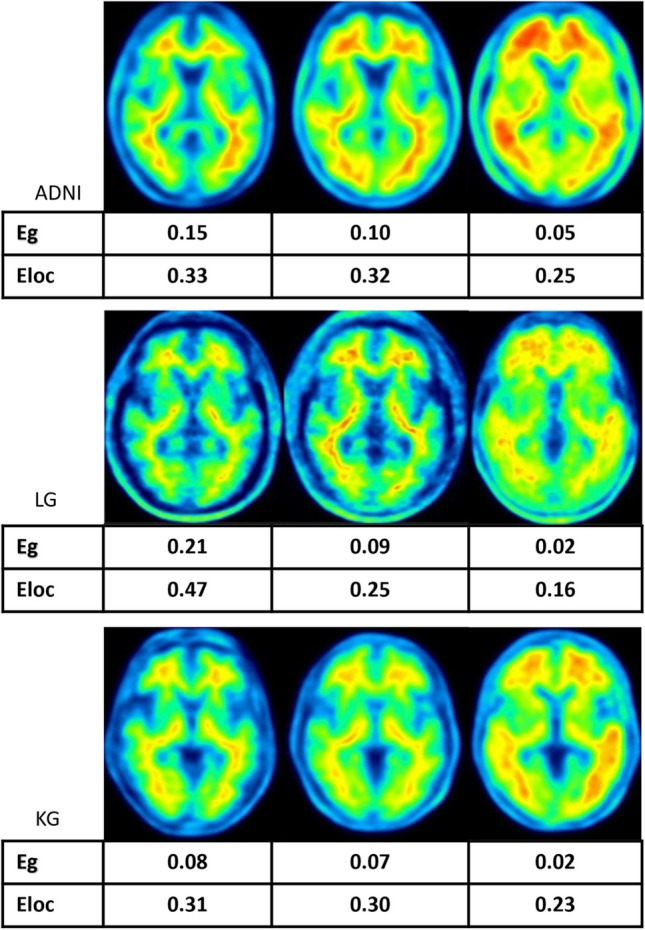
Selected representative amyloid PET images of individuals with varying levels of cognitive performance are presented from left to right in three datasets. These images depict cases from three groups: normal controls, subjects with mild cognitive impairment (MCI), and those diagnosed with Alzheimer’s disease (AD). Each displayed image is accompanied by corresponding values of Eg and Eloc, representing each patient's specific measures
Discussion
Distinctive alterations in connectivity patterns across different datasets and disease states imply the significance of accounting for dataset-specific variations when interpreting connectivity results. Figure 3 reinforces these findings, highlighting distinctive changes in connectivity patterns across different datasets and disease states, underscoring the need to consider dataset-specific variations when analyzing connectivity results. The observed reduction in connectivity in AD, particularly in the temporal lobe. This finding aligns with existing literature documenting disruptions in correlation patterns as a hallmark of neurodegenerative processes. The persistence of connectivity patterns between MCI and AD in the other two dataset groups in the network alterations during the transition from mild cognitive impairment to Alzheimer’s disease. It shows the consistency of these patterns across different datasets, emphasizing the robustness of the observed trends. The reduction in correlation edges reflects the deterioration of functional interactions between brain regions, particularly in AD. These findings support the notion that changes in functional connectivity metrics, as demonstrated by the correlation edges, may serve as valuable indicators of disease progression.
The figures demonstrate the notable reduction in connectivity within the same hemisphere, highlighting the specificity of connectivity alterations seen in neurodegenerative processes. To capture subtle variations in connectivity networks, we explore a range of sparsity thresholds, which elucidate the persistence of connections in the frontal lobe. This suggests the presence of potential network resilience or compensatory mechanisms in certain brain regions, offering insights into functional adaptations during the progression of neurodegenerative disorders. To summarize, employing a sparsity threshold range enhances the comprehensibility of connectivity patterns, revealing nuanced changes in connections between brain regions across different correlation coefficient thresholds. The concentration of connections in the frontal lobe, along with the variability in inter-hemispheric connectivity, underscores the intricate nature of network modifications associated with Alzheimer's disease and its precursor stages. The average values of network indices across the three groups in these datasets showed a gradual decline from NC to MCI and further to AD in terms of small-world parameters (Eg, Eloc, Cp). This consistent pattern underscores a trend in the alteration of network characteristics as individuals progress from CN to MCI and ultimately to AD across multiple datasets. These findings collectively highlight the reproducibility and generalizability of the observed small-world alterations in Alzheimer's disease progression, emphasizing the potential utility of small-world parameters as biomarkers for disease stages. The significant differences in global and local efficiency, as well as the clustering coefficient, further suggest a disruption in the efficiency and organization of brain networks as cognitive decline advances.
The box plots provide valuable information about the distribution and central tendency of network indices within their respective datasets. By comparing three parameters across different datasets, it becomes evident that individuals without CN and those with AD display distinct and rarely overlapping ranges. This distinction is particularly notable in the second and third datasets, where the value range of CN is separate from that of both MCI and AD. This clear separation confirms significant differences in network characteristics between individuals with normal cognition and those with Alzheimer's disease. Additionally, the value range of MCI, observed across different datasets, exhibits varying degrees of overlap with the AD value range. This overlapping region implies a transitional state where individuals with MCI share network characteristics with both normal cognition and Alzheimer's disease, reflecting the dynamic nature of cognitive decline.
These network indices hold the potential as valuable markers for distinguishing between different cognitive states. The distinct ranges they exhibit contribute to our understanding of the unique network signatures linked to CN, MCI, and AD, underscoring the diagnostic relevance of these metrics. Moreover, the variability in the overlap of MCI and AD ranges across datasets emphasizes the importance of considering dataset-specific nuances when interpreting connectivity patterns. The varying degrees of overlap may indicate heterogeneity in the progression of cognitive decline, highlighting the need for personalized approaches to understanding and addressing neurodegenerative disorders. The clear separation and overlapping regions further deepen our comprehension of the evolving network characteristics associated with CN, MCI, and AD. These findings have implications for the development of diagnostic and prognostic markers, as well as for tailoring interventions based on individualized network profiles in the context of neurodegenerative disorders.
PETPVE12 developed for SPM aimed to improve local regional detection of radiopharmaceutical uptake in corrected images compared to non-corrected images for amyloid imaging including MRI-based partial-volume correction. Due to our study limitations, we did not perform PVE processing on all images. We only verified the LCG data (the test results are shown in the Supplementary information.).
We found that the SUVR value of PVE will be lower than the SUVR of Non-PVE. However, when we convert to an individual correlation matrix, the changes of edges still decrease from CN, MCI to AD.
Conclusions
This study investigates the potential of individual amyloid brain networks in differentiating cognitive states by leveraging a novel methodology for constructing these networks. By employing amyloid PET images and graph theoretical analysis, the study successfully generates individual amyloid brain networks for individuals with CN, MCI, and AD across three distinct datasets.
Supplementary Information
Below is the link to the electronic supplementary material.
Authors’ Contributions
Conceptualization: TY Ho, SH Huang, KT Chen, and SY Huang conceived the main research question and study design. Data curation: TY Ho, CW Huang, KJ Lin, JL Hsu, KL Huang, and CC Chang gathered, prepared, and organized the datasets for analysis. Literature review: TY Ho, KT Chen, and SY Huang conducted a comprehensive review of relevant academic literature to inform the research approach and interpretations. Methodology: IT Hsiao and SY Huang developed and implemented the analytical methods used in the study. Writing and visualization: TY Ho and SH Huang drafted the manuscript, created all tables and figures, and ensured stylistic consistency. Final approval: all authors reviewed and approved the final version of the article for submission.
Funding
This study is sponsored by Chang Gung Medical Foundation Grant Numbers CMRPG3J0361, CMRPG3J0362, CMRPG3J0363, and CMRPG3J0364.
Data Availability
The data underpinning this research may be made available upon reasonable request to the corresponding author, subject to ethical and legal considerations.
Declarations
Ethics Approval
The respective Institutional Review Boards of Chang Gung Memorial Hospital at Linkou and Kaohsiung branches approved the recruitment of participants from these two institutions.
Consent to Participate
All participants provided written informed consent before participating in the study. The original image data were anonymized, and patients were not identifiable.
Consent for Publication
All authors and our institution approve the submission and publication of this manuscript. We confirm that we have read the journal’s position on issues involved in ethical publication and affirm that this report is consistent with those guidelines.
Conflicts of Interests
The authors declare that they have no conflicts of interest.
Footnotes
Impact Statement.
The presented research on amyloid PET imaging and network connectivity alterations in Alzheimer’s disease (AD) sheds light on distinct connectivity changes across cognitive states, providing valuable markers for early detection and monitoring of AD. This research has the potential to improve diagnostic and prognostic approaches, leading to personalized interventions and improved management of neurodegenerative disorders. The findings also advance our understanding of AD progression and pave the way for targeted interventions and improved outcomes for individuals affected by cognitive decline.
Publisher's Note
Springer Nature remains neutral with regard to jurisdictional claims in published maps and institutional affiliations.
References
- 1.Davis KM, Ryan JL, Aaron VD, Sims JB: PET and SPECT imaging of the brain: History, technical considerations, applications, and radiotracers. Seminars in Ultrasound, CT and MRI 41:521-529, 2020 [DOI] [PubMed] [Google Scholar]
- 2.Kaneta T: PET and SPECT imaging of the brain: a review on the current status of nuclear medicine in Japan. Japanese Journal of Radiology 38:343-357, 2020 [DOI] [PubMed] [Google Scholar]
- 3.D'Elia A, Schiavi S, Soluri A, Massari R, Soluri A, Trezza V: Role of nuclear imaging to understand the neural substrates of brain disorders in laboratory animals: current status and future prospects. Frontiers in Behavioral Neuroscience 14:596509, 2020 [DOI] [PMC free article] [PubMed] [Google Scholar]
- 4.Braak H, Braak E: Neuropathological stageing of Alzheimer-related changes. Acta Neuropathol 82:239-259, 1991 [DOI] [PubMed] [Google Scholar]
- 5.Thal DR, Rüb U, Orantes M, Braak H: Phases of A beta-deposition in the human brain and its relevance for the development of AD. Neurology 58:1791-1800, 2002 [DOI] [PubMed] [Google Scholar]
- 6.Lee DS, et al.: Metabolic connectivity by interregional correlation analysis using statistical parametric mapping (SPM) and FDG brain PET; methodological development and patterns of metabolic connectivity in adults. European journal of nuclear medicine and molecular imaging 35:1681-1691, 2008 [DOI] [PubMed] [Google Scholar]
- 7.Manzanera OM, et al.: Scaled subprofile modeling and convolutional neural networks for the identification of Parkinson’s disease in 3D nuclear imaging data. International journal of neural systems 29:1950010, 2019 [DOI] [PubMed] [Google Scholar]
- 8.Gu S-C, Ye Q, Yuan C-X: Metabolic pattern analysis of 18F-FDG PET as a marker for Parkinson’s disease: a systematic review and meta-analysis. Reviews in the Neurosciences 30:743-756, 2019 [DOI] [PubMed] [Google Scholar]
- 9.Yakushev I, Drzezga A, Habeck C: Metabolic connectivity: methods and applications. Current opinion in neurology 30:677-685, 2017 [DOI] [PubMed] [Google Scholar]
- 10.Bullmore E, Sporns O: Complex brain networks: graph theoretical analysis of structural and functional systems. Nat Rev Neurosci 10:186-198, 2009 [DOI] [PubMed] [Google Scholar]
- 11.Sepulcre J, Sabuncu MR, Becker A, Sperling R, Johnson KA: In vivo characterization of the early states of the amyloid-beta network. Brain 136:2239-2252, 2013 [DOI] [PMC free article] [PubMed] [Google Scholar]
- 12.Jiang J, Duan H, Huang Z, Yu Z: Study of amyloid-β peptide functional brain networks in AD, MCI and HC. Biomed Mater Eng 26 Suppl 1:S2197-2205, 2015 [DOI] [PubMed] [Google Scholar]
- 13.Son SJ, Kim J, Seo J, Lee JM, Park H: Connectivity analysis of normal and mild cognitive impairment patients based on FDG and PiB-PET images. Neurosci Res 98:50-58, 2015 [DOI] [PubMed] [Google Scholar]
- 14.Duan H, et al.: Differences in Aβ brain networks in Alzheimer's disease and healthy controls. Brain Res 1655:77-89, 2017 [DOI] [PubMed] [Google Scholar]
- 15.Li C, et al.: Predicting Brain Amyloid-β PET grades with graph convolutional networks based on functional MRI and multi-level functional connectivity. J Alzheimers Dis 86:1679-1693, 2022 [DOI] [PubMed] [Google Scholar]
- 16.Thakkar M, et al.: Clinical value of perilesional perfusion deficit measured by Technetium-99m-ECD single-photon emission computed tomography in hypertensive intracerebral hemorrhage. World Journal of Nuclear Medicine 19:246-254, 2020 [DOI] [PMC free article] [PubMed] [Google Scholar]
- 17.Setta K, et al.: Accuracy of brain perfusion single-photon emission computed tomography for detecting misery perfusion in adult patients with symptomatic ischemic moyamoya disease. Annals of Nuclear Medicine 32:611-619, 2018 [DOI] [PubMed] [Google Scholar]
- 18.Huang SY, Hsu JL, Lin KJ, Hsiao IT: A novel individual metabolic brain network for 18f-FDG PET imaging. Front Neurosci 14:344, 2020 [DOI] [PMC free article] [PubMed] [Google Scholar]
- 19.Rubin D, Wainer H, Wilkinson L: Statistical Methods in Psychology Journals Guidelines and Explanations 54:594-604, 2005 [Google Scholar]
- 20.Nakagawa S, Cuthill IC: Effect size, confidence interval and statistical significance: a practical guide for biologists. Biol Rev Camb Philos Soc 82:591-605, 2007 [DOI] [PubMed] [Google Scholar]
- 21.Ellis PD: The Essential Guide to Effect Sizes: Statistical Power, Meta-Analysis, and the Interpretation of Research Results, Cambridge: Cambridge University Press, 2010 [Google Scholar]
- 22.Kelley K, Preacher KJ: On effect size. Psychological Methods 17:137-152, 2012 [DOI] [PubMed] [Google Scholar]
- 23.Kim H-Y: Statistical notes for clinical researchers: effect size. rde 40:328-331, 2015 [DOI] [PMC free article] [PubMed] [Google Scholar]
- 24.Fisher RAS: 014: On the "Probable Error" of a Coefficient of Correlation Deduced from a Small Sample:205-235, 1921
- 25.Tzourio-Mazoyer N, et al.: Automated anatomical labeling of activations in SPM using a macroscopic anatomical parcellation of the MNI MRI single-subject brain. NeuroImage 15:273-289, 2002 [DOI] [PubMed] [Google Scholar]
- 26.Wang J, Wang X, Xia M, Liao X, Evans A, He Y: GRETNA: a graph theoretical network analysis toolbox for imaging connectomics. Frontiers in Human Neuroscience 9, 2015 [DOI] [PMC free article] [PubMed]
- 27.Achard S, Bullmore E: Efficiency and cost of economical brain functional networks. PLoS Comput Biol 3:e17, 2007 [DOI] [PMC free article] [PubMed] [Google Scholar]
- 28.Yong H, Zhang C, Alan E: Structural insights into aberrant topological patterns of large-scale cortical networks in Alzheimer's disease. The Journal of Neuroscience 28:4756, 2008 [DOI] [PMC free article] [PubMed] [Google Scholar]
- 29.Wang H, Jin X, Zhang Y, Wang J: Single-subject morphological brain networks: connectivity mapping, topological characterization and test–retest reliability. Brain and Behavior 6:e00448, 2016 [DOI] [PMC free article] [PubMed] [Google Scholar]
- 30.Rubinov M, Sporns O: Complex network measures of brain connectivity: uses and interpretations. Neuroimage 52:1059-1069, 2010 [DOI] [PubMed] [Google Scholar]
Associated Data
This section collects any data citations, data availability statements, or supplementary materials included in this article.
Supplementary Materials
Data Availability Statement
The data underpinning this research may be made available upon reasonable request to the corresponding author, subject to ethical and legal considerations.