

Abstract
Background
The prognosis of patients with hepatocellular cancer is substantially correlated with the abnormal expression of growing long non-coding RNA small nucleolar host gene RNA (SNHG) families in liver cancer tissues. This study aimed to examine the relationship between SNHG expression and liver cancer prognosis.
Methods
After searching six internet databases, pertinent manuscripts were found based on inclusion and exclusion criteria. To determine whether SNHG expression levels affect liver cancer prognosis, raw data were collected and hazard ratios (HRs) and odds ratios (ORs) were calculated. The results were examined for potential publication bias using the sensitivity analysis and Beeg’s test.
Results
Most SNHG family members were up-regulated in liver cancer tissues. High SNHG expression predicts poor liver cancer outcomes of, including overall survival (OS) (HR: 1.697, 95% confidence interval [CI]: 1.373–2.021), especially SNHG5 (the HR of OS is 4.74, 95%CI range from 1.35 to 6.64), progression-free survival (HR: 1.85, 95% CI: 1.25–2.73), tumor, node, metastasis (TNM) stage (OR: 1.696, 95% CI: 1.436–2.005), lymph node metastasis (OR: 2.383, 95% CI: 1.098–5.173), and tumor size (OR: 1363, 95% CI: 1.165–1.595). The OS results were found to be reliable and robust, as indicated by the sensitivity analysis. Additionally, Beeg’s test demonstrated the absence of any potential publication bias for each result.
Conclusion
In liver cancer tissues, most SNHGs are highly expressed, which may signal poor prognosis. SNHG has the potential to be an intriguing predictive marker and a prospective therapeutic target for liver cancer.
Keywords: lncRNA, SNHG, Hepatocellular carcinoma, Prognosis, Meta-analysis
Introduction
Cancer is the primary cause of human mortality, resulting in significant mental and physical suffering for individuals and an extensive financial strain on the global community on an annual basis [1]. Globally, approximately 10 million cancer-related fatalities and 19.8 million newly diagnosed cancer patients were reported in 2020, as per the 2021 global cancer statistics [2]. Among all newly diagnosed cancers, liver cancer ranks fifth among new cases among men and ninth among women [3, 4]. The 5-year survival rate remains unsatisfactory, although the application of targeted therapy, immunotherapy, radiotherapy, and chemotherapy has enhanced the survival benefits of patients with liver cancer to a certain extent [5, 6]. Several investigators are endeavoring to identify novel therapeutic targets and prognostic indicators [7, 8].
As molecular biology and high-throughput sequencing have advanced, long non-coding RNAs (lncRNAs), a family of small molecule nucleotides without protein-coding activities, are now recognized as a leading risk factor for liver cancer [9, 10]. LncRNAs influence coding RNA expression at the transcriptional, post-transcriptional translation, and post-translational modification levels and directly or indirectly interfere with the cell cycle, proliferation, immigration, invasion, and apoptosis of tumor cells by acting on downstream genes or signal cascades through sponging with microRNAs [11–13]. The prognosis of liver cancer was substantially correlated with the growth of aberrantly expressed long noncoding genes [14, 15]. Zhao et al. [16], for instance, demonstrated that small nucleolar host gene RNA (SNHG) 7 (SNHG7) may enhance the proliferation, immigration, and metastasis of hepatocellular carcinoma (HCC) cells by increasing forkhead box K2 expression through sponging and decreasing miR-122-5p. According to Kou et al. [17], NEAT1 regulates Bax, Bcl-2, and epidermal growth factor receptors to help HCC cells proliferate, invade, and suppress apoptosis.
The lncRNA family SNHG includes dozens of family members [18–20]. Additional studies show that SNHG regulates liver cancer cell proliferation, migration, metastasis, and apoptosis and is linked to liver cancer prognosis [21, 22]. Many researchers have examined the link between SNHG expression and liver cancer prognosis because SNHG may act as a promising target for treatment and prognostic marker [23, 24]. This study endeavors to conduct a meta-analysis to comprehensively investigate the association between the expression level of SNHG and the prognosis of liver cancer, in light of the limited sample size of a single study and the conflicting findings and conclusions of various studies.
Materials and methods
Literature search strategy
We thoroughly searched six electronic databases—China National Knowledge Infrastructure (CNKI), Web of Science, Google Scholar, Cochrane Library, Embase, and PubMed—to find pertinent literature. The following are the detailed search terms: “liver neoplasm” OR “liver cancer” OR “hepatocellular carcinoma” OR “hepatic carcinoma” OR “liver cell carcinoma” OR “liver tumor” OR “hepatoma” OR “hepatocarcinoma” OR “malignant hepatoma” OR “liver malignancy” OR “HCC” AND “small nucleolar RNA host lncRNA” OR “long non-coding RNA SNHG” OR “non-coding RNA SNHG” OR “small nucleolar RNA host gene” OR “snoRNA host gene” OR “lncRNA SNHG” OR “SNHG.” In addition to these search terms, we also checked reference lists of relevant studies to find other potentially relevant literature. The publication year of the literature is restricted to March 1, 2023, from database inception.
Inclusion and exclusion criteria
The original literature must satisfy the subsequent inclusion criteria for incorporation into this investigation: (1) The SNHG level was detected using clear detection methods. (2) The cancer patients were categorized into two groups: the SNHG low expression group and the SNHG high expression group, as determined using the SNHG level. (3) The primary goal of the initial investigation was to explore the relationship between SNHG expression and liver prognosis. (4) The thesis’s research quality must satisfy the established standards. (5) Provide sufficient and available data. Original documents meeting the following criteria will be excluded: (1) The research object was not a population. (2) The data were unavailable or insufficient. (3) Non-English literature. (4) Reviews, meta-analyses, case reports, and meeting abstracts.
Quality assessment of included literature
Two researchers independently assessed the quality of the included studies using the Newcastle-Ottawa Quality Assessment Scale (NOS). NOS is an evaluation tool widely used in non-randomized controlled studies [25]. This mainly includes the following three major projects: (1) Selection of research objects. (2) Comparability between groups. (3) Exposure/outcome evaluation. There are a total of 8 sub-items with a total of 9 points based on star ratings, and we will assign each study a quality score based on its performance in these areas. If two researchers are different regarding the scoring of the same original document, they may either engage in a discussion or request that a third researcher negotiate a resolution. A score between 6 and 9 was suggestive of excellent and appropriate for this study’s inclusion. A score between 0 and 5 was regarded as low quality and discarded.
Data extraction
This meta-analysis comprised original literature from which two researchers independently extracted the first author’s name, publication year, number of cases, SNHG level cut-off value, and detection method. The hazard ratio (HR) and 95% confidence interval (CI) were also retrieved to assess the relationship between SNHG expression and liver cancer prognosis. When survival curves are the sole information provided in the original literature, HR values with 95% CI were derived indirectly using the Engauge 4.0 version software [26]. To investigate the association between SNHG expression and HCC clinicopathological parameters, including distant metastasis (DM), lymph node metastasis (LNM), tumor, node, metastasis (TNM) stage, and tumor size, the number of occurrences and total number of events of each clinicopathological parameter were also extracted.
Statistical analysis
Stata SE 12.0 and Revman 5.4.0 were used in this investigation. The relationship between SNHG expression and the survival prognosis in HCC patients was evaluated using the pooled HR with 95% CI results. The correlation between the clinicopathological features (LNM, DM, and TNM stage) of patients with HCC and SNHG expression and, was investigated using the combined OR with 95% CI results. The significance of heterogeneity was evaluated using I-square (I2) and p-value (p). When I2 ≤ 50% and p ≥ 0.05, we do not anticipate significant heterogeneity in the results and would apply the fixed-effect model; when I2 > 50% and p < 0.05, we consider the results to be significantly heterogeneous and would apply subgroup analysis and the random-effect model. Sensitivity analysis was conducted to investigate the robustness and dependability of the findings. To ascertain whether publication bias or other types of bias affected the original study’s findings, the Beeg’s test was used.
Result
The included publications’ fundamental characteristics
A comprehensive search of six internet databases yielded 1326 original articles. In total, 639 duplicate publications and 609 original studies were eliminated because they did not examine the relationship between SNHG expression and liver cancer prognosis. Among the remaining 78 publications, 13 studies had insufficient data, 9 studies did not study the population, 11 literatures were not written in English, 5 articles were meta-analyzed, and the research quality of 5 studies was not up to standard. This study included 38 pieces of original evidence from 2917 patients [16, 23, 27–62]. These 38 publications included only Chinese patients. Except for decreased SNHG2 (also named as GAS5) expression in liver cancer tissues [30, 31, 63], most of the SNHG family members were highly expressed in liver cancer tissues (Fig. 1 and Table 1). Most studies examined the relationship between SNHG expression and liver cancer prognosis, with 30 to 160 patients and NOS scores of 6 to 9 (Table 2).
Fig. 1.

The process for including appropriate articles
Table 1.
Basic features of the publications included in this meta-analysis (n = 38)
| Author and year | lncSNHG | sample size | expression level | detected method | cut-off value | refence gene | prognostic index | HR with 95%CI | HR extraction | follow-up-month | NOS score |
|---|---|---|---|---|---|---|---|---|---|---|---|
| Meng FZ [21] | SNHG1 | 115 | upregulation | qRT-PCR | median | β-actin | OS | 1.999 (1.302–3.06) | paper | 60 | 9 |
| Zhang M [28] | SNHG1 | 82 | upregulation | qRT-PCR | median | GAPDH | OS | 2.14 (1.12–4.11) | survival curve | 60 | 8a |
| DFS | 2.22 (1.25–3.94) | ||||||||||
| Hu LT 2015 [30] | GAS5 (SNHG2) | 30 | downregulation | qRT-PCR | mean | GAPDH | OS | 0.48 (0.169–1.37) | survival curve | 22 | 7a |
| Chang L [29] | GAS5 (SNHG2) | 60 | downregulation | qRT-PCR | mean | GAPDH | OS | 0.307 (0.113–0.415) | paper | 60 | 9 |
| Tu ZQ [31] | GAS5 (SNHG2) | 71 | downregulation | qRT-PCR | mean | GAPDH | OS | 0.417 (0.244–0.617) | paper | 60 | 9 |
| Zhang T 2015 [39] | SNHG3 | 144 | upregulation | qRT-PCR | not reported | β-actin | OS | 3.464 (1.820–6.594) | paper | 60 | 8d |
| RFS | 2.134 (1.311–3.474) | paper | 60 | 8d | |||||||
| DFS | 1.97 (1.19–3.28) | survival curve | 60 | 8d | |||||||
| Zhang PF 2018 [38] | SNHG3 | 70 | upregulation | qRT-PCR | mean | GAPDH | OS | 1.94 (1.17–3.22) | survival curve | 24 | 7a |
| Li YR 2018 [34] | SNHG5 | 48 | upregulation | qRT-PCR | median | β-actin | OS | 4.74 (1.350–6.640) | paper | 36 | 9 |
| RFS | 3.690 (1.229–11.082) | paper | 36 | 9 | |||||||
| Cao C 2016 [32] | SNHG6 | 160 | upregulation | qRT-PCR | mean | β-actin | OS | 1.832 (1.032–3.253) | paper | 60 | 9 |
| Fan XX [23] | SNHG6 | 40 | upregulation | qRT-PCR | mean | GAPDH | OS | 1.71 (0.49–5.96) | survival curve | 100 | 8a |
| PFS | 1.78 (0.69–4.62) | survival curve | 100 | 8a | |||||||
| Xie YT [36] | SNHG7 | 80 | upregulation | qRT-PCR | mean | GAPDH | OS | 1.89 (1.16–3.08) | survival curve | 60 | 6be |
| Shen A [35] | SNHG7 | 100 | upregulation | qRT-PCR | median | GAPDH | OS | 2.584 (1.621–3.880) | paper | 60 | 9 |
| PFS | 1.86 (1.21–2.86) | paper | 60 | 9 | |||||||
| Yang X [37] | SNHG7 | 80 | upregulation | qRT-PCR | median | GAPDH | OS | 2.87 (1.53–5.39) | survival curve | 60 | 7ab |
| Zhao ZB 2021 [16] | SNHG7 | 30 | upregulation | qRT-PCR | mean | GAPDH | OS | 3.25 (0.8-13.21) | survival curve | 60 | 8a |
| Feng SG [33] | SNHG9 | 40 | upregulation | qRT-PCR | mean | GAPDH | OS | 2.44 (0.44–13.39) | survival curve | 60 | 8a |
| Lan T [45] | SNHG10 | 64 | upregulation | qRT-PCR | mean | GAPDH | OS | 1.144 (1.042–1.256) | paper | 60 | 9 |
| Huang W [42] | SNHG11 | 57 | upregulation | qRT-PCR | mean | GAPDH | OS | 1.68 (0.85–3.30) | survival curve | 60 | 7ab |
| Lan T [44] | SNHG12 | 48 | upregulation | qRT-PCR | median | GAPDH | OS | 2.28 (0.88–5.88) | survival curve | 48 | 7ab |
| RFS | 2.24 (1.01-5) | survival curve | 48 | 7ab | |||||||
| Wang X [50] | SNHG13 | 62 | upregulation | qRT-PCR | mean | GAPDH | OS | 3.63 (2.01–6.58) | survival curve | 44 | 7ab |
| Liu Y [48] | SNHG13 | 66 | upregulation | qRT-PCR | median | GAPDH | OS | 2.3 (1.02–5.18) | survival curve | 60 | 7ab |
| Ma X [49] | SNHG13 | 52 | upregulation | qRT-PCR | mean | β-actin | not reported | NA | NA | NA | 7ab |
| Yuan SX [54] |
DANCR (SNHG13) |
135 | upregulation | qRT-PCR | median | GAPDH | OS | 2.757 (1.379–5.514) | paper | 48 | 9 |
| RFS | 2.228 (1.359–3.653) | paper | 48 | 9 | |||||||
| Zhang H [56] | SNHG14 | 40 | upregulation | qRT-PCR | mean | GAPDH | OS | 1.77 (0.61–5.1) | survival curve | 36 | 8a |
| Xu XY [52] | SNHG14 | 55 | upregulation | qRT-PCR | mean | GAPDH | not reported | NA | NA | NA | 7c |
| Liao ZB [46] | SNHG14 | 66 | upregulation | qRT-PCR | mean | GAPDH | OS | 1.3 (0.67–2.5) | survival curve | 120 | 8 |
| Zhang JH [57] | SNHG15 | 152 | upregulation | qRT-PCR | median | GAPDH | OS | 2.247 (1.331–6.255) | paper | 66 | 9 |
| Chen W 2020 [40] | SNHG15 | 58 | upregulation | qRT-PCR | mean | GAPDH | OS | 1.64 (0.56–4.83) | survival curve | 60 | 8a |
| Dai W [41] | SNHG15 | 101 | upregulation | qRT-PCR | mean | GAPDH | not reported | NA | NA | NA | 7c |
| Jing Z [43] | SNHG16 | 40 | upregulation | qRT-PCR | mean | GAPDH | OS | 1.48 (0.71–3.1) | survival curve | 96 | 7 |
| Lin Q 2018 [47] | SNHG16 | 88 | upregulation | qRT-PCR | mean | GAPDH | OS | 2.34 (1.04–5.28) | survival curve | 60 | 8a |
| Zhong JH 2019 [58] | SNHG16 | 108 | upregulation | qRT-PCR | median | GAPDH | OS | 1.94 (1.07–3.52) | survival curve | 60 | 8a |
| DFS | 1.69 (1.07–2.66) | survival curve | 60 | ||||||||
| Ye JF [53] | SNHG16 | 103 | upregulation | qRT-PCR | mean | GAPDH | not reported | NA | NA | NA | 7c |
| Xie XH [51] | SNHG16 | 40 | upregulation | qRT-PCR | mean | β-actin | not reported | NA | NA | NA | 7c |
| Zhu XM [59] | SNHG17 | 58 | upregulation | qRT-PCR | mean | GAPDH | OS | 1.426 (0.796–3.434) | paper | 60 | 9 |
| Zhang DY 2016 [55] | SNHG20 | 144 | upregulation | qRT-PCR | median | GAPDH | OS | 3.985 (1.981–8.017) | 60 | 9 | |
| Liu JX [60] | SNHG20 | 96 | upregulation | qRT-PCR | median | GAPDH | OS | 2.79 (1.74–4.48) | survival curve | 60 | 8a |
| Zhang YX [62] | SNHG22 | 60 | upregulation | qRT-PCR | mean | GAPDH | not reported | NA | NA | NA | 7c |
| Luo J [61] | MEG8 (SNHG23) | 74 | upregulation | qRT-PCR | mean | GAPDH | OS | 2.29 (1.22–4.32) | survival curve | 60 | 8a |
| DFS | 1.89 (1.11–3.2) | survival curve | 60 | 8a |
Note
anot multivariate analysis
bSurvival curves only, lack of clinicopathological parameters
cNo follow-up data, only clinicopathological parameters provided
dNot report the cutoff-value
ePossible other bias due to relatively low sample size
SNHG: small nucleotide host RNA; OS: overall survival; HR: hazard ratio; CI: confidence interval; PFS: progression-free survival; DFS: disease-free survival; RFS: Recurrence free survival. NA: not available. GAPDH: glyceraldehyde-3-phosphate dehydrogenase; qRT-PCR: Quantitative real time polymerase chain reaction; NOS: Newcastle-Ottawa Quality Assessment Scale; survival curve: The original literature only provides survival curves without HR values and 95% CI, and HR values with 95% CI were derived indirectly using the Engauge 4.0 version software; paper: The original literature directly provides HR values and 95% CI
Table 2.
Quality assessment of eligible studies Newcastle-Ottawa scale (NOS) score
| Author and Year | Country | Selection | Comparability | Outcome | Total | |||||
|---|---|---|---|---|---|---|---|---|---|---|
| Adequate of case definition | Representativeness of the cases | Selection of Controls | Definition of Controls | Comparability of cases and controls | Ascertainment of exposure | Same method of ascertainment | Non-Response rate | |||
| Meng FZ 2021 [21] | China | * | * | * | * | ** | * | * | * | 9 |
| Zhang M 2016 [28] | China | * | * | * | * | * | * | * | * | 8 |
| Hu LT 2015 [30] | China | * | * | * | * | * | * | * | - | 7 |
| Chang L 2016 [29] | China | * | * | * | * | ** | * | * | * | 9 |
| Tu ZQ 2014 [31] | China | * | * | * | * | ** | * | * | * | 9 |
| Zhang T 2015 [39] | China | * | * | * | * | * | * | * | * | 8 |
| Zhang PF 2018 [38] | China | * | * | * | * | * | * | * | - | 7 |
| Li YR 2018 [34] | China | * | * | * | * | ** | * | * | * | 9 |
| Cao C 2016 [32] | China | * | * | * | * | ** | * | * | * | 9 |
| Fan XX 2021 [23] | China | * | * | * | * | * | * | * | * | 8 |
| Xie YT 2020 [36] | China | - | * | * | * | * | * | * | - | 6 |
| Shen A 2020 [35] | China | * | * | * | * | ** | * | * | * | 9 |
| Yang X 2019 [37] | China | * | * | * | * | * | * | * | - | 7 |
| Zhao ZB 2021 [16] | China | * | * | * | * | * | * | * | * | 8 |
| Feng SG 2021 [33] | China | * | * | * | * | * | * | * | * | 8 |
| Lan T 2019 [45] | China | * | * | * | * | ** | * | * | * | 9 |
| Huang W 2020 [42] | China | * | * | * | * | * | * | * | - | 7 |
| Lan T 2017 [44] | China | * | * | * | * | * | * | * | - | 7 |
| Wang X 2020 [50] | China | * | * | * | * | * | * | * | - | 7 |
| Liu Y 2020 [48] | China | * | * | * | * | * | * | * | - | 7 |
| Ma X 2016 [49] | China | * | * | * | * | * | * | * | - | 7 |
| Yuan SX 2016 [54] | China | * | * | * | * | ** | * | * | * | 9 |
| Zhang H 2020 [56] | China | * | * | * | * | * | * | * | * | 8 |
| Xu XY 2020 [52] | China | * | * | * | * | * | * | * | - | 7 |
| Liao ZB 2021 [46] | China | * | * | * | * | * | * | * | * | 8 |
| Zhang JH 2016 [57] | China | * | * | * | * | ** | * | * | * | 9 |
| Chen W 2020 [40] | China | * | * | * | * | * | * | * | * | 8 |
| Dai W 2019 [41] | China | * | * | * | * | * | * | * | - | 7 |
| Jing Z 2020 [43] | China | * | * | * | * | * | * | * | - | 7 |
| Lin Q 2018 [47] | China | * | * | * | * | * | * | * | * | 8 |
| Zhong JH 2019 [58] | China | * | * | * | * | * | * | * | * | 8 |
| Ye JF 2019 [53] | China | * | * | * | * | * | * | * | - | 7 |
| Xie XH 2019 [51] | China | * | * | * | * | * | * | * | - | 7 |
| Zhu XM 2021 [59] | China | * | * | * | * | ** | * | * | * | 9 |
| Zhang DY 2016 [55] | China | * | * | * | * | ** | * | * | * | 9 |
| Liu JX 2017 [60] | China | * | * | * | * | * | * | * | * | 8 |
| Zhang YX 2021 [62] | China | * | * | * | * | * | * | * | - | 7 |
| Luo J 2021 [61] | China | * | * | * | * | * | * | * | * | 8 |
Association between the survival prognosis of HCC and SNHG expression
To assess the correlation between HCC prognosis and SNHG expression, 32 studies were included in this meta-analysis, covering 2506 patients with HCC. The combination of HR and 95% CI demonstrates a positive and statistically significant relationship between increased SNHG expression and poor prognosis for HCC (HR: 1.697, 95% CI: 1.373–2.021). Subgroup analysis was used in this study because of the significant heterogeneity of the results (I2 = 83.5%, p < 0.0001), the inconsistent SNHG expression (increased and decreased level), the mean and median cut-off values, the multivariate and univariate analysis methods, the sample size (< 100 and not < 100), the follow-up month (< 60 and not < 60), and the study quality (NOS score) across different original studies. Pooling HR with 95% CI demonstrated similar favorable correlation between increasing SNHG expression and poor OS in the subgroup of patients with elevated SNHG expression (HR: 1.259, 95% CI: 1.159–1.359), < 9 of NOS score (HR: 1.613, 95% CI: 1.315–1.911), univariate analysis of analysis method (HR: 1.613, 95% CI: 1.315–1.911), median of cut-off value (HR: 2.412, 95% CI: 1.966–2.858), < 100 of sample size (HR: 1.484, 95% CI: 1.131–1.837), not < 100 of sample size (HR: 2.229, 95% CI: 1.744–2.715) (Fig. 2 and Table 3). Furthermore, combining HR and 95% CI reveals a significant positive link between high SNHG expression and poor progression-free survival (PFS) (HR: 1.85, 95% CI: 1.25–2.73) (Fig. 3A), disease-free survival (HR: 1.90, 95% CI: 1.47–2.46) (Fig. 3B), and relapse-free survival (HR: 2.22, 95% CI: 1.63–3.02) (Fig. 3C).
Fig. 2.
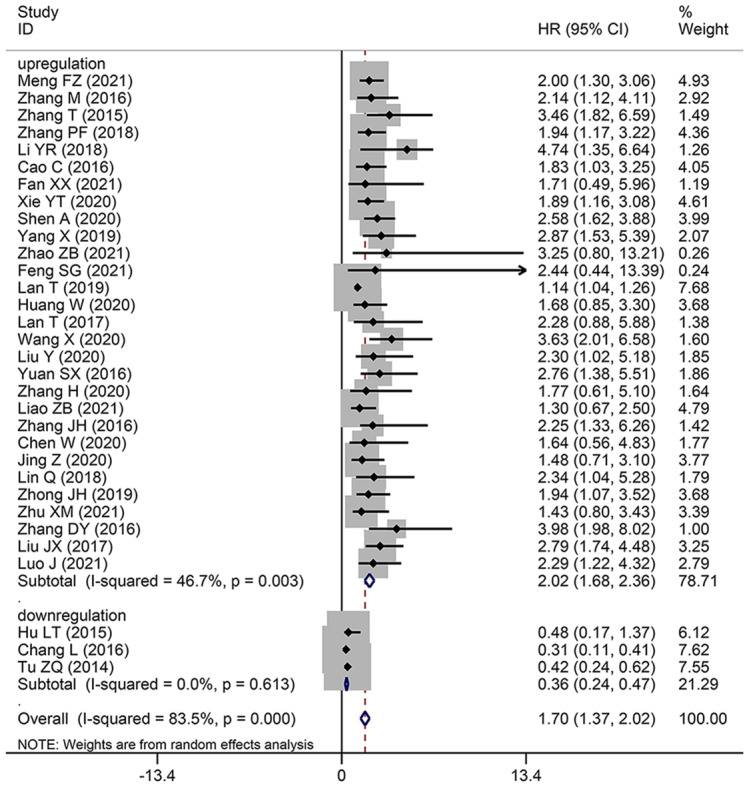
Forest plot showed the correlation between SNHG expression and overall survival (OS) of Hepatocellular carcinoma (HCC). Note HR: hazard ratio CI: confidence interval
Table 3.
Pooled HRs of overall survival of hepatocellular carcinoma patients with increased SNHG expression
| Subgroup analysis | sample size | No. of studies | Pooled HR (95% CI) | P | Heterogeneity | ||
|---|---|---|---|---|---|---|---|
| Fixed | Random | I2(%) | p − value | ||||
| OS | 32 | 2506 | 0.870 (0.795–0.946) | 1.697 (1.373–2.021) | < 0.0001 | 83.5 | < 0.0001 |
| SNHG expression | |||||||
| Upregulation | 29 | 2345 | 1.259 (1.159–1.359) | 2.021 (1.677–2.364) | < 0.0001 | 46.7 | 0.003 |
| Downregulation | 3 | 161 | 0.355 (0.240–0.470) | 0.355 (0.240–0.470) | < 0.0001 | 0 | 0.613 |
| NOS score | |||||||
| 9 | 11 | 1107 | 0.819 (0.741–0.897) | 1.428 (0.959–2.760) | < 0.0001 | 92.6 | < 0.0001 |
| less than 9 | 21 | 1399 | 1.613 (1.315–1.911) | 1.834 (1.446–2.221) | < 0.0001 | 27.7 | 0.118 |
| Analytical method | |||||||
| Multivariate analysis | 11 | 1107 | 0.819 (0.741–0.897) | 1.428 (0.959–1.898) | < 0.0001 | 92.6 | < 0.0001 |
| Univariate analysis | 21 | 1399 | 1.613 (1.315–1.911) | 1.834 (1.446–2.221) | < 0.0001 | 27.7 | 0.118 |
| Cut-off value | |||||||
| Mean | 19 | 1188 | 0.822 (0.745–0.899) | 1.263 (0.906–1.620) | < 0.0001 | 86.1 | < 0.0001 |
| Median | 12 | 1174 | 2.412 (1.966–2.858) | 2.412 (1.966–2.858) | < 0.0001 | 0 | 0.852 |
| Not reported | 1 | 144 | 3.464 (1.077–5.851) | 3.464 (1.077–5.851) | 0.004 | NA | NA |
| Sample size | |||||||
| not less than 100 | 8 | 1058 | 2.229 (1.744–2.715) | 2.229 (1.744–2.715) | < 0.0001 | 0 | 0.788 |
| less than 100 | 24 | 1448 | 0.837 (0.760–0.913) | 1.484 (1.131–1.837) | < 0.0001 | 85 | < 0.0001 |
| Follow-up month | |||||||
| not less than 60 | 25 | 2073 | 0.859 (0.783–0.936) | 1.643 (1.291–1.994) | < 0.0001 | 85.3 | < 0.0001 |
| less than 60 | 7 | 433 | 1.271 (0.807–1.734) | 2.241 (1.094–3.389) | < 0.0001 | 72.5 | 0.001 |
| Refence gene | |||||||
| GAPDH | 28 | 2039 | 0.852 (0.776–0.928) | 1.581 (1.245–1.916) | < 0.0001 | 83.7 | < 0.0001 |
| β-actin | 4 | 467 | 2.211 (1.569–2.853) | 2.443 (1.463–3.422) | < 0.0001 | 42.8 | 0.155 |
Note OS: overall survival; Random: Random effects; Fixed: Fixed effects; directly: HR was extracted directly from the primary articles; indirectly: HR was extracted indirectly from the primary articles; CI: confidence interval
Fig. 3.

Forest plot showed the correlation between SNHG expression and progress-free survival (PFS), disease-free survival (DFS) and Recurrence free survival (RFS) of Hepatocellular carcinoma (HCC). Note (A) PFS; (B) DFS; (C) RFS. HR: hazard ratio CI: confidence interval
The relationship between the TNM stage of HCC and SNHG expression
This study examined 28 publications with 2251 patients to determine whether TNM stage and SNHG expression are related. According to the pooled OR with 95% CI values (OR: 1.696, 95% CI: 1.436–2.005) (Fig. 4), an advanced TNM stage has been linked to high SNHG expression. We conducted a subgroup analysis although the overall results’ heterogeneity was negligible (I2 = 36.5%, p = 0.029), but heterogeneity is unavoidably caused by different main studies’ varying cut-off values, research quality, and analytical techniques. Subgroup analysis findings showed that elevated SNHG expression (SNHG1, SNHG3, SNHG8, SNHG15, and others) manifested advanced TNM stage (HR: 1.822, 95%CI: 1.534–2.164), while low SNHG expression (SNHG2) manifested advanced stage of TNM (HR: 0.29, 95%CI: 0.109–0.771) (Table 4).
Fig. 4.

Forest plot showed the correlation between SNHG expression and TNM stage of Hepatocellular carcinoma (HCC). Note OR: odds ratio CI: confidence interval
Table 4.
Pool effects of clinicopathologic characteristics in hepatocellular carcinoma patients with abnormal SNHG expression
| Subgroup analysis | sample size | No. of studies | Pooled OR (95% CI) | P | Heterogeneity | ||
|---|---|---|---|---|---|---|---|
| Fixed | Random | I2(%) | p-value | ||||
| TNM stage | 28 | 2251 | 1.696 (1.436–2.005) | 1.672 (1.335–2.094) | < 0.0001 | 36.5 | 0.029 |
| NOS_score | |||||||
| 9 | 9 | 912 | 1.743 (1.341–2.266) | 1.698 (0.964–2.991) | 0.067 | 72.6 | < 0.0001 |
| less than 9 | 19 | 1339 | 1.665 (1.341–2.067) | 1.657 (1.330–2.064) | < 0.0001 | 0 | 0.77 |
| SNHG expression | |||||||
| increased | 26 | 2148 | 1.822 (1.534–2.164) | 1.777 (1.457–2.167) | < 0.0001 | 18.2 | 0.204 |
| decreased | 2 | 103 | 0.290 (0.109–0.771) | 0.306 (0.113–0.827) | 0.02 | 0 | 0.447 |
| LNM | 6 | 492 | 2.514 (1.747–3.620) | 2.383 (1.098–5.173) | < 0.0001 | 72.7 | 0.003 |
| NOS_score | |||||||
| 9 | 3 | 286 | 2.293 (0.392–13.421) | 2.293 (0.392–13.421) | 0.357 | 88.7 | < 0.0001 |
| less than 9 | 3 | 206 | 2.334 (1.351–4.030) | 2.314 (1.336–4.008) | 0.002 | 0 | 0.787 |
| SNHG expression | |||||||
| increased | 5 | 421 | 3.373 (2.238–5.085) | 3.239 (1.831–5.730) | < 0.0001 | 43.1 | 0.135 |
| decreased | 1 | 71 | 0.364 (0.113–1.172) | 0.364 (0.113–1.172) | 0.09 | NA | NA |
| DM | 5 | 518 | 1.265 (0.846–1.892) | 1.415 (0.658–3.042) | 0.252 | 39.4 | 0.158 |
| NOS_score | |||||||
| 9 | 2 | 304 | 1.784 (0.539–5.904) | 1.770 (0.070-45.067) | 0.343 | 74.6 | 0.047 |
| less than 9 | 3 | 214 | 1.203 (0.783–1.849) | 1.417 (0.668–3.005) | 0.399 | 35.3 | 0.213 |
| Tumor size | 25 | 2018 | 1.363 (1.165–1.595) | 1.358 (1.093–1.687) | 0.006 | 39.7 | 0.022 |
| NOS_score | |||||||
| 9 | 9 | 912 | 1.339 (1.060–1.690) | 1.403 (0.918–2.143) | 0.117 | 63 | 0.006 |
| less than 9 | 16 | 1106 | 1.384 (1.119–1.711) | 1.353 (1.061–1.725) | 0.015 | 17.3 | 0.255 |
| SNHG expression | |||||||
| increased | 23 | 1915 | 1.434 (1.221–1.685) | 1.433 (1.168–1.758) | < 0.0001 | 31 | 0.079 |
| decreased | 2 | 103 | 0.394 (0.167–0.933) | 0.394 (0.167–0.933) | 0.034 | 0 | 0.95 |
| Histological grade | 17 | 1557 | 1.399 (1.140–1.717) | 1.394 (1.135–1.713) | 0.001 | 0 | 0.843 |
| NOS_score | |||||||
| 9 | 7 | 741 | 1.387 (1.030–1.868) | 1.383 (1.026–1.864) | 0.031 | 0 | 0.703 |
| less than 9 | 10 | 816 | 1.410 (1.064–1.870) | 1.404 (1.056–1.866) | 0.017 | 0 | 0.677 |
| Cut-off value | |||||||
| mean | 10 | 776 | 1.359 (1.019–1.810) | 1.351 (1.011–1.805) | 0.037 | 0 | 0.507 |
| median | 6 | 637 | 1.482 (1.087–2.020) | 1.479 (1.084–2.017) | 0.013 | 0 | 0.874 |
| not reported | 1 | 144 | 1.165 (0.489–2.777) | 1.165 (0.489–2.777) | 0.731 | NA | NA |
| Depth of invasion | 11 | 1077 | 1.911 (1.476–2.475) | 1.869 (1.439–2.427) | < 0.0001 | 0 | 0.9 |
| NOS_score | |||||||
| 9 | 4 | 434 | 1.965 (1.305–2.958) | 1.910 (1.263–2.888) | 0.001 | 0 | 0.601 |
| less than 9 | 7 | 643 | 1.876 (1.344–2.619) | 1.842 (1.314–2.581) | < 0.0001 | 0 | 0.81 |
| Cut-off value | |||||||
| mean | 6 | 495 | 2.077 (1.400-3.082) | 2.030 (1.364–3.021) | < 0.0001 | 0 | 0.899 |
| median | 4 | 438 | 1.659 (1.159–2.376) | 1.651 (1.150–2.369) | 0.006 | 0 | 0.682 |
| not reported | 1 | 144 | 3.689 (1.042–13.054) | 3.689 (1.042–13.054) | 0.043 | NA | NA |
| Age | 26 | 2703 | 1.047 (0.894–1.226) | 1.046 (0.893–1.226) | 0.567 | 0 | 1 |
| Gender | 27 | 2136 | 1 (0.832–1.203) | 0.999 (0.829–1.205) | 0.994 | 0 | 0.97 |
Note TNM: Tumor Node Metastasis, LNM: lymph node metastasis, DM: distant metastasis, CI: confidence interval, No.: number, NA: not applicable
Association between HCC tumor size and SNHG expression
This research involved 25 publications that focused on 2018 patients with HCC and examined the relationship between SNHG expression and HCC tumor size. Pooling OR with 95% CI showed a strong substantial relationship between elevated SNHG expression and larger HCC tumors (OR: 1.363, 95% CI: 1.165–1.595) (Fig. 5). The results of subgroup analysis demonstrated that in the subgroup of elevated SNHGs expression (for example SNHG1, SNHG3, SNHG9, SNHG12, SNHG16 et al.), increasing SNHG expression manifesting bigger tumor size (HR: 1.434, 95%CI: 1.221–1.685), in the subgroup of low SNHGs expression (for example SNHG2), increasing SNHG expression manifesting smaller tumor size (HR: 0.394, 95%CI: 0.167–0.933) (Table 4).
Fig. 5.

Forest plot showed the correlation between SNHG expression and tumor size of Hepatocellular carcinoma (HCC). Note OR: odds ratio CI: confidence interval
Association between various clinicopathological markers and SNHG expression
Pooling OR with 95% CI show a significant positive relationship between elevated SNHG expression and easier LNM (OR: 2.383, 95% CI: 1.098–5.173) (Fig. 6), poor histologic status (OR: 1.399, 95% CI: 1.140–1.717) (Fig. 7) and deeper HCC cell invasion (OR: 1.911, 95% CI: 1.476–2.475) (Fig. 8). Simultaneously, DM (OR: 1.265, 95% CI: 0.846–1.892) (Fig. 9), gender (OR: 1, 95% CI: 0.832–1.203), and age (OR: 1.047, 95% CI: 0.894–1.226) were found to have an insignificant relationship with SNHG expression (Table 4).
Fig. 6.

Forest plot showed the correlation between SNHG expression and LNM of Hepatocellular carcinoma (HCC). Note OR: odds ratio CI: confidence interval
Fig. 7.

Forest plot showed the correlation between SNHG expression and histological grade of Hepatocellular carcinoma (HCC). Note OR: odds ratio CI: confidence interval
Fig. 8.

Forest plot showed the correlation between SNHG expression and depth of invasion of Hepatocellular carcinoma (HCC). Note OR: odds ratio CI: confidence interval
Fig. 9.

Forest plot showed the correlation between SNHG expression and DM of Hepatocellular carcinoma (HCC). Note OR: odds ratio CI: confidence interval
Publication bias and sensitivity analysis
Outcomes of the sensitivity analysis indicated that, except for one paper (Lan T and Tu ZQ), the outcomes of the other papers did not have a considerable impact on the overall outcome. We used this information to conduct a subgroup analysis, and the findings demonstrated that the OS rate results had increased robustness and reliability after this paper was removed (Fig. 10). Begg’s test results indicated that except for invasion depth (Pr > |z| = 0.005), no OS publication bias was observed. (Pr > |z| = 0.206), TNM stage (Pr > |z| = 0.502), LNM (Pr > |z| = 0.851), DM (Pr > |z| = 0.086), tumor size (Pr > |z| = 0.051), histologic status (Pr > |z| = 0.650), age (Pr > |z| = 0.582), and gender (Pr > |z| = 0.269) (Fig. 11).
Fig. 10.

Sensitivity analysis for SNHG expression with overall survival (OS) of Hepatocellular carcinoma (HCC). Note HR: hazard ratio, CI: confidence interval
Fig. 11.

Funnel plot about the relationship between SNHG expression and survival outcome of Hepatocellular carcinoma (HCC). Note (A) OS; (B) TNM stage; (C) Tumor size; (D) LNM; (E) Histological grade; (F) Depth of invasion. (G) DM; (H) Age; (I) Gender
Discussion
Despite not directly encoding proteins, lncRNAs regulate many tumor cell behaviors, including cell proliferation, apoptosis, drug resistance, immigration, and invasion affecting the progression of breast cancer [64], pancreatic cancer [65], and head and neck squamous cell carcinoma [66]. Many lncRNA SNHGs were found to be abnormally expressed in liver cancer [41, 63]. SNHG that is abnormally expressed has the potential to directly affect downstream signaling cascades or to function as a competitive endogenous RNA, absorbing microRNAs in a sponge-like fashion. The drug resistance, immigration, proliferation, and invasion of liver cancer cells are influenced by the indirect regulation of downstream signaling pathways or genes. In patients with cancer, there is a significant correlation between the DM, LNM, tumor size, TNM stage, PFS, and OS [27, 33, 42, 43, 48]. Multiple studies have demonstrated that members of the SNHG family have the potential to serve as therapeutic targets and prognostic indicators for liver cancer. Because SNHG expression was inconsistent with liver cancer prognosis in multiple prior studies, this study used a meta-analysis to comprehensively and systematically analyze the link between liver cancer patients’ prognosis and SNHG expression.
This investigation analyzed 38 relevant publications and found that liver cancer tissues expressed more SNHG family members. The combined HR and its 95%CI results showed that increased SNHG expression predicted poor liver cancer outcomes, including shorter OS and DFS duration. Inconsistent cut-off values, number of cases, follow-up time, and expression differences between different original literatures were taken into account. In this study, subgroup analysis findings showed that the mean, median, subgroup with > 100 cases, and subgroup with < 100 cases had follow-up times of at least 60 months. High SNHG expression substantially anticipated poor OS in these categories. Furthermore, elevated SNHG expression was predictive of easier LNM, advanced TNM stage, worse histologic grade, easier DM, and greater tumor size according to the pooled OR and its 95% CI values.
Many researchers tried to determine how SNHG affects liver cancer progression molecularly (Table 5). First, by directly affecting downstream signaling cascades or genes, SNHG may alter liver cancer cell biology. Zhang et al. [28] found that SNHG1 down-regulates p53 to increase HCC cell growth and block apoptosis. Zhang et al. [67] proposed that DANCR (SNHG13) could facilitate the proliferation, immigration, and invasion of Hep3B and HepG2 cells by interacting with PTEN signaling. By up-regulating p62 expression, Zhong et al. [58] demonstrated that SNHG16 can promote the growth, immigration, and infiltration of HuH-7 and HepG2 cells while preventing apoptosis. Secondly, by functioning as a sponging microRNA and an endogenous RNA competitor, SNHG can control downstream genes or signaling cascades. According to Meng et al. [27], SNHG1 can activate the FOXK1/Snail axis via sponging and down-regulating miR-376a, which in turn can drive the proliferation, invasion, immigration, and suppression of apoptosis in HCC cells. Li et al. [34] showed that SNHG5 may enhance GSK3β expression through sponging and down-regulating miR-26a-5p, which may aid in the processes of epithelial-mesenchymal transition, proliferation, invasion, and migration. Xie et al. proved that SNHG7 may contribute to the proliferation and block apoptosis of Hep3B and HepG2 through the down-regulation of Bax and caspase-3 by down-regulating miR-9-5p [36]. Xie et al. [51] observed that SNHG16 may promote matrix metalloproteinase (MMP) 2 and MMP9 expression through sponging and reduce miR-195, which could aid in the proliferation and invasion of HCC cells. Third, certain members of the SNHG family may have a considerable impact on liver cancer cells’ resistance to medications related to tumors. According to Zhang et al. [38], SNHG3 may enhance HCC cell invasion, proliferation, and sorafenib resistance by down-regulating miR-128 and up-regulating CD151 expression. Liu et al. reported that DANCR facilitates Sorafenib resistance of HCC cells by activating interleukin 6/STAT3 signaling. Jing et al. [43] showed that SNHG16 may contribute to the sorafenib resistance through the interaction with early growth response 1 by sponging and down-regulating miR-23b-3p. Finally, SNHG family members may affect HCC cell autophagy to enhance liver cancer progression. To stimulate HCC cell proliferation, and migration, and prevent apoptosis and autophagy, Huang et al. [42] found that SNHG11 up-regulated argonaute-2 via down-regulating miR-184. SNHG family members that have reduced expression in liver cancer tissues may have a better survival outcome for patients with HCC. For example, Hu et al. [30] found that lncGAS5 up-regulates miR-21 to suppress HCC cell invasion and migration. Yang et al. [63] revealed that lncGAS5 inhibits cell invasion of HCC cells via up-regulating reversion-inducing cysteine-rich protein with Kazal motifs (RECK) by targeting miR-135b.
Table 5.
Regulation mechanism of SNHG involved in hepatocellular carcinoma cancer cells
| Author and year | lncSNHG | expression level | role | miR-RNA | Downstream genes or pathways | cell lines | function (high SNHG expression) |
|---|---|---|---|---|---|---|---|
| Meng FZ [21] | SNHG1 | upregulation | oncogene | miR-376a | FOXK1/Snail axis | HL7702,HepG2,SMMC-7721 and HuH-7 | induce proliferation, invasion and migration, suppress apoptosis |
| Zhang M [28] | SNHG1 | upregulation | oncogene | - | p53 | SMMC-7721, MHCC97H, HCCLM3 and HepG2 | promotes cells proliferation, inhibits apoptosis |
| Zhang PF 2018 [38] | SNHG3 | upregulation | oncogene | miR-128 | CD151 | PLC/PRF/5, Hep3B, HepG2, MHCC97L, Huh7, SMMC-7721, and HCCLM3 | promotes HCC cell invasion, induces EMT and sorafenib resistance |
| Li YR 2018 [34] | SNHG5 | upregulation | oncogene | miR-26a-5p | GSK3β |
Hep3B, HepG2, SMCC-7721, MHCC-97 L, MHCC-97 H, Huh7 and LO2 |
induce proliferation, invasion and migration and EMT process |
| Chen SY 2019 [68] | SNHG6 | upregulation | oncogene | miR-let-7c-5p | c-Myc | MHCC-97 H and HCC-LM3 | promotes proliferation |
| Cao C 2016 [32] | SNHG6 | upregulation | oncogene | miR-26a/b | TAK1 |
BEL-7402, SMMC-7721, MHCC-97 H, SK-Hep-1, Huh7 and HCC-LM3 |
promoting cellular proliferation and inhibiting apoptosis |
| Fan XX [23] | SNHG6 | upregulation | oncogene | miR-6509-5p | HIF1A | Hep3B and Huh7 | promote proliferation, migration and invasion |
| XieYT 2020 [36] | SNHG7 | upregulation | oncogene | miR-9-5p | CNNM1,bcl-2, bax, caspase-3 | THLE-3, BEL-7404, HCCLM3, Hep3B and HepG2 | facilitated cell proliferation, suppressed cell apoptosis |
| Yang X [37] | SNHG7 | upregulation | oncogene | miR-122-5p | RPL4 |
Huh7, Hep3B, HCCLM3, MHCC97 H |
induce cell proliferation, migration and invasion |
| Dong JY 2018 [69] | SNHG8 | upregulation | oncogene | miR-149-5p | E-cadherin, N-cadherin, and Vimentin | LO2, Huh6, Huh7, SK-hep1, HepG2, and PLC5 | facilitated cell proliferation, invasion, and Migration |
| Zhao ZB 2021 [16] | SNHG7 | upregulation | oncogene | miR-122-5p | FOXK2,E-cadherin, N-cadherin and Vimentin | SNU449, Hep3B, and THLE-2 | induce cell proliferation and migration |
| Feng SG [33] | SNHG9 | upregulation | oncogene | miR-23a-5p | miR-23a-5p/Wnt3a Axis | HUH6,HepG2, QSG7701 | facilitated cell proliferation |
| Lan T [45] | SNHG10 | upregulation | oncogene | miR-150-5p | c-Myb | SNU-182, Huh-7, Hep3B, SK-Hep1, and SNU-387 | promote cell proliferation, invasion, and migration and EMT process |
| Huang W [42] | SNH11 | upregulation | oncogene | miR-184 | AGO2 | HL-7702, SK-HEP-1, Hep G2, HuH-7, and Li-7 | induce Proliferation, Migration, inhibit Apoptosis and Autophagy |
| Lan T [44] | SNHG12 | upregulation | oncogene | miR-199a/b-5p | MLK3,NF-κB pathway | SK-Hep1 |
induced cell proliferation and suppress cell apoptosis |
| Wang X [50] | DANCR | upregulation | oncogene | miR-222-3p | ATG7 |
Bel7407, Hep3B, HepG2, Huh7 and MHCC97H |
accelerate cell proliferation and inhibit autophagy |
| Liu Y [48] | DANCR | upregulation | oncogene | - | IL-6/STAT3 Signaling |
HEK-293T, Huh7, Huh7/sorafenib-resistant (SR) and Hep3B/ SR and Hep3B |
facilitate Sorafenib Resistance |
| Yuan SX [54] | DANCR | upregulation | oncogene |
miR-214, miR- 320a, miR-199a |
CTNNB1 | 293T, SMMC7721 | increased stemness features of HCC cells |
| Zhang H [56] | SNHG14 | upregulation | oncogene | - | PTEN signaling | Hep3B and HepG2 cells | promoted cell proliferation, migration, and angiogenesis |
| Xu XY [52] | SNHG14 | upregulation | oncogene | miR-217 | E2F3 |
THLE-2, Huh-7, Hep3B |
induce cell proliferation and suppress cell apoptosis |
| Liao ZB [46] | SNHG14 | upregulation | oncogene | miR-876-5p | miR-876-5p/SSR2 | HepG2 and Hep3B |
promoted proliferation and metastasis |
| Lin RX 2021 [71] | SNHG14 | upregulation | oncogene | miR-206 | SOX9 | MHCC97-H, Bel-7404, HepG2, SMCC7721, and QGY-7703 | contribute to the proliferation, invasion, and migration |
| Chen W 2020 [40] | SNHG15 | upregulation | oncogene | miR-18b-5p | LMO4 | BEL-7402, HepG2, SMMC-7721, Hep3B | promote cell proliferation, invasion and migration and inhibit apoptosis |
| Dai W [41] | SNHG15 | upregulation | oncogene | miR-490-3p | HDAC2 | HuH-1, HuH-7 and L-O2 | facilitate cell proliferation, migration and invasion |
| Jing Z [43] | SNHG16 | upregulation | oncogene | miR-23b-3p | EGR1 | ATCC HB-8064, ACTT |
promote Sorafenib Resistance |
| Lin Q 2018 [47] | SNHG16 | upregulation | oncogene | miR-4500 | STAT3 | SMMC-7721, L02, MHCC‐97 H, HepG2 |
promoting cell proliferation, migration, invasion, and EMT process as well as inhibiting cell apoptosis |
| Zhong JH 2019 [58] | SNHG16 | upregulation | oncogene | - | p62 | HuH-7, HepG2, SMMC-7721, HL-7702 | promoted proliferation, migration, and invasion, while inhibiting apoptosis |
| Hu YL 2020 [70] | SNHG16 | upregulation | oncogene | miR-605-3p | TRAF6/NF-κB feedback loop | HCCLM3, MHCC97L and MHCC-97 H | promoted proliferation, migration |
| Ye JF [53] | SNHG16 | upregulation | oncogene | miR-140-5p | - | HepG2/SOR | facilitate Sorafenib Resistance |
| Xie XH [51] | SNHG16 | upregulation | oncogene | miR-195 | MMP-2, MMP-9 |
SMMC7721 and HepG2 |
promote proliferation, invasion |
| Zhu XM [59] | SNHG17 | upregulation | oncogene | - | - | HepG2 and SNU-182 | promotes cell proliferation and migration |
| Zhang DY 2016 [55] | SNHG20 | upregulation | oncogene | - | - | HL-7702, MHCC-97 H, HepG2, SK-Hep-1, SMMC-7721, and BEL-7402 | promoted proliferation, migration and invasion |
| Liu JX [60] | SNHG20 | upregulation | oncogene | - | ZEB1, ZEB2, N-cadherin, E-cadherin and Vimentin |
MHCC97L, SMCC- 7721, MHCC97H and Huh-7 |
induce cell proliferation and invasion |
| Zhang YX [62] | SNHG22 | upregulation | oncogene | miR-16-5p | DNMT1 | Huh7, HCCLM6, MHCC97H and SNU-398 | promoted cell proliferation, invasion and migration |
| Luo J [61] | MEG8 (SNHG23) | upregulation | oncogene | miR-367-3p | TGFβR1 |
HepG2, Huh7, HCCLM3, and HMCC-97 H |
promoted cell proliferation, invasion and migration |
This study inevitably has certain limitations. Initially, the results of this research could only be relevant to Asian or Chinese populations, as all of the patients included in the study were from China. Second, the survival prognosis’s HR value and its 95% CI are explicitly provided in a few of the included studies, while others only provide the number of patients and survival curve. The software Engauge 4.0 version was applied to obtain the HR value indirectly, which is inevitable There may be some statistical bias or other bias. Third, the overall results may be subject to a certain level of bias due to inconsistent sample sizes, statistical analysis methods, follow-up duration, cut-off values, and other factors among different original studies. We conducted a subgroup analysis to mitigate these biases. Nevertheless, this research is the first meta-analysis to investigate the relationship between SNHG family member expression and HCC prognosis. Meanwhile, the molecular biological mechanism of SNHG affecting the progression of liver cancer was also comprehensively summarized.
Conclusion
Most SNHG family members have substantial expression in HCC tissues, and high expression is positively connected with poor OS, advanced TNM stage, easy LNM and DM, poorer histopathological grade, and greater tumor size. SNHG may be an effective HCC prognostic marker and potential therapeutic target.
Acknowledgements
Not applicable.
Author contributions
Jun Zhang design the project; Sheng-qi Du, Fen Yang, Pei-xue Wang and Ya-Tong Liu searched databases and performed literature screen; Pei-xue Wang and Fen Yang extracted and analyzed the data; Sheng-qi Du, Jun Zhang and Ya-Tong Liu evaluated the quality of included literature; Fen Yang, Sheng-qi Du, Ya-Tong Liu and Jun Zhang contributed to writing the manuscript. Final draft was approved by all the authors.
Funding
Not applicable.
Data availability
This manuscript contains all study data or may be obtained from the corresponding author upon reasonable request.
Declarations
Ethics approval and consent to participate
This study does not require an ethics declaration and does not conduct any clinical patient studies. The writers bear full responsibility for the work, guaranteeing that any doubts about the precision or consistency of any portion are duly examined and settled.
Consent for publication
Not applicable.
Competing interests
The authors declare no competing interests.
Footnotes
Publisher’s Note
Springer Nature remains neutral with regard to jurisdictional claims in published maps and institutional affiliations.
Sheng-qi Du and Ya-tong Liu contributed equally to this article as co-author.
References
- 1.Siegel RL, Miller KD, Wagle NS, Jemal A. Cancer statistics, 2023. Cancer J Clin. 2023;73(1):17–48. 10.3322/caac.21763 [DOI] [PubMed] [Google Scholar]
- 2.Sung H, Ferlay J, Siegel RL, Laversanne M, Soerjomataram I, Jemal A, Bray F. Global Cancer statistics 2020: GLOBOCAN estimates of incidence and Mortality Worldwide for 36 cancers in 185 countries. Cancer J Clin. 2021;71(3):209–49. 10.3322/caac.21660 [DOI] [PubMed] [Google Scholar]
- 3.Miller KD, Nogueira L, Devasia T, Mariotto AB, Yabroff KR, Jemal A, Kramer J, Siegel RL. Cancer treatment and survivorship statistics, 2022. Cancer J Clin. 2022;72(5):409–36. 10.3322/caac.21731 [DOI] [PubMed] [Google Scholar]
- 4.Giaquinto AN, Miller KD, Tossas KY, Winn RA, Jemal A, Siegel RL. Cancer statistics for African American/Black people 2022. Cancer J Clin. 2022;72(3):202–29. 10.3322/caac.21718 [DOI] [PubMed] [Google Scholar]
- 5.Harding-Theobald E, Louissaint J, Maraj B, Cuaresma E, Townsend W, Mendiratta-Lala M, Singal AG, Su GL, Lok AS, Parikh ND. Systematic review: radiomics for the diagnosis and prognosis of hepatocellular carcinoma. Aliment Pharmacol Ther. 2021;54(7):890–901. 10.1111/apt.16563 [DOI] [PMC free article] [PubMed] [Google Scholar]
- 6.Huo TI, Liao JI, Ho SY. Prognostic prediction for patients with hepatocellular carcinoma receiving immunotherapy: are we there yet? J Hepatol. 2022;76(4):987–8. 10.1016/j.jhep.2021.11.007 [DOI] [PubMed] [Google Scholar]
- 7.Xu RH, Wei W, Krawczyk M, Wang W, Luo H, Flagg K, Yi S, Shi W, Quan Q, Li K, et al. Circulating tumour DNA methylation markers for diagnosis and prognosis of hepatocellular carcinoma. Nat Mater. 2017;16(11):1155–61. 10.1038/nmat4997 [DOI] [PubMed] [Google Scholar]
- 8.Gu Y, Li X, Bi Y, Zheng Y, Wang J, Li X, Huang Z, Chen L, Huang Y, Huang Y. CCL14 is a prognostic biomarker and correlates with immune infiltrates in hepatocellular carcinoma. Aging. 2020;12(1):784–807. 10.18632/aging.102656 [DOI] [PMC free article] [PubMed] [Google Scholar]
- 9.Farzaneh M, Ghasemian M, Ghaedrahmati F, Poodineh J, Najafi S, Masoodi T, Kurniawan D, Uddin S, Azizidoost S. Functional roles of lncRNA-TUG1 in hepatocellular carcinoma. Life Sci. 2022;308:120974. 10.1016/j.lfs.2022.120974 [DOI] [PubMed] [Google Scholar]
- 10.Sheng JQ, Wang MR, Fang D, Liu L, Huang WJ, Tian DA, He XX, Li PY. LncRNA NBR2 inhibits tumorigenesis by regulating autophagy in hepatocellular carcinoma. Biomed Pharmacotherapy = Biomedecine Pharmacotherapie. 2021;133:111023. 10.1016/j.biopha.2020.111023 [DOI] [PubMed] [Google Scholar]
- 11.Statello L, Guo CJ, Chen LL, Huarte M. Gene regulation by long non-coding RNAs and its biological functions. Nat Rev Mol Cell Biol. 2021;22(2):96–118. 10.1038/s41580-020-00315-9 [DOI] [PMC free article] [PubMed] [Google Scholar]
- 12.Liu SJ, Dang HX, Lim DA, Feng FY, Maher CA. Long noncoding RNAs in cancer metastasis. Nat Rev Cancer. 2021;21(7):446–60. 10.1038/s41568-021-00353-1 [DOI] [PMC free article] [PubMed] [Google Scholar]
- 13.Chen S, Shen X. Long noncoding RNAs: functions and mechanisms in colon cancer. Mol Cancer. 2020;19(1):167. 10.1186/s12943-020-01287-2 [DOI] [PMC free article] [PubMed] [Google Scholar]
- 14.Zhang G, Sun J, Zhang X. A novel cuproptosis-related LncRNA signature to predict prognosis in hepatocellular carcinoma. Sci Rep. 2022;12(1):11325. 10.1038/s41598-022-15251-1 [DOI] [PMC free article] [PubMed] [Google Scholar]
- 15.Feng J, Yang G, Liu Y, Gao Y, Zhao M, Bu Y, Yuan H, Yuan Y, Yun H, Sun M, et al. LncRNA PCNAP1 modulates hepatitis B virus replication and enhances tumor growth of liver cancer. Theranostics. 2019;9(18):5227–45. 10.7150/thno.34273 [DOI] [PMC free article] [PubMed] [Google Scholar]
- 16.Zhao Z, Gao J, Huang S. LncRNA SNHG7 promotes the HCC Progression through miR-122-5p/FOXK2 Axis. Dig Dis Sci. 2022;67(3):925–35. 10.1007/s10620-021-06918-2 [DOI] [PubMed] [Google Scholar]
- 17.Kou JT, Ma J, Zhu JQ, Xu WL, Liu Z, Zhang XX, Xu JM, Li H, Li XL, He Q. LncRNA NEAT1 regulates proliferation, apoptosis and invasion of liver cancer. Eur Rev Med Pharmacol Sci. 2020;24(8):4152–60. [DOI] [PubMed] [Google Scholar]
- 18.Tan AQ, Zheng YF. The roles of SNHG Family in osteoblast differentiation. Genes 2022, 13(12). [DOI] [PMC free article] [PubMed]
- 19.Zhen N, Zhu J, Mao S, Zhang Q, Gu S, Ma J, Zhang Y, Yin M, Li H, Huang N, et al. Alternative splicing of lncRNAs from SNHG Family alters snoRNA expression and induces Chemoresistance in Hepatoblastoma. Cell Mol Gastroenterol Hepatol. 2023;16(5):735–55. 10.1016/j.jcmgh.2023.07.007 [DOI] [PMC free article] [PubMed] [Google Scholar]
- 20.Shi J, Ding W, Lu H. Identification of long non-coding RNA SNHG family as promising prognostic biomarkers in Acute myeloid leukemia. OncoTargets Therapy. 2020;13:8441–50. 10.2147/OTT.S265853 [DOI] [PMC free article] [PubMed] [Google Scholar]
- 21.Li J, Gao J, Kan A, Hao T, Huang L. SNHG and UCA1 as prognostic molecular biomarkers in hepatocellular carcinoma: recent research and meta-analysis. Minerva Med. 2017;108(6):568–74. 10.23736/S0026-4806.17.05094-7 [DOI] [PubMed] [Google Scholar]
- 22.Li Y, Wang X, Chen S, Wu B, He Y, Du X, Yang X. Long non-coding RNA small nucleolar RNA host genes: functions and mechanisms in hepatocellular carcinoma. Mol Biol Rep. 2022;49(3):2455–64. 10.1007/s11033-021-07018-0 [DOI] [PubMed] [Google Scholar]
- 23.Fan X, Zhao Z, Song J, Zhang D, Wu F, Tu J, Xu M, Ji J. LncRNA-SNHG6 promotes the progression of hepatocellular carcinoma by targeting mir-6509-5p and HIF1A. Cancer Cell Int. 2021;21(1):150. 10.1186/s12935-021-01835-w [DOI] [PMC free article] [PubMed] [Google Scholar]
- 24.Luo Y, Lin J, Zhang J, Song Z, Zheng D, Chen F, Zhuang X, Li A, Liu X. LncRNA SNHG17 Contributes to Proliferation, Migration, and Poor Prognosis of Hepatocellular Carcinoma. Canadian journal of gastroenterology & hepatology 2021, 2021:9990338. [DOI] [PMC free article] [PubMed]
- 25.Stang A. Critical evaluation of the Newcastle-Ottawa scale for the assessment of the quality of nonrandomized studies in meta-analyses. Eur J Epidemiol. 2010;25(9):603–5. 10.1007/s10654-010-9491-z [DOI] [PubMed] [Google Scholar]
- 26.Tierney JF, Stewart LA, Ghersi D, Burdett S, Sydes MR. Practical methods for incorporating summary time-to-event data into meta-analysis. Trials. 2007;8:16. 10.1186/1745-6215-8-16 [DOI] [PMC free article] [PubMed] [Google Scholar]
- 27.Meng F, Liu J, Lu T, Zang L, Wang J, He Q, Zhou A. SNHG1 knockdown upregulates miR-376a and downregulates FOXK1/Snail axis to prevent tumor growth and metastasis in HCC. Mol Therapy Oncolytics. 2021;21:264–77. 10.1016/j.omto.2021.02.002 [DOI] [PMC free article] [PubMed] [Google Scholar]
- 28.Zhang M, Wang W, Li T, Yu X, Zhu Y, Ding F, Li D, Yang T. Long noncoding RNA SNHG1 predicts a poor prognosis and promotes hepatocellular carcinoma tumorigenesis. Biomed Pharmacotherapy = Biomedecine Pharmacotherapie. 2016;80:73–9. 10.1016/j.biopha.2016.02.036 [DOI] [PubMed] [Google Scholar]
- 29.Chang L, Li C, Lan T, Wu L, Yuan Y, Liu Q, Liu Z. Decreased expression of long non-coding RNA GAS5 indicates a poor prognosis and promotes cell proliferation and invasion in hepatocellular carcinoma by regulating vimentin. Mol Med Rep. 2016;13(2):1541–50. 10.3892/mmr.2015.4716 [DOI] [PMC free article] [PubMed] [Google Scholar]
- 30.Hu L, Ye H, Huang G, Luo F, Liu Y, Liu Y, Yang X, Shen J, Liu Q, Zhang J. Long noncoding RNA GAS5 suppresses the migration and invasion of hepatocellular carcinoma cells via miR-21. Tumour Biology: J Int Soc Oncodevelopmental Biology Med. 2016;37(2):2691–702. 10.1007/s13277-015-4111-x [DOI] [PubMed] [Google Scholar]
- 31.Tu ZQ, Li RJ, Mei JZ, Li XH. Down-regulation of long non-coding RNA GAS5 is associated with the prognosis of hepatocellular carcinoma. Int J Clin Exp Pathol. 2014;7(7):4303–9. [PMC free article] [PubMed] [Google Scholar]
- 32.Cao C, Zhang T, Zhang D, Xie L, Zou X, Lei L, Wu D, Liu L. The long non-coding RNA, SNHG6-003, functions as a competing endogenous RNA to promote the progression of hepatocellular carcinoma. Oncogene. 2017;36(8):1112–22. 10.1038/onc.2016.278 [DOI] [PubMed] [Google Scholar]
- 33.Feng SG, Bhandari R, Ya L, Zhixuan B, Qiuhui P, Jiabei Z, Sewi M, Ni Z, Jing W, Fenyong S, et al. SNHG9 promotes Hepatoblastoma Tumorigenesis via miR-23a-5p/Wnt3a Axis. J Cancer. 2021;12(20):6031–49. 10.7150/jca.60748 [DOI] [PMC free article] [PubMed] [Google Scholar]
- 34.Li Y, Guo D, Zhao Y, Ren M, Lu G, Wang Y, Zhang J, Mi C, He S, Lu X. Long non-coding RNA SNHG5 promotes human hepatocellular carcinoma progression by regulating miR-26a-5p/GSK3β signal pathway. Cell Death Dis. 2018;9(9):888. 10.1038/s41419-018-0882-5 [DOI] [PMC free article] [PubMed] [Google Scholar]
- 35.Shen A, Ma J, Hu X, Cui X. High expression of lncRNA-SNHG7 is associated with poor prognosis in hepatocellular carcinoma. Oncol Lett. 2020;19(6):3959–63. [DOI] [PMC free article] [PubMed] [Google Scholar]
- 36.Xie Y, Wang Y, Gong R, Lin J, Li X, Ma J, Huo L. SNHG7 facilitates Hepatocellular Carcinoma occurrence by sequestering mir-9-5p to Upregulate CNNM1 expression. Cancer Biother Radiopharm. 2020;35(10):731–40. [DOI] [PubMed] [Google Scholar]
- 37.Yang X, Sun L, Wang L, Yao B, Mo H, Yang W. LncRNA SNHG7 accelerates the proliferation, migration and invasion of hepatocellular carcinoma cells via regulating mir-122-5p and RPL4. Biomed Pharmacotherapy = Biomedecine Pharmacotherapie. 2019;118:109386. 10.1016/j.biopha.2019.109386 [DOI] [PubMed] [Google Scholar]
- 38.Zhang PF, Wang F, Wu J, Wu Y, Huang W, Liu D, Huang XY, Zhang XM, Ke AW. LncRNA SNHG3 induces EMT and sorafenib resistance by modulating the miR-128/CD151 pathway in hepatocellular carcinoma. J Cell Physiol. 2019;234(3):2788–94. 10.1002/jcp.27095 [DOI] [PubMed] [Google Scholar]
- 39.Zhang T, Cao C, Wu D, Liu L. SNHG3 correlates with malignant status and poor prognosis in hepatocellular carcinoma. Tumour Biology: J Int Soc Oncodevelopmental Biology Med. 2016;37(2):2379–85. 10.1007/s13277-015-4052-4 [DOI] [PubMed] [Google Scholar]
- 40.Chen W, Huang L, Liang J, Ye Y, Yu S, Zhang Y. Long noncoding RNA small nucleolar RNA host gene 15 deteriorates liver cancer via microRNA-18b-5p/LIM-only 4 axis. IUBMB Life. 2021;73(2):349–61. 10.1002/iub.2431 [DOI] [PubMed] [Google Scholar]
- 41.Dai W, Dai JL, Tang MH, Ye MS, Fang S. lncRNA-SNHG15 accelerates the development of hepatocellular carcinoma by targeting miR-490-3p/ histone deacetylase 2 axis. World J Gastroenterol. 2019;25(38):5789–99. 10.3748/wjg.v25.i38.5789 [DOI] [PMC free article] [PubMed] [Google Scholar]
- 42.Huang W, Huang F, Lei Z, Luo H. LncRNA SNHG11 promotes Proliferation, Migration, apoptosis, and Autophagy by regulating hsa-miR-184/AGO2 in HCC. OncoTargets Therapy. 2020;13:413–21. 10.2147/OTT.S237161 [DOI] [PMC free article] [PubMed] [Google Scholar]
- 43.Jing Z, Ye X, Ma X, Hu X, Yang W, Shi J, Chen G, Gong L. SNGH16 regulates cell autophagy to promote Sorafenib Resistance through suppressing miR-23b-3p via sponging EGR1 in hepatocellular carcinoma. Cancer Med. 2020;9(12):4324–38. 10.1002/cam4.3020 [DOI] [PMC free article] [PubMed] [Google Scholar]
- 44.Lan T, Ma W, Hong Z, Wu L, Chen X, Yuan Y. Long non-coding RNA small nucleolar RNA host gene 12 (SNHG12) promotes tumorigenesis and metastasis by targeting miR-199a/b-5p in hepatocellular carcinoma. J Experimental Clin cancer Research: CR. 2017;36(1):11. 10.1186/s13046-016-0486-9 [DOI] [PMC free article] [PubMed] [Google Scholar]
- 45.Lan T, Yuan K, Yan X, Xu L, Liao H, Hao X, Wang J, Liu H, Chen X, Xie K, et al. LncRNA SNHG10 facilitates Hepatocarcinogenesis and Metastasis by modulating its Homolog SCARNA13 via a positive feedback Loop. Cancer Res. 2019;79(13):3220–34. 10.1158/0008-5472.CAN-18-4044 [DOI] [PubMed] [Google Scholar]
- 46.Liao Z, Zhang H, Su C, Liu F, Liu Y, Song J, Zhu H, Fan Y, Zhang X, Dong W, et al. Long noncoding RNA SNHG14 promotes hepatocellular carcinoma progression by regulating miR-876-5p/SSR2 axis. J Experimental Clin cancer Research: CR. 2021;40(1):36. 10.1186/s13046-021-01838-5 [DOI] [PMC free article] [PubMed] [Google Scholar]
- 47.Lin Q, Zheng H, Xu J, Zhang F, Pan H. LncRNA SNHG16 aggravates tumorigenesis and development of hepatocellular carcinoma by sponging miR-4500 and targeting STAT3. J Cell Biochem. 2019;120(7):11604–15. 10.1002/jcb.28440 [DOI] [PubMed] [Google Scholar]
- 48.Liu Y, Chen L, Yuan H, Guo S, Wu G. LncRNA DANCR promotes Sorafenib Resistance via activation of IL-6/STAT3 signaling in Hepatocellular Carcinoma cells. OncoTargets Therapy. 2020;13:1145–57. 10.2147/OTT.S229957 [DOI] [PMC free article] [PubMed] [Google Scholar]
- 49.Ma X, Wang X, Yang C, Wang Z, Han B, Wu L, Zhuang L. DANCR acts as a diagnostic biomarker and promotes Tumor Growth and Metastasis in Hepatocellular Carcinoma. Anticancer Res. 2016;36(12):6389–98. 10.21873/anticanres.11236 [DOI] [PubMed] [Google Scholar]
- 50.Wang X, Cheng ML, Gong Y, Ma WJ, Li B, Jiang YZ. LncRNA DANCR promotes ATG7 expression to accelerate hepatocellular carcinoma cell proliferation and autophagy by sponging miR-222-3p. Eur Rev Med Pharmacol Sci. 2020;24(17):8778–87. [DOI] [PubMed] [Google Scholar]
- 51.Xie X, Xu X, Sun C, Yu Z. Long intergenic noncoding RNA SNHG16 interacts with miR-195 to promote proliferation, invasion and tumorigenesis in hepatocellular carcinoma. Exp Cell Res. 2019;383(1):111501. 10.1016/j.yexcr.2019.111501 [DOI] [PubMed] [Google Scholar]
- 52.Xu X, Song F, Jiang X, Hong H, Fei Q, Jin Z, Zhu X, Dai B, Yang J, Sui C, et al. Long non-coding RNA SNHG14 contributes to the Development of Hepatocellular Carcinoma via sponging miR-217. OncoTargets Therapy. 2020;13:4865–76. 10.2147/OTT.S244530 [DOI] [PMC free article] [PubMed] [Google Scholar]
- 53.Ye J, Zhang R, Du X, Chai W, Zhou Q. Long noncoding RNA SNHG16 induces sorafenib resistance in hepatocellular carcinoma cells through sponging miR-140-5p. OncoTargets Therapy. 2019;12:415–22. 10.2147/OTT.S175176 [DOI] [PMC free article] [PubMed] [Google Scholar]
- 54.Yuan SX, Wang J, Yang F, Tao QF, Zhang J, Wang LL, Yang Y, Liu H, Wang ZG, Xu QG, et al. Long noncoding RNA DANCR increases stemness features of hepatocellular carcinoma by derepression of CTNNB1. Hepatology (Baltimore MD). 2016;63(2):499–511. 10.1002/hep.27893 [DOI] [PubMed] [Google Scholar]
- 55.Zhang D, Cao C, Liu L, Wu D. Up-regulation of LncRNA SNHG20 predicts poor prognosis in Hepatocellular Carcinoma. J Cancer. 2016;7(5):608–17. 10.7150/jca.13822 [DOI] [PMC free article] [PubMed] [Google Scholar]
- 56.Zhang H, Xu HB, Kurban E, Luo HW. LncRNA SNHG14 promotes hepatocellular carcinoma progression via H3K27 acetylation activated PABPC1 by PTEN signaling. Cell Death Dis. 2020;11(8):646. 10.1038/s41419-020-02808-z [DOI] [PMC free article] [PubMed] [Google Scholar]
- 57.Zhang JH, Wei HW, Yang HG. Long noncoding RNA SNHG15, a potential prognostic biomarker for hepatocellular carcinoma. Eur Rev Med Pharmacol Sci. 2016;20(9):1720–4. [PubMed] [Google Scholar]
- 58.Zhong JH, Xiang X, Wang YY, Liu X, Qi LN, Luo CP, Wei WE, You XM, Ma L, Xiang BD, et al. The lncRNA SNHG16 affects prognosis in hepatocellular carcinoma by regulating p62 expression. J Cell Physiol. 2020;235(2):1090–102. 10.1002/jcp.29023 [DOI] [PubMed] [Google Scholar]
- 59.Zhu XM, Li L, Ren LL, Du L, Wang YM. LncRNA SNHG17 predicts poor prognosis and promotes cell proliferation and migration in hepatocellular carcinoma. Eur Rev Med Pharmacol Sci. 2021;25(12):4219–27. [DOI] [PubMed] [Google Scholar]
- 60.Liu J, Lu C, Xiao M, Jiang F, Qu L, Ni R. Long non-coding RNA SNHG20 predicts a poor prognosis for HCC and promotes cell invasion by regulating the epithelial-to-mesenchymal transition. Biomed Pharmacotherapy = Biomedecine Pharmacotherapie. 2017;89:857–63. 10.1016/j.biopha.2017.01.011 [DOI] [PubMed] [Google Scholar]
- 61.Lou J, Yan W, Li QY, Zhu AK, Tan BQ, Dong R, Zou XZ, Liu T. LncRNA MEG8 plays an oncogenic role in hepatocellular carcinoma progression through miR-367-3p/14-3-3ζ/TGFβR1 axis. Neoplasma. 2021;68(2):273–82. 10.4149/neo_2020_200730N785 [DOI] [PubMed] [Google Scholar]
- 62.Zhang Y, Lu C, Cui H. Long non-coding RNA SNHG22 facilitates hepatocellular carcinoma tumorigenesis and angiogenesis via DNA methylation of microRNA miR-16-5p. Bioengineered. 2021;12(1):7446–58. 10.1080/21655979.2021.1975969 [DOI] [PMC free article] [PubMed] [Google Scholar]
- 63.Yang L, Jiang J. GAS5 Regulates RECK Expression and Inhibits Invasion Potential of HCC Cells by Sponging miR-135b. BioMed research international 2019, 2019:2973289. [DOI] [PMC free article] [PubMed]
- 64.Kansara S, Singh A, Badal AK, Rani R, Baligar P, Garg M, Pandey AK. The emerging regulatory roles of non-coding RNAs associated with glucose metabolism in breast cancer. Sem Cancer Biol. 2023;95:1–12. 10.1016/j.semcancer.2023.06.007 [DOI] [PubMed] [Google Scholar]
- 65.Pandya G, Kirtonia A, Sethi G, Pandey AK, Garg M. The implication of long non-coding RNAs in the diagnosis, pathogenesis and drug resistance of pancreatic ductal adenocarcinoma and their possible therapeutic potential. Biochim et Biophys acta Reviews cancer. 2020;1874(2):188423. 10.1016/j.bbcan.2020.188423 [DOI] [PubMed] [Google Scholar]
- 66.Sharma A, Kansara S, Mahajan M, Yadav B, Garg M, Pandey AK. Long non-coding RNAs orchestrate various molecular and cellular processes by modulating epithelial-mesenchymal transition in head and neck squamous cell carcinoma. Biochim et Biophys acta Mol Basis Disease. 2021;1867(11):166240. 10.1016/j.bbadis.2021.166240 [DOI] [PubMed] [Google Scholar]
- 67.Zhang J, Jin X, Zhou C, Zhao H, He P, Hao Y, Dong Q. Resveratrol suppresses human nasopharyngeal Carcinoma Cell Growth Via inhibiting differentiation antagonizing Non-protein Coding RNA (DANCR) expression. Med Sci Monitor: Int Med J Experimental Clin Res. 2020;26:e923622. [DOI] [PMC free article] [PubMed] [Google Scholar] [Retracted]
- 68.Chen S, Xie C, Hu X. lncRNA SNHG6 functions as a ceRNA to up-regulate c-Myc expression via sponging let-7c-5p in hepatocellular carcinoma. Biochem Biophys Res Commun. 2019;519(4):901–908. [DOI] [PubMed]
- 69.Dong J, Teng F, Guo W, Yang J, Ding G, Fu Z. lncRNA SNHG8 promotes the tumorigenesis and metastasis by sponging miR-149-5p and predicts tumor recurrence in hepatocellular carcinoma. Cell Physiol Biochem Internat J Exper Cell Physiol Biochem Pharmacology 2018;51(5):2262–2274. [DOI] [PubMed]
- 70.Hu YL, Feng Y, Chen YY, Liu JZ, Su Y, Li P, Huang H, Mao QS, Xue WJ. SNHG16/miR-605-3p/TRAF6/NF-κB feedback loop regulates hepatocellular carcinoma metastasis. J Cell Mol Med. 2020;24(13):7637–7651. [DOI] [PMC free article] [PubMed]
- 71.Lin RX, Zhan GF, Wu JC, Fang H, Yang SL. LncRNA SNHG14 sponges miR-206 to affect proliferation, apoptosis, and metastasis of hepatocellular carcinoma cells by regulating SOX9. Digest Dis Sci. 2022;67(3):936–946. [DOI] [PubMed]
Associated Data
This section collects any data citations, data availability statements, or supplementary materials included in this article.
Data Availability Statement
This manuscript contains all study data or may be obtained from the corresponding author upon reasonable request.