

Structured Abstract:
Purpose:
Androgen deprivation therapy (ADT) remains the backbone of prostate cancer treatment. Beyond suppression of testosterone and tumor cell growth, emerging evidence suggests ADT also modulates the immune tumor microenvironment (TME). However, a more precise understanding of the timing and intricacies of these immunological shifts is needed.
Experimental Design:
Here we analyzed 49 primary prostate cancers, comparing those surgically removed either without treatment or following treatment with degarelix at 4, 7, and 14 days pre-surgery. Utilizing next-generation DNA and RNA sequencing, and multiplexed immunofluorescence, we examined alterations in immune phenotypes in the presence or absence of ADT.
Results:
Our findings reveal that ADT rapidly transforms the typically bland prostate TME into an inflamed environment within days. Notably, we observed an increase in activated CD8 T-cells along with an increase in suppressive regulatory T-cells (Tregs). We also found an expansion of the myeloid compartment, particularly pro-inflammatory M1-like tumor-associated macrophages. Intriguingly, discernable changes which have not previously been described also occurred in tumor cells, including upregulation of antigen presentation by MHC class I and II and, unexpectedly, a decrease in the “don’t eat me” signal CD47.
Conclusions:
These observations underscore the critical role of timing and disease context in order to optimize the therapeutic efficacy of immune modulators combined with androgen ablation, for which the presurgical neoadjuvant setting may be ideal. Our findings warrant future prospective validation, which is currently underway.
Introduction
Recent advances in cancer immunotherapy have revolutionized treatment across a range of tumor types. However, prostate cancers are generally immunologically inert and show limited responses to immunotherapy [1, 2]. However, interestingly, relative immune infiltration has also been shown to correlate with prognosis in localized prostate cancer with macrophages and T cells broadly associated with worse outcomes and mast cells, NK cells and dendritic cells associated with better outcomes[3]. In other tumor types, varying degrees of T-cell infiltration and activation correlate with the efficacy of immunotherapy [4, 5]. In prostate cancer, tumorigenesis and progression is associated with multiple mechanisms of immune escape, even when the immune system recognizes and targets prostate cancer antigens, creating a non-inflamed tumor microenvironment (TME) that poses a substantial challenge for immune-based interventions [6–8]. Loss of antigen-presentation machinery, increased infiltration of suppressive lymphoid and myeloid immune cells and increased production of distinct cytokine programs have all been implicated as potential mechanisms of immune escape in prostate cancer [ref]. Strategies that induce an intratumoral immune cell infiltrate, enhance antigen-presentation and create a pro-inflammatory milieu represent crucial steps in optimizing the anti-tumor effects of immunotherapy for prostate cancer.
Androgen-deprivation therapy (ADT) remains the backbone of systemic therapy for prostate cancer and acts through testosterone suppression, which results in apoptosis in prostate epithelial cells [9]. Although it is increasingly appreciated that modulation of androgen levels alters host immunity by activating both adaptive and humoral immune responses, prior studies have been limited to a few markers of interest allowing for only broad characterization of cellular phenotypes [10, 11]. Recently, a more detailed understanding of the prostate TME from metastatic biopsies has emerged, showing that in castration-sensitive prostate cancer (CSPC) a more infiltrated tumor phenotype is present across multiple sites of disease with limited changes in T cell infiltration after ADT[12]. By the time castration-resistant prostate cancer (CRPC) develops, the TME appears devoid of a significant immune infiltrate, with predominance of suppressive myeloid cells in bone [13, 14].
Given the dynamic characteristics of immune responses in prostate cancer, we aimed to elucidate how early the immune effects of ADT occur and to understand how they evolve over time. To do so, we performed transcriptomic and multiplexed immunofluorescence studies on a cohort of clinically localized human prostate cancers treated with neoadjuvant degarelix acetate—a form of ADT which induces chemical castration within 24 hours of administration [15]. Our approach enabled us to comprehensively quantify changes in key immunologic pathways using first an unbiased approach and then assessing the effects of ADT on the composition and spatial distribution of cell types within the localized prostate cancer TME. The goal was to delineate the timing and mechanisms by which ADT remodels the TME, with the overarching objective of identifying novel pathways for combinatorial therapeutic interventions.
Materials and Methods
Experimental design
Patients
Samples were collected from 2 completed clinical trials of neoadjuvant degarelix (240mg subcutaneously) given prior to radical prostatectomy. In the first trial, patients were given degarelix 14 days prior to radical prostatectomy (NCT01696877). In the second trial, patients were randomized to receive degarelix 4 or 7 days prior to surgery (NCT01542021). Inclusion criteria for both studies were similar, and all patients included in the current analysis had intermediate-to-high-risk localized prostate adenocarcinoma, defined as clinical stage T1c-T3b, N0–1, M0, and a Gleason sum ≥4+3 (grade group ≥3). Written informed consent was obtained from all subjects and performed after approval by the institutional review board in accordance with an assurance filed with and approved by the U.S. Department of Health and Human Services. These studies were conducted in accordance with Good Clinical Practice guidelines in accordance with the Declaration of Helsinki. Tissue was requested from 28 patients treated with degarelix acetate (10 patients treated at 4 days, 10 patients treated at 7 days, and 8 patients treated at 14 days prior to radical prostatectomy) and 35 untreated controls, matched for stage and grade. Hematoxylin and eosin (H&E) slides were reviewed by an expert pathologist, with identification and marking of regions containing >50% tumor cell content for each case.
Targeted DNA sequencing
Targeted DNA sequencing was performed using either the Clinical Laboratory Improvement Amendments-certified MSK IMPACT tumor sequencing test or the Columbia Comprehensive Cancer Panel, which detects variations in 505 and 467 cancer genes, respectively, as previously described [16, 17]. Somatic mutations, DNA copy number alterations, and structural rearrangements were identified with mutations manually reviewed as part of the established clinical workflows.
Expression profiling
Immune gene expression in the prostate TME was profiled using RNA-sequencing (RNA-seq). First, slides were prepared from formalin-fixed, paraffin-embedded (FFPE) tissue blocks and sectioned into slides of 10μm thickness. Scrapings of regions containing >50% tumor tissue were macrodissected for RNA extraction. RNA was then extracted using the Qiagen RNAeasy Mini Kit (Qiagen, Venio, The Netherlands). The Agilent Bioanalyzer (Agilent, Santa Clara, CA, USA) was used for RNA quantification and quality assessment. RNA-seq was performed in the Sulzberger Genome Center at Columbia University using the Illumina NovaSeq 6000 System (Illumina, San Diego, CA, USA). Library preparation was performed using RIBOZERO Gold prep with rRNA depletion. Samples were sequenced at 80M depth and PE100, and aligned to human reference genome by STAR (STAR, RRID:SCR_004463). Read counts were normalized to Log10 (Counts per Million + 1), and subsequently batch-corrected by ComBat (RRID:SCR_010974). Clustering of batch-corrected data by treatment group was visualized with Uniform Manifold Approximation and Projection (UMAP). Subsequently, pairwise differential gene expression between treatment groups was computed by log2(fold-change) and the Bonferroni-corrected non-parametric Wilcox test for each gene. Enrichment of Gene Ontology (GO) Pathways was performed by Gorilla on a single list of genes ranked by fold-change [18]. CIBERSORT inference of immune cell type abundances was performed on raw gene expression counts matrices in absolute mode with 1000 permutations and without quantile normalization [19]. Follow-up differential gene expression analysis was performed by subsetting the ComBat-normalized gene expression matrix to 770 immune genes included in the NanoString PanCancer IO3600 Gene Expression Panel (NanoString, Seattle, WA, USA). Pairwise differential gene expression was computed as previously, with Bonferroni p-value correction adjusting for 770 parallel hypothesis tests.
Staining for multiplex immunofluorescence
Patient FFPE tissue blocks with >50% tumor were chosen for sectioning to Superfrost™ slides (Fisher Scientific, Waltham, MA, USA). Representative full-section 4μm slides of tissue specimens were stained for H&E and viewed by the pathologist to determine areas of tumor, stroma, regression, and immune infiltrates. For the Vectra panels, each tissue specimen was stained using Opal™ 7-color multiplex IF kit, according to the manufacturer’s protocol (Akoya Biosciences, Marlborough, MA, USA), with minor modifications. Briefly, slides were baked at 60°C for approximately 2 hours before de-paraffinization and retrieval of antigen at pH 9. The slides were then blocked using the antibody diluent, before staining with primary antibodies, which include CD47 (clone-D307P, Cell Signaling Technology Cat# 63000, RRID:AB_2799637, 1:200), CD74 (clone-D5N3I, Cell Signaling Technology Cat# 77274, RRID:AB_2799893, 1:500), CD3 (clone-LN10, Leica Biosystems Cat# NCL-L-CD3–565, RRID:AB_563541,1:75), CTLA-4 (clone – BSB88, BioSB, cat#BSB2880), AMACR (Clone -EPMU1, Leica, cat#PA0210), and CD68 (clone – KP1, BioGeneX, cat#AM416–5M). For each staining cycle, the slides were incubated with primary antibody, followed by the secondary HRP-polymerization, and signal amplification using Tyramide conjugated to an Opal fluorophore and microwave treated with an appropriate buffer. For CODEX, generation of DNA-conjugated antibodies was performed using the manufacturer’s protocol (Akoya Biosciences). The immune profiling panel was optimized on prostate tissue for the following antibodies: CD3e ((Akoya Biosciences Cat# 4550125, RRID:AB_3094503, 1:200), CD4 (Akoya Biosciences Cat# 4550112, RRID:AB_3094499, 1:200), CD68 (Akoya Biosciences Cat# 4550113, RRID:AB_2935894, 1:200), CD8 (Akoya Biosciences Cat# 4150004, RRID:AB_2895049, 1:200), FoxP3 (Akoya Biosciences Cat# 4550071, RRID:AB_2927679, 1:200), Granzyme B (clone-AKYP0086, Akoya, 1:100), HLA-A (Akoya Biosciences Cat# 4250100, RRID:AB_3094501, 1:200), HLA-DR (Akoya Biosciences Cat# 4450095, RRID:AB_3094500, 1:200), panCK (Akoya Biosciences Cat# 4450020, RRID:AB_3083456, 1:300), CD163 (Akoya Biosciences Cat# 4250079, RRID:AB_2935895, 1:50), PSMA (clone-D718E, Cell Signaling Technology, Cat#12815, 1:400), and CD206 (Cell Signaling Technology Cat# 91992, RRID:AB_2800175, 1:50). Slide preparation and multicycle reaction was performed on the PhenoCycler®-Fusion 2.0 instrument using the manufacturer’s protocol (Akoya Biosciences). For both the Vectra and CODEX assays, single controls for each antibody and an unstained slide were included for each group of slides.
Multispectral imaging
For Vectra imaging, each patient specimen whole scan slides were analyzed and 7 representative areas with >50% tumor content were chosen for multispectral image capture using Vectra Polaris (PerkinElmer, Waltham, MA, USA). Each region of interest was 700×520 um. These images were factored equally for each patient during analysis using InForm™ software (PerkinElmer). For CODEX imaging, whole scan slides were analyzed with 2–3 regions of interest of 2mm in diameter for image capture using the PhenoImager (Akoya Biosciences). For both Vectra and CODEX imaging, single-stained slides and unstained slides were used for building the spectral library and unmixing, taking the autofluorescence spectrum of patient tissue into account [20].
Image analysis
Vectra
Using the spectral library, representative regions for each patient were spectrally unmixed before manual tissue segmentation using InForm software V2.4.6 (PerkinElmer). Tissue segmentation included highlighting examples of AMACR-positive prostate tumor tissue, classifying the AMACR-negative highly cellular regions as stroma; and the spatially distant AMACR- regions as adjacent normal. Non-staining tumor regions were excluded. This trained the InForm algorithm to characterize tissue types and segment all the corresponding regions for each patient sample. Cellular components were then identified for each cell using the DAPI nuclear counter stain to define the nucleus; and CD3 and AMACR stains to detect the associated membrane and cytoplasm, respectively. Using DAPI, we adjusted the nuclear splitting intensity to prevent incorrect identification and quantification of cells due to clumping. Individual cells were then phenotyped manually based on their staining as tumor cells (AMACR+), macrophages (CD68+), T-cells (CD3+, CTLA4+), CD47+, and CD74+. A training set was defined for the InForm algorithm of at least 30 cells for each phenotype, from which we were able to distinguish between the cell densities across all tissue types within the fields for each patient. The cells were then scored for the staining intensities of each individual marker, including co-expression across the tissue types, and threshold fluorescence value of positive staining versus background was computed for each marker by the InForm software. The data from each field were compiled to summarize the position, phenotype, and density of cells for each patient.
Data were further analyzed in R V3.6.1 (R Foundation for Statistical Computing, Vienna, Austria) using the phenoptr package. All fields for each patient sample were combined into a single data frame, with cell-by-cell annotation of classified tissue context and fluorescence intensity of all markers. The inferred fluorescence intensity thresholds were applied to define cells positive for each marker, remove cells negative for any marker, and further define double-positive cells simultaneously co-staining for marker pairs of interest above the fluorescence threshold value for each marker. For downstream analysis, the following populations were defined, counted and aggregated across all slide sections for each patient: CD3+ T-cells, CD3+/CTLA4+ T-cells, CD68+ macrophages, CD68+CD74+ macrophages, AMACR+CD74+ tumor cells, and AMACR+CD47+ tumor cells. Cell type frequencies were compared between untreated and degarelix-treated patients by Fisher’s exact test with Bonferroni multiple testing correction to aggregated cell counts across patients in each treatment group. Distance between each immune cell subset (CD3+, CD3+/CTLA4+, and CD68+) and the nearest AMACR+CD47+ and AMACR+CD74+ tumor cell was computed across all cells in all slides for each patient, and aggregated by treatment group. Distances from immune cells to tumor cell sub-types were compared by Wilcox test.
CODEX
Before initiating data analysis, quality control was performed by visual assessment across whole-slide imagery for each marker based on signal intensity, specificity, and comparison to background intensity. Nuclear (DAPI) channel-based single-cell segmentation was performed by applying Stardist [21]. The whole-cell mask was obtained through morphological dilation of 5μm in all directions until it reached another cell’s boundary. For each single-cell, the antibody expression was then defined and measured as the average of the staining intensity values within the modeled cell’s boundary for each protein, or the nuclear boundary in cases when it was only expressed in the nuclear region (e.g., FoxP3).
The raw single cell-by-protein matrix, along with the cell metadata (cell x,y centroid location), were then loaded into Python 3.7 for phenotyping. We used the Python libraries Scimap v0.18.0 and Scanpy v1.8.1 for single-cell data analysis; python-bx (https://doi.org/10.5281/zenodo.7854095, RRID:SCR_024202) [22]. For each region of interest, the raw intensity values were normalized using Scimap’s pp.rescale() function to scale each marker between 0 and 1, in a way that an expression value >0.5 in a cell was considered positive for the given protein. We then applied the Scimap’s tl.phenotype_cells() function to obtain the cell phenotypes.
Statistical analysis
All computational and statistical analysis was performed in R v3.6.1. Normalized gene expression values were compared by non-parametric Wilcox test, frequencies were compared by t-test unless indicated otherwise, cell counts by immunofluorescence were compared by Fisher’s exact test, and all comparisons were corrected for multiple hypothesis testing by Bonferroni’s method. Baseline characteristics were shown as means or medians with standard deviation and interquartile range, respectively. Comparisons were made using sample t-tests, Fisher’s exact t-test, or Mann-Whitney U tests for non-parametric data. Statistical significance was set at a p-value <0.05. All tests were two-sided.
Data availability
The human sequence data generated in this study are not publicly available due to patient privacy requirements, but are available upon reasonable request from the corresponding author. Other data generated in this study are available within the article and its supplementary data files.
Results
ADT induces rapid transcriptomic changes in the prostate cancer TME
To delineate immune changes in the prostate TME in an unbiased manner, we studied a unique cohort of radical prostatectomy (RP) specimens from patients treated on two previously completed clinical trials (NCT01696877; NCT01542021). In these trials, patients received degarelix acetate, 240mg subcutaneously for varying intervals—4 days (N=10), 7 days (N=10), and 14 days (N=8) prior to surgery, and a separate group that did not receive systemic therapy (N=29)(Figure 1A). While overall clinical characteristics between the degarelix-treated and untreated patients were similar with respect to age, grade, and stage, there were more Black (35% versus 18%) and Hispanic (45% versus 8.3%), and less lymph node involvement (14% versus 50%), in the untreated patients compared to the treated patients (Table 1). The 4-year PSA recurrence rate was also higher in the degarelix treatment group versus the untreated group (50% versus 23%). Overall, 60.1% of patients had Gleason grade group ≥4, 71.0% had pathological stage ≥T3b, and 32.0% had N1 disease on surgical pathology. Molecular profiling data were available for 22 (56.4%) patients (Figure 1B). TMPRSS2:ERG fusions were present in 32% of patients, with the most common genomic alterations in TP53 (23%) and PIK3CA (14%). 9% of patients had SPOP, FOXA1, and CTNNB1 mutations. Homologous recombination repair mutations were present in 24%, including BRCA2, ATM, and CDK12 biallelic loss. All patients exhibited microsatellite stability. One patient with an androgen receptor splice variant-7 (AR-V7) and 3 of 5 patients with TP53 mutations had disease recurrence.
Figure 1.

Schema and somatic molecular alterations. A, Schema depicting treatment and timing of degarelix administration prior to radical prostatectomy. B, Co-mutation plot with tumor mutational profiles in untreated and post-ADT samples.
Table 1.
Patient baseline demographics and disease characteristics. Clinical variables for patients treated with degarelix prior to radical prostatectomy and untreated controls.
| Variable | N | Overall N = 49 | Degarelix (ADT) N = 20 | Untreated N = 29 |
|---|---|---|---|---|
|
| ||||
| Days of ADT, n (%) | 49 | |||
| 0 | 29 (59%) | 0 (0%) | 29 (100%) | |
| 4 | 6 (12%) | 6 (30%) | 0 (0%) | |
| 7 | 6 (12%) | 6 (30%) | 0 (0%) | |
| 14 | 8 (16%) | 8 (40%) | 0 (0%) | |
| Age at Prostatectomy | 41 | |||
| Median (Range) | 63.0 (43.0, 75.0) | 63.0 (43.0, 75.0) | 64.00 (46.0, 71.0) | |
| Race, n (%) | 31 | |||
| Black | 9 (29%) | 2 (18%) | 7 (35%) | |
| Other Combinations Not Described | 4 (13%) | 0 (0%) | 4 (20%) | |
| White | 18 (58%) | 9 (82%) | 9 (45%) | |
| Ethnicity, n (%) | 32 | |||
| Hispanic or Latino | 10 (31%) | 1 (8.3%) | 9 (45%) | |
| Not Hispanic or Latino | 22 (69%) | 11 (92%) | 11 (55%) | |
| Prostatectomy PSA | 33 | |||
| Median (Range) | 7.50 (2.08, 30.37) | 7.57 (3.47, 25.52) | 7.00 (2.08, 30.37) | |
| Prostate Biopsy Grade Group, n (%) | 33 | |||
| 1 | 2 (6.1%) | 0 (0%) | 2 (9.5%) | |
| 2 | 11 (33%) | 3 (25%) | 8 (38%) | |
| 3 | 9 (27%) | 3 (25%) | 6 (29%) | |
| 4 | 2 (6.1%) | 1 (8.3%) | 1 (4.8%) | |
| 5 | 9 (27%) | 5 (42%) | 4 (19%) | |
| T Stage, n (%) | 41 | |||
| T2 | 12 (29%) | 4 (20%) | 8 (38%) | |
| T3 | 21 (51%) | 12 (60%) | 9 (43%) | |
| T4 | 8 (20%) | 4 (20%) | 4 (19%) | |
| Surgical Margin Involvement, n (%) | 41 | 12 (29%) | 7 (35%) | 5 (24%) |
| Nodal Involvement, n (%) | 41 | 13 (32%) | 10 (50%) | 3 (14%) |
| PSA Recurrence, n (%) | 41 | 16 (39%) | 12 (60%) | 4 (19%) |
| PSA Recurrence at 2 years, n (%) | 34 | 12 (35%) | 10 (56%) | 2 (13%) |
| PSA Recurrence at 4 years, n (%) | 23 | 8 (35%) | 5 (50%) | 3 (23%) |
| Time Recurrence free | 41 | |||
| Median (Range) | 2.04 (0.10, 8.60) | 1.63 (0.10, 8.60) | 2.70 (0.76, 5.29) | |
To assess the transcriptomic changes following short-term degarelix treatment, whole transcriptome sequencing was performed. Twenty of 28 (71.4%) of the degarelix-treated cases and 25 of the 35 (71.4%) untreated cases had adequate RNA quantity and quality for analysis following extraction and sequencing. Following batch correction, principal component analyses showed that transcriptomic profiles generally clustered between treated and untreated samples, indicating sample integrity, although there was heterogeneity within the degarelix treatment groups (Supplemental Figure S1A-B). Comparative analysis revealed that the majority of the differentially expressed genes were upregulated post-ADT, including genes related to immune function (Supplemental Figure S1C-D). Notably, these changes were detectable as early as 4 days following degarelix with some variation at the subsequent timepoints, consistent with an evolving transcriptomic landscape. As expected, we also observed downregulation of established androgen-regulated genes across all timepoints compared to untreated controls (Supplemental Figure S2A-E)[23, 24].
Further assessment of differentially expressed genes for their association with particular biological processes and molecular pathways using unbiased Gene Ontology (GO) enrichment analysis surprisingly revealed significant enrichment of immune-related pathways following ADT (Figure 2A)(Supplemental Figure S3). The broad-based response encompassed immune pathways involved in regulation of the innate immune responses, leukocyte activation/degranulation, and immune effector processes. Overall, 28% of the untreated tumors demonstrated this activated immune response signature compared to 65% of degarelix-treated tumors, which was consistent across different degarelix administration timepoints Supplemental Figure S4. The heterogeneity of baseline immune activation is consistent with findings from other groups suggesting a subset of prostate cancers with a more inflamed phenotype [25]. Notably, there was no difference in proliferation or apoptosis by Ki67 and cleaved caspase-3 staining before or after degarelix, supporting the hypothesis that ADT induces immune infiltration rather than reflecting reduced viable tumor cells (Supplemental Table S1).
Figure 2.

Transcriptomic changes following ADT in primary prostate tumors over time show enrichment of immune-related pathways. A, Hierarchical plot of enriched Gene Ontology (GO) processes in degarelix-treated vs untreated patients by log-fold-change ranked gene set enrichment. Image is thresholded to GO sets with enrichment p-value <10e-9. Lines depict relationships between pathways in the GO plot. B, Heatmap of differential expression of immune-related genes by functional group in degarelix treated and untreated specimens. Timing of degarelix administration also depicted with untreated (red) and degarelix treatment either 4 days (green), 7 days (blue), or 14 days (purple) prior to radical prostatectomy. C, Boxplots of normalized T cell gene expression (CD8, CD4), macrophage gene expression (CD68, CD163), immune checkpoint gene expression (CTLA4, PDCD1), antigen presentation gene expression including MHC Class I (B2M) and II (CD74) by treatment group. Statistical comparisons were performed by t-test with Bonferroni multiple-testing correction, such that * indicates p<0.05, ** indicates p<0.01, and *** indicates p<0.005. D, Tumor Inflammation Score (TIS) by treatment group. E, Boxplots of CIBERSORT-inferred Total Immune Cell Infiltrate by treatment group. P-values were obtained by t-test, where ** indicates p<0.01.
ADT is associated with upregulation of a complex immunological signature
To dissect the immune effects of ADT, we initially focused on a curated list of canonical immune transcripts organized by functional group, revealing a notable increase across diverse immune activation pathways as early as 4 days post-ADT (Figure 2B). Specifically, there was a significant increase in T cell (CD4, CD8), macrophage (CD68, CD163), immune-checkpoint (CTLA-4, pdcl1), and antigen-presentation transcripts, with both MHC Class I (B2M, HLA-A, HLA-B, HLA-C) and MHC Class II (CD74, HLA-DR, HLA-DQ, HLA-DP, HLA-DM) pathways (Figure 2C). Consistent with our global transcriptomic analysis, none of these immune genes were significantly downregulated post-ADT, although there was a trend towards decreased expression of CD47, the canonical “don’t-eat-me” signal to macrophages (Supplemental Figure S5A). When comparing 14 versus 4 or 7 days of ADT, there were only modest differences in immune gene expression (Supplemental Figure S5B).
Next, we applied a previously validated immune signature, the 18-gene Tumor Inflammation Score (TIS), which captures T-cell inflamed phenotypes and where high expression correlates with response to immune checkpoint blockade across multiple tumor types. We found an increase in TIS post-ADT, with the greatest increase observed at 14 days (Figure 2D)[26, 27]. To deconvolute the relative abundance of immune cell subtypes, we utilized the cell-type identification by estimating relative subsets of RNA transcripts (CIBERSORT) algorithm [28]. Initially, we compared the overall immune infiltrate, calculated by summing the abundance of each cell type, between the treatment groups. This showed a progressive increase in immune infiltrate by ADT over time (Figure 2E). Further analysis revealed distinct changes in immune cell subset fractions between the treatment groups, with ADT significantly increasing CD4 memory T-cells, monocytes, macrophages, dendritic cells and eosinophils within the prostate TME (Supplemental Figure S5C). A limitation of this deconvolution approach was the poor discrimination of several immune subsets. However, overall, we observed that ADT progressively results in a more immunologically active phenotype within the first days to weeks.
Deep spatial phenotyping demonstrates ADT-induced immune activation in tumor and immune cells in the prostate TME
To validate the transcriptomic changes at the protein level, we first performed multiplexed immunofluorescence using a 7-marker panel on a subset of post-ADT and untreated prostate cancer specimens. Based on tissue availability, we analyzed 18 cases (6 untreated and 12 post-ADT, of which 6 were 4 days and 6 were 7 days post-ADT). Additional tissue from the 14-day cohort was unavailable for this analysis. Tumor cells were identified by staining for Alpha-methylacyl-CoA Racemase (AMACR), a well-established prostate tumor marker [29]. Immune cells profiled included T-cells (CD3, CTLA-4) and macrophages (CD68). We assessed CD74 expression, a component of MHC-II and the receptor for macrophage migration inhibitory factor (MIF) as well as the “don’t eat me” signal, CD47, based on our transcriptional analyses.
A composite staining panel is illustrated in Figure 3A, with representative pairwise staining of untreated and post-ADT samples in Figure 3B. These data were generally consistent with our transcriptomic data. For example, at the protein level, both CD3+ and CD3+CTLA-4+ cells were significantly more abundant in the post-ADT prostate TME and there was a trend towards increased macrophages (CD68+ cells)(Figure 3C). Interestingly, the immune phenotype of prostate tumor cells was also modulated by ADT, with increased CD74+ cells and a significant decrease in CD47 tumor cell expression. When comparing the spatial proximity of these cell types in the TME post-ADT, although CD3+ cells were not closer to tumor cells post-ADT, the subset of CD3+CTLA-4+ cells demonstrated increased proximity to tumor cells (Supplemental Figure S6A). Moreover, both CD3+ and CD3+CTLA-4+ T-cells exhibited closer proximity to CD68+ macrophages and AMACR+CD74+ and AMACR+CD47+ tumor cells showed closer proximity to CD68+ macrophages post-ADT (Supplemental Figure S6B-C).
Figure 3.
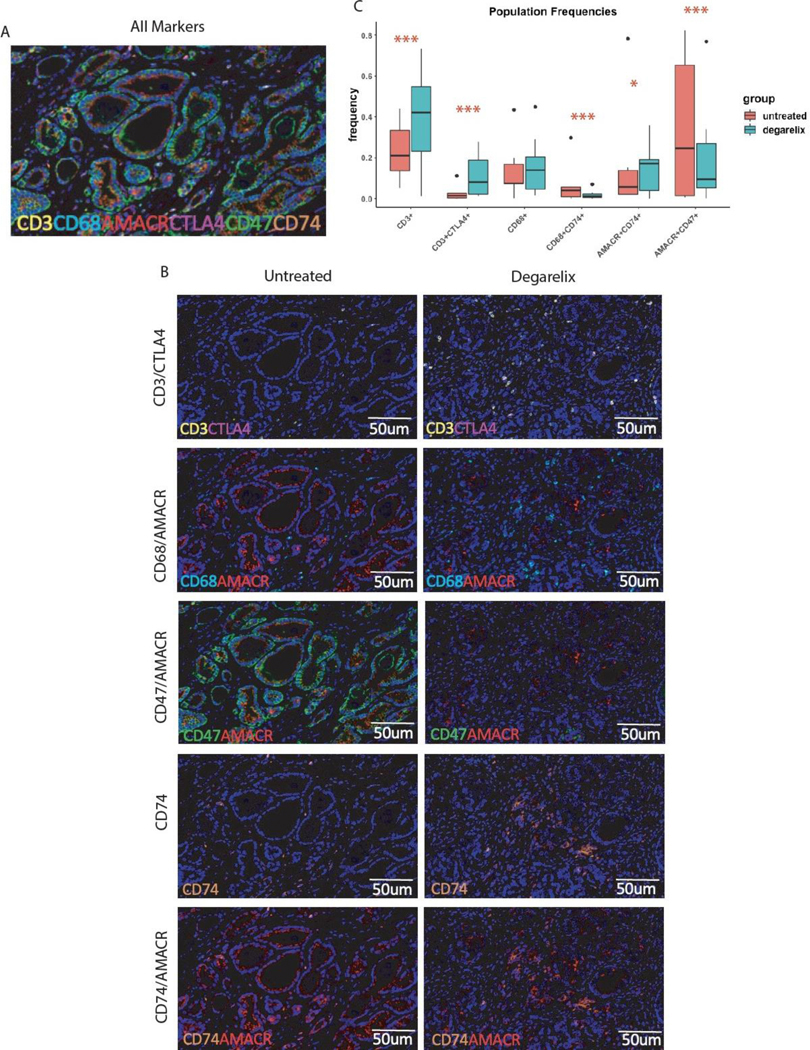
ADT increases MHC Class II and decreases CD47+ expression on tumor cells with a concurrent increase in the immune cell infiltrate. A, Representative multiplexed immunofluorescence image for markers of interest including AMACR (red), CD3 (yellow), CD68 (cyan), CTLA-4 (magenta), CD47 (green), CD74 (orange). B, Side-by-side comparison of representative images from untreated (red) versus degarelix-treated patients (blue). C, Boxplots of immunofluorescent cell count frequencies between treatment groups, showing treatment-induced increase in frequency of CD3+ T-cells, CD3+/CTLA4+ T-cells, and AMACR+/CD74+ tumor cells, along with decrease in AMACR+CD47+ tumor cells and CD68+CD74+ macrophages. Count frequencies for each cell type between treatment groups was assessed by Fisher’s exact test with Bonferroni multiple-testing correction, such that * indicates p<0.05 and *** indicates p<0.005
To more comprehensively characterize changes within the lymphoid and myeloid compartments, we employed an expanded multiplexed panel using the CODEX platform which can simultaneously detect >30 markers of interest and therefore allows more extensive cellular phenotyping. Figure 4A shows a representative image with marker expression and cell phenotyping as well as normalized mean expression of markers per cell type. We observed a significant increase in T-cells with ADT and a trend towards increase in overall macrophage infiltration (Figure 4B). Within the T cell compartment, ADT led to an increase in both CD4+ and CD8+ T-cells, including activated CD8 T-cells (CD8+GranzymeB+)(Figure 4C-D). While conventional CD4 T-cells increased, there was also an expansion of Tregs (CD4+FoxP3+) (Figure 4D). Importantly, ADT appeared to increase macrophages, with a relative increase in M1-like (CD68+CD163-CD206-) TAMs and no difference in M2-like (CD68+CD163+CD206+) TAMs (Figure 4E). Furthermore, tumor cells exhibited upregulation of both MHC I (HLA-A+) and MHC II (HLA-DR+) post-ADT consistent with our transcriptomic analysis (Figure 4F).
Figure 4.
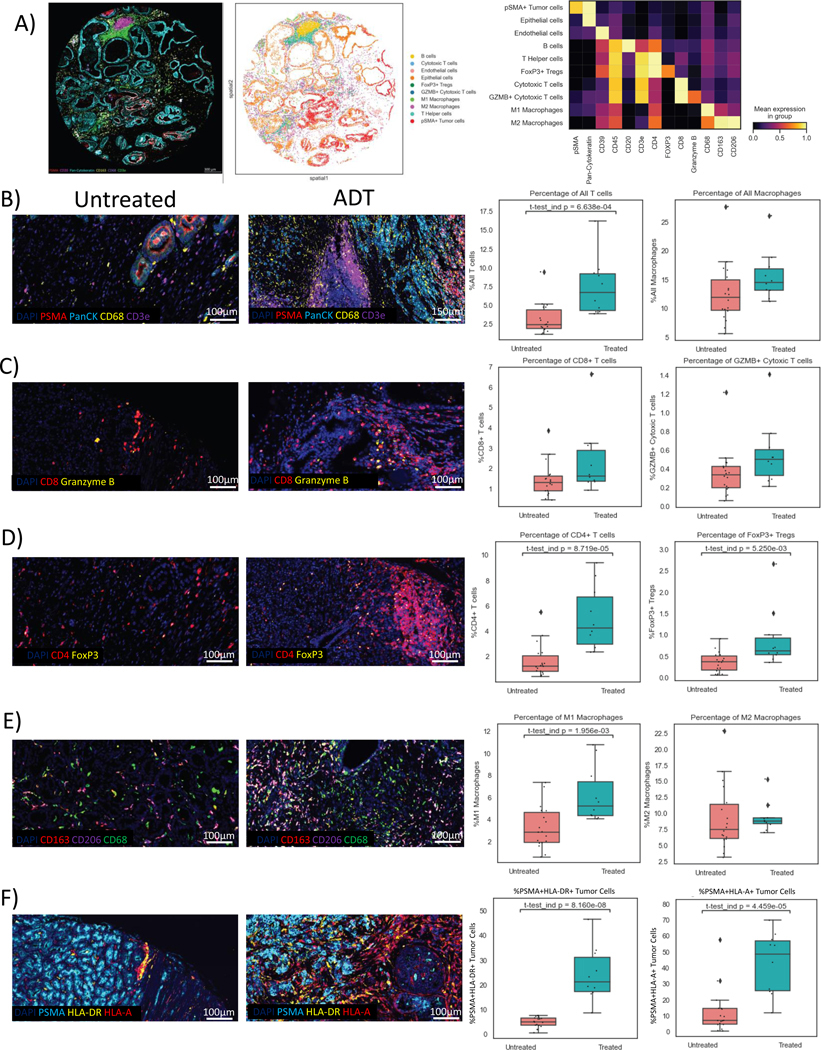
ADT induces a robust T cell and pro-inflammatory macrophage infiltrate with upregulation of antigen-presenting machinery. A, Composite sample image by CODEX showing marker expression including PSMA (red), pan-cytokeratin (cyan), CD163 (yellow), CD68 (grey), and CD3e (green); cell phenotyping including B-cells, cytotoxic T-cells, endothelial cells, epithelial cells, Tregs, activated cytotoxic T-cells, M1 and M2 macrophages, T helper cells, and tumor cells, with heatmap showing mean marker expression per cell type. Representative images in treated and untreated samples with boxplots shown for B, Overall T-cells (CD3e) and macrophages (CD68+), C, CD8 T-cells (CD8+) and activated CD8 T-cells (GranzymeB+CD8+), D, CD4 T-cells (CD4+), Tregs (CD4+FoxP3+), E, M1-like macrophages (CD68+CD163-CD206-) and M2-like macrophages (CD68+CD163+CD206+) and F, tumor cell expression of MHC-I (PSMA+HLA-A+) and MHC-II (PSMA+HLA-DR+).
Discussion
Our findings show that ADT rapidly induces tumor-intrinsic changes including upregulation of the antigen-presenting machinery and downregulation of the macrophage “don’t-eat-me” signal, which may facilitate induction of immunogenic cell death and immune priming needed to drive the complex immune infiltrate within the prostate TME that develops post-ADT.
Here, using first unbiased transcriptional profiling, we show that ADT profoundly and rapidly stimulates an immune response in localized prostate cancers. This remodeling occurs early and involves a broad-based immunological response, which creates a more active immune phenotype. Although there was heterogeneity in the range of the immune response in individual tumors, almost all demonstrated a degree of immune activation relative to untreated prostate cancers. Specifically, ADT increased expression markers of T-cells, Tregs, and macrophages, showing that ADT modulates diverse immune functions. Also notable was an enrichment of a T-cell inflamed gene expression profile which has previously been shown to correlate with immune checkpoint blockade response in other tumor types [27, 30]. Deconvolution of the immune cell subsets demonstrated an increase in the total immune cell infiltrate that was maximal at 14 days post-ADT, which consisted of a diverse assortment of CD4 memory T-cells, monocytes, macrophages, dendritic cells and eosinophils. Additionally, there was a notable increase in the antigen-presentation machinery with upregulation of MHC class I and II genes post-ADT, which has not been previously described. ADT also increased the expression of immune checkpoint genes, which could represent adaptive immune resistance. CD74, one of the most significantly upregulated genes, was particularly interesting given it has multiple functions relevant to activating a successful immune response including serving as the invariant chain of MHC II as well as the receptor for MIF, an important mediator of the senescence-associated secretory program (SASP). Concurrent with these changes, we also observed downregulation of CD47, which may inhibit tumor-cell phagocytosis and is an emerging therapeutic target.
To validate these findings at the protein level we used multiplexed spatial phenotyping. We showed that ADT increases tumor CD8 and CD4 T-cell infiltration after ADT, which included activated granzyme B-producing cytotoxic T-cells as well as suppressive Tregs. There was an overall trend towards increased macrophage infiltration post-ADT, with further phenotyping showing that while pro-inflammatory M1-like macrophages increased, there was no significant expansion of suppressive M2-like macrophages, suggesting that the overall effects of ADT on the myeloid compartment are pro-inflammatory. Somewhat surprisingly, we found increased CD74 expression primarily on tumor cells, suggesting that ADT might promote activation of MHC II antigen-presenting machinery. This novel finding supports pre-clinical observations that prostate cancer cell-specific expression of MHC class II proteins can present tumor-associated antigens to CD4+ T-cells and facilitate immune recognition [31, 32]. In other tumor types, tsMHC-II has been associated with better prognosis and greater response to immune checkpoint blockade[33, 34]. To investigate this further, we evaluated both MHC I and MHC II expression on tumor cells and found that both were significantly upregulated post-ADT. It is possible that AR is an upstream negative regulator of antigen-presentation machinery genes in tumor cells but future mechanistic studies will be needed to further evaluate this hypothesis. Tumor cells also demonstrated decreased expression of CD47, a finding consistent with our transcriptomic data. The role of this down-regulation is unknown but suggests that it facilitates phagocytosis of tumor cells by nearby macrophages which may ultimately facilitate T cell priming. Interestingly, ATR-mediated CD47 upregulation following radiation has previously been shown to restrict an abscopal effect[35]. In contrast, ADT can inhibit ATR signaling which may explain the downregulation we observed. Although speculative, this may represent an alternative mechanism for ADT plus radiation synergy that warrants further investigation. Taken together, the results broadly support the notion that an active immune TME rapidly develops post-ADT and therefore might be more susceptible to immunotherapy in the early castration period.
Our results build on prior work suggesting that ADT has important immunologic effects, beginning with pre-clinical studies in murine models showing that ADT promotes immune-priming with presentation of prostate tumor antigens in draining lymph nodes that transiently induces a complex immune infiltrate [36]. In addition, the androgen receptor (AR) has been shown to be a negative regulator of interleukin-8 (IL-8), a key component of SASP, which facilitates myeloid cell recruitment to the TME [37]. Similar results were found in the metastatic setting, where ADT results in the expansion of the myeloid compartment, although this appears to vary by site of disease [12]. In human primary prostate cancer tissue, ADT also appears to modulate the immune TME. In a prior study of primary prostate cancers in men treated with variable formulations and schedules of ADT, there was an increase in multiple immune cell subsets by conventional immunohistochemistry [38, 39]. Another study showed that after a short course of ADT (7–28 days), involution of malignant prostate glands was associated with mononuclear cell infiltration [40]. We previously showed that neoadjuvant ADT increases both CD8+ T-cells and immunosuppressive Tregs, suggesting that Tregs dampen anti-tumor immune responses following androgen ablation [14]. While prior studies have established that ADT modulates immune responses in prostate cancer, understanding of how early these changes occur and a more detailed characterization of immune phenotypes using more modern sequencing and multiplexed approaches is limited. Here we report the analysis of the entire transcriptome following ADT and demonstrate novel immunologic changes not previously described.
A limitation of this study is its small sample size and some differences in clinical characteristics (more black patients, fewer grade group 5 tumors and a lower rate of biochemical relapse in the untreated group) and outcomes between the treatment groups that could potentially contribute to differences in the immune phenotypes we observed. While our study demonstrates that ADT with degarelix induces rapid and robust immune infiltrate in the TME, the duration of this effect on immunogenicity is unknown, as the longest ADT exposure was 14 days. Cohorts following longer exposures to ADT are needed to determine the duration of the immunologic effects. Similarly, our cohort size was too small to study the association between the immunologic changes and clinical outcomes. However, we believe our preliminary data support efforts to incorporate biomarkers of immunologic response as part of larger ongoing studies of neoadjuvant ADT in prostate cancer to further assess the clinical relevance of these findings. Degarelix decreases testosterone levels to a castrate range in days; it is unknown whether similar effects occur following GnRH agonists that result in an initial testosterone surge prior to reaching castrate levels, or anti-androgens that block testosterone by binding to the AR, CYP-17 inhibitors that decrease androgen synthesis, or combination regimens that maximize androgen suppression. Although our use of multiplexed immunofluorescence allowed us to simultaneously interrogate the effects of therapy on multiple markers of interest, further cellular phenotyping was limited by tissue quantity, particularly in the 14-day cohort. While we observed changes in the proximity between tumor and immune cells and several studies have shown that spatial relationships may improve the predictive value over single marker IHC in the context of immunotherapy, further work will be needed to assess the clinical significance of these findings [41–43] While we did not observe differences in tumor cell frequency between the treatment groups, we cannot rule out the possibility that immunogenic cell death, necrosis, or necroptosis could also be contributing factors. Lastly, while our study shows that ADT is associated with a robust immune cell infiltrate, mechanistic studies are needed to establish the functional significance of these observations on anti-tumor immunity.
Our study has important implications for the development of prostate cancer immunotherapy. First, the robust and rapid immune infiltrate seen within days of ADT in primary prostate tumors supports the peri-castration period as potentially optimal for immunologic intervention. Most of the reported immune checkpoint blockade monotherapy studies have shown limited-to-no efficacy. However, the majority were focused on castration-resistant disease, when an immunosuppressive TME predominates [1, 44–47]. Importantly, adding pembrolizumab to ADT plus enzalutamide in metastatic castration-sensitive disease was also recently reported to show no benefit, suggesting other immune targets beyond PD-1 are needed [48]. However, whether the local versus metastatic niche is more sensitive to immunologic intervention remains poorly understood. Evaluating whether the immunologic changes in the TME following ADT also correlate with modulation of a systemic immune response will be important to understanding the full impact of ADT on host immunity and, potentially, the development of more feasible circulating biomarkers. It is also possible that an intermittent course of ADT may be more effective than continuous therapy at eliciting an anti-tumor immune response and that combining ADT with other established therapies like radiation may be particularly important to activation of a successful anti-tumor immune response. Additional studies are ongoing to evaluate immunotherapy in early disease and leverage the immunologic effects of ADT [49–51].
We also found several novel immune pathways were modulated by ADT. These include the induction of MHC-I and tumor-cell intrinsic MHC-II (tsMHC-II) expression, which may represent important mechanisms of TH1 polarization and enhanced immunogenicity [52]. Post-ADT tumor cells demonstrated decreased expression of CD47, the principal and tumor specific immune checkpoint of macrophage-mediated phagocytosis [53]. Importantly, CD47 therapeutics are rapidly moving forward in clinical development based on the fundamental role of CD47 in cross-priming and immune activation [54]. Combining ADT with other agents that activate antigen-presenting cells or tumor-infiltrating lymphocytes may be a promising approach.
Taken together, the unbiased transcriptomic and protein-level analyses show that many post-ADT changes involve components of the immune system. Our findings suggest that ADT may directly change the prostate tumor cellular phenotype resulting in enhanced antigen-presentation and immune priming required to elicit a robust anti-tumor immune response and overcome primary immune resistance. Based on these findings, we hypothesize that the peri-castration period is potentially ideal to study prostate cancer immunotherapy, and combined immune-hormonal therapies is a promising approach that warrants further investigation in future clinical studies.
Supplementary Material
Translational Relevance:
Prior studies demonstrate that androgen deprivation therapy (ADT) initiates important changes within the prostate immune tumor microenvironment. However, understanding of how quickly these changes occur—which is critical to the development of immunotherapy for prostate cancer—is limited. To address this, we profiled the immune changes in prostatectomy specimens removed at distinct timepoints following ADT collected as part of previously completed neoadjuvant trials. We assessed the expression patterns of key immunologic markers to identify potential therapeutic targets, and found that ADT transforms prostate cancers to a more immunologically active phenotype within days. This immune infiltrate was complex, with an increase in activated cytotoxic T-cells, M1-like macrophages, and suppressive T-cells (Tregs). We also identified novel tumor cell intrinsic changes including upregulation of MHC Class I and II and downregulation of CD47, the “don’t-eat-me” signal to macrophages post-ADT. These findings provide crucial insights into the optimization of prostate cancer immunotherapy.
Acknowledgements
This study was supported by the Prostate Cancer Foundation Grant No. 19YOUN27 (M. Dallos) and the Weill Cornell Medicine SPORE Developmental Research Program Grant No. 1P50CA211024-01A1 (P50) (M. Dallos; C. Drake), Memorial Sloan Kettering Cancer Center NIH SPORE Grant No. P50-CA92629 (D. Rathkopf; H. Scher), Memorial Sloan Kettering Cancer Center NIH/NCI Cancer Center Support Grant No. P30 CA008748 (D. Rathkopf; H. Scher), Johns Hopkins NIH SPORE Grant No. P50-CA58236 (C. Drake; E. Antonarakis; A. De Marzo), Johns Hopkins NIH/NCI Cancer Center Support Grant No. P30 CA0006973 (C. Drake; E. Antonarakis; A. De Marzo), and U.S. Department of Defense Prostate Cancer Research Program (PCRP) Prostate Cancer Biospecimen Network Site Grant No. W81XWH-18-2-0015 (A. De Marzo).
Conflict of Interest Statement:
This study was supported by the Prostate Cancer Foundation Grant No. 19YOUN27 and the Weill Cornell Medicine SPORE Developmental Research Program Grant No. 1P50CA211024-01A1 (P50), Memorial Sloan Kettering Cancer Center NIH SPORE Grant No. P50-CA92629, Memorial Sloan Kettering Cancer Center NIH/NCI Cancer Center Support Grant No. P30 CA008748, Johns Hopkins NIH SPORE Grant No. P50-CA58236, Johns Hopkins NIH/NCI Cancer Center Support Grant No. P30 CA0006973, and U.S. Department of Defense Prostate Cancer Research Program (PCRP) Prostate Cancer Biospecimen Network Site Grant No. W81XWH-18-2-0015.
M.C. Dallos serves as a paid consultant for Bayer, Bristol-Myers Squibb, and Sanofi outside the submitted work, and has received research funding from Bristol-Myers Squibb and Novartis. D.H. Aggen reports other from Boehringer Ingelheim outside the submitted work, as well as a University of Illinois-issued patent, licensed, and with royalties paid from AbbVie. K. A. Autio reports grants from Merck Sharp & Dohme Corp., a subsidiary of Merck & Co Inc., Kenilworth, NJ, USA, GSK, Pfizer, Eli Lilly, Amgen, and AstraZeneca. A.M. De Marzo serves as consultant for Cepheid Inc., receives sponsored research funding from Janssen R&D Inc., and serves as a consultant to Merck Inc. E.S. Antonarakis reports grants from Janssen, Johnson & Johnson, Sanofi, Bristol Myers Squibb, Pfizer, AstraZeneca, Novartis, Curium, Constellation, ESSA, Celgene, Merck, Bayer, and Clovis; personal fees from Janssen, Astellas, Sanofi, Dendreon, Bayer, Bristol Myers Squibb, Amgen, ESSA, Constellation, Blue Earth, Exact Sciences, Invitae, Curium, Pfizer, Merck, AstraZeneca, Clovis, and Eli Lilly; and is a co-inventor of patented AR-V7 technology that has been licensed to Qiagen. H.I. Scher reports personal fees from Asterias Biotherapeutics, Bayer, Pfizer Inc., Sun Pharmaceuticals Industries Inc., and WCG; non-financial support from Amgen, ESSA Pharma Inc., Janssen Research & Development LLC, Janssen Biotech Inc., and Menarini Silicon Biosystems; and grants from Epic Sciences, Illumina Inc., Janssen, Menarini Silicon Biosystems, and Thermo Fisher Scientific outside the submitted work; in addition, H.I. Scher has a patent 10,736,972 issued and licensed to Elucida Oncology, a patent for 16/463,865 pending and licensed to Elucida Oncology, and a patent for 16/769,501 pending and licensed to Elucida Oncology. C.G. Drake is an employee of Janssen Oncology. D.E. Rathkopf reports non-financial support from Janssen (uncompensated consultant, PI clinical trials), grants from Genentech (Stand Up to Cancer-Genentech Catalyst Research Award), and non-financial support from Taiho (PI, clinical trial), Tracon (PI, clinical trial), Myovant (uncompensated consultant), Bayer (uncompensated consultant), AstraZeneca (uncompensated consultant), Celgene (PI, clinical trial), Phosplatin Therapeutics (PI, clinical trial), and Roivant (uncompensated consultant). No disclosures were reported by the other authors.
References
- 1.Sharma P, Pachynski RK, Narayan V, Flechon A, Gravis G, Galsky MD et al. Initial results from a phase II study of nivolumab (NIVO) plus ipilimumab (IPI) for the treatment of metastatic castration-resistant prostate cancer (mCRPC; CheckMate 650). Journal of Clinical Oncology 2019; 37: 142–142. [Google Scholar]
- 2.Fizazi K, Drake CG, Beer TM, Kwon ED, Scher HI, Gerritsen WR et al. Final Analysis of the Ipilimumab Versus Placebo Following Radiotherapy Phase III Trial in Postdocetaxel Metastatic Castration-resistant Prostate Cancer Identifies an Excess of Long-term Survivors. Eur Urol 2020; 78: 822–830. [DOI] [PMC free article] [PubMed] [Google Scholar]
- 3.Zhao SG, Lehrer J, Chang SL, Das R, Erho N, Liu Y et al. The Immune Landscape of Prostate Cancer and Nomination of PD-L2 as a Potential Therapeutic Target. J Natl Cancer Inst 2019; 111: 301–310. [DOI] [PubMed] [Google Scholar]
- 4.Chen PL, Roh W, Reuben A, Cooper ZA, Spencer CN, Prieto PA et al. Analysis of Immune Signatures in Longitudinal Tumor Samples Yields Insight into Biomarkers of Response and Mechanisms of Resistance to Immune Checkpoint Blockade. Cancer Discov 2016; 6: 827–837. [DOI] [PMC free article] [PubMed] [Google Scholar]
- 5.Teng MW, Ngiow SF, Ribas A, Smyth MJ. Classifying Cancers Based on T-cell Infiltration and PD-L1. Cancer Res 2015; 75: 2139–2145. [DOI] [PMC free article] [PubMed] [Google Scholar]
- 6.Brusa D, Simone M, Gontero P, Spadi R, Racca P, Micari J et al. Circulating immunosuppressive cells of prostate cancer patients before and after radical prostatectomy: profile comparison. Int J Urol 2013; 20: 971–978. [DOI] [PubMed] [Google Scholar]
- 7.Drake CG. Prostate cancer as a model for tumour immunotherapy. Nat Rev Immunol 2010; 10: 580–593. [DOI] [PMC free article] [PubMed] [Google Scholar]
- 8.Sanda MG, Restifo NP, Walsh JC, Kawakami Y, Nelson WG, Pardoll DM et al. Molecular characterization of defective antigen processing in human prostate cancer. J Natl Cancer Inst 1995; 87: 280–285. [DOI] [PMC free article] [PubMed] [Google Scholar]
- 9.Isaacs JT, Lundmo PI, Berges R, Martikainen P, Kyprianou N, English HF. Androgen regulation of programmed death of normal and malignant prostatic cells. J Androl 1992; 13: 457–464. [PubMed] [Google Scholar]
- 10.Ben-Batalla I, Vargas-Delgado ME, von Amsberg G, Janning M, Loges S. Influence of Androgens on Immunity to Self and Foreign: Effects on Immunity and Cancer. Front Immunol 2020; 11: 1184. [DOI] [PMC free article] [PubMed] [Google Scholar]
- 11.Gannon PO, Poisson AO, Delvoye N, Lapointe R, Mes-Masson A-M, Saad F. Characterization of the intra-prostatic immune cell infiltration in androgen-deprived prostate cancer patients. Journal of Immunological Methods 2009; 348: 9–17. [DOI] [PubMed] [Google Scholar]
- 12.Hawley JE, Obradovic AZ, Dallos MC, Lim EA, Runcie K, Ager CR et al. Anti-PD-1 immunotherapy with androgen deprivation therapy induces robust immune infiltration in metastatic castration-sensitive prostate cancer. Cancer Cell 2023; 41: 1972–1988.e1975. [DOI] [PMC free article] [PubMed] [Google Scholar]
- 13.Shen YC, Ghasemzadeh A, Kochel CM, Nirschl TR, Francica BJ, Lopez-Bujanda ZA et al. Combining intratumoral Treg depletion with androgen deprivation therapy (ADT): preclinical activity in the Myc-CaP model. Prostate Cancer Prostatic Dis 2018; 21: 113–125. [DOI] [PMC free article] [PubMed] [Google Scholar]
- 14.Obradovic AZ, Dallos MC, Zahurak ML, Partin AW, Schaeffer EM, Ross AE et al. T-Cell Infiltration and Adaptive Treg Resistance in Response to Androgen Deprivation With or Without Vaccination in Localized Prostate Cancer. Clin Cancer Res 2020; 26: 3182–3192. [DOI] [PMC free article] [PubMed] [Google Scholar]
- 15.Klotz L, Boccon-Gibod L, Shore ND, Andreou C, Persson BE, Cantor P et al. The efficacy and safety of degarelix: a 12-month, comparative, randomized, open-label, parallel-group phase III study in patients with prostate cancer. BJU Int 2008; 102: 1531–1538. [DOI] [PubMed] [Google Scholar]
- 16.Zehir A, Benayed R, Shah RH, Syed A, Middha S, Kim HR et al. Mutational landscape of metastatic cancer revealed from prospective clinical sequencing of 10,000 patients. Nature Medicine 2017; 23: 703–713. [DOI] [PMC free article] [PubMed] [Google Scholar]
- 17.Sireci AN, Aggarwal VS, Turk AT, Gindin T, Mansukhani MM, Hsiao SJ. Clinical Genomic Profiling of a Diverse Array of Oncology Specimens at a Large Academic Cancer Center: Identification of Targetable Variants and Experience with Reimbursement. J Mol Diagn 2017; 19: 277–287. [DOI] [PubMed] [Google Scholar]
- 18.Eden E, Navon R, Steinfeld I, Lipson D, Yakhini Z. GOrilla: a tool for discovery and visualization of enriched GO terms in ranked gene lists. BMC Bioinformatics 2009; 10: 48. [DOI] [PMC free article] [PubMed] [Google Scholar]
- 19.Chen B, Khodadoust MS, Liu CL, Newman AM, Alizadeh AA. Profiling Tumor Infiltrating Immune Cells with CIBERSORT. Methods in molecular biology (Clifton, NJ) 2018; 1711: 243–259. [DOI] [PMC free article] [PubMed] [Google Scholar]
- 20.Gartrell RD, Marks DK, Hart TD, Li G, Davari DR, Wu A et al. Quantitative Analysis of Immune Infiltrates in Primary Melanoma. Cancer Immunol Res 2018; 6: 481–493. [DOI] [PMC free article] [PubMed] [Google Scholar]
- 21.Schmidt U, Weigert M, Broaddus C, Myers G. Cell Detection with Star-Convex Polygons. In: Frangi AF, Schnabel JA, Davatzikos C, Alberola-López C, Fichtinger G (eds). Medical Image Computing and Computer Assisted Intervention – MICCAI 2018. Springer International Publishing: Cham, 2018, pp 265–273. [Google Scholar]
- 22.Wolf FA, Angerer P, Theis FJ. SCANPY: large-scale single-cell gene expression data analysis. Genome Biology 2018; 19: 15. [DOI] [PMC free article] [PubMed] [Google Scholar]
- 23.Vaarala MH, Hirvikoski P, Kauppila S, Paavonen TK. Identification of androgen-regulated genes in human prostate. Mol Med Rep 2012; 6: 466–472. [DOI] [PMC free article] [PubMed] [Google Scholar]
- 24.Yin Y, Liu Q, Shao Y, He X, Zhu Q, Lu S et al. Regulatory mechanism of androgen receptor on NCAPD3 gene expression in prostate cancer. Prostate 2022; 82: 26–40. [DOI] [PubMed] [Google Scholar]
- 25.Calagua C, Ficial M, Jansen CS, Hirz T, Del Balzo L, Wilkinson S et al. A Subset of Localized Prostate Cancer Displays an Immunogenic Phenotype Associated with Losses of Key Tumor Suppressor Genes. Clin Cancer Res 2021; 27: 4836–4847. [DOI] [PMC free article] [PubMed] [Google Scholar]
- 26.Ayers M, Lunceford J, Nebozhyn M, Murphy E, Loboda A, Kaufman DR et al. IFN-gamma-related mRNA profile predicts clinical response to PD-1 blockade. J Clin Invest 2017; 127: 2930–2940. [DOI] [PMC free article] [PubMed] [Google Scholar]
- 27.Danaher P, Warren S, Lu R, Samayoa J, Sullivan A, Pekker I et al. Pan-cancer adaptive immune resistance as defined by the Tumor Inflammation Signature (TIS): results from The Cancer Genome Atlas (TCGA). J Immunother Cancer 2018; 6: 63. [DOI] [PMC free article] [PubMed] [Google Scholar]
- 28.Newman AM, Liu CL, Green MR, Gentles AJ, Feng W, Xu Y et al. Robust enumeration of cell subsets from tissue expression profiles. Nat Methods 2015; 12: 453–457. [DOI] [PMC free article] [PubMed] [Google Scholar]
- 29.Epstein JI, Egevad L, Humphrey PA, Montironi R, Members of the IIiDUPG. Best practices recommendations in the application of immunohistochemistry in the prostate: report from the International Society of Urologic Pathology consensus conference. Am J Surg Pathol 2014; 38: e6–e19. [DOI] [PubMed] [Google Scholar]
- 30.Ayers M, Lunceford J, Nebozhyn M, Murphy E, Loboda A, Kaufman DR et al. IFN-γ-related mRNA profile predicts clinical response to PD-1 blockade. J Clin Invest 2017; 127: 2930–2940. [DOI] [PMC free article] [PubMed] [Google Scholar]
- 31.Stumptner-Cuvelette P, Benaroch P. Multiple roles of the invariant chain in MHC class II function. Biochim Biophys Acta 2002; 1542: 1–13. [DOI] [PubMed] [Google Scholar]
- 32.Younger AR, Amria S, Jeffrey WA, Mahdy AE, Goldstein OG, Norris JS et al. HLA class II antigen presentation by prostate cancer cells. Prostate Cancer Prostatic Dis 2008; 11: 334–341. [DOI] [PubMed] [Google Scholar]
- 33.Forero A, Li Y, Chen D, Grizzle WE, Updike KL, Merz ND et al. Expression of the MHC Class II Pathway in Triple-Negative Breast Cancer Tumor Cells Is Associated with a Good Prognosis and Infiltrating Lymphocytes. Cancer Immunol Res 2016; 4: 390–399. [DOI] [PMC free article] [PubMed] [Google Scholar]
- 34.Mortara L, Castellani P, Meazza R, Tosi G, De Lerma Barbaro A, Procopio FA et al. CIITA-induced MHC class II expression in mammary adenocarcinoma leads to a Th1 polarization of the tumor microenvironment, tumor rejection, and specific antitumor memory. Clin Cancer Res 2006; 12: 3435–3443. [DOI] [PubMed] [Google Scholar]
- 35.Hsieh RC, Krishnan S, Wu RC, Boda AR, Liu A, Winkler M et al. ATR-mediated CD47 and PD-L1 up-regulation restricts radiotherapy-induced immune priming and abscopal responses in colorectal cancer. Sci Immunol 2022; 7: eabl9330. [DOI] [PMC free article] [PubMed] [Google Scholar]
- 36.Olson BM, Gamat M, Seliski J, Sawicki T, Jeffery J, Ellis L et al. Prostate Cancer Cells Express More Androgen Receptor (AR) Following Androgen Deprivation, Improving Recognition by AR-Specific T Cells. Cancer Immunol Res 2017; 5: 1074–1085. [DOI] [PMC free article] [PubMed] [Google Scholar]
- 37.Lopez-Bujanda ZA, Haffner MC, Chaimowitz MG, Chowdhury N, Venturini NJ, Patel RA et al. Castration-mediated IL-8 promotes myeloid infiltration and prostate cancer progression. Nat Cancer 2021; 2: 803–818. [DOI] [PMC free article] [PubMed] [Google Scholar]
- 38.Long X, Hou H, Wang X, Liu S, Diao T, Lai S et al. Immune signature driven by ADT-induced immune microenvironment remodeling in prostate cancer is correlated with recurrence-free survival and immune infiltration. Cell Death Dis 2020; 11: 779. [DOI] [PMC free article] [PubMed] [Google Scholar]
- 39.Gannon PO, Poisson AO, Delvoye N, Lapointe R, Mes-Masson AM, Saad F. Characterization of the intra-prostatic immune cell infiltration in androgen-deprived prostate cancer patients. J Immunol Methods 2009; 348: 9–17. [DOI] [PubMed] [Google Scholar]
- 40.Mercader M, Sengupta S, Bodner BK, Manecke RG, Cosar EF, Moser MT et al. Early effects of pharmacological androgen deprivation in human prostate cancer. BJU Int 2007; 99: 60–67. [DOI] [PubMed] [Google Scholar]
- 41.Galon J, Pagès F, Marincola FM, Angell HK, Thurin M, Lugli A et al. Cancer classification using the Immunoscore: a worldwide task force. J Transl Med 2012; 10: 205. [DOI] [PMC free article] [PubMed] [Google Scholar]
- 42.Hajiran A, Chakiryan N, Aydin AM, Zemp L, Nguyen J, Laborde JM et al. Reconnaissance of tumor immune microenvironment spatial heterogeneity in metastatic renal cell carcinoma and correlation with immunotherapy response. Clinical and Experimental Immunology 2021; 204: 96–106. [DOI] [PMC free article] [PubMed] [Google Scholar]
- 43.Lu S, Stein JE, Rimm DL, Wang DW, Bell JM, Johnson DB et al. Comparison of Biomarker Modalities for Predicting Response to PD-1/PD-L1 Checkpoint Blockade: A Systematic Review and Meta-analysis. JAMA Oncology 2019; 5: 1195–1204. [DOI] [PMC free article] [PubMed] [Google Scholar]
- 44.Beer TM, Kwon ED, Drake CG, Fizazi K, Logothetis C, Gravis G et al. Randomized, Double-Blind, Phase III Trial of Ipilimumab Versus Placebo in Asymptomatic or Minimally Symptomatic Patients With Metastatic Chemotherapy-Naive Castration-Resistant Prostate Cancer. J Clin Oncol 2017; 35: 40–47. [DOI] [PubMed] [Google Scholar]
- 45.Kwon ED, Drake CG, Scher HI, Fizazi K, Bossi A, van den Eertwegh AJ et al. Ipilimumab versus placebo after radiotherapy in patients with metastatic castration-resistant prostate cancer that had progressed after docetaxel chemotherapy (CA184–043): a multicentre, randomised, double-blind, phase 3 trial. Lancet Oncol 2014; 15: 700–712. [DOI] [PMC free article] [PubMed] [Google Scholar]
- 46.Slovin SF, Higano CS, Hamid O, Tejwani S, Harzstark A, Alumkal JJ et al. Ipilimumab alone or in combination with radiotherapy in metastatic castration-resistant prostate cancer: results from an open-label, multicenter phase I/II study. Ann Oncol 2013; 24: 1813–1821. [DOI] [PMC free article] [PubMed] [Google Scholar]
- 47.Antonarakis ES, Piulats JM, Gross-Goupil M, Goh J, Ojamaa K, Hoimes CJ et al. Pembrolizumab for Treatment-Refractory Metastatic Castration-Resistant Prostate Cancer: Multicohort, Open-Label Phase II KEYNOTE-199 Study. J Clin Oncol 2020; 38: 395–405. [DOI] [PMC free article] [PubMed] [Google Scholar]
- 48.Gratzke CJ, Ozguroglu M, Peer A, Sendur MAN, Retz M, Goh JCH et al. 1772MO Pembrolizumab (pembro) plus enzalutamide (enza) and androgen deprivation therapy (ADT) for patients (pts) with metastatic hormone-sensitive prostate cancer (mHSPC): Randomized double-blind phase III KEYNOTE-991 study. Annals of Oncology 2023; 34: S957–S958. [Google Scholar]
- 49.ClinicalTrials.gov ID NCT03689699. Nivolumab and BMS-986253 for Hormone-Sensitive Prostate Cancer (MAGIC-8). [cited January 3, 2024]. Available from: https://www.clinicaltrials.gov/study/NCT03689699
- 50.ClinicalTrials.gov ID NCT04301414. Non-fucosylated Anti-CTLA-4 (BMS-986218) + Degarelix Acetate vs Degarelix Acetate Alone in Men With High-risk Localized Prostate Cancer (Neo-Red-P) [cited January 3, 2024] Available from: https://clinicaltrialsgov/study/NCT04301414?tab=history.
- 51.ClinicalTrials.gov ID NCT04262154. Study of Abiraterone Acetate or Enzalutamide, Atezolizumab, GnRH Analog and Radiation Therapy in Men With Newly Diagnosed Hormone-sensitive Prostate Cancer. [cited January 3, 2023]. Available from: https://clinicaltrials.gov/study/NCT04262154.
- 52.Axelrod ML, Cook RS, Johnson DB, Balko JM. Biological Consequences of MHC-II Expression by Tumor Cells in Cancer. Clin Cancer Res 2019; 25: 2392–2402. [DOI] [PMC free article] [PubMed] [Google Scholar]
- 53.Willingham SB, Volkmer JP, Gentles AJ, Sahoo D, Dalerba P, Mitra SS et al. The CD47-signal regulatory protein alpha (SIRPa) interaction is a therapeutic target for human solid tumors. Proc Natl Acad Sci U S A 2012; 109: 6662–6667. [DOI] [PMC free article] [PubMed] [Google Scholar]
- 54.Advani R, Flinn I, Popplewell L, Forero A, Bartlett NL, Ghosh N et al. CD47 Blockade by Hu5F9-G4 and Rituximab in Non-Hodgkin’s Lymphoma. N Engl J Med 2018; 379: 1711–1721. [DOI] [PMC free article] [PubMed] [Google Scholar]
Associated Data
This section collects any data citations, data availability statements, or supplementary materials included in this article.
Supplementary Materials
Data Availability Statement
The human sequence data generated in this study are not publicly available due to patient privacy requirements, but are available upon reasonable request from the corresponding author. Other data generated in this study are available within the article and its supplementary data files.