

ABSTRACT
Emergency Department (ED) presentations for Mental Health (MH) help‐seeking have been rising rapidly, with EDs as the main entry point for most individuals in Australia. The objective of this retrospective cohort study was to analyse the sociodemographic and presentation features of people who sought mental healthcare in two EDs located in a regional coastal setting in New South Wales (NSW), Australia from 2016 to 2021. This article is a part of a broader research study on the utilisation of machine learning in MH. The objective of this study is to identify the factors that lead to the admission of individuals to an MH inpatient facility when they seek MH care in an ED. Data were collected using existing records and analysed using descriptive univariate analysis with statistical significance between the two sites was determined using Chi squared test, p < 0.05. Two main themes characterise dominant help‐seeking dynamics for MH conditions in ED, suicidal ideation, and access and egress pathways. The main findings indicate that suicidal ideation was the most common presenting problem (38.19%). People presenting to ED who ‘Did not wait’ or ‘Left at own risk’ accounted for 10.20% of departures from ED. A large number of presentations arrived via the ambulance, accounting for 45.91%. A large proportion of presentations are related to a potentially life‐threatening condition (suicidal ideation). The largest proportion of triage code 1 ‘Resuscitation’ was for people with presenting problem of ‘Behavioural Disturbance’. Departure and arrival dynamics need to be better understood in consultation with community and lived experience groups to improve future service alignment with the access and egress pathways for emergency MH care.
Keywords: artificial intelligence, emergency department, machine learning, mental health, nursing
1. Introduction
The growing disparity between the demand and supply of healthcare continues to be a pressing issue, as evidenced by the 8.8 million Emergency Department (ED) visits recorded in Australian public hospitals in 2020–2021 (Australian Institute of Health and Welfare 2021). Consumers increasingly spend more time in EDs, with fewer visits completed within the key performance benchmark standard of under 4‐h wait duration set by New South Wales (NSW) Health (Australian Institute of Health and Welfare 2021). NSW Health has committed to ensuring that 81% of individuals who present at a public hospital ED will either be discharged, referred to another hospital for treatment, or admitted to the hospital and physically leave the ED within a benchmarked 4‐h timeframe (NSW Health 2021). The objective of this retrospective cohort study was to analyse the sociodemographic and presentation features of people who sought Mental Health (MH) care in two EDs located on the Central Coast of NSW from 2016 to 2021. This article is a part of a broader research study on the utilisation of Machine Learning (ML) in MH. The objective of this study is to identify the factors that lead to the admission of individuals to an MH inpatient facility when they seek MH care in an ED.
1.1. Background
EDs present a challenging and often complex environment for individuals experiencing MH conditions. These settings are characterised by excessive noise, busyness, crowding and a clinical atmosphere that operates around the clock with high levels of activity, potentially exacerbating distress for many people (Clarke, Dusome, and Hughes 2007). The high volume of MH‐related presentations to EDs can lead to long wait times, overcrowding and delays in treatment (Duggan et al. 2020), resulting in frustration and dissatisfaction among consumers (Digel Vandyk et al. 2018; Morphet et al. 2012). Compared to individuals with other conditions, MH consumers often experience lengthy stays and wait times for inpatient beds in the emergency department (Duggan et al. 2020). Triage processes are essential to ensure timely and appropriate care for consumers with mental health problems. However, many EDs struggle to implement effective triage systems (Morphet et al. 2012). The extended waiting times for individuals seeking mental health services have been associated with negative safety and clinical outcomes, including higher mortality rates, an increased risk of violence and aggression in the emergency department, and patients leaving without receiving the necessary care, thus disregarding their needs (Duggan et al. 2020). Despite attempts to enhance the consumer journey, many MH patients still report unsatisfactory experiences in the emergency department, which includes long wait times, lack of specialised healthcare and improper treatment settings (Digel Vandyk et al. 2018; Morphet et al. 2012). Ultimately, the challenges posed by MH presentations in EDs underscore the need for greater infrastructure, resources and knowledge to provide specialised and timely care to individuals with MH problems (Digel Vandyk et al. 2018). Addressing these issues is crucial to ensure that individuals experiencing MH conditions receive appropriate and compassionate care in a suitable environment that promotes their well‐being and recovery.
1.2. Consumer Perspective
For many consumers, the presentation to ED is not a first choice but rather is the only choice available to them (Digel Vandyk et al. 2018; Morphet et al. 2012). The selected site in this research contains two EDs and is the only option for people in mental distress, particularly after hours and on weekends when there is a lack of access to primary care. Morphet et al. (2012) explored responsiveness issues from an MH consumer and carer perspective, aiming to improve the ED journey in Australian hospitals in Victoria. This mixed methods research comprised both surveys and focus groups to better understand the lived experience. Service participants were contacted following a presentation to the ED for MH reasons. The survey yielded 65 respondents, with 46 (71%) identifying themselves as MH clients, 10 (15%) as next of kin or carers of those with MH problems and the remaining 9 (14%) responding as neither an MH consumer nor carer. Participants in the study reported that they would have preferred a separate space for people with MH problems to reduce the stigma associated with mental illness (Morphet et al. 2012). However, not all participants agreed with this idea, highlighting the conflict between reducing stigma and providing specialised services (Morphet et al. 2012).
Approximately, half of the participants (54%) stated that their main reason for attending ED was for MH (Morphet et al. 2012), and 48% indicated that they spent over 4 h in ED (Morphet et al. 2012). Similarly, Digel Vandyk et al. (2018) explored the experiences of 10 adults who made 12 or more ED visits within one year of a multisite tertiary facility in Ontario, Canada. Their findings revealed that the participants believed they had no choice but to seek hospitalisation. They viewed every visit as essential and interpreted the staff's failure to address their needs as discriminatory and disrespectful (Digel Vandyk et al. 2018). Digel Vandyk et al. (2018) observed the recommendations that healthcare providers should work towards adopting tailored approaches instead of a uniform strategy when implementing interventions aimed at enhancing emergency care experience for people presenting with MH problems.
1.3. Research Setting and Context
This article reports on the findings of research conducted in one coastal regional local health service in NSW, Australia, that contains two public hospitals containing EDs servicing the community of 346 596 residents over an area of 1681 km2 (Australian Bureau of Statistics 2021a). The Mental Health Act 2007 allows involuntary detention and treatment for individuals found to be mentally ill or disordered and requires the individual to be taken to a declared mental health facility, of which both ED sites are, for assessment (NSW Health 2019). Acute inpatient services and community‐based care are offered as part of the public health comprehensive MH service delivery programme, with services provided across three streams: Child and Youth Mental Health (0–12 and 12–17 years), Adult (18–65 years) and Older persons (65+ years). In a departure from other NSW EDs specialised MH staff provide assessments at the EDs around the clock, seven days a week. The two sites total 84 acute inpatient MH beds on the Central Coast. Site A comprises 24 acute and 6 high‐dependency beds (30 in total). Site B comprises 25 acute, 10 high‐dependency and 15 older persons (65+) beds as well as a Psychiatric Emergency Care Centre (PECC) with four beds adjacent to the ED (54 in total). Neighbouring health districts provide access to sub‐acute, non‐acute and rehabilitation beds for clients requiring extended or specialty MH care, as these bed types are not available in the local area. Adolescent (ages 12–17) MH beds are unavailable on the Central Coast; instead, referrals to adolescent inpatient services are made to the neighbouring districts' specialised inpatient units (Central Coast Local Health District 2017).
1.4. Central Coast Demographics
The Central Coast region of New South Wales is situated in close proximity to Sydney, Australia. According to the Australian Bureau of Statistics (2021a), the gender distribution in the Central Coast is 48.5% male and 51.5% female. Notably, 4.9% of the population within the Central Coast identify as Aboriginal and/or Torres Strait Islander peoples, a higher proportion compared to 3.4% in NSW and 3.2% across Australia (Australian Bureau of Statistics 2021a). The Central Coast of NSW is experiencing an ageing population, with a growing number of individuals aged 55 and above in recent years. This trend is projected to continue in the coming decades, according to the Australian Bureau of Statistics (2021a). Compared to both NSW and Australia, the Central Coast region faces poorer health outcomes, including a higher prevalence of MH conditions such as anxiety and depression, at 11.0%, in contrast to 8.0% in NSW and 8.8% across Australia (Australian Bureau of Statistics 2021b). Additionally, the region has experienced higher than average increases in high psychological distress over the period of 2015–2021 (NSW Health 2023). In light of these demographic and health challenges, there is a pressing need for public health services in the Central Coast to be supported by evidence‐based research that describes the dynamics related to MH presentations in EDs. Such evidence can inform effective planning and service delivery strategies tailored to the specific needs of the catchment population while considering the available budget and resources.
2. Method
2.1. Design
This retrospective cohort design utilises existing data collected in routine care and employs a cross‐sectional descriptive epidemiological method (Liamputtong 2021, 212).
2.2. Setting
The study was set in two public EDs on the Central Coast, a local health district of New South Wales, Australia.
2.3. Population and Sample
The study included all presentations made to the ED with MH recorded as the presenting problem. The sample for the current study was drawn from 1 January 2016 to 31 December 2021.
2.4. Data Collection
The primary data collection reviewed existing data from 1 January 2016 and 30 December 2021 and did not require recruitment. The ED data were selected for inclusion using the following terms in the presenting problem; ‘%suici%’ OR ‘%MH%’ OR ‘%self‐harm%’ OR ‘%psych%’ OR ‘%Mental%’. A second data collection was extracted from the electronic medical record to link the ED presentations with MH service data to determine if the individual presentation is linked with a current service or previously received care. This extraction was extended back a further year, from 1 January 2015 to 30 December 2021, to ensure the inclusion of previous service use data. Understanding a person's previous connection to MH services is crucial when they present to the ED. Previous MH hospitalisations have been identified as a significant risk factor for future readmissions (Vigod et al. 2013). The phenomenon of ‘revolving door’ patients, characterised by frequent hospitalisations, has been observed in individuals with schizophrenia or affective disorders, highlighting the importance of considering past admissions and connection to MH services (Fonseca Barbosa and Gama Marques 2023). Furthermore, predictive models have incorporated previous hospitalisations as a valuable variable for forecasting psychiatric readmissions (Góngora Alonso et al. 2023). However, it is essential to recognise that previous admissions are not the sole determinant, and a comprehensive assessment of various personal, clinical and systemic factors is necessary to accurately evaluate the risk of future hospitalisations and provide appropriate interventions.
A full list of the variables used is located in Table 1. The data set extracted contained 26 681 records, of which 14 were missing the ‘ED Source of Referral’, 2 were missing ‘Mode of Separation’, 45 were missing their ‘Marital Status’, 2 were missing the ‘Mode of Arrival’, 148 were missing ‘Time in ED’ and 307 were missing ‘Referred to on departure’. The overall proportion of missing data is relatively small. However, handling the missing data carefully is still important, as even small amounts of missing data can impact the study results (Kang 2013). The missing data in this instance can be defined as missing completely at random (MCAR), with the most straightforward approach being listwise or case deletion and common practice in cases such as this (Kang 2013). This approach resulted in the entire missing record being removed from the dataset, resulting in the final record count being 26 166, a loss of 515 records (1.93%). The sites' (Site A and Site B) differences were calculated with a p‐value < 0.05 being considered statistically significant.
TABLE 1.
Variables.
| Item | Description |
|---|---|
| Age | Numerical value indicating the persons' age at the time of presentation |
| Gender | Gender reported at time of presentation |
| First Nations peoples' status | A person disclosed if they identify as an ‘Aboriginal and/or Torres Strait Islander’ person status at time of presentation |
| Time of day | The time of day, 0–23, that a person presented to ED |
| Day of week | The day in which a person presented, Monday through Sunday |
| Month | The month of the presentation, January to December |
| Mode of arrival | Police, ambulance, etc. |
| Triage category | NSW Health Triage Category's indicating urgency of care |
| Resuscitation (1) | |
| Emergency (2) | |
| Urgent (3) | |
| Semi‐urgent (4) | |
| Non‐urgent (5) | |
| Presenting problem | Altered mental status |
| Anxious | |
| Behavioural disturbance | |
| Depression | |
| Eating disorder | |
| Hallucinations | |
| Memory impairment | |
| Mental health problem | |
| Self‐harm | |
| Suicidal ideation | |
| Hospital facility | (Site A/Site B) |
| Active client | At the time of the presentation to the ED |
| Previous client | Previous service user preceding the ED presentation back to 1 January 2015 |
2.5. Defining Presenting Problem
The presenting problem is used to establish the MH context of the presentation. The ‘presenting problem’ refers to a free‐text section in the electronic medical record where a patient's symptoms or medical condition is described by the individual to the clinician during emergency department triage (Bureau of Health Information 2022). While there have been calls to standardise this input (Berendsen Russell, Dinh, and Bell 2017), no clear definitions or explanations are available in the literature. However, a precedent has been set in previous works; Wand et al. (2015) used the presenting problem field to examine the role of Nurse Practitioners in EDs. Likewise, Sara et al. (2022) and Sperandei et al. (2022) used the presenting problem field to extract ED presentation data relating to self‐harm.
2.6. Data Analysis
The Central Coast Local Health District (CCLHD) comprises four hospitals, two of which contain public EDs. These two sites represent different sociodemographic profiles and public accessibility. Due to these differences, the data between the two sites were compared with Chi squared tests with statistical significance that was set at p < 0.05. The missing data were removed using case deletion (Kang 2013), resulting in the final record count being 26 166, a loss of 515 records (1.93%).
3. Results
3.1. Demographics
Overall the total number of presentations to the ED from 2016 to 2021 included in the data was (n = 26 166). The 25–34 age group represents the largest percentage of presentations overall at 20.30% (n = 5311), with the 18–24 age group being very similar at 19.74% (n = 5094). However, there is a difference between the two sites for the 18–24 age group (p = 0.0064): Site A having 20.15% (n = 2589) and Site B 18.81% (n = 2505), which is not evident in the 25–34 (p = 0.2453) or the 35–44 (p = 0.1259) age groups. The 12–17 group represents 15.45% (n = 4043), with no statistical significance between Site A and Site B (p = 0.8777). The 65–74 age group had a significant difference in the presentations of the two sites (p = 0.006), with Site A 2.79% (n = 359) to Site B's 3.54% (n = 471) (Table 2). Female presentations accounted for 50.63% (n = 13 248), slightly higher than Males at 49.35% (n = 12 912) (Table 2). Figure 1 reveals intriguing variations in the age distribution of presentations when analysed through the lens of gender. From ages 12 to 17, a considerable proportion of females present to ED, with a peak at age 16. Between ages 18 and 21, the proportion of female presenters declines below that of males in the same age brackets. The number of male presenters surpasses that of females between the ages of 22 and 36. However, beyond the age of 36, the number of presentations maintains a relatively stable pattern for both gender groups (Figure 1).
TABLE 2.
Comparison between Site A and Site B emergency department presentations.
| Site A | % | Site B | % | Total | % | p | |
|---|---|---|---|---|---|---|---|
| n | 12 850 | 49.11 | 13 316 | 50.89 | 26 166 | ||
| Age | |||||||
| 0–11 | 234 | 1.82 | 198 | 1.49 | 432 | 1.65 | 0.0340* |
| 12–17 | 1981 | 15.42 | 2062 | 15.49 | 4043 | 15.45 | 0.8777 |
| 18–24 | 2589 | 20.15 | 2505 | 18.81 | 5094 | 19.47 | 0.0064* |
| 25–34 | 2646 | 20.59 | 2665 | 20.01 | 5311 | 20.30 | 0.2453 |
| 35–44 | 2228 | 17.34 | 2405 | 18.06 | 4633 | 17.71 | 0.1259 |
| 45–54 | 1587 | 12.35 | 1803 | 13.54 | 3390 | 12.96 | 0.0042* |
| 55–64 | 847 | 6.59 | 921 | 6.92 | 1768 | 6.76 | 0.2950 |
| 65–74 | 359 | 2.79 | 471 | 3.54 | 830 | 3.17 | 0.0006* |
| 75–84 | 261 | 2.03 | 193 | 1.45 | 454 | 1.74 | 0.0003* |
| Over 85 | 118 | 0.92 | 93 | 0.70 | 211 | 0.81 | 0.0468* |
| Gender | |||||||
| Female | 6460 | 50.27 | 6788 | 50.98 | 13 248 | 50.63 | 0.2549 |
| Male | 6386 | 49.70 | 6526 | 49.01 | 12 912 | 49.35 | 0.2659 |
| Other | 4 | 0.03 | 2 | 0.02 | 6 | 0.02 | 0.3896 |
| Active client | |||||||
| No | 10 298 | 80.14 | 10 885 | 81.74 | 21 183 | 80.96 | 0.0010* |
| Yes | 2552 | 19.86 | 2431 | 18.26 | 4983 | 19.04 | 0.0010* |
| Previous client | |||||||
| No | 5941 | 46.23 | 6541 | 49.12 | 12 482 | 47.70 | 0.0000* |
| Yes | 6909 | 53.77 | 6775 | 50.88 | 13 684 | 52.30 | 0.0000* |
| Presenting problem | |||||||
| Altered mental status | 730 | 5.68 | 780 | 5.86 | 1510 | 5.77 | 0.5401 |
| Anxious | 919 | 7.15 | 845 | 6.35 | 1764 | 6.74 | 0.0093* |
| Behavioural disturbance | 1582 | 12.31 | 1584 | 11.90 | 3166 | 12.10 | 0.3025 |
| Depression | 911 | 7.09 | 860 | 6.46 | 1771 | 6.77 | 0.0422* |
| Eating disorder | 17 | 0.13 | 11 | 0.08 | 28 | 0.11 | 0.2191 |
| Hallucinations | 394 | 3.07 | 518 | 3.89 | 912 | 3.49 | 0.0003* |
| Memory impairment | 18 | 0.14 | 10 | 0.08 | 28 | 0.11 | 0.1080 |
| Mental health problem | 2104 | 16.37 | 1817 | 13.65 | 3921 | 14.99 | 0.0000* |
| Self‐harm | 1457 | 11.34 | 1615 | 12.13 | 3072 | 11.74 | 0.0473* |
| Suicidal ideation | 4718 | 36.72 | 5276 | 39.62 | 9994 | 38.19 | 0.0000* |
| Admitted (mode of separation) | |||||||
| No | 10 481 | 81.56 | 9911 | 74.43 | 20 392 | 77.93 | 0.0000* |
| Yes | 2369 | 18.44 | 3405 | 25.57 | 5774 | 22.07 | 0.0000* |
| Mode of arrival | |||||||
| Community/Public transport | 34 | 0.26 | 3 | 0.02 | 37 | 0.14 | 0.0000* |
| No transport (walked in) | 180 | 1.40 | 10 | 0.08 | 190 | 0.73 | 0.0000* |
| Other | 64 | 0.50 | 46 | 0.35 | 110 | 0.42 | 0.0565* |
| Police/Correctional services Vehicle | 947 | 7.37 | 960 | 7.21 | 1907 | 7.29 | 0.6180 |
| Private vehicle | 5899 | 45.91 | 6011 | 45.14 | 11 910 | 45.52 | 0.2139 |
| State ambulance vehicle | 5726 | 44.56 | 6286 | 47.21 | 12 012 | 45.91 | 0.0000* |
| Triage category | |||||||
| Resuscitation (1) | 123 | 0.96 | 209 | 1.57 | 332 | 1.27 | 0.0000* |
| Emergency (2) | 2178 | 16.95 | 3541 | 26.59 | 5719 | 21.86 | 0.0000 |
| Urgent (3) | 6046 | 47.05 | 4882 | 36.66 | 10 928 | 41.76 | 0.0000* |
| Semi‐urgent (4) | 4225 | 32.88 | 4482 | 33.66 | 8707 | 33.28 | 0.1810 |
| Non‐urgent (5) | 278 | 2.16 | 202 | 1.52 | 480 | 1.83 | 0.0001* |
| Mode of separation | |||||||
| Admitted to ward/inpatient unit | 2369 | 18.44 | 3405 | 25.57 | 5774 | 22.07 | 0.0000* |
| Admitted: Other | 201 | 1.56 | 144 | 1.08 | 345 | 1.32 | 0.0006* |
| Departed: Did not wait | 947 | 7.37 | 807 | 6.06 | 1754 | 6.70 | 0.0000* |
| Departed: Left at own risk | 393 | 3.06 | 522 | 3.92 | 915 | 3.50 | 0.0001* |
| Departed: Treatment completed | 8503 | 66.17 | 8319 | 62.47 | 16 822 | 64.29 | 0.0000* |
| Departed: Other | 437 | 3.40 | 119 | 0.89 | 556 | 2.12 | 0.0000* |
| Day of week | |||||||
| Sunday | 1742 | 13.56 | 1778 | 13.35 | 3520 | 13.45 | 0.6287 |
| Monday | 2054 | 15.98 | 2126 | 15.97 | 4180 | 15.97 | 0.9671 |
| Tuesday | 1917 | 14.92 | 2036 | 15.29 | 3953 | 15.11 | 0.4014 |
| Wednesday | 1916 | 14.91 | 2014 | 15.12 | 3930 | 15.02 | 0.6279 |
| Thursday | 1934 | 15.05 | 1907 | 14.32 | 3841 | 14.68 | 0.0955 |
| Friday | 1730 | 13.46 | 1840 | 13.82 | 3570 | 13.64 | 0.4031 |
| Saturday | 1557 | 12.12 | 1615 | 12.13 | 3172 | 12.12 | 0.9772 |
Note: p is the comparison between Site A and Site B emergency department presentations.
Statistically significant.
FIGURE 1.
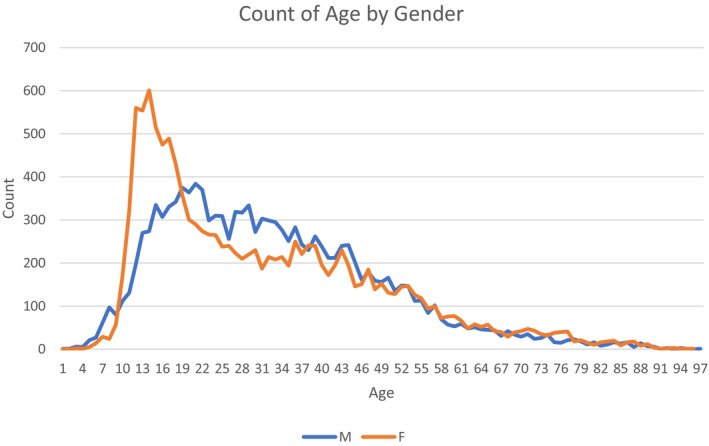
Age distribution.
3.2. Presentation Characteristics
Approximately, half (52.30%, n = 13 684) of all presentations had received an MH service from CCLHD in the past; however, most people (80.96%, n = 21 183) were not receiving a service from MH at the time of presentation to ED (Table 2). ‘Suicidal ideation’ was by far the largest ‘Presenting problem’ reported in the data at 38.19% (n = 9994). Site B had a higher proportion of ‘Suicidal ideation’ (39.62%, n = 5276) when compared to Site A (36.72%, n = 4718) (p < 0.00001), with ‘Mental health problem’ second at 14.99% (n = 3166), ‘Behavioural disturbance’ third at 12.10% (n = 3166) and ‘Self‐harm’ fourth at 11.74% (n = 3072) (Table 2). The triage category in ED upon arrival resulted in ‘Code 3 (Urgent)’ accounting for 41.76% (n = 10 928), with ‘Category 4 (Semi‐urgent)’ 33.28% (n = 8707), ‘Category 2 (Emergency)’ 21.86% (n = 5719), ‘Category 5 (Non‐urgent)’ 1.83% (n = 480) and ‘Category 1 (Resuscitation)’ 1.27% (n = 332) (NSW Health 2013) (Table 2). Site B received slightly higher presentations at 50.89% (n = 13 316) compared to Site A (49.11%, n = 12 850) during the date range examined with most presentations, 77.93% (n = 20 392), not admitted to an MH inpatient unit (Table 2).
3.3. Triage by Presenting Problem
Table 3 provides a cross‐table breakdown of the presenting problem by triage code. ‘Resuscitation (1)’ cases are relatively low across all presenting problems. However, it is important to note that the ‘Behavioural disturbance’ (n = 179) is considerably higher than the other problems at this level of urgency. Overall, the distribution of ‘Behavioural Disturbance’ presentations is towards the higher urgency end of the triage scale (Table 3). ‘Self‐harm’ and ‘Suicidal ideation’ have a significant number of cases in the ‘Emergency (2)’ and ‘Urgent (3)’ categories; however, the relative number of ‘Self‐harm’ in ‘Resuscitation (1)’ is proportionately higher than SI (SH, n = 28, SI, n = 40) (Table 3). The majority of cases for ‘Altered mental status’, ‘Anxious’, ‘Depression’, ‘Eating disorder’, ‘Hallucinations’ and ‘Memory impairment’ fall under the ‘Urgent (3)’ or ‘Semi‐urgent (4)’ categories (Table 3).
TABLE 3.
Triage category by presentation problem.
| Presenting problem | Altered mental status | Anxious | Behavioural disturbance | Depression | Eating disorder | Hallucinations | Memory impairment | Mental health Problemp | Self‐harm | Suicidal ideation | |
|---|---|---|---|---|---|---|---|---|---|---|---|
| Resuscitation (1) | N | 44 | 1 | 179 | 1 | 39 | 28 | 40 | |||
| % | 0.17 | 0.00 | 0.68 | 0.00 | 0.00 | 0.00 | 0.00 | 0.15 | 0.11 | 0.15 | |
| PP % | 2.91 | 0.06 | 5.65 | 0.00 | 0.00 | 0.11 | 0.00 | 0.99 | 0.91 | 0.40 | |
| Emergency (2) | N | 343 | 18 | 937 | 43 | 3 | 115 | 528 | 771 | 2961 | |
| % | 1.31 | 0.07 | 3.58 | 0.16 | 0.01 | 0.44 | 0.00 | 2.02 | 2.95 | 11.32 | |
| PP % | 22.72 | 1.02 | 29.60 | 2.43 | 10.71 | 12.61 | 0.00 | 13.47 | 25.10 | 29.63 | |
| Urgent (3) | n | 585 | 351 | 1139 | 537 | 7 | 474 | 14 | 1363 | 1280 | 5178 |
| % | 2.24 | 1.34 | 4.35 | 2.05 | 0.03 | 1.81 | 0.05 | 5.21 | 4.89 | 19.79 | |
| PP % | 38.74 | 19.90 | 35.98 | 30.32 | 25.00 | 51.97 | 50.00 | 34.76 | 41.67 | 51.81 | |
| Semi‐urgent (4) | n | 498 | 1245 | 863 | 1163 | 17 | 311 | 14 | 1822 | 977 | 1797 |
| % | 1.90 | 4.76 | 3.30 | 4.44 | 0.06 | 1.19 | 0.05 | 6.96 | 3.73 | 6.87 | |
| PP % | 32.98 | 70.58 | 27.26 | 65.67 | 60.71 | 34.10 | 50.00 | 46.47 | 31.80 | 17.98 | |
| Non‐urgent (5) | n | 40 | 149 | 48 | 28 | 1 | 11 | 169 | 16 | 18 | |
| % | 0.15 | 0.57 | 0.18 | 0.11 | 0.00 | 0.04 | 0.00 | 0.65 | 0.06 | 0.07 | |
| PP % | 2.65 | 8.45 | 1.52 | 1.58 | 3.57 | 1.21 | 0.00 | 4.31 | 0.52 | 0.18 | |
| Total | n | 1510 | 1764 | 3166 | 1771 | 28 | 912 | 28 | 3921 | 3072 | 9994 |
Note: % = The overall percentage for all presentations, PP % = The percentage based upon the presenting problem.
3.4. Arrivals and Departures
‘State ambulance’ accounts for 45.91% (n = 12 012) of presentation mode of arrival; however, ‘Private vehicle’ was similar to this figure at 45.52% (n = 11 910). When comparing the two sites, the ‘State Ambulance’ usage is higher at Site B, 47.21% (n = 6286), than Site A (44.56%, n = 5726) (p < 0.0001); however, this difference is not made up in ‘Private vehicle’ usage with Site A (45.91%, n = 5899) and Site B (45.14%, n = 6011) reporting very similar results (p = 0.2139). Conversely, both ‘Community/Public Transport’ (p < 0.0001) and ‘No transport (walked in)’ (p < 0.0001) show higher utilisation at Site B (Table 2). ‘Police and correctional services’ account for 7.29% (n = 1907) with no statistical significance between the sites (p = 0.6180); however, it should be noted that if the police require an ambulance to attend and transport a consumer to the hospital, it will be coded as an ambulance in this dataset (Table 2). Most separations were classified as ‘Departed: Treatment completed’ (64.29%, n = 16 822); however, significant variation occurs between the two sites concerning ‘Departed: Did not wait’ and ‘Departed: Left at own risk’. Site B recorded a 3.92% (n = 522), ‘Left at own risk’ compared to Site A's 3.06% (n = 393) (p < 0.0001), while the ‘Did not wait’ were reported as 7.37% (n = 947) for Site A and 6.06% (n = 807) for Site B (p < 0.0001) (Table 2).
3.5. Time of Day and Length of Stay
The number of presentations is highest during the middle of the day, with 12:00 (6.31%, n = 1650), followed by 13:00 (6.22%, n = 1627), 14:00 (6.45%, n = 1689) and 15:00 (6.02%, n = 1574). The lowest number of presentations occurs early in the morning, starting at 3:00 (1.61%, n = 421), 4:00 (1.12%, n = 292), 5:00 (1.07%, n = 279) and 6:00 (0.91%, n = 237) (Table 4). The mean length of time in ED is 224.41 min (SD 165.34), with 23.56% (n = 6166) departing at the 2–3 h mark. 19.35% (n = 5064) are between 3 and 4 h and 19.24% (n = 2034) in between 1 and 2 h with only 5.81% (n = 1519) departing in less than 1 h. Presentations overall spend less time in the ED at Site A than at Site B. There is significant variation between the two sites. In the 0–1 h mark, 7.20% (n = 925) of Site A compared to 4.46% (n = 594) at Site B. At the 1–2 h mark, 20.58% (n = 2644) Site A and Site B 17.95% (n = 2390) (Table 4).
TABLE 4.
Hour of presentation.
| Hour | Site A | % | Site B | % | Total | % | p | |
|---|---|---|---|---|---|---|---|---|
| 0 | 0:00 | 533 | 4.15 | 519 | 3.90 | 1052 | 4.02 | 0.3028 |
| 1 | 1:00 | 383 | 2.98 | 354 | 2.66 | 737 | 2.82 | 0.1154 |
| 2 | 2:00 | 287 | 2.23 | 293 | 2.20 | 580 | 2.22 | 0.8557 |
| 3 | 3:00 | 207 | 1.61 | 214 | 1.61 | 421 | 1.61 | 0.9805 |
| 4 | 4:00 | 144 | 1.12 | 148 | 1.11 | 292 | 1.12 | 0.9437 |
| 5 | 5:00 | 137 | 1.07 | 142 | 1.07 | 279 | 1.07 | 0.9985 |
| 6 | 6:00 | 107 | 0.83 | 130 | 0.98 | 237 | 0.91 | 0.2204 |
| 7 | 7:00 | 142 | 1.11 | 165 | 1.24 | 307 | 1.17 | 0.3141 |
| 8 | 8:00 | 219 | 1.70 | 254 | 1.91 | 473 | 1.81 | 0.2174 |
| 9 | 9:00 | 382 | 2.97 | 429 | 3.22 | 811 | 3.10 | 0.2454 |
| 10 | 10:00 | 595 | 4.63 | 637 | 4.78 | 1232 | 4.71 | 0.5582 |
| 11 | 11:00 | 752 | 5.85 | 717 | 5.38 | 1469 | 5.61 | 0.1004 |
| 12 | 12:00 | 816 | 6.35 | 834 | 6.26 | 1650 | 6.31 | 0.7721 |
| 13 | 13:00 | 765 | 5.95 | 862 | 6.47 | 1627 | 6.22 | 0.0816 |
| 14 | 14:00 | 800 | 6.23 | 889 | 6.68 | 1689 | 6.45 | 0.1382 |
| 15 | 15:00 | 751 | 5.84 | 823 | 6.18 | 1574 | 6.02 | 0.2529 |
| 16 | 16:00 | 795 | 6.19 | 828 | 6.22 | 1623 | 6.20 | 0.9164 |
| 17 | 17:00 | 800 | 6.23 | 785 | 5.90 | 1585 | 6.06 | 0.2625 |
| 18 | 18:00 | 753 | 5.86 | 817 | 6.14 | 1570 | 6.00 | 0.3481 |
| 19 | 19:00 | 711 | 5.53 | 666 | 5.00 | 1377 | 5.26 | 0.0542 |
| 20 | 20:00 | 769 | 5.98 | 728 | 5.47 | 1497 | 5.72 | 0.0717 |
| 21 | 21:00 | 754 | 5.87 | 723 | 5.43 | 1477 | 5.64 | 0.1247 |
| 22 | 22:00 | 679 | 5.28 | 755 | 5.67 | 1434 | 5.48 | 0.1704 |
| 23 | 23:00 | 569 | 4.43 | 604 | 4.54 | 1173 | 4.48 | 0.6733 |
4. Discussion
This retrospective cohort study aimed to analyse the sociodemographic factors and presentation features of individuals seeking MH care in two EDs located in a regional coastal setting of New South Wales, Australia, from 2016 to 2021. A key objective was to identify factors associated with admission to an inpatient mental health facility following an ED presentation for mental health reasons. By comprehensively characterising the population presenting to these regional EDs for MH concerns, the study has elucidated sociodemographic and clinical factors that may precipitate an inpatient MH admission.
4.1. Arrival
The mode of arrival at the hospital differs significantly between Site B and Site A. Data analysis reveals that the most frequently reported mode of arrival at the hospital is by ‘State ambulance’, with the ‘Private vehicle’ being a close second. By contrast, 52.2% of NSW MH ED presentations in 2020–2021 were recorded as ambulance (Australian Institute of Health and Welfare 2022). Further examination of the data from both sites reveals that Site B has a higher rate of ambulance presentations compared to Site A. It is important to note that this difference is not explained by variations in private vehicle access between the two sites (p = 0.2139). Further examination of the mode of arrival reveals a statistical significance in the use of community/public transport to attend ED with more walk‐ins at Site A compared to Site B. Site B hospital is located some distance from public transport hubs and is only served by limited public transport options after hours or on weekends. In contrast, Site A Hospital is located close to a local train station and transport hub, making it more accessible for consumers. This difference serves as a possible indicator of poor public access to the hospital in Site B, raising concerns about the utilisation of ambulance services in the area and underscoring the importance of addressing the issue of poor public transport and its impact on access to healthcare in the region (The Independent Pricing and Regulatory Tribunal of NSW 2015). However, it should be noted that further analysis is required to assess if ambulance presentations are being triaged as more urgent. If so, then their use may be appropriate and not related to the availability of transport.
Consumers are spending an increased amount of time in EDs (Australian Institute of Health and Welfare 2021), resulting in a decrease in the number of visits completed within 4 h. The mean length of stay across both EDs for MH problems is 224.41 min (3:44) which is comparable to the NSW (2020–2021) average of 228 min (3:48) (Australian Institute of Health and Welfare 2022) and Wardrop et al. (2023) reported median of 237 min for those admitted; however, Wardrop et al. (2023) also found a shorter median of 167 min for those not admitted. However, when comparing overall ED presentations for 20–21 (not just MH), Site A is 3:53, Site B is 3:16 and NSW 2:51 (Australian Institute of Health and Welfare 2021). The AIHW data show that the MH consumer spent, on average, 57 min more in the ED than those with non‐MH presentations (Australian Institute of Health and Welfare 2022). The literature indicates that increased length of stay data indicates high demand for MH care and a lack of hospital‐based facilities (Duggan et al. 2020). The length of stay data revealed in the current study indicates high demand and lack of community resources on the Central Coast. Duggan et al. (2020) suggest that the whole hospital system needs to adopt fresh care models, which encompass the management of urgent care requirements and discharge and referral procedures. The implementation of comprehensive and cohesive services, along with consistent interventions aimed at addressing the intricate and interdependent MH, physical health and social care necessities of those with continuous MH requirements, would decrease the occurrence of emergency hospital visits and establish a straightforward route for emergency care (Duggan et al. 2020).
4.2. Presenting Problem
From the results of this investigation, the most common presenting problem is ‘Suicidal ideation’, followed by ‘Mental health problem’, ‘Behavioural disturbances’ and ‘Self‐harm’. It is worth noting that Site B had a significantly higher proportion of consumers presenting with suicidal ideation than Site A. Perera et al. (2018) conducted a similar investigation that focused on presentations to NSW EDs with self‐harm and suicidal ideation, which covered 2010–2014. They reported 331 493 MH presentations to ED during the period, 32 663 (9.85%) were reported as ‘Suicidal ideation and behaviour’ and ‘Self‐harm’ of 16 215 (4.89%). Despite the differences in data collection, the Central Coast data show a more than double incidence of suicidal ideation and self‐harm. Further exploration is needed to see if this is a local feature due to increased distress over time in the community or is more widely spread. It should be noted that the data collection methods used are ICD‐10 or SNOMED codes for ED diagnosis rather than the triage presenting problem (Perera et al. 2018). Coding practices and data collection methods may underestimate SI and SH and could account for much of the difference. Therefore, further analysis is required to verify if an actual difference in rates exists between regions after accounting for data collection methods. If a true difference is established, then contributing factors specific to the local community should be examined, such as changes over time in risk factors like substance abuse, economic distress and social isolation. Improved monitoring and standardised data collection are recommended to enhance the observation of MH presentations in the ED setting.
4.3. Admissions and Departures
The analysis of the hospital presentations reveals that a significant proportion of presentations resulted in admission to a public inpatient facility (excluding Critical Care wards, ICU or admissions that were transferred); however, the reported figure is lower than the 2020–21 NSW admission rate for MH presentations to ED of 27.8% (Australian Institute of Health and Welfare 2022). It is important to note that there is a statistically significant difference between the admission rates at Site A and Site B; it is important to consider that Site B has a more extensive MH bed base than Site A (Central Coast Local Health District 2017), which may explain the higher admission rate at Site B. The findings of this analysis highlight the need for further examination into the factors contributing to the difference in admission rates between the two sites. It may be necessary to consider the availability of MH facilities and resources and the potential impact of the MH bed base in either Site B or Site A. While most people departed without being admitted, numbers were recorded as Not referred (which means possibly no further action was provided), Departed, Did not wait and Departed, Left at own risk, which is significantly different from that reported by NSW Health in 2020–21 at 0.7% and 4.5%, respectively (Australian Institute of Health and Welfare 2022) for MH presentations to ED and higher than Wardrop et al. (2023) ‘Left at own risk’ at 2.8% and ‘Did not wait’ at 1.1%. This is a significant finding and warrants further exploration.
5. Recommendations
5.1. Recommendation 1: Promoting Safety Planning to Address Suicidal Ideation
Suicide prevention therapeutic interventions (SPTI), such as safety planning, have been shown to prevent suicidal behaviour and should be included in clinical practice (Ferguson et al. 2022; Nuij et al. 2021). The promotion of SPTI offers an opportunity to facilitate risk mitigation arising from the large proportion of people who report the potentially life‐threatening condition of suicidal ideation (38.19%). Furthermore, safety planning is aligned with supporting 10.2% of people who attend the ED for an MH condition but depart without waiting to be seen by a clinician or who chose to leave at their own risk after presentation. Further research should be conducted to determine if SPTI can improve MH outcomes for individuals.
5.2. Recommendation 2: Improving Service Availability and ED Accessibility
The data presented provide evidence of ED access issues in the use of the NSW ambulance service as well as the high proportion of people who have received prior MH treatment. As ambulance and private vehicle transportation are the most common modes of arrival at the hospital, clinicians should advocate for improved alternative transportation options for individuals with MH needs, particularly in areas with poor public transport. Further data analysis is required to understand ambulance usage in the context of location, urgency and the problem presenting itself. Furthermore, the high proportion of individuals who have received prior MH treatment among consumers emphasises the criticality of early intervention and community support. Specifically, understanding their connection to hospital admissions, presenting concerns such as suicidal thoughts, and factors influencing decisions to leave at their own risk or not wait. Given the substantial number of presentations involving individuals with previous contact or current service utilisation, alongside numerous social‐related cases, additional research is necessary to comprehend the characteristics of these individuals and understand the gap in community healthcare delivery. Likewise, future research of service delivery innovations such as telehealth, virtual care and hospital‐in‐the‐home models should prioritise the incorporation of lived experiences to provide a platform for those who utilise and engage with MH services.
5.3. Recommendation 3: Integration of Machine Learning, Decisional Tools and Innovation
The large volume of data and the complexity of every presentation require further analysis to understand the intricate interactions. Systems need to be developed to promote the identification of care requirements and forecast the appropriate care trajectory. With the significant increase in the demand for care, clinicians must turn towards tools to enhance and support decision‐making (Higgins et al. 2023). Recent advances in Machine Learning (ML) may offer the opportunity to discover critical factors and complex interactions for people experiencing mental health problems. It is recommended that further research be conducted using ML to aid the discovery of service delivery complexity and promote clinical decision support when working with vulnerable populations (Gregor et al. 2023).
6. Limitations
Several limitations to this study should be noted. First, a unique person identifier was not included in the dataset under analysis, which made it impossible to establish if a person had presented once or multiple times. The presenting problem data captured the primary problem and did not allow for complex interactions or diagnosis. The data did not include the legal status of ambulance and police presentations. The study did not include after‐hours MH presentations that did not go directly to the ED, such as police arriving directly to the MH unit or direct community admissions. Due to the way that the data are coded and sourced, not all MH presentations may be coded correctly and may not be present in the data. Likewise, there may be instances where an individual may present and be coded as an MH problem initially but require non‐mental healthcare, and the MH team may not have direct input while they are in ED, such as for a person presenting with intoxication. Finally, it is essential to note that data input and coding may have varied from site to site, which could have introduced inconsistencies in the data. These limitations should be considered when interpreting the findings of this study and may impact the generalisability of the results.
7. Conclusion
In conclusion, investigating MH‐related ED presentations on the Central Coast of NSW, Australia, has revealed several insights. Dominant help‐seeking dynamics for MH conditions in ED are characterised by two main themes: Suicidal ideation and access and egress pathways. A high proportion of consumers had previously accessed MH services, demonstrating the high demand within the community for MH services, with the most common presenting problem being suicidal ideation. Finally, there are significant differences in the mode of arrival at the hospital between Site B and Site A, with Site B receiving more ambulance presentations, highlighting possible access issues for an already disadvantaged population. Future research should focus on three distinct themes: The high prevalence of suicidal ideation and the significant risk associated with departures from emergency departments underscores the importance of implementing safety plans for individuals in suicide‐related distress across different clinical settings and delivery methods. Second, integrative and holistic models of care target primary health and social care providers together with public community MH services in response to the identified gaps in service delivery for people seeking MH care in ED need to be developed. Finally, the complexity and volume of data in mental healthcare necessitate further analysis and the development of ML systems to identify care requirements, forecast care trajectory, enhance decision‐making, and discover critical factors and interactions, thereby promoting clinical decision support and service delivery understanding.
Author Contributions
O.H. – concept development, project design, data collection, data analysis, manuscript preparation. R.B.S.‐R. – data analysis, contribution to manuscript. S.K.C. – data analysis, contribution to manuscript, supervision of project. R.L.W. – concept development, project design, data collection, data analysis, manuscript contribution, supervision of project.
Ethics Statement
Ethical approval was granted by the Hunter New England Human Research Ethics Committee 2022/ETH01597. Central Coast Local Health District granted site‐specific approval 2022/STE03296.
Conflicts of Interest
Prof. R.L.W. is an Editorial Board Member of International Journal of Mental Health Nursing.
Acknowledgements
Authors would like to acknowledge the support of Central Coast Local Health District. Open access publishing facilitated by RMIT University, as part of the Wiley ‐ RMIT University agreement via the Council of Australian University Librarians.
Funding: Partial financial support was received from the NSW Ministry of Health as part of the Towards Zero Suicides initiative.
Data Availability Statement
The data that support the findings of this study are available on request from the corresponding author. The data are not publicly available due to privacy or ethical restrictions.
References
- Australian Bureau of Statistics . 2021a. “2021 Census All Persons QuickStats Central Coast (NSW).” https://abs.gov.au/census/find‐census‐data/quickstats/2021/LGA11650.
- Australian Bureau of Statistics . 2021b. “Estimates of Aboriginal and Torres Strait Islander Australians.” ABS . https://www.abs.gov.au/statistics/people/aboriginal‐and‐torres‐strait‐islander‐peoples/estimates‐aboriginal‐and‐torres‐strait‐islander‐australians/latest‐release.
- Australian Institute of Health and Welfare . 2021. “Emergency Department Care.” https://www.aihw.gov.au/reports‐data/myhospitals/sectors/emergency‐department‐care.
- Australian Institute of Health and Welfare . 2022. “Mental Health Services in Australia.” https://www.aihw.gov.au/reports/mental‐health‐services/mental‐health‐services‐in‐australia/report‐contents/emergency‐department‐mental‐health‐services.
- Berendsen Russell, S. , Dinh M. M., and Bell N.. 2017. “Triage, Damned Triage… and Statistics: Sorting out Redundancy and Duplication Within an Emergency Department Presenting Problem Code Set to Enhance Research Capacity.” Australasian Emergency Nursing Journal 20, no. 1: 48–52. 10.1016/j.aenj.2016.09.004. [DOI] [PubMed] [Google Scholar]
- Bureau of Health Information . 2022. “Technical Supplement Emergency Department, Ambulance, Admitted Patients, Seclusion and Restraint, and Elective Surgery.” Bureau of Health Information. https://www.bhi.nsw.gov.au/__data/assets/pdf_file/0009/715194/BHI_HQ47_OCT‐DEC_2021_TECH_SUPP.pdf.
- Central Coast Local Health District . 2017. “Clinical Services Plan 2017–2022.” https://www.cclhd.health.nsw.gov.au/wp‐content/uploads/CCLHDClinicalServicesPlan2017‐2022.pdf.
- Clarke, D. E. , Dusome D., and Hughes L.. 2007. “Emergency Department From the Mental Health Client's Perspective.” International Journal of Mental Health Nursing 16, no. 2: 126–131. 10.1111/j.1447-0349.2007.00455.x. [DOI] [PubMed] [Google Scholar]
- Digel Vandyk, A. , Young L., MacPhee C., and Gillis K.. 2018. “Exploring the Experiences of Persons Who Frequently Visit the Emergency Department for Mental Health‐Related Reasons.” Qualitative Health Research 28, no. 4: 587–599. 10.1177/1049732317746382. [DOI] [PubMed] [Google Scholar]
- Duggan, M. , Harris B., Chislett W. K., and Calder R.. 2020. “Nowhere Else to Go: Why Australia's Health System Results in People With Mental Illness Getting ‘Stuck’ in Emergency Departments.” Mitchell Institute Commissioned Report 2020, Victoria University. https://vuir.vu.edu.au/41956/1/nowhere‐else‐to‐go‐people‐mental‐illness‐stuck‐emergency‐departments‐report‐mitchell‐institute.pdf.
- Ferguson, M. , Rhodes K., Loughhead M., McIntyre H., and Procter N.. 2022. “The Effectiveness of the Safety Planning Intervention for Adults Experiencing Suicide‐Related Distress: A Systematic Review.” Archives of Suicide Research 26, no. 3: 1022–1045. 10.1080/13811118.2021.1915217. [DOI] [PubMed] [Google Scholar]
- Fonseca Barbosa, J. , and Gama Marques J.. 2023. “The Revolving Door Phenomenon in Severe Psychiatric Disorders: A Systematic Review.” International Journal of Social Psychiatry 69, no. 5: 1075–1089. 10.1177/00207640221143282. [DOI] [PMC free article] [PubMed] [Google Scholar]
- Góngora Alonso, S. , Herrera Montano I., Ayala J. L. M., Rodrigues J. J. P. C., Franco‐Martín M., and de la Torre Díez I.. 2023. “Machine Learning Models to Predict Readmission Risk of Patients With Schizophrenia in a Spanish Region.” International Journal of Mental Health and Addiction. 10.1007/s11469-022-01001-x. [DOI] [Google Scholar]
- Gregor, S. , Gunawardena M., Imran A., Okai‐Ugbaje S., Page Jeffery C., and Wilson R.. 2023. “Indigenous Knowledge‐Sharing Interventions in Australia and the Use of Information and Communication Technology: A Scoping Review.” Australasian Journal of Information Systems 27. 10.3127/ajis.v27i0.4217. [DOI] [Google Scholar]
- Higgins, O. , Short B. L., Chalup S. K., and Wilson R. L.. 2023. “Artificial Intelligence (AI) and Machine Learning (ML) Based Decision Support Systems in Mental Health: An Integrative Review.” International Journal of Mental Health Nursing 32: 966–978. 10.1111/inm.13114. [DOI] [PubMed] [Google Scholar]
- Kang, H. 2013. “The Prevention and Handling of the Missing Data.” Korean Journal of Anesthesiology 64, no. 5: 402–406. 10.4097/kjae.2013.64.5.402. [DOI] [PMC free article] [PubMed] [Google Scholar]
- Liamputtong, P. 2021. Research Methods and Evidence‐Based Practice. Docklands, Australia: Oxford University Press Australia & New Zealand. [Google Scholar]
- Morphet, J. , Innes K., Munro I., et al. 2012. “Managing People With Mental Health Presentations in Emergency Departments—A Service Exploration of the Issues Surrounding Responsiveness From a Mental Health Care Consumer and Carer Perspective.” Australasian Emergency Nursing Journal 15, no. 3: 148–155. 10.1016/j.aenj.2012.05.003. [DOI] [PubMed] [Google Scholar]
- NSW Health . 2013. “Triage of Patients in NSW Emergency Departments.” https://www1.health.nsw.gov.au/pds/ActivePDSDocuments/PD2013_047.pdf.
- NSW Health . 2019. “Declared Mental Health Facilities.” https://www.health.nsw.gov.au/mentalhealth/services/consumers/Pages/facilities.aspx.
- NSW Health . 2021. “Emergency Department Care.” https://www.health.nsw.gov.au/Performance/Pages/emergency.aspx.
- NSW Health . 2023. “High or Very High Psychological Distress in Adults by LHD.” https://www.healthstats.nsw.gov.au/#/indicator?name=‐men‐hidistress‐phs&location=LHD&view=Trend&measure=prevalence&groups=&compare=LHD&filter=LHD,All%20LHDs,Central%20Coast%20LHD.
- Nuij, C. , van Ballegooijen W., de Beurs D., et al. 2021. “Safety Planning‐Type Interventions for Suicide Prevention: Meta‐Analysis.” British Journal of Psychiatry 219, no. 2: 419–426. 10.1192/bjp.2021.50. [DOI] [PubMed] [Google Scholar]
- Perera, J. , Wand T., Bein K. J., et al. 2018. “Presentations to NSW Emergency Departments With Self‐Harm, Suicidal Ideation, or Intentional Poisoning, 2010–2014.” Medical Journal of Australia 208, no. 8: 348–353. 10.5694/mja17.00589. [DOI] [PubMed] [Google Scholar]
- Sara, G. , Wu J., Uesi J., et al. 2022. “Growth in Emergency Department Self‐Harm or Suicidal Ideation Presentations in Young People: Comparing Trends Before and Since the COVID‐19 First Wave in New South Wales, Australia.” Australian and New Zealand Journal of Psychiatry 57, no. 1: 58–68. 10.1177/00048674221082518. [DOI] [PMC free article] [PubMed] [Google Scholar]
- Sperandei, S. , Page A., Bandara P., et al. 2022. “The Impact of the COVID‐19 Pandemic on Hospital‐Treated Self‐Harm in Sydney (Australia).” Australian and New Zealand Journal of Psychiatry 56, no. 11: 1515–1522. 10.1177/00048674211068393. [DOI] [PubMed] [Google Scholar]
- The Independent Pricing and Regulatory Tribunal of NSW . 2015. “Efficiency of NSW Public Transport Services.” C. f. I. Economics. https://www.ipart.nsw.gov.au/sites/default/files/documents/consultant_report_‐_cie_‐_efficiency_of_nsw_public_transport_services_‐_december_2015.pdf.
- Vigod, S. N. , Kurdyak P. A., Dennis C.‐L., et al. 2013. “Transitional Interventions to Reduce Early Psychiatric Readmissions in Adults: Systematic Review.” British Journal of Psychiatry 202, no. 3: 187–194. 10.1192/bjp.bp.112.115030. [DOI] [PubMed] [Google Scholar]
- Wand, T. , D'Abrew N., Barnett C., Acret L., and White K.. 2015. “Evaluation of a Nurse Practitioner‐Led Extended Hours Mental Health Liaison Nurse Service Based in the Emergency Department.” Australian Health Review 39, no. 1: 1–8. 10.1071/AH14100. [DOI] [PubMed] [Google Scholar]
- Wardrop, R. , Ranse J., Chaboyer W., Young J. T., Kinner S. A., and Crilly J.. 2023. “Profile and Outcomes of Emergency Department Mental Health Patient Presentations Based on Arrival Mode: A State‐Wide Retrospective Cohort Study.” Journal of Emergency Nursing 49, no. 6: 951–961. 10.1016/j.jen.2023.06.015. [DOI] [PubMed] [Google Scholar]
Associated Data
This section collects any data citations, data availability statements, or supplementary materials included in this article.
Data Availability Statement
The data that support the findings of this study are available on request from the corresponding author. The data are not publicly available due to privacy or ethical restrictions.