

Abstract
The present study aimed to characterize the changes in macromolecular composition and structure in ileal tissue induced by postoperative prolonged starvation (PS), human breast milk feeding (HM) and commercial formula feeding (CF) for 48 and 72 h (h). Forty-two Wistar albino rats underwent an ileal transection and primary anastomosis and were then divided into six subgroups. Two groups of seven rats were food-deprived for 48 and 72 h with free access to water only in metabolic cages (48 h PS, 72 h PS). Then, two groups of seven rats received early enteral trophic nutrition (EEN) either using HM, and CF at 48 h post-operation (48 h HM, 48 h CF). The other two groups of seven rats received the same trophic enteral nutrition at 72 h post-operation (72 h HM, 72 h CF). An additional seven rats were fed normal rat chow (control), after which the ileal tissues were harvested and freeze-dried overnight. Then sample spectra were recorded by Fourier transform infrared (FTIR) spectroscopy. PS at 48 and 72 h resulted in an increase in the concentration of lipids and a decrease in the concentration of proteins. CF and HM trophic feeding induced a decrease in membrane fluidity and an increase in lipid order. Ileal tissues showed similar compositional and structural changes in lipids and proteins in the PS and CF groups after 48 and 72 h. A marked decrease in nucleic acid concentration was seen in CF at 48 h compared to HM. The human milk feeding groups did not induce any significant alterations and showed compositional and structural data similar to the controls. In conclusion, EEN application seems to be safer when introduced at 48 h rather than 72 h and time of this nutrition is crucial to maintain ileum structure and therefore immunity and well-being. HM-induced trophic nutrition is seen to protect the ileal tissue from significant alterations within lipid and protein compositions, whereas CF caused notable changes. HM is absolutely the best nutritional source for gut health in this animal model.
Keywords: Ileum, Lipid, Protein, DNA, RNA, FTIR
Subject terms: Infrared spectroscopy, Intestinal diseases
Introduction
Postpartum adequate neonatal nutrition is mandatory during the first week of life, to obtain essential support regarding neurologic, cognitive and gastrointestinal development, as well as somatic growth, metabolic homeostasis and prevention of infections1,2. Congenital anomalies cause 240,000 annual deaths during neonatal period globally3. These are generally portrayed as gastrointestinal system anomalies with symptoms of intestinal obstruction and emesis at birth or shortly after4. Prompt diagnosis and surgical treatment are required to prevent related complications and mortality5. Neonates confront inadequate caloric intake and risk of starvation after abdominal operations, due to prolonged restriction of solid and fluid intake, which prevent possible anastomotic complications during the so-called recovery period of bowel physiology6–8.
The timing of the initial enteral feeding is important to prevent adverse outcomes due to nutritional deficiency, such as increased rate of infection, delayed wound healing or possible anastomotic failure9–11. The duration of the mentioned fasting period may change according to type of operation and may be applied for up to five days7. Pediatric surgeons have different in their preferred and practiced approach to initiating post-operative feeding. Some prefer delayed enteral nutrition, while others apply early enteral nutrition (EEN)11–13. Human breast milk feeding (HM) is the most recommended choice in the practice of EEN11,14. It is known to provide improved immunity15, decreased mortality risk16, and decreased fat storage17, due to complex and unique essential ingredients and bioactive molecules resulting in positive outcome. In case of insufficiency in breast milk, commercial formula (CF) is preferred as the choice of nutrient2.
Numerous spectroscopic tools have been utilized recently to analyze the content and effect of breast milk and commercial formula. Moros et al.18 used Raman spectroscopy for quantitative determination of nutritional parameters of powdered milk and infant formula. Lugonja et al.19 compared the effect of mature breast milk vs. standard infant formulas on non-vascular smooth muscle contraction and their antioxidative properties using electron paramagnetic resonance (EPR) spectroscopy. Scano et al.20 applied gas chromatography electronic impact mass spectrometry (GC–MS) and showed that the metabolite profiles of infant formula differed greatly from breast milk. Garwolińska et al.21 demonstrated the qualitative and quantitative differences between the composition of HM and CF and suggested improvement in the content of CF. So far only a small number of studies published have investigated the nutritional analysis of HM and CF with the help of Fourier Transform Infrared spectroscopy (FTIR)22–24. FTIR is a sensitive, automated and rapid analytical tool that provides molecular fingerprint information25,26. To the best of our knowledge, the present study is the first use FTIR spectroscopy for determining the alterations in the content and function of biomolecules of mice ileum tissue due to prolonged starvation and structure–function relationships. A comparison is made of 48- and 72-h early trophic enteral feedings with breast milk and commercial formula.
Results
The present study was conducted, for the first time, to compare the effects of postoperative early enteral feeding using either HM or CF vs. prolonged starvation on mice ileal tissue by FTIR spectroscopy. For better visualization of spectral differences between the studied groups, the mean spectra of the fasted, HM and CF feeding groups for 48 and 72 h were shown in the 3010 to 2800 cm−1 and 1800 to 1000 cm−1 spectral regions (Fig. 1). As seen from Fig. 1, there are clear differences among the spectra of the studied groups.
Figure 1.

Representation of the (A) C-H vibration region. (B) Fingerprint region of the control, PS, HM and CF with 48 h and 72 h samples spectra. The spectra were normalized according to the Amide A band after baseline correction for visual demonstration of the changes.
The definition and assignment of the spectral bands originating from biomolecules including the lipid, protein and nucleic acid functional groups used in this study for the analysis are given in Table 1.
Table 1.
| Wavenumber (cm−1) | Band assignment |
|---|---|
| 3008 | Olefinic –C=CH stretching vibration of unsaturated fatty acids |
| 2956 | CH3 antisymmetric stretching: protein, lipid |
| 2926 | CH2 antisymmetric stretching: mainly lipid |
| 2872 | CH3 symmetric stretching: mainly protein |
| 2854 | CH2 symmetric stretching: mainly lipid |
| 1742 | Ester C=O stretching: triglyceride, cholesterol esters |
| 1653 | Amide I band mainly due to C=O stretching vibration of amide groups: protein |
| 1543 | Amide II band due to N–H bending strongly coupled to C–N stretching vibration of amide groups: protein |
| 1233 | PO2– asymmetric stretching: mainly nucleic acid with a little contribution of phospholipids |
| 1117 | C–O stretching: RNA |
| 1079 | PO2− symmetric stretching: nucleic acid and phospholipids |
| 1046 | C–O stretching: carbohydrates (glucose) |
| 967 | DNA |
The signal intensities and/or the areas under the infrared (IR) bands originating from the functional groups of related molecules seen in the spectra of the experimental groups is directly proportionate to its concentration27. Therefore, the areas under the IR bands were used to calculate the relative concentrations of the biomolecules. To obtain robust and reliable results, band area ratios of IR bands were computed for spectral characterization. Table 2 demonstrates the area ratios and their indications that were utilized for spectral evaluation.
Table 2.
The area ratios of the IR bands and their indications.
| Area ratio | Biomolecular origin* | Indication |
|---|---|---|
| A3008/A2926 | Olefinic –C=CH υ/CH2 as υ | Unsaturation index |
| A2854/A2926+2854 | CH2 s υ/(CH2 as υ + CH2 s υ) | Saturated lipids concentration |
| A2926/A2956 | CH2 as υ/CH3 as υ | Aliphatic chain length |
| A1653/A1653+1543 | amide I/amide I + amide II | Protein concentration |
| A2926+2854/A1653+1543 | (CH2 as υ + CH2 s υ)/(amide I + amide II) | Lipid/protein |
| A1742/A2926+2854 | ester C═O υ/(CH2 as υ + CH2 s υ) | Triglyceride-cholesterol ester Concentration |
| A1046/A1653+1543 | C––O υ/(amide I + amide II) | Glucose/protein |
| A1233+1079/A1653+1543 | (PO2– s υ + PO2– as υ)/ (amide I + amide II) | Nucleic acid/protein |
| A1233/A2956 | PO2– s υ/CH3 as υ | Protein phosphorylation |
| A967/A1233+1079+967 | DNA/(PO2– s υ + PO2– as υ + DNA) | DNA concentration |
| A1117/A1233+1079+1117 | RNA/PO2– s υ + C–O υ + RNA | RNA concentration |
| A1117/A967 | RNA/DNA | RNA/DNA |
as antisymmetric, s symmetric, υ stretching.
The results of the IR band area ratios are given in Figs. 2 and 3. The unsaturation index (Olefinic –C=CH υ/CH2 as υ) which indicates the content of double bonds in the lipid structure were found to have decreased in the 48 h PS (p < 0.05) compared to the control, increased in the 48 h HM (p < 0.01) compared to the 48 h PS and decreased significantly in the 48 h CF groups (p < 0.05) compared to the 48 h HM groups (Fig. 2A). An insignificant increased Olefinic –C=CH υ/CH2 as υ ratio was also observed in the 72 h PS group with respect to the control, 72 h HM and CF groups (Fig. 3A).
Figure 2.

Band area ratio value of (A) unsaturation index, (B) saturated lipid concentration, (C) aliphatic chain length, (D) protein concentration, (E) lipid/protein, (F) triglyceride-cholesterol ester concentration, (G) glucose/protein, (H) nucleic acid/protein, (I) protein phosphorylation, (J) DNA concentration, (K) RNA concentration and (L) RNA/DNA for the control, 48 h HM, 48 h PS and 48 h CF groups. The degree of significance was indicated as: *p < 0.05, **p < 0.01, ***p < 0.001 and ****p < 0.0001.
Figure 3.

Band area ratio value of (A) Unsaturation index, (B) saturated lipid concentration, (C) aliphatic chain length, (D) protein concentration, (E) lipid/protein, (F) Triglyceride-cholesterol ester concentration, (G) glucose/protein, (H) nucleic acid/protein, (I) protein phosphorylation, (J) DNA concentration, (K) RNA concentration and (L) RNA/DNA for the control, 72 h HM, 72 h PS and 72 h CF groups. The degree of significance was indicated as: *p < 0.05, **p < 0.01, ***p < 0.001 and ****p < 0.0001.
The alterations in the saturated lipid concentration, qualitative lipid acyl chain length, lipid/protein content and triglyceride-cholesterol ester were determined by CH2 s υ/(CH2 as υ + CH2 s υ) ratio, CH2 as υ/CH3 as υ ratio, (CH2 as υ + CH2 s υ)/(amide I + amide II) ratio and ester C═O υ/(CH2 as υ + CH2 s υ) ratio, respectively. Saturated lipid concentration was insignificantly higher in 48 h PS with respect to the control group and significantly lower in the 48 h HM (p < 0.05) and 48 h CF (p < 0.01) groups compared to 48 h PS group (Fig. 2B). All other mentioned parameters (qualitative lipid acyl chain length, lipid/protein content and triglyceride-cholesterol ester) were found to be significantly higher for the 48 h PS in comparison to the control (p < 0.01, p < 0.01, p < 0.0001, respectively), 48 h HM (p < 0.01, p < 0.01, p < 0.0001, respectively) and 48 h CF groups (p < 0.01, p < 0.01, p < 0.0001, respectively) (Fig. 2C, E and F). No considerable differences were determined between the 48 h HM and 48 h CF feeding groups in these ratios.
A similar increase in lipid content was also obtained in the 72 h PS group (Fig. 3B, C, E, and F), but it was not as remarkable as in the 48 h PS group. Important changes were detected only in the triglyceride-cholesterol ester value (p < 0.05) in 72 h PS compared to the control group (Fig. 3F). When 72 h PS were compared to 72 h HM and 72 h CF, unlike 72 CF, the markedly reduced values were observed in 72 h HM for saturated lipids (p < 0.05) (Fig. 3B), lipid acyl chain length (p < 0.01) (Fig. 3C), lipid/protein (p < 0.01) (Fig. 3E) and triglyceride-cholesterol ester (p < 0.01) (Fig. 3F). 72 h CF showed significantly higher values with respect to 72 h HM in aliphatic chain length (more acyl—CH2, less methyl—CH3) (p < 0.01) (Fig. 3C), lipid/protein ratio (p < 0.05) (Fig. 3E), and triglyceride-cholesterol ester content (p < 0.05) (Fig. 3F).
The amide I/amide I + amide II band area ratio gives information about the total protein concentration. This ratio was insignificantly lower in the 48 h PS and compared to the control, 48 h HM and 48 h CF groups (Fig. 2D). However, it was significantly lower in 72 h PS (p < 0.01) and 72 h CF (p < 0.05) groups in comparison to the control group. In addition, an important increase in total protein concentration was detected in 72 h HM with regards to 72 h PS (p < 0.01) and 72 h CF groups (p < 0.01) (Fig. 3D).
The band area ratio of the glucose/protein (C–O υ/(amide I + amide II) gives information about glucose concentration in the ileum. No significant changes were obtained in this ratio for the 48 h PS (Fig. 2G) and 72 h PS groups (Fig. 3G) relative to the control. This ratio was significantly higher in the 48 h HM compared to the control (p < 0.05), 48 h PS group (p < 0.01) and 48 h CF groups (p < 0.05) (Fig. 2G). In the 72 h groups important increases in the ratio of glucose/protein were observed in 72 h HM (p < 0.01) and 72 h CF (p < 0.05) groups in comparison to the 72 h PS group (Fig. 3G).
Alterations in the protein phosphorylation were evaluated by taking the ratio of the PO2– s/CH3 as υ. This ratio was insignificantly increased in the 48 h PS and markedly decreased in the 48 h CF (p < 0.01) group in comparison to the control group. The 48 h HM (p < 0.01) and 48 h CF (p < 0.0001) groups showed lower value for the ratios of the PO2– s/CH3 as υ with respect to the 48 h PS group indicating a decrease in protein phosphorylation30. Moreover, this ratio showed a considerable decrease in the 48 h CF (p < 0.05) compared to the 48 h HM group. In the 72 h treated group, no remarkable differences were determined for this ratio (Fig. 3I).
The ratio of (PO2– s υ + PO2– as υ)/(amide I + amide II) provides information about the changes in nucleic acid content. This ratio was significantly higher in the 48 h PS group (p < 0.05) and lower in the 48 h HM (p < 0.001) and 48 h CF (p < 0.01) compared to the control groups (Fig. 2H). A considerable decrease was also found in nucleic acid content in the 48 h HM (p < 0.001) and 48 h CF (p < 0.001) compared to the 48 h PS group. However, no significant alteration was observed among the control, 72 h PS, 72 h HM and 72 h CF group (Fig. 3H).
The alterations in nucleic acid content were also investigated using the DNA concentration (Fig. 2J), RNA concentration (Fig. 2K), and RNA/DNA ratio (Fig. 2L). Significantly higher values were observed in the 48 h PS group with respect to the control group for RNA concentration (p < 0.001) (Fig. 2K) and RNA/DNA ratios (p < 0.05) (Fig. 2L), which imply an increased nucleic acid concentration in the 48 h PS group. The DNA content was remarkably lower only in the 48 h CF group compared to the control (p < 0.05) and 48 h PS (p < 0.05) groups. However, RNA concentration was significantly higher in the 48 h PS (p < 0.001) and 48 h HM (p < 0.05) groups compared to the control group. This parameter was found to be decreased in the 48 h HM (p < 0.05) and 48 h CF (p < 0.001) groups with respect to the 48 h PS group. In addition, noticeable decrease was also observed in RNA concentration for 48 h CF group (p < 0.001) in comparison to the 48 h HM group (Fig. 2K). The RNA/DNA ratio was shown similar pattern as RNA concentration. This ratio was significantly higher in the 48 h PS (p < 0.05) and 48 h HM (p < 0.05) groups compared to the control group and lower in the 48 h CF (p < 0.05) group with regards to the 48 h PS group (Fig. 2L).
An insignificant decrease in the DNA concentration for the 72 h PS with respect to the control and prominent increases in the 72 h HM (p < 0.001) and 72 h CF (p < 0.05) groups compared to the 72 h PS group were observed. Furthermore, a noticeable decrease was detected in this parameter for the 72 h CF (p < 0.05) in comparison with the 72 h HM group (Fig. 3J).
RNA concentration and RNA/DNA ratios illustrated similar behavior and were found to be significantly lower for the 72 h HM (p < 0.01, p < 0.001, respectively) with respect to the 72 h PS and higher for the 72 h CF in comparison to the control (p < 0.05, p < 0.01, respectively), 72 h PS (p < 0.05, p < 0.01, respectively) and 72 h HM groups (p < 0.001, p < 0.0001, respectively) (Fig. 3K, L).
The positions of CH2 symmetric and antisymmetric stretching bands can be used to determine the structural changes of lipids indicating order/disorder status (the trans/gauche isomerization degree) in the system. Shifting to higher frequency implies decreased lipid order (disorder), which causes increased acyl chain flexibility. If it shifts to lower frequency values lipid order increases i.e., acyl chain flexibility decreases26,31. As seen from the Fig. 1A and Fig. 4A, the CH2 antisymmetric stretching band frequency insignificantly shifted to a lower value in all 48 h treated groups compared to the control group, implying an increase in membrane lipid order, e.g., a decrease in acyl chain flexibility. A noticeable shift to lower frequency of the same band in 72 h PS (p < 0.05) with respect to control and a shift to a higher frequency in the 72 h HM (p < 0.01) in comparison to 72 h PS group were also detected. Moreover, the significant shifting of the CH2 antisymmetric stretching band to a lower frequency in the 72 h CF (p < 0.05) relative to the 72 h HM group was also observed (Fig. 5A).
Figure 4.
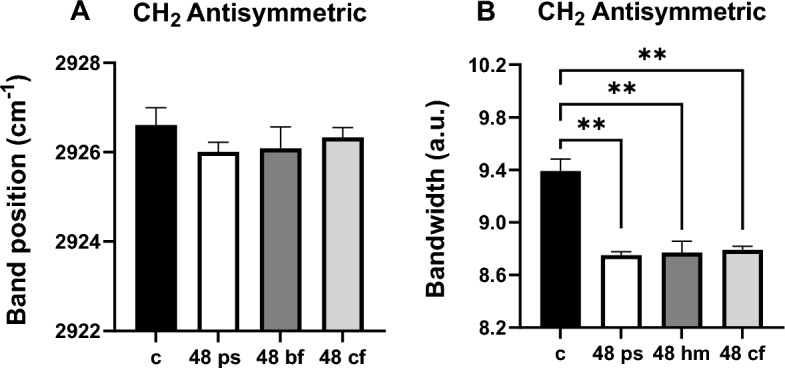
Comparison of CH2 antisym. stretching (A) band position and (B) bandwidth values for the control, 48 h PS, 48 h HM, and 48 h CF groups. The degree of significance was indicated as: **p < 0.01.
Figure 5.
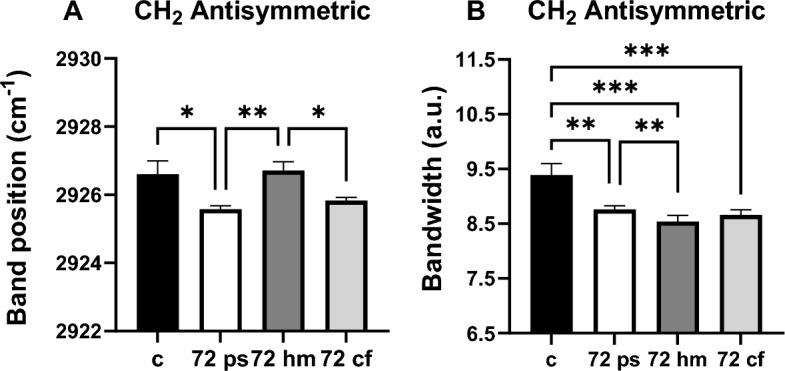
Comparison of CH2 antisym. stretching (A) band position and (B) bandwidth values for the control, 72 h PS, 72 h HM, and 72 h CF groups. The degree of significance was indicated as: *p < 0.05, **p < 0.01, and ***p < 0.001.
The bandwidth of CH2 antisymmetric or symmetric stretching bands gives information about the membrane fluidity and dynamics since it is related to the motional rates of the lipid molecule26. There was a prominent decrease in the bandwidth of CH2 antisymmetric bands of all 48 h HM (p < 0.01), 48 h PS (p < 0.01), and 48 h CF (p < 0.01) groups compared to the control group, which indicates a significant decrease in lipid dynamics and/or fluidity (Fig. 4B). A similar result was obtained in this parameter for the72h PS (p < 0.01), 72 h HM (p < 0.001) and 72 h CF (p < 0.001) groups compared to the control. A decreased CH2 antisymmetric bandwidth value was also seen in the 72 h HM group (p < 0.01) with respect to the 72 h PS group (Fig. 5B).
Discussion
In the current research, we focused on the protection and nourishment of the intestinal infrastructure in an animal model based on our previous study11. In that study, it was demonstrated that there are significant benefits of commencing breast milk during postoperative early trophic enteral nutrition. Since the mice were fed for a noticeably short period of time (48 and 72 h), we did not consider measuring body weight or intestinal weight. It is known that in mature or neonatal animals subjected to total parenteral nutrition or intestinal overriding, body composition is maintained; however, the length of the intestines decreases, and gastric and pancreatic hypoplasia ensues32.
Contrary to recent increased awareness concerning newborn postoperative early trophic enteral nutrition, resistance exists among pediatric surgeons12,33. Human milk is the best source of cellular fuel and nutrients for growth and development, due to its unique ingredients, microelements, antimicrobial factors, growth hormones and factors thus endorsing a direct trophic effect on the intestinal mucosa34,35. CF is widely advocated as an ideal substitute containing all essential nutrients when human milk is inadequate. CF, however, differs in terms of type of macronutrients and bioactive factors36. The results of FTIR analysis supported this finding and revealed that the content and structure of ileum tissue biomolecules were mainly affected by CF and PS in the 48 h and 72 h groups compared to the control groups. Longer hydrocarbon acyl chains of lipids, higher lipid and/or lower protein and glucose concentrations were detected in the 48 h and 72 h prolonged starvation groups. In general, 48 h PS showed an opposite effect with regard to the 48 h HM and 48 h CF groups, in the calculated parameters related to biomolecules content. In addition, a longer lipid acyl chain and decreased lipid dynamic/fluidity, higher nucleic acid and RNA concentration were observed in the 48 h PS group compared to the control groups. In the 48 h EEN practices, a lower saturated lipid and DNA concentration, shorter lipid acyl chains and lower protein phosphorylation were observed in the CF groups compared to the control groups. No significant changes were detected in the mentioned parameters for the HM group compared to the control group. A diminished triglyceride cholesterol ester and nucleic acid concentrations were found in 48 h HM and CF groups. In addition, higher glucose and RNA concentrations were seen in the 48 h HM group. Considering these results, it may be concluded that 48 h HM has a greater compensating effect than the 48 h CF feeding in 48 h prolonged starvation. Comparable results were also observed in 72 h PS with respect to the 72 h HM groups. However, 72 h PS and 72 h CF displayed changes in the same direction in the parameters of saturated lipid concentration, aliphatic chain length, protein concentration, lipid/protein ratio, triglyceride-cholesterol ester concentration, DNA concentration, RNA concentration and RNA/DNA ratio, which were all completely opposite to the results of the 72 h HM group.
Carbohydrate stores are utilized predominantly during energy consumption to survive starvation. Glucose oxidation decreases within 24 h of starvation, with mutual increase in lipolysis and FA oxidation37,38. In the case of diminished carbohydrate stores, required energy is primarily provided by fat and protein metabolization39. Enterocytes additionally secrete cholesterol and phospholipids as components of high-density apoB-free/apoAI-containing lipoproteins40. During 48 h PS, we observed an insignificant decrease in glucose and protein but a significant decrease in unsaturated fat concentrations. Noticeable increases in lipid/protein ratio, aliphatic chain length and triglyceride-cholesterol ester content, however, were detected together with markedly decreased lipid dynamics/fluidity. A similar pattern in the content of glucose, protein and lipid parameters were observed in 72 h PS. Therefore, a simultaneous increase in lipid concentration (including a higher chain length in lipids) indicate elevated lipolysis to confront energy requirements and result in non-esterified fatty acid accumulation41.
Protein breakdown is increased not only during PS42 but also in cases with specific abdominal surgery43. Hence, increased lipid/protein ratio along with decreased protein concentration may reflect protein degradation in 48 h and 72 h PS groups. Protein synthesis is additionally diminished under stress-induced conditions like starvation, which plays a role in stress protein–RNA granules (SG) formation44. Reineke et al.44 reported SGs formation and the importance of eIF2α phosphorylation for its activity in prolonged nutrient starvation (16 h). SGs formation was also indicated in terms of serum glucose, glutamine and pyruvate depletion. These observations are consistent with our 48 h PS finding, which includes an insignificant increase in protein phosphorylation, a significant increase in RNA concentration and a noticeable decrease in glucose concentration. Such starvation-induced phosphorylation and autophagocytotic activation were reported in previous studies45–47. In 72 h PS group, an insignificantly decreased protein phosphorylation was also observed. Thus, the protein phosphorylation process may be affected differently depending on the period of starvation.
It is well known that infrared spectroscopy is a very powerful technique for measuring membrane permeability as reported in previous studies48–51. Lipid order (lipid acyl chain flexibility) is a structural parameter and directly related to membrane thickness. Lipid dynamics is a functional parameter related to membrane fluidity and permeability52. FTIR spectroscopy has been commonly used in comparative studies with biological membranes and tissues, including the analysis of membrane order and permeability51–57. Therefore, this method offers a way to check membrane functions and the status of cell/tissue integrity. Changes in the amount of lipids and/or proteins and the lipid-to-protein ratio affect the membrane thickness and order and hence membrane permeability54,58,59. These changes in the physical properties of membranes, in turn, affect proper cell functioning and signaling60.
Considering the role of proteins and lipids in membrane permeability, their compositional and structural changes suggest that PS disrupts ileum permeability and integrity. Furthermore, loss of protein content may disrupt the intestinal barrier, resulting in leakage between the ileal enterocytes. Diet is a crucial source of energy in maintaining homeostasis and only healthy intestines can absorb water, essential fluids and nutrients, therefore providing an optimal barrier against pathogens61. Disruption of macromolecular content in the ileum may increase the risk of various health complications, further aggravating bacterial translocation.
After the introduction of EEN with 48 h HM and CF, the concentrations of lipid related parameters were decreased, and the concentrations of protein and glucose were increased compared to the 48 h PS. Decreased lipid content indicated the utilization of lipids in response to increased energy demands for the metabolic process. 48 h HM and CF feedings failed to restore the effect of 48 h PS on lipid dynamics/fluidity. However, partially reversible changes in biomolecule content after 48 h PS proved satisfactory. This may show ileum's adjustment to the refeeding process and a systemic compensation potential against the 48 h PS negative outcome.
72 h HM illustrated a pattern similar to 48 h HM for lipid, protein, triglyceride-cholesterol ester and glucose contents, as well as lipid/protein ratio and aliphatic chain length with a noticeable recovery effect. However, 72 h of HM and CF refeeding illustrated the opposite behavior. 72 h CF did not eliminate the effects of 72 h PS on lipid and protein concentration and membrane rigidity. The lower lipid content in 72 h HM (Fig. 3B, E, F) than in 72 h PS implies the increased absorption of lipid from the ileum, whereas higher lipid concentration in 72 h CF signifies a reduced fatty acid transport from the ileum. This dysfunction may be due to reduced protein concentration in the 72 h CF feeding. Several transport proteins in the enterocyte membrane are known to participate in the uptake of distinct types of lipids40. Increased acyl chain length and lipid order may additionally contribute to this lipid accumulation in the ileum. The difference in lipid content of CF from that of HM may also contribute to this effect. Furthermore, decrease in lipid order (disorder) implied increased acyl chain flexibility in the 72 h HM group compared to 72 h PS group. This finding was supported by decreased acyl chain length62 and increased unsaturated fatty acids concentration, which increases membrane fluidity63. Nevertheless, the lipid dynamics/fluidity were found to be decreased in the 72 h HM group with respect to the 72 h PS group. This inconsistency may be due to a lateral phase separation in membranes, wherein probably the most dominant domain with higher dynamics was monitored50.
We observed that the duration of PS altered the concentration of nucleic acids. 48 h PS led to a marked increase in the concentration of nucleic acids (Fig. 2H) in contrast to unnoticeable changes at 72 h (Fig. 3H) when compared to the control ileum. This increase at 48 h may be due to an increased RNA content (Fig. 2K) and free nucleoside because of apoptosis64 rather than a change in DNA content (Fig. 2J). Glutaminase is crucial for intestinal activity in maintaining tissue integrity, absorption of nutrients, providing an intestinal barrier against bacterial translocation65 and regulating the rate of nucleic acid synthesis66. A significant increase in the level of glutaminase mRNA in the jejunal and ileal mucosa along with the unaffected protein and DNA content during 48 h PS was observed previously66. Therefore, increased RNA concentration may have a link to the decrease in lipid dynamics/fluidity, which is important for tissue integrity. Furthermore, Shan et al.67 reported that 24 h starvation induces sirtuin 1 (SIRT1) activation and causes nuclear accumulation of poly(A)RNA to maintain protein synthesis.
RNA and DNA are primary dietary sources of nucleotides, which are broken down to nucleosides and absorbed from the small intestine68. Human milk contains a higher amount of nucleotides compared to those in the milk of ruminant species69–71 and is extremely rich in circulating RNA molecules72. Therefore, it was not surprising to observe higher RNA content in the 48 h HM group than the 48 h CF group. However, 48 h CF led to a marked decrease in DNA content compared to 48 h PS and control ileum tissue. This may indicate efficient absorption of the DNA present in CF (Fig. 2K).
The finding of a decreased DNA concentration in the ileum at 72 h PS is in line with the study of Brown et al.73, who found a similar decrease in DNA synthesis in the intestinal mucosa of 5-day starved mice. A suppressed DNA synthesis and protein concentration in the ileum at 72 h starvation that may be due to inhibition of cell proliferation during fasting was also reported74. In addition, increased apoptosis may be another reason due to the release of dead cell content. The balance between cell proliferation and cell apoptosis affects the cellular turnover rate and regeneration of the entire intestinal epithelium75. Thus, any impairment in the nucleic content may influence the cell proliferation, structure, and function of the ileum.
It has been documented that PS results in intestinal dysfunction via mucosal atrophy due to diminished villous height, crypt depth, surface area and epithelial cell numbers76,77. Gut mucosal integrity, epithelial cell proliferation and mucin synthesis are also affected78. Moreover, absorption capacity and barrier function are disrupted79. 72 h HM and CF led to a marked increase in DNA concentration relative to 72 h PS, which may be due to failure to absorb in 72 h PS.
No significant alteration was seen in RNA content in the 72 h PS group compared to control ileum tissue. However, a marked decrease in HM and a noticeable increase in CF were observed compared to 72 h PS. This finding indicated that RNA was absorbed efficiently in 72 h HM in contrast to 72 h CF. This may be due to the different compositions of breast milk and commercial formula. Human breast milk is rich in nucleotides68,71. Most CFs include bovine milk, which contains less nucleotides with different composition, as a main ingredient80.
Considering all these results, although the HM and CF fed groups at 48 h proved to have similar effects on the ileum tissue biomolecules, the 48 h HM group showed a greater compensating effect than the 48 h CF group in 48 h PS. 72 h PS caused such severe deterioration in the structure and content of ileal tissue that 72 h HM animals showed only partial recovery. In this group, CF was not digested and was accumulated in the ileum without showing any ameliorative effect. These findings indicate that the effect of EEN may change depending on the time of initiation and type of nutrient supply. CF feeding demonstrates inefficient utilization, especially at 72 h PS, mostly due to its complex ingredients. These obtained results show that it may be too late to initiate feeding even at 48 h, since deterioration is already present within the biomolecular content and structure of the ileum during 48 h PS. Therefore, initiating trophic enteral feeding long before 48 h, mainly by HM is recommended for better health of the surgical newborn. Although the content of CF is believed to mimic human milk, it does not seem to provide the crucial type of fatty acids, amino acids, nucleotides, etc. The composition of specific fatty acids may show variations due to maternal factors (i.e., maternal diet, stage of lactation) or compositional differences between applied formula type (i.e., standard preterm, elemental)81. These compositional differences may affect infants’ immunity and well-being.
Conclusion
The result of this study indicated that postoperative EEN with HM and CF after 48 h and 72 h PS showed significant alterations in the composition and structure of biomolecules together with significant increased lipid order and decreased membrane dynamics. Moreover, timing of application and choice of nutrient may affect the health outcome of the infant during trophic EEN. EEN application seems to be beneficial when introduced long before 48 h than at 72 h, and HM is absolutely the best nutritional source for the infant’s gut health. We have shown that FTIR spectroscopy is a valuable technique and provides precise evaluation in determining variations in the content and structure of ileal tissue biomolecules at the molecular level in postoperative EEN.
Material and methods
Animals
Forty-two male Wistar albino rats (100–180 g) were divided into six subgroups (seven rats each). We performed an ileal transection and primary anastomosis; a 3 cm long incision was made on the abdominal midline in each rat. The cecum was externalized and a full-layer enterotomy and primary anastomosis was performed approximately 20 cm proximal to the cecum at the level of the terminal ileum (Fig. 6). Each anastomosis was performed using 6/0 Vicryl inverting sutures and checked for any anastomotic leak.
Figure 6.

Anastomosis of ileum.
Postoperatively the rats were followed in separate metabolic cages with free access to water only. Two groups of seven rats fasted for 48 h (48 h) and 72 h (72 h) separately (PS). Two groups of 14 rats received trophic enteral nutrition (1 ml/h/24) for 24 h, either using human milk (HM) or commercial formula (CF) after 48- and 72-h starvation (seven each). An additional seven rats received normal rat chow (control). The study was approved by the research ethical committee of Kocaeli University, Medical Faculty, Turkey (No. 1231/2003) and was carried out in accordance with the recommendations of the FELASA 3R (Federation of European Laboratory Animals Science Association). Moreover, animal care and all experimental procedures adhered to the ARRIVE (Animal Research: Reporting of In Vivo Experiments) guidelines.
FTIR spectroscopic measurement
The ileal tissues were ground and dried in a MAXI dry lyo freeze drier overnight. Then the samples were mixed with potassium bromide at 1/100 ratio and semitransparent potassium bromide disc (pellet) was prepared using the pressure of 100 kg/cm2 for 6 min. Three pellets were prepared for each sample. FTIR spectroscopy was conducted using the PERKIN ELMER, Spectrum one, FTIR spectrometer equipped with DTGS (deuterated triglycine sulfate) detector. The background spectrum was recorded from empty crystal due to interference of water vapor, and carbon dioxide in the air and were automatically subtracted. The IR spectra of all samples were collected in the 4000–900 cm−1 wavenumber region and 64 scans were taken for each interferogram with 4 cm−1 resolution at room temperature. Three replicas were taken randomly for each sample and were averaged using Perkin Elmer software for further comparison. All the spectral analyses were performed using the same software. The band positions were measured according to center of weight. The spectra were normalized in specific region for visual demonstration of the changes using the same software.
Spectral analysis
The quantitative spectral analyses including spectral band position and bandwidth were calculated from the baseline corrected averaged IR spectra using OPUS software (Bruker, Germany). The band position was determined by the peak position corresponding to the center of weight from the baseline-corrected spectra. The bandwidth values were measured from 0.75 times the height of the absorption spectra in cm−1. The band intensity was measured from the second derivative spectra and the ratio of the intensities of relevant bands was calculated. To visually demonstrate spectral variations between the studied groups, a min–max normalization process was performed based on the amide A band.
Statistics
In order to calculate the statistical significance of the changes between the control and EEN groups with 48 h and 72 h, one-way ANOVA and Brown-Forsythe and Welche Anova test were performed using GraphPad Prism 8.01 (GraphPad Software, Inc.). “p” value ≤ 0.05 was considered as statistically significant. The degree of significance was expressed as less than or equal to p < 0.05*, p < 0.01**, p < 0.001*** and p < 0.0001 ****.
Author contributions
A.D. Experiment design, validation, data acquisition and analysis, writing—original draft preparation, writing—review & editing, visualization. F.S. experiment design, writing—review & editing, supervision. A.T. data acquisition, resources. B.H.G. Conceptualization, experiment design, resources, writing—review & editing, supervision.
Data availability
The datasets generated during and/or analysed during the current study are available from the corresponding author on reasonable request.
Competing interests
The authors declare no competing interests.
Footnotes
Publisher's note
Springer Nature remains neutral with regard to jurisdictional claims in published maps and institutional affiliations.
References
- 1.Tume, L., Latten, L. & Darbyshire, A. An evaluation of enteral feeding practices in critically ill children. Nurs. Crit. Care15(6), 291–299 (2010). [DOI] [PubMed] [Google Scholar]
- 2.Su, B. H. Optimizing nutrition in preterm infants. Pediatr. Neonatol.55(1), 5–13. 10.1016/j.pedneo.2013.07.003 (2014). [DOI] [PubMed] [Google Scholar]
- 3.World Health Organization. https://www.who.int/news-room/fact-sheets/detail/birth-defects. Accessed 19 Jan 2024 (2024).
- 4.Lin, H. H. et al. Congenital webs of the gastrointestinal tract: 20 years of experience from a pediatric care teaching hospital in Taiwan. Pediatr. Neonatol.53(1), 12–17. 10.1016/j.pedneo.2011.11.004 (2012). [DOI] [PubMed] [Google Scholar]
- 5.Global PaedSurg Research Collaboration. Mortality from gastrointestinal congenital anomalies at 264 hospitals in 74 low-income, middle-income, and high-income countries: A multicentre, international, prospective cohort study. Lancet (London, England)398(10297), 325–339. 10.1016/S0140-6736(21)00767-4 (2021). [DOI] [PMC free article] [PubMed] [Google Scholar]
- 6.Lewis, S. J., Egger, M., Sylvester, P. A. & Thomas, S. Early enteral feeding versus “nil by mouth” after gastrointestinal surgery: Systematic review and meta-analysis of controlled trials. BMJ (Clin. Res. Ed.)323(7316), 773–776. 10.1136/bmj.323.7316.773 (2001). [DOI] [PMC free article] [PubMed] [Google Scholar]
- 7.Mattei, P. & Rombeau, J. Review of the pathophysiology and management of postoperative ileus. World J Surg.30, 1382–1391. 10.1007/s00268-005-0613-9 (2006). [DOI] [PubMed] [Google Scholar]
- 8.Greer, D., Karunaratne, Y. G., Karpelowsky, J. & Adams, S. Early enteral feeding after pediatric abdominal surgery: A systematic review of the literature. J. Pediatr. Surg.55(7), 1180–1187. 10.1016/j.jpedsurg.2019.08.055 (2020). [DOI] [PubMed] [Google Scholar]
- 9.Shu, X. L., Kang, K., Gu, L. J. & Zhang, Y. S. Effect of early enteral nutrition on patients with digestive tract surgery: A meta-analysis of randomized controlled trials. Exp. Ther. Med.12(4), 2136–2144. 10.3892/etm.2016.3559 (2016). [DOI] [PMC free article] [PubMed] [Google Scholar]
- 10.Abela, G. The potential benefits and harms of early feeding post-surgery: A literature review. Int. Wound J.14(5), 870–873. 10.1111/iwj.12750 (2017). [DOI] [PMC free article] [PubMed] [Google Scholar]
- 11.Ekingen, G., Ceran, C., Guvenc, B. H., Tuzlaci, A., & Kahraman, H. Early enteral feeding in newborn surgical patients. Nutrition (Burbank, Los Angeles County, Calif.). 21(2), 142–146 10.1016/j.nut.2004.10.003 (2005). [DOI] [PubMed]
- 12.Prasad, G., Subba Rao, J., Aziz, A., Rashmi, T. & Ahmed, S. Early enteral nutrition in neonates following abdominal surgery. J. Neonatal Surg.7(2), 21 (2018). [Google Scholar]
- 13.Solana, M. J. et al. Early vs late enteral nutrition in pediatric intensive care unit: Barriers, benefits, and complications. Nutr. Clin. Pract.38(2), 442–448. 10.1002/ncp.10922 (2023). [DOI] [PubMed] [Google Scholar]
- 14.Eidelman, A. I. & Schanler, R. J. Section on breastfeeding. Breastfeeding and the use of human milk. Pediatrics.129, e827–e841 (2012). [DOI] [PubMed] [Google Scholar]
- 15.Cacho, N. T. & Lawrence, R. M. Innate immunity and breast milk. Front. Immunol.8, 584. 10.3389/fimmu.2017.00584 (2017). [DOI] [PMC free article] [PubMed] [Google Scholar]
- 16.Sankar, M. J. et al. Optimal breastfeeding practices and infant and child mortality: A systematic review and meta-analysis. Acta Paediatr. (Oslo, Norway: 1992) 104(467), 3–13 10.1111/apa.13147 (2015). [DOI] [PubMed]
- 17.Oddy, W. H. Infant feeding and obesity risk in the child. Breastfeed Rev.20(2), 7–12 (2012). [PubMed] [Google Scholar]
- 18.Moros, J., Garrigues, S. & de la Guardia, M. Evaluation of nutritional parameters in infant formulas and powdered milk by Raman spectroscopy. Anal. Chim. Acta593(1), 30–38. 10.1016/j.aca.2007.04.036 (2007). [DOI] [PubMed] [Google Scholar]
- 19.Lugonja, N. et al. Differences in direct pharmacologic effects and antioxidative properties of mature breast milk and infant formulas. Nutrition (Burbank, Los Angeles County, Calif.) 29(2), 431–435 10.1016/j.nut.2012.07.018 (2013). [DOI] [PubMed]
- 20.Scano, P., Murgia, A., Demuru, M., Consonni, R. & Caboni, P. Metabolite profiles of formula milk compared to breast milk. Food Res. Int. (Ottawa, Ont.) 87, 76–82 10.1016/j.foodres.2016.06.024 (2016). [DOI] [PubMed]
- 21.Garwolińska, D., Hewelt-Belka, W., Kot-Wasik, A. & Sundekilde, U. K. Nuclear magnetic resonance metabolomics reveals qualitative and quantitative differences in the composition of human breast milk and milk formulas. Nutrients12, 921. 10.3390/nu12040921 (2020). [DOI] [PMC free article] [PubMed] [Google Scholar]
- 22.Bulut, Ö., Çoban, A. & İnce, Z. Macronutrient analysis of preterm human milk using mid-infrared spectrophotometry. J. Perinatal Med.47(7), 785–791. 10.1515/jpm-2019-0105 (2019). [DOI] [PubMed] [Google Scholar]
- 23.De Luca, M. et al. Evaluation of human breastmilk adulteration by combining Fourier transform infrared spectroscopy and partial least square modeling. Food Sci. Nutr.7(6), 2194–2201. 10.1002/fsn3.1067 (2019). [DOI] [PMC free article] [PubMed] [Google Scholar]
- 24.Bērziņš, K. Qualitative and quantitative vibrational spectroscopic analysis of macronutrients in breast milk. Spectrochim. Acta Part A Mol. Biomol. Spectrosc.246(118982), 1386–1425. 10.1016/j.saa.2020.118982 (2021). [DOI] [PMC free article] [PubMed] [Google Scholar]
- 25.Krafft, C., Steiner, G., Beleites, C. & Salzer, R. Disease recognition by infrared and Raman spectroscopy. J. Biophoton.2(1–2), 13–28 (2009). [DOI] [PubMed] [Google Scholar]
- 26.Yonar, D., Ocek, L., Tiftikcioglu, B. I., Zorlu, Y. & Severcan, F. Relapsing–remitting multiple sclerosis diagnosis from cerebrospinal fluids via Fourier transform infrared spectroscopy coupled with multivariate analysis. Sci. Rep.8(1), 1025. 10.1038/s41598-018-19303-3 (2018). [DOI] [PMC free article] [PubMed] [Google Scholar]
- 27.Kucuk Baloglu, F., Guldag Tas, D., Yilmaz, O., & Severcan, F. The recovery effect of Vitamin C on structural alterations due to streptozotocin-induced diabetes in rat testicular tissues. Spectrochim. Acta Part A Mol. Biomol. Spectrosc. 288, 122149 10.1016/j.saa.2022.122149 (2023). [DOI] [PubMed]
- 28.Movasaghi, Z., Rehman, S. & Rehman, I. Fourier transform infrared (FTIR) spectroscopy of biological tissues. Appl. Spectrosc. Rev.43(2), 134–179 10.1080/05704920701829043 (2008).
- 29.Abdelrazzak, A. B. & El-Bahy, G. S. FT-IR spectroscopic investigation of ionizing radiation-induced damage in the small intestine of whole-body irradiated rats. Vib. Spectrosc.99, 146–150. 10.1016/j.vibspec.2018.09.007 (2018). [Google Scholar]
- 30.Ricciardi, V. et al. Study of SH-SY5Y cancer cell response to treatment with polyphenol extracts using FT-IR spectroscopy. Biosensors7(4), 57. 10.3390/bios7040057 (2017). [DOI] [PMC free article] [PubMed] [Google Scholar]
- 31.Ergun, S., Demir, P., Uzbay, T. & Severcan, F. Agomelatine strongly interacts with zwitterionic DPPC and charged DPPG membranes. Biochim. Biophys. Açta1838(11), 2798–2806. 10.1016/j.bbamem.2014.07.025 (2014). [DOI] [PubMed] [Google Scholar]
- 32.Gall, D.G., Chung, M., O’Loughlin, E.V., Zahavi, I. & Opleta, K. Effects of parenteral and enteral nutrition on postnatal development of the small intestine and pancreas in the rabbit. Biol. Neonate 51(5), 286–296 10.1159/000242666 (1987). [DOI] [PubMed]
- 33.Beier-Holgersen, R. The importance of early postoperative enteral feeding. Clin. Nutr.20, 123–127. 10.1054/clnu.2001.0401 (2001). [Google Scholar]
- 34.Manea, A., Boia, M., Iacob, D., Dima, M. & Iacob, R. E. Benefits of early enteral nutrition in extremely low birth weight infants. Singap. Med. J.57(11), 616–618. 10.11622/smedj.2016002 (2016). [DOI] [PMC free article] [PubMed] [Google Scholar]
- 35.Martins, D. S. & Piper, H. G. Nutrition considerations in pediatric surgical patients. Nutr. Clin. Pract.37, 510–520. 10.1002/ncp.10855 (2022). [DOI] [PubMed] [Google Scholar]
- 36.Martin, C. R., Ling, P. R. & Blackburn, G. L. Review of infant feeding: Key features of breast milk and infant formula. Nutrients8(5), 279. 10.3390/nu8050279 (2016). [DOI] [PMC free article] [PubMed] [Google Scholar]
- 37.Romijn, J. A., Godfried, M. H., Hommes, M. J., Endert, E. & Sauerwein, H. P. Decreased glucose oxidation during short-term starvation. Metab. Clin. Exp.39(5), 525–530. 10.1016/0026-0495(90)90012-2 (1990). [DOI] [PubMed] [Google Scholar]
- 38.Klein, S., Sakurai, Y., Romijn, J. A. & Carroll, R. M. Progressive alterations in lipid and glucose metabolism during short-term fasting in young adult men. Am. J. Physiol.265(5 Pt 1), E801–E806. 10.1152/ajpendo.1993.265.5.E801 (1993). [DOI] [PubMed] [Google Scholar]
- 39.McCue M. D. Starvation physiology: Reviewing the different strategies animals use to survive a common challenge. Comp. Biochem. Physiol. Part A Mol. Integr. Physiol. 156(1), 1–18 10.1016/j.cbpa.2010.01.002 (2010). [DOI] [PubMed]
- 40.Iqbal, J. & Hussain, M. M. Intestinal lipid absorption. Am. J. Physiol. Endocrinol. Metab. 296(6), E1183–E1194 10.1152/ajpendo.90899.2008 (2009). [DOI] [PMC free article] [PubMed]
- 41.Yu, X. et al. Effects of starvation on lipid metabolism and gluconeogenesis in yak. Asian-Aust. J. Anim. Sci.29(11), 1593–1600. 10.5713/ajas.15.0868 (2016). [DOI] [PMC free article] [PubMed] [Google Scholar]
- 42.Sokolović, M. et al. Fasting induces a biphasic adaptive metabolic response in murine small intestine. BMC Genomics8, 361. 10.1186/1471-2164-8-361 (2007). [DOI] [PMC free article] [PubMed] [Google Scholar]
- 43.Jaconelli, M., Greenhaff, P. L., Atherton, P. J., Lobo, D. N. & Brook, M. S. The effects of elective abdominal surgery on protein turnover: A meta-analysis of stable isotope techniques to investigate postoperative catabolism. Clin. Nutr. (Edinburgh, Scotland).41(3), 709–722. 10.1016/j.clnu.2022.01.023 (2022). [DOI] [PMC free article] [PubMed] [Google Scholar]
- 44.Reineke, L. C., Cheema, S. A., Dubrulle, J. & Neilson, J. R. Chronic starvation induces noncanonical pro-death stress granules. J. Cell Sci. 131(19), jcs220244 10.1242/jcs.220244 (2018). [DOI] [PMC free article] [PubMed]
- 45.Wei, Y., Pattingre, S., Sinha, S., Bassik, M. & Levine, B. JNK1-mediated phosphorylation of Bcl-2 regulates starvation-induced autophagy. Mol. Cell30(6), 678–688. 10.1016/j.molcel.2008.06.001 (2008). [DOI] [PMC free article] [PubMed] [Google Scholar]
- 46.Xu, J., Fotouhi, M., & McPherson, P. S. Phosphorylation of the exchange factor DENND3 by ULK in response to starvation activates Rab12 and induces autophagy. EMBO Rep. 16(6), 709–718 10.15252/embr.201440006 (2015). [DOI] [PMC free article] [PubMed]
- 47.Karabiyik, C., Vicinanza, M., Son, S. M. & Rubinsztein, D. C. Glucose starvation induces autophagy via ULK1-mediated activation of PIKfyve in an AMPK-dependent manner. Dev. Cell56(13), 1961-1975.e5. 10.1016/j.devcel.2021.05.010 (2021). [DOI] [PubMed] [Google Scholar]
- 48.Gok, S., Kuzmenko, O., Babinskyi, A. & Severcan, F. Vitamin E derivative with modified side chain induced apoptosis by modulating the cellular lipids and membrane dynamics in MCF7 cells. Cell Biochem. Biophys.79(2), 271–287. 10.1007/s12013-020-00961-y (2021). [DOI] [PubMed] [Google Scholar]
- 49.Severcan, F., Kazanci, N. & Zorlu, F. Tamoxifen increases membrane fluidity at high concentrations. Biosci. Rep.20(3), 177–184 (2000). [DOI] [PubMed] [Google Scholar]
- 50.Korkmaz, F. & Severcan, F. Effect of progesterone on DPPC membrane: Evidence for lateral phase separation and inverse action in lipid dynamics. Arch. Biochem. Biophys.440(2), 141–147. 10.1016/j.abb.2005.06.013 (2005). [DOI] [PubMed] [Google Scholar]
- 51.Gurbanov, R., Bilgin, M. & Severcan, F. Restoring effect of selenium on the molecular content, structure and fluidity of diabetic rat kidney brush border cell membrane. Biochim. Biophys. Acta1858(4), 845–854. 10.1016/j.bbamem.2016.02.001 (2016). [DOI] [PubMed] [Google Scholar]
- 52.Simsek Ozek, N., Bal, I. B., Sara, Y., Onur, R. & Severcan, F. Structural and functional characterization of simvastatin-induced myotoxicity in different skeletal muscles. Biochim. Biophys. Acta1840(1), 406–415. 10.1016/j.bbagen.2013.09.010 (2014). [DOI] [PubMed] [Google Scholar]
- 53.Oldenhof, H., Friedel, K., Sieme, H., Glasmacher, B. & Wolkers, W. F. Membrane permeability parameters for freezing of stallion sperm as determined by Fourier transform infrared spectroscopy. Cryobiology.61(1), 115–122. 10.1016/j.cryobiol.2010.06.002 (2010). [DOI] [PubMed] [Google Scholar]
- 54.Ozek, N. S., Tuna, S., Erson-Bensan, A. E. & Severcan, F. Characterization of microRNA-125b expression in MCF7 breast cancer cells by ATR-FTIR spectroscopy. Analyst.135(12), 3094–3102. 10.1039/c0an00543f (2010). [DOI] [PubMed] [Google Scholar]
- 55.Cakmak, G., Severcan, M., Zorlu, F. & Severcan, F. Structural and functional damages of whole body ionizing radiation on rat brain homogenate membranes and protective effect of amifostine. Int. J. Radiat. Biol.92(12), 837–848. 10.1080/09553002.2016.1230237 (2016). [DOI] [PubMed] [Google Scholar]
- 56.Demir, P., Akkas, S. B., Severcan, M., Zorlu, F. & Severcan, F. Ionizing radiation induces structural and functional damage on the molecules of rat brain homogenate membranes: A Fourier transform infrared (FT-IR) spectroscopic study. Appl. Spectrosc.69(1), 154–164. 10.1366/13-07154 (2015). [DOI] [PubMed] [Google Scholar]
- 57.Portaccio, M., Faramarzi, B. & Lepore, M. Probing Biochemical Differences in lipid components of human cells by means of ATR-FTIR spectroscopy. Biophysica.3(3), 524–538. 10.3390/biophysica3030035 (2023). [Google Scholar]
- 58.Awayda, M. S., Shao, W., Guo, F., Zeidel, M. & Hill, W. G. ENaC-membrane interactions: Regulation of channel activity by membrane order. J. Gen. Physiol.123(6), 709–727. 10.1085/jgp.200308983 (2004). [DOI] [PMC free article] [PubMed] [Google Scholar]
- 59.Szalontai, B., Nishiyama, Y., Gombos, Z. & Murata, N. Membrane dynamics as seen by Fourier transform infrared spectroscopy in a cyanobacterium, Synechocystis PCC 6803. The effects of lipid unsaturation and the protein-to-lipid ratio. Biochim. Biophys. Acta1509(1–2), 409–419. 10.1016/s0005-2736(00)00323-0 (2000). [DOI] [PubMed] [Google Scholar]
- 60.Janmey, P. A. & Kinnunen, P. K. Biophysical properties of lipids and dynamic membranes. Trends Cell Biol.16(10), 538–546. 10.1016/j.tcb.2006.08.009 (2006). [DOI] [PubMed] [Google Scholar]
- 61.Khoshbin, K., & Camilleri, M. Effects of dietary components on intestinal permeability in health and disease. Am. J. Physiol. Gastrointest. Liver Physiol. 319(5), G589–G608 10.1152/ajpgi.00245.2020 (2020). [DOI] [PMC free article] [PubMed]
- 62.Mozaheb, N. et al. Contribution of membrane vesicle to reprogramming of bacterial membrane fluidity in Pseudomonas aeruginosa. mSphere.7(3), e0018722. 10.1128/msphere.00187-22 (2022). [DOI] [PMC free article] [PubMed] [Google Scholar]
- 63.Matveyenka, M., Rizevsky, S. & Kurouski, D. Unsaturation in the fatty acids of phospholipids drastically alters the structure and toxicity of insulin aggregates grown in their presence. J. Phys. Chem. Lett.13(20), 4563–4569. 10.1021/acs.jpclett.2c00559 (2022). [DOI] [PMC free article] [PubMed] [Google Scholar]
- 64.Tessitore, L., Tomasi, C. & Greco, M. Fasting-induced apoptosis in rat liver is blocked by cycloheximide. Eur. J. Cell Biol.78(8), 573–579. 10.1016/S0171-9335(99)80023-5 (1999). [DOI] [PubMed] [Google Scholar]
- 65.Kim, M. H. & Kim, H. The roles of glutamine in the intestine and its implication in intestinal diseases. Int. J. Mol. Sci.18(5), 1051. 10.3390/ijms18051051 (2017). [DOI] [PMC free article] [PubMed] [Google Scholar]
- 66.Kong, S. E., Hall, J. C., Cooper, D. & McCauley, R. D. Starvation alters the activity and mRNA level of glutaminase and glutamine synthetase in the rat intestine. J. Nutr. Biochem.11(7–8), 393–400. 10.1016/s0955-2863(00)00095-4 (2000). [DOI] [PubMed] [Google Scholar]
- 67.Shan, P. et al. SIRT1 functions as a negative regulator of eukaryotic poly(A)RNA transport. Curr. Biol. CB27(15), 2271–2284.e5 10.1016/j.cub.2017.06.040 (2017). [DOI] [PubMed]
- 68.Liao, K. Y. et al. Profile of nucleotides and nucleosides in Taiwanese human milk. Pediatr. Neonatol.52(2), 93–97. 10.1016/j.pedneo.2011.02.012 (2011). [DOI] [PubMed] [Google Scholar]
- 69.Gil, A. & Sanchez-Medina, F. Acid-soluble nucleotides of human milk at different stages of lactation. J . Dairy Res.49(2), 301–307. 10.1017/s0022029900022391 (1982). [DOI] [PubMed] [Google Scholar]
- 70.Barness, L. A. Dietary sources of nucleotides—From breast milk to weaning. J. Nutr.124(1 Suppl), 128S-130S. 10.1093/jn/124.suppl_1.128S (1994). [DOI] [PubMed] [Google Scholar]
- 71.Prosser, C. G., Mclaren, R. D., Frost, D., Agnew, M. & Lowry, D. J. Composition of the c non-protein nitrogen fraction of goat whole milk powder and goat milk-based infant and follow-on formulae. Int. J. Food Sci. Nutr.59(2), 123–133. 10.1080/09637480701425585 (2008). [DOI] [PubMed] [Google Scholar]
- 72.Carrillo-Lozano, E., Sebastián-Valles, F. & Knott-Torcal, C. Circulating microRNAs in breast milk and their potential impact on the infant. Nutrients12(10), 3066. 10.3390/nu12103066 (2020). [DOI] [PMC free article] [PubMed] [Google Scholar]
- 73.Brown, H. O., Levine, M. L. & Lipkin, M. Inhibition of intestinal epithelial cell renewal and migration induced by starvation. Am. J. Physiol.205(5), 868–872. 10.1152/ajplegacy.1963.205.5.868 (1963). [DOI] [PubMed] [Google Scholar]
- 74.Holt, P. R., Wu, S. & Yeh, K. Y. Ileal hyperplastic response to starvation in the rat. Am. J. Physiol.251(1 Pt 1), G124–G131. 10.1152/ajpgi.1986.251.1.G124 (1986). [DOI] [PubMed] [Google Scholar]
- 75.Chappell, V. L. et al. Effects of incremental starvation on gut mucosa. Digest. Dis. Sci.48(4), 765–769. 10.1023/a:1022849112100 (2003). [DOI] [PubMed] [Google Scholar]
- 76.Shaw, D., Gohil, K. & Basson, M. D. Intestinal mucosal atrophy and adaptation. World J. Gastroenterol.18(44), 6357–6375. 10.3748/wjg.v18.i44.6357 (2012). [DOI] [PMC free article] [PubMed] [Google Scholar]
- 77.Kelly, P. Starvation and its effects on the gut. Adv. Nutr. (Bethesda, Md.) 12(3), 897–903 10.1093/advances/nmaa135 (2021). [DOI] [PMC free article] [PubMed]
- 78.Lenaerts, K. et al. Starvation induces phase-specific changes in the proteome of mouse small intestine. J. Proteome Res.5(9), 2113–2122. 10.1021/pr060183+ (2006). [DOI] [PubMed] [Google Scholar]
- 79.Genton, L., Cani, P. D. & Schrenzel, J. Alterations of gut barrier and gut microbiota in food restriction, food deprivation and protein-energy wasting. Clin. Nutr. (Edinburgh, Scotland)34(3), 341–349. 10.1016/j.clnu.2014.10.003 (2015). [DOI] [PubMed] [Google Scholar]
- 80.Gil A & Uauy R. Nucleotides and related compounds in human and bovine milks. In Handbook of Milk Composition (ed. Jensen, R.G.). 36–464 (Academic Press, 1995).
- 81.Robinson, D. T. & Caplan, M. S. Linking fat intake, the intestinal microbiome, and necrotizing enterocolitis in premature infants. Pediatr. Res.77(1–2), 121–126. 10.1038/pr.2014.155 (2015). [DOI] [PubMed] [Google Scholar]
Associated Data
This section collects any data citations, data availability statements, or supplementary materials included in this article.
Data Availability Statement
The datasets generated during and/or analysed during the current study are available from the corresponding author on reasonable request.