

Significance
Sepsis and tuberculosis (TB) are associated with long-term immune tolerance, characterized by the loss of proinflammatory responses, and increased mortality post successful treatment. Here, we report that bacterial lipopolysaccharide (LPS) and Mycobacterium tuberculosis (Mtb) treated monocytes acquired a tolerance phenotype. Patients with both sepsis and TB have increased tricarboxylic acid (TCA) activation that correlates with DNA methylation. Pharmacologic inhibitors of the TCA cycle restored immune responsiveness and mitigated infection-induced DNA hypermethylation of the genes and pathways involved in tolerance. TB patients given adjuvant everolimus with anti-TB antibiotic therapy, demonstrated similar decreases in tolerance associated DNA hypermethylation. These experiments demonstrate an infection-induced metabolic–epigenetic axis, therefore suggesting alternative means to restore immune responsiveness after severe and chronic infections like sepsis and TB.
Keywords: immune tolerance, DNA methylation, tuberculosis, sepsis, Rheostat
Abstract
Severe and chronic infections, including pneumonia, sepsis, and tuberculosis (TB), induce long-lasting epigenetic changes that are associated with an increase in all-cause postinfectious morbidity and mortality. Oncology studies identified metabolic drivers of the epigenetic landscape, with the tricarboxylic acid (TCA) cycle acting as a central hub. It is unknown if the TCA cycle also regulates epigenetics, specifically DNA methylation, after infection-induced immune tolerance. The following studies demonstrate that lipopolysaccharide and Mycobacterium tuberculosis induce changes in DNA methylation that are mediated by the TCA cycle. Infection-induced DNA hypermethylation is mitigated by inhibitors of cellular metabolism (rapamycin, everolimus, metformin) and the TCA cycle (isocitrate dehydrogenase inhibitors). Conversely, exogenous supplementation with TCA metabolites (succinate and itaconate) induces DNA hypermethylation and immune tolerance. Finally, TB patients who received everolimus have less DNA hypermethylation demonstrating proof of concept that metabolic manipulation can mitigate epigenetic scars.
After pneumonia, sepsis, or tuberculosis (TB), both lymphoid and myeloid immune cells display decreased responsiveness. TB, for example, leads to lymphocyte immune exhaustion (1) and monocyte immune tolerance (2–4), characterized by decreased antigen-induced cytokine production (decreased interleukin 1 beta (IL1β), interleukin 6 (IL-6), tumor necrosis factor (TNF), and interferon gamma (IFN-γ)) (1, 5) and decreased pathogen killing capacity (6). Lipopolysaccharide (LPS)-induced tolerance was first described in 1947 (7), with survivors of sepsis having an eightfold increased risk of recurrent sepsis (8) and a threefold increased risk of death (9). Similarly, despite antimicrobial cure, both pneumonia and TB patients have persistent postinfection immune suppression and increased risk of death (10, 11).
Severe and chronic infections in humans and animals result in persistent, long-lasting epigenetic scars (12). Hepatitis C patients retain detrimental epigenetic scars more than 18 mo after treatment-induced sustained viral response (13). TB dampens immune responsiveness via DNA hypermethylation of TNF, IL-6, and the IL-12-IFN-γ signaling pathway regulatory genes, and these perturbations last at least 6 mo after completion of successful TB therapy (1). Other studies suggest that chronic immune activation results in epigenetic-mediated anergy (14–24). After LPS-mediated sepsis or TB, immune cells have an epigenetically mediated prolonged immune tolerant phenotype characterized by decreased antigen-induced production of TNFα, IL-6, and IL-12, as well as decreased microbial killing capacity (5, 12, 16, 20, 25–29).
Cancer studies identified multiple mechanisms by which metabolic shifts induce epigenetic changes that drive immune perturbations. However, it remains unclear whether a similar metabolic–epigenetic axis drives immune function perturbations after severe or chronic infections. The metabolic response to infections is nonmonotonic (30), with initial upregulation of glycolysis, the tricarboxylic acid (TCA) cycle, and electron transport chain (ETC) (31–34). These metabolic shifts are initially beneficial, ensuring metabolic intermediates requisite for an acute immune response, while also serving to inhibit pathologic inflammation (35). Interest has focused on succinate and itaconate as regulators of host immunity (36–39). However, a link between metabolic changes and the epigenome in sepsis and TB has not been established.
Gain-of-function (GOF) mutations in certain cancers increase isocitrate dehydrogenase (IDH), resulting in increased 2-hydroxyglutarate and succinate and a decrease in α-ketoglutarate (αKG) (40). Many epigenetic enzymes are αKG-dependent dioxygenases, requiring αKG as a cofactor and producing succinate as a product. IDH GOF mutations result in an increase in the succinate: αKG ratio which drives global epigenetic perturbations. Normal immune cells are also affected by shifts in TCA cycle metabolites that can lead to perturbation of immune function (38, 41, 42). However, unlike in cancer, it is not known if the TCA cycle acts as a hub regulating epigenetic changes after infections in a manner akin to the well-described metabolic–epigenetic axis in cancer. Therefore, we tested whether infection-induced epigenetic changes are also metabolically mediated. Combining experimental macrophage studies, publicly available gene-transcriptional data from patients, and cells isolated from TB patients receiving host-directed therapy, we demonstrate that cellular metabolism, in particular the TCA cycle, regulates infection-induced DNA hypermethylation.
Results
Metabolic Inhibitors Mitigate LPS-Induced DNA Hypermethylation and Recapitulates Sepsis and TB-Induced Immune Perturbations.
To test whether infections induce DNA methylation changes via the TCA cycle, a well-established 7-d monocyte-derived macrophage model (MDMΦ) tolerance model was applied (Fig. 1A). The monocytes were either pretreated with metabolic inhibitors (12 h) or left untreated, followed by a high dose LPS (100 ng/mL) exposure for 24 h. After initial LPS stimulation, all LPS was removed and the cells were washed, given fresh media, and rested for 5 d, before restimulation with a low dose LPS (10 ng/mL). As previously described (20, 43), the immune tolerant cells demonstrated reduced immune responsiveness (Fig. S4B and SI Appendix, Fig. S1A). DNA was collected 24 h day 2 (d2) and day 8 (d8) of the protocol to assess for DNA methylation changes (Fig. 1A). LPS-induced both DNA hyper- and hypomethylation changes in the epigenome both at d2 and d8 (P < 0.05) (Fig. 1B). Similar to mouse models of sepsis that demonstrate that epigenetic changes occur within the first 12 h of infection (44) the predominance of LPS-induced DNA methylation changes (75% of the total differentially methylated genes; 920 genes) measured 7 d after LPS (d8) are also differentially methylated within 24 h (d2) after LPS (690 genes) (Fig. 1B and SI Appendix, Fig. S1 H and I and Table S1).
Fig. 1.

LPS-induced DNA hypermethylation is rescued by TCA inhibitors and recapitulates DNA methylation changes in TB and Sepsis. (A) Schematic of the Tolerance model for assessment of DNA methylation. (B) Heatmap of DNA methylation probes (P < 0.05) induced by LPS at 24 h (first column), LPS at d8 (Second column), itaconate and succinate (third and fourth columns, respectively), or LPS with metformin, everolimus, or GlyNAC (fifth, sixth, and seventh column, respectively). (C) Overrepresentation pathway analysis (ORA) of relevant pathways using GO: BP, Hallmark, Reactome, and KEGG for early (d2) late (d8) and persistent (d2 and d8) hyper- and hypomethylated genes. (D) ORA using Hallmark gene sets with shades of red representing the -log10 P-values from hypermethylated genes and shades of blue representing hypomethylated genes. (E and F) DNA hypermethylation overlap at the gene-level (E) and pathways (F) between LPS, Sepsis, and TB. (G and H) Gene expression overlap at the gene-level (G) and pathways (H) between LPS, Sepsis, and TB. Only relevant and significant P-values, P < 0.05 are reported.
Pathways that are hypermethylated at both d2 and d8 include infection by Mycobacterium tuberculosis (Mtb), Wnt signaling, chromatin organization, histone modification, histone H4 acetylation (Fig. 1C). Pathways that are hypomethylated at both d2 and d8 include cellular response to stimuli, anti-inflammatory response (including IL-10 signaling), and TLR2 signaling (Fig. 1C and SI Appendix, Table S1). Interestingly, the TCA cycle was one of the early hypomethylated pathways that remain hypomethylated at d8.
Administration of LPS after pretreatment of metformin, everolimus, or glycine combined with equimolar concentrations of N-acetyl cysteine (GlyNAC) blocked LPS-induced DNA hypermethylation and but not hypomethylation (Fig. 1B). In contrast, the later stage TCA metabolites itaconate and succinate, even in the absence of LPS, induced global DNA hypermethylation (Fig. 1B). Interestingly, when metformin, everolimus, or GlyNAC are added before LPS treatment, they not only block DNA hypermethylation, but they also lead to hypomethylation of many LPS-induced hypermethylated genes and pathways (Fig. 1D and SI Appendix, Table S1). DNA methylation changes that mostly correlate to gene transcription are chiefly localized in CpG rich (>60%) regions near gene promotors, with >70% of the cytosines methylated, called Islands (SI Appendix, Fig. S1B and Table S1).
Pathway analysis of genes hypermethylated by both LPS, itaconate, and succinate enrich for metabolic pathways (e.g., glycolysis, phosphoinositide 3-kinase/Ak strain transforming-mammalian/mechanistic target of rapamycin (PI3K/AKT-mTOR) signaling), and immune responsive pathways (Inflammatory signaling, TNFα signaling, IL6-STAT3 signaling, and IFNγ response; Fig. 1D and SI Appendix, Table S1). In contrast, treatment with metformin, everolimus, and GlyNAC mitigates LPS-induced DNA hypermethylation of the IL6-STAT3, IFNγ, inflammatory, and mTOR pathways (Fig. 1D and SI Appendix, Table S1). This was confirmed by evaluation of pathway-level DNA methylation Z-score (summed beta-values of all genes in the pathway), which demonstrates that LPS, succinate, and itaconate increase DNA methylation in IL-6, IFNγ, Inflammatory response, and mTOR signaling (SI Appendix, Fig. S1 C–F). Interestingly, metformin, everolimus, and GlyNAC decreased LPS-induced DNA hypermethylation for both the early and late methylated genes (SI Appendix, Fig. S1 H and I and Table S1). Analyzing only promoter regions identified DNA hypermethylation of ERBB signaling, Wnt-beta catenin signaling, and hypomethylation of Inflammatory response, TLR, nucleotide oligomerization domain-like receptor, IL-10, and oxidative phosphorylation (SI Appendix, Fig. S1G and Table S1).
To assess clinical significance of the LPS-induced DNA hypermethylation, we evaluated publicly available DNA methylation and transcriptional datasets from both TB [GSE145714 (1), methylation; GSE42834 transcription (45)] and sepsis [GSE138074 (46), methylation; GSE46955 (47) transcription]. Both TB and sepsis demonstrate an overlap in hypermethylated genes and pathways with LPS-induced DNA hypermethylation and LPS-induced gene expression changes [GSE85243 (48)] (Fig. 1 E–H and SI Appendix, Table S1). In summary, LPS induces DNA hypermethylation which can be mitigated by metformin, everolimus, and GlyNAC, and is reproduced if itaconate and succinate are administered alone without LPS. The LPS-induced DNA hypermethylation overlaps with DNA hypermethylation induced in clinical patients with sepsis and TB (Fig. 1 E and F).
Metabolic Inhibitors Mitigate LPS-Induced Intracellular Signaling.
Metabolites are cofactors for epigenetic modifications. Specifically, two significant enzymes regulating DNA methylation, DNA methyl transferases (DNMT) and ten-eleven translocase (TET) enzymes, require αKG as a cofactor, and produce succinate as an end product (49, 50). Using the above LPS-induced immune tolerance model, epigenetic and phosphoprotein enzymes were measured. LPS stimulation altered 38 (17%) of the 230 proteins examined (SI Appendix, Fig. S2A), and 11 (29%) of the 38 epigenetic enzymes examined (SI Appendix, Fig. S2B). LPS treatment increases the total cellular levels of the epigenetic enzymes SIRT6, JMJD2A, JARID1C, EZH2, PHF2, and MED12 (SI Appendix, Fig. S2B). However, it did not increase the total cellular concentrations of DNA methylation–modifying enzymes DNMT1, DNMT3A, or DNMT3B (Fig. 2A and SI Appendix, Table S1). The increase in LPS-induced protein phosphorylation (SI Appendix, Fig. S2C) and epigenetic enzymes (SI Appendix, Fig. S2D) was lower when LPS was administered with metformin, everolimus, or BAY, relative to LPS alone (SI Appendix, Fig. S2 C and D). Enrichment analysis of the significantly different kinases and epigenetic enzymes that were increased upon LPS, demonstrated enrichment for PI3K-AKT, IL-6 JAK STAT3, and TNF-α signaling (SI Appendix, Fig. S2E and Table S1).
Fig. 2.
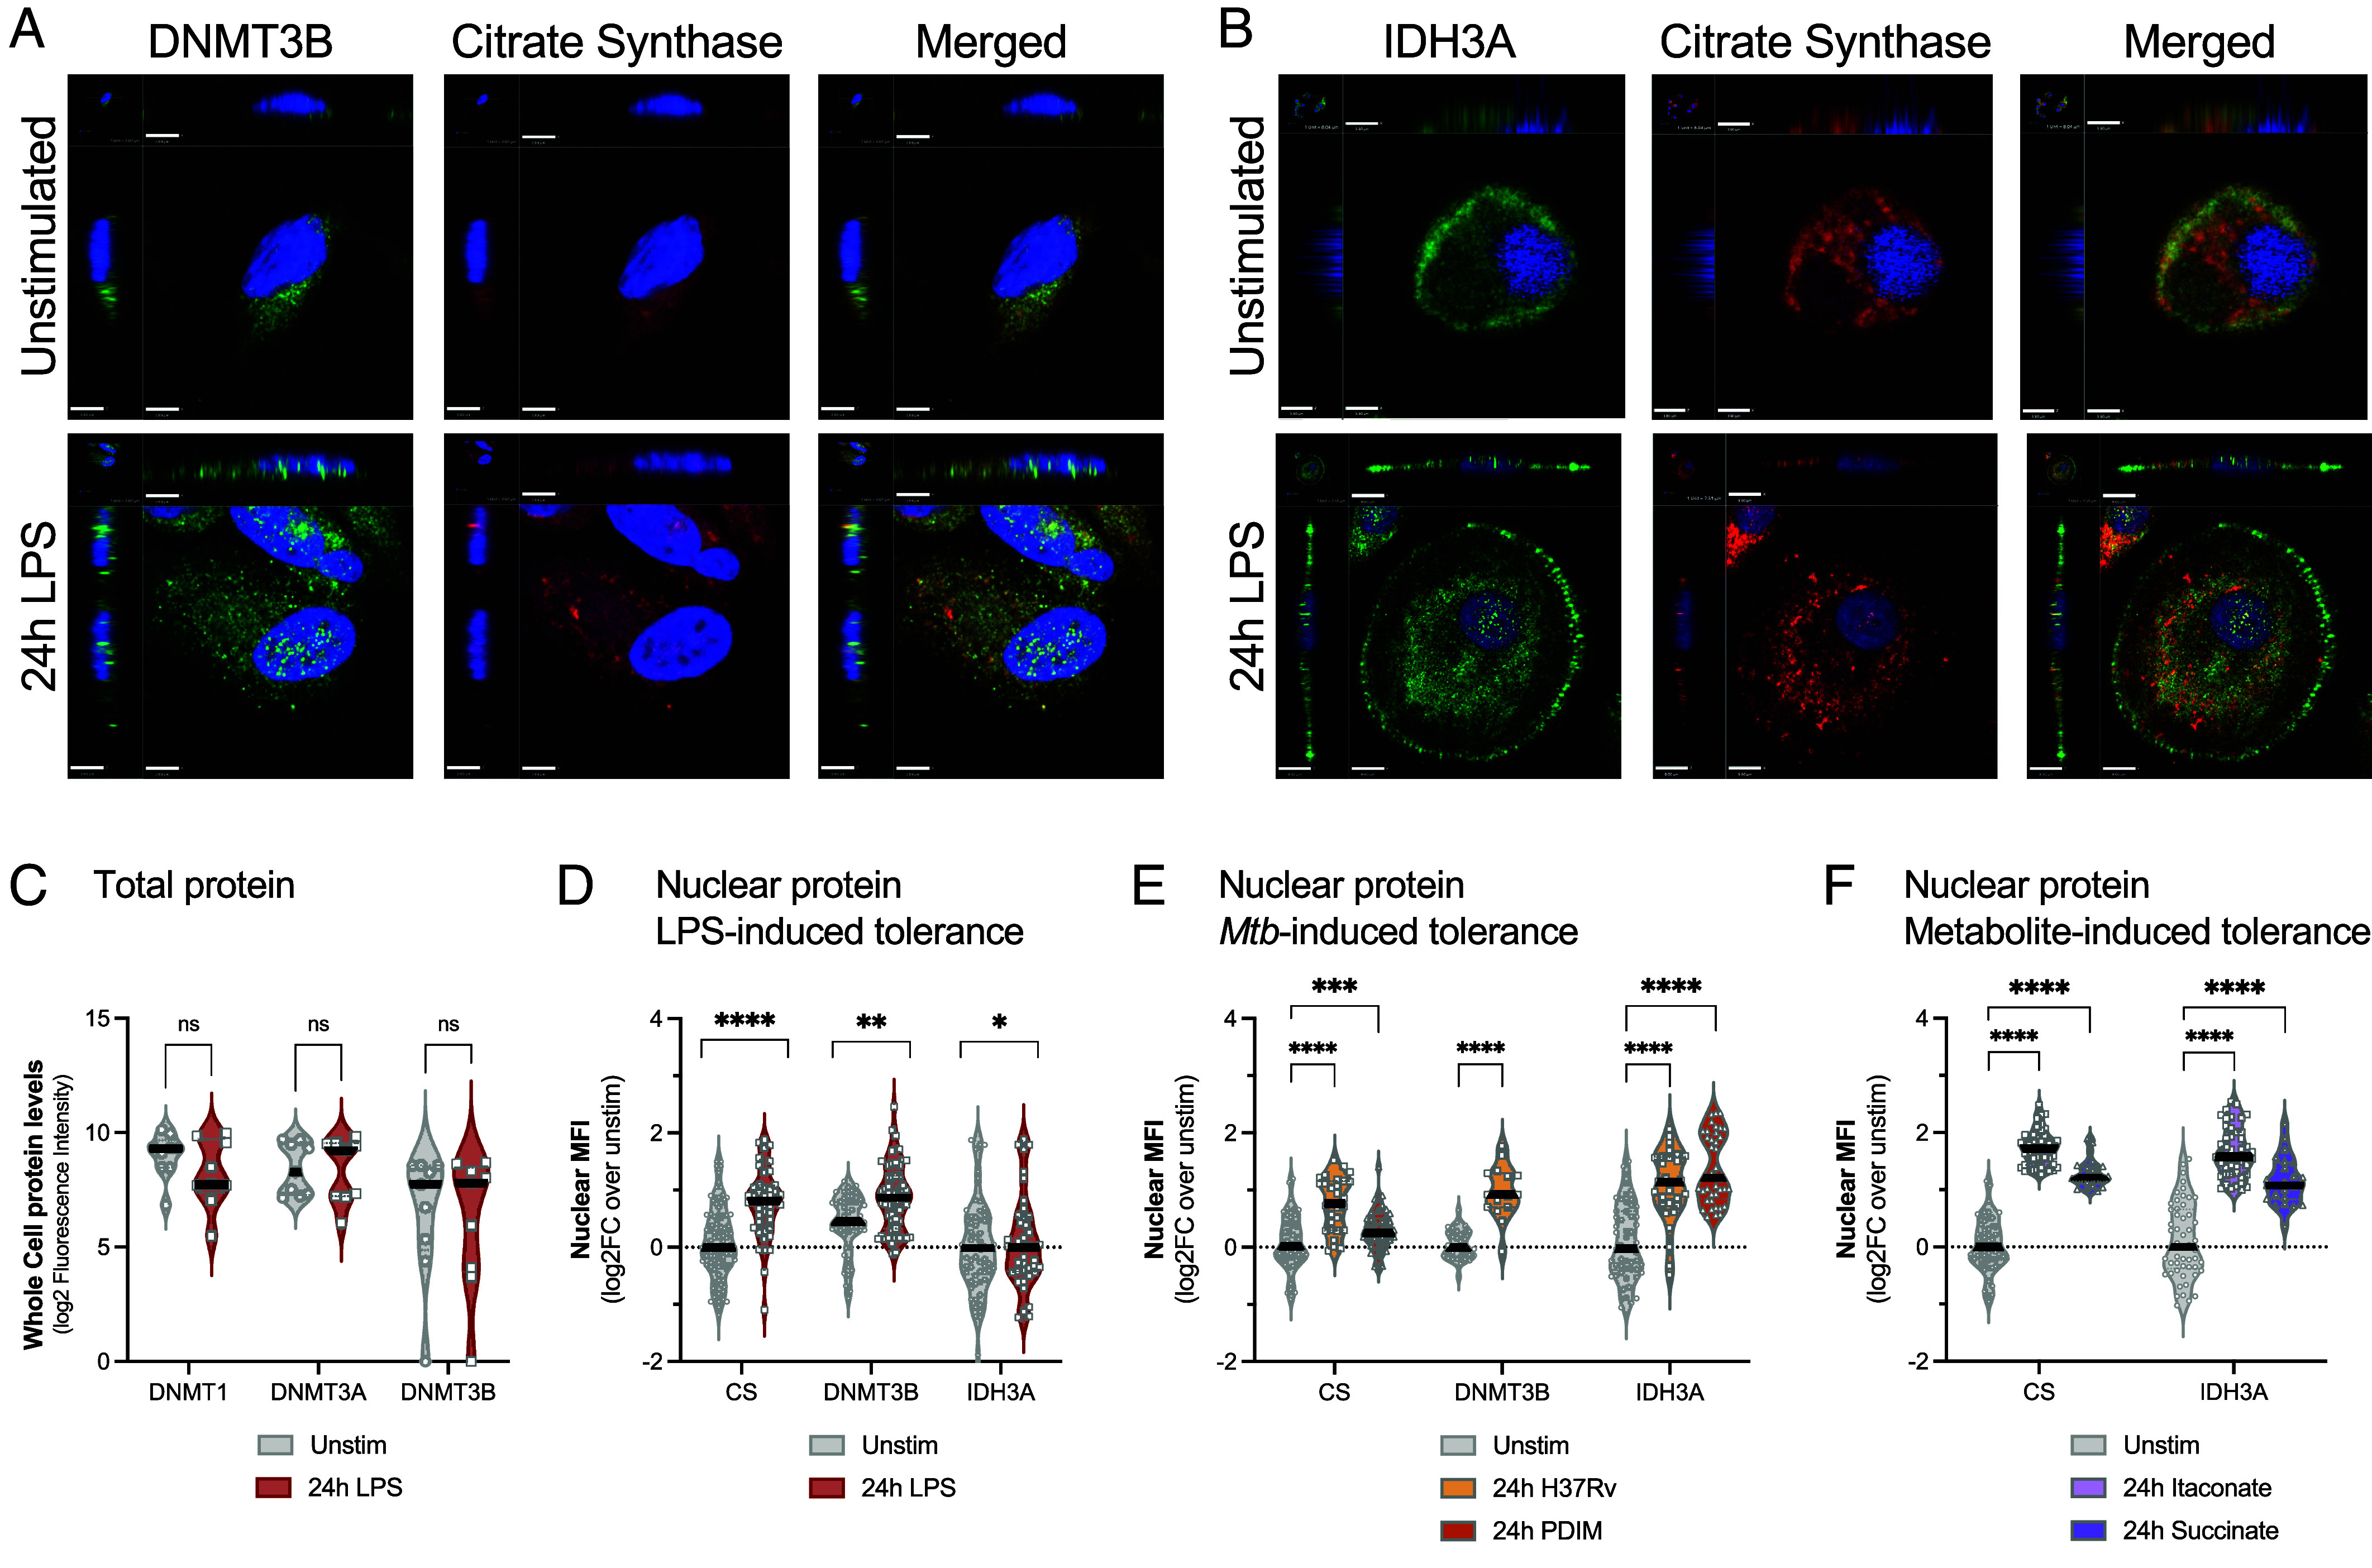
TCA cycle and DNA methylating enzymes translocate to the nucleus after LPS and Mtb stimulation. (A) Representative confocal images of macrophages stimulated with or without LPS for 24 h. Antibody staining for DNMT3B (green) or citrate synthase (red). Nuclei counterstained with DAPI (blue). The Upper Right quadrant demonstrates the x-axis cross-section of the cell, and the Lower Left quadrant shows the z-axis cross-section of cell, to better visualize nuclear staining. Scale bars equal 3.80 µm for the x-axis and 1 unit = 3.07 µm for z-stacks. (B) Representative confocal images for IDH3A (green) or citrate synthase (red) and with nuclei counterstained with DAPI (blue). Scale bars equal 9 µm for the x-axis and 1 unit = 7.51 µm for z-stacks. (C) Quantitation of total protein levels of DNMT1, DNMT3A, or DNMT3B as measured by total cellular fluorescent intensity, n = 9 per group. (D) Quantitation of nuclear median fluorescent intensity (MFI) for DNMT3B, IDH3A, and citrate synthase with and without LPS stimulation, n = 19 to 32 cells per group including 3 to 6 biologic replicates per experiment. Median values with the quartiles are plotted as log2FC over unstimulated. (E) Quantitation of nuclear MFI for citrate synthase, DNMT3B, and IDH3A for Mtb stimulations (H37Rv total lipids and PDIM), n = 48 to 80 cells per group was quantified from three biologic replicates. Median values with the quartiles are plotted as log2FC over unstimulated. (F) Nuclear MFI after treatment with itaconate or succinate; n = 48 to 80 cells was quantified from three biologic replicates. Median values with the quartiles are plotted as log2FC over unstimulated. The treatments were compared to unstimulated using a Mann–Whitney test, with significant P values shown (*P < 0.05, **P < 0.01, ****P < 0.0001, ns; not significant).
LPS- and Mtb-Induce Translocation of DNMT3B and TCA Enzymes into the Nucleus.
While LPS did not increase total cellular levels of DNMT1, DNMT3A, or DNMT3B, enzymes (Fig. 2A and SI Appendix, Table S1), it did change the DNMT3B cellular localization. Specifically, at rest, DNMT3B was present in the cytoplasm of unstimulated macrophages and upon LPS or Mtb stimulation (H37Rv total lipids), it translocated into the nucleus (Mann–Whitney P < 0.05; Fig. 2 A–E). Similarly, LPS and Mtb stimulation both induced IDH3A and citrate synthetase (CS) to translocate into the nucleus (Mann–Whitney P < 0.05; Fig. 2 D and E). Interestingly, treatment with metformin, decreased LPS-induced nuclear translocation of IDH3A and CS (SI Appendix, Fig. S3). Succinate and itaconate, without LPS or Mtb stimulation, also induced IDH3A and CS to translocate into the nucleus (Fig. 2F). Based on these data, even though LPS does not increase total cellular concentrations of DNA modifying enzymes and TCA enzymes, they modify their cellular localization by translocating to the nucleus, a potential mechanism for control of immune tolerance and the associated DNA hypermethylation.
Metabolic Inhibition Mitigates LPS and Mtb-Induced Immune Tolerance and Restores Secondary Immune Responsiveness.
The LPS-induced immune tolerance model (Fig. 3 A and B) was used to determine whether metabolic inhibition could restore immune responsiveness. LPS tolerant MDMΦ demonstrate reduced capacity to produce IL-6, TNF-α, and CXCL10 levels after the secondary stimulation (SI Appendix, Fig. S4 A–E). Coadministration of LPS with rapamycin or everolimus, followed by 5 d of rest restores MDMΦ capacity to produce IL-6 protein upon secondary stimulation with LPS at day 7 (P < 0.05 Rapamycin, P < 0.0001 Everolimus, Fig. 3C). Similarly, metformin, a broad- metabolic inhibitor of the TCA cycle and complex II of the ETC, also restores IL-6 secretion in response to LPS as compared to LPS tolerant cells (P < 0.0001, Fig. 3C). BAY1436032, a targeted IDH inhibitor, also restores IL-6 production as compared to LPS tolerant cells (P < 0.001, Fig. 3C).
Fig. 3.

Immune tolerance can be induced by LPS, Mtb, or TCA cycle metabolites and rescued by TCA inhibitors. (A) Overview of the TCA (dotted line box). The drug targets are highlighted with enclosed blue shapes. (B) Schematic of the experimental design, conditions, and definitions used. LPS, Mtb, and metabolite treatment of MDMΦ was carried out with and without pretreatment with the inhibitors; d0: day 0. Functional (gray), LPS-induced tolerant (Tol) (red), Mtb-tolerant (orange), metabolite-tolerant (purple), and with drugs (blue) state of the MDMΦ are indicated. (C) Violin plots demonstrating IL-6 levels under LPS-tolerant (Tol) conditions with or without rapamycin (Rapa) and everolimus (Evero) (Left), metformin (Met) and BAY1436032 (BAY) (Central) and equimolar glycine-N-acetyl cysteine (GlyNAC; GNAC) and lycopene (Lyco) (Right). Median and quartiles are plotted for each graph. (D) Violin plots demonstrating Mtb-induced tolerance using both PDIM and H37Rv total lipids with and without metformin. For Mtb rescue both PDIM- and H37Rv-induced tolerance are plotted together. The groups were compared using Two-way ANOVA with Dunnett’s correction for multiple testing (E), and with Fisher’s LSD. The compared groups are indicated with the overhead bars and were computed using a two-tailed Mann–Whitney test. (E and F) Bar graphs demonstrating IL-6 quantification under different concentrations of itaconic acid and dimethyl succinate. All data are plotted as log2-fold change in the stimulation over the unstimulated. Each dot represents a different biologic replicate. The groups were compared using Two-way ANOVA with Dunnett’s correction for multiple testing (E), and with Fisher’s LSD (F). Significant p-values are reported. *P < 0.05, **P < 0.01, ***P < 0.001, ****P < 0.0001. Abbreviations: Func: Functional; Tol: tolerant; TCA; Tricarboxylic acid cycle, Stim: Stimulation, SDH; Succinate dehydrogenase, FH; Fumarate hydratase, CS: Citrate synthase, ACO2: Aconitase, PDHA: Pyruvate Dehydrogenase, AMPK: AMP-activated protein kinase, mTOR: Mammalian target of Rapamycin, MDH2: Malate dehydrogenase, GLS: Glutaminase, IDH3A/B; Isocitrate Dehydrogenase, a-KG: Alpha keto glutarate, OGDH: Oxo-glutarate dehydrogenase; ROS: Reactive oxygen species, LSD: Least significant difference, mM: Micromolar, mM: Millimolar.
Previous nonimmune studies demonstrated that the TCA cycle and ETC activation lead oxidative stress and recruitment of the nucleosome remodeling and deacetylase (NuRD) complex to change the epigenetic landscape (51, 52). Interestingly, the presence of oxidative scavengers GlyNAC and lycopene during LPS treatment restore IL-6 responsiveness as compared to LPS tolerant MDMΦ (P < 0.0001, Fig. 3C). We confirmed that the metabolic inhibitors were acting on the expected targets by measuring concentrations of the total proteins and phosphoproteins involved by antibody-targeted proteomics (reverse-phase protein array; RPPA) (53). RPPA analyses confirmed that everolimus decreased the protein expression levels of phosphorylated mTOR [at Serine(S)2248], and mTOR(S2481); SI Appendix, Fig S5A) and that metformin down-regulates AMP-activated protein kinase, pyruvate kinase M2, and lactate dehydrogenase A proteins. The IDH inhibitor BAY1436032 decreases the IDH1 protein levels (SI Appendix, Fig. S5A). Interestingly, LPS-induced immune tolerance was mitigated if inhibitors of cellular metabolism were administered concomitant or after LPS (SI Appendix, Fig. S5C). Immune tolerance induction was not limited to LPS. Mtb cell wall components (H37Rv total lipid components and phthiocerol dimycocerosates; PDIM) administered for 48 h, followed by 5 d of rest, also resulted in immune tolerance (Fig. 3D and SI Appendix, Fig. S4 C–E).
Succinate and itaconate dampen immune responsiveness at least in part through TET2 and NRF2, but the full mechanisms involved are not well understood (36, 54, 55). When itaconic acid and succinate (cell-permeable dimethyl succinate) were added to monocytes for the first 36 h, then removed, and the macrophages allowed to rest for 5 d in normal media, the quantity of LPS-induced IL-6 was decreased in a dose-dependent manner for Itaconic acid (Fig. 3E) and to a limited extent with increasing doses of succinate (Fig. 3E). In summary, inhibitors of cellular metabolism mitigate immune tolerance, while the TCA metabolites itaconate and succinate induce tolerance.
Pneumonia, Sepsis, and TB Patients Have Increased Glycolysis and TCA Activation that Correlates to DNA Methylation Pathway Activation.
Upon activation, immune cells increase cellular metabolism including glycolysis and the TCA cycle to produce metabolic intermediates (56). Publicly available whole blood transcriptomic datasets from sepsis [GSE154918 (57)], pneumonia, and TB [GSE42834 (45)] were evaluated for activation of glycolysis and the TCA cycle and whether they correlate with DNA methylation pathway activation. Pneumonia, sepsis, and TB all increase the gene expression of glycolysis, the TCA cycle, and DNA methylation as compared to healthy controls (SI Appendix, Fig. S6 A–C). The increased expression of DNA methylation pathway genes strongly correlated with both glycolysis and TCA cycle with a Spearman correlation (rho value > 0.75) for both TB and sepsis (SI Appendix, Fig. S6 D and E). Even when sepsis is clinically resolved, there remains increased activation of both glycolysis and the TCA cycle (SI Appendix, Fig. S6C).
Everolimus Rescues DNA Hypermethylation in TB Patients.
Despite successful antibiotics, individuals who have recovered from pneumonia, sepsis, and TB retain long-lasting epigenetic scars (1, 12, 58) that are associated with an increase in postinfectious morbidity and mortality (9–11). A recent clinical trial found that active pulmonary TB patients who receive standard of care antituberculosis antibiotic therapy (SOC ATT) plus adjunctive everolimus have improved lung function at the end of TB therapy (59). Peripheral Blood Mononuclear Cells (PBMCs) from this study were examined to evaluate whether everolimus can mitigate infection-induced DNA hypermethylation in patients, akin to our observations in MDMΦ. DNA was isolated from PBMCs at the end of therapy (day 180) from participants who had received SOC antibiotics alone (n = 35) or SOC antibiotics plus everolimus for days 1 to 112 (n = 33) (Fig. 4A). Everolimus induced both DNA hyper- and hypomethylation (SI Appendix, Table S1). TB patients who received everolimus demonstrate DNA hypomethylation for 30% of the genes rescued in LPS-induced DNA hypermethylation in MDMΦ (Fig. 4B). Using epigenetic deconvolution (EDEC), (1, 60) a means to evaluate cell-specific DNA methylation, everolimus rescued 999 (34%) of the hypermethylated genes for bulk PBMCs (P = 0.0001), and 881 (30%) of hypermethylated genes in CD14+ monocytes (P = 5.8 × 10⁻⁴; Fig. 4 B–D, SI Appendix, Table S1). Everolimus diminished DNA hypermethylation of genes involved in the PI3K-mTOR, inflammatory, TNF, and IL-6-STAT3 pathways in both MDMΦ and patients (Fig. 4D). In conclusion, these data demonstrate a significant overlap in the capacity of everolimus to block infection-induced DNA hypermethylation in a MDMΦ LPS tolerance model and in TB patients during treatment.
Fig. 4.

DNA hypermethylation induced by TB disease is rescued by adjunctive Everolimus treatment with anti-TB therapy. (A) Study design and the time-point for DNA methylation analysis in the TB cohort from South Africa. TB patients were treated with SOC anti-TB Therapy with or without Everolimus (Evero). DNA methylation was evaluated from cryopreserved PBMCs at the end of TB treatment (day 180). (B) Comparison of everolimus-induced DNA hypomethylation between TB patients and the everolimus rescued DNA hypomethylation in the LPS-induced MDMΦ model. Comparison was made between both PBMCs and EDEC CD14+ monocytes. (C) Common 881 hypomethylated genes and their log2FC plotted as compared to everolimus nontreated TB patient participants demonstrating everolimus-induced DNA hypomethylation. The colors blue (Hypo, reduced) and Red (hyper, increased) represent relative log2fold methylation changes. MDMΦ (for consistency, it needs correction in the figure also): Monocyte-macrophages (D) Overrepresentation pathway analysis of Hallmark genes, with the P-value demonstrating the direction with red (hyper) or blue (Hypo) significantly enriched pathways.
Discussion
After successful treatment for pneumonia, sepsis, or TB, survivors have an increased mortality risk that persists for at least 5 y (9, 11, 61). Survivors of infections retain epigenetic scars that last at least 1.5 y after resolution of the infection (12, 16, 58). Previous cancer studies demonstrated that perturbations in TCA metabolism drive global epigenetic changes (40, 49, 62); however, it has been unclear whether similar metabolic–epigenetic interactions regulate infection-induced immune tolerance. The above studies demonstrate that LPS and TB induce a similar metabolic–epigenetic axis that regulates postinfectious immune function. Specifically, pneumonia, sepsis, and TB induce an increase in glycolysis and the TCA cycle that correlates with an increase in expression of DNA methylation related genes. LPS and the TCA metabolites, itaconate and succinate, induce DNA hypermethylation that limits human macrophage immune responsiveness (immune tolerance). Conversely, blocking the TCA cycle mitigates LPS-induced DNA hypermethylation and prevent reductions in LPS- and TB-induced immune responsiveness. Clinically, TB patient participants treated with adjunct everolimus have less DNA hypermethylation.
Host immunity must be precisely controlled to kill pathogens without inducing pathologic damage to infected tissues. Both cellular metabolism and epigenetic regulation limit immune destruction of host tissue (37, 44). However, after resolution of infection, survivors retain long-lasting detrimental epigenetic scars that limit immune responsiveness to new pathogens (1, 58). These studies demonstrate a mechanistic relationship between cellular metabolism and DNA methylation after LPS and TB. Additional studies are needed to evaluate whether these changes impact long-term clinical outcomes. The improved recovery of lung function in TB patients’ coadministrated everolimus (59) indicates reduced lung pathology. Long-term studies are needed to evaluate whether manipulating TCA metabolism or DNA methylation can mitigate the increase mortality observed after pneumonia, sepsis, and TB.
Studies implemented to date suggest that the metabolic–epigenetic axis is nonmonotonic and dependent upon dose and duration of immune activation (43). LPS, administered at high dose induces tolerances, however, low dose LPS induces innate training (20, 43). Similarly, β-glucan and BCG can induce beneficial epigenetic innate training (63). Limited, but current evidence suggests that severe infections up-regulating glycolysis and the TCA cycle with epigenetic and immune phenotypic changes rapidly progressing from inflammatory to immune tolerant (7, 44). This conclusion is supported by mouse studies that demonstrate that infection-induced epigenetic changes occur rapidly, within the first 24 h of a severe infection (44). It is problematic that most patients with pneumonia, sepsis, and especially TB do not present to clinical care early.
A major limitation of the 7-d in vitro studies is that the model may not recapitulate the temporal aspects of many severe infections. In the case of TB, for example, most patients are symptomatic for many weeks or months prior to diagnosis (64). It is promising that TB patients given everolimus had a decrease in infection-induced DNA hypermethylation, suggesting that this type of metabolic–epigenetic manipulation may still be beneficial long after the original infection. Other limitations of the study include the focus on DNA methylation without the quantification of relevant epigenetic mechanisms. Similarly, the study was limited in its focus on the detrimental DNA methylation changes induced during TB and sepsis, and future studies should evaluate the differences in metabolic triggers that discriminate beneficial innate training and detrimental tolerance.
The decrease in infection-induced DNA hypermethylation and reduction of infection-induced immune tolerance is observed not only with multiple inhibitors of cellular metabolism (metformin, rapamycin, everolimus), but also with targeted inhibitors of the TCA cycle (BAY1436032) and mediators of excessive ROS (GlyNAC and lycopene). These data provide strong evidence that there are likely overlapping metabolic–epigenetic pathways that converge on similar functional changes in immune cells. Previous in vitro and murine studies have identified at least three such metabolic–epigenetic axis, the NAD+-SIRT, succinate-αKG dioxygenase, and PAC1-NuRD (50). Each of these pathways can be targeted by safe, well-tolerated drugs and targeting the TCA cycle could inhibit all three. This evidence supports the need for human studies to identify host-directed therapies that can improve long-term clinical outcomes after severe and chronic infections.
The data do not suggest that mTOR or TCA inhibitors could replace standard of care antimicrobials, but that they could serve as adjunctive therapy to prevent pathologic inflammation and the formation of long-term epigenetic scars. This strategy may prevent immune-mediated lung pathology without the negative consequences of long-lasting DNA hypermethylation perturbing future immune responsiveness. However, it is critical to better understand whether this type of intervention would have deleterious effects by decreasing the antimicrobial effects. A recent study demonstrated that TB patients given metformin had only a slight decrease in time to culture conversion (less than 1 wk) yet improved lung healing (65). Studies have not identified the specific postinfection epigenetic scars that are associated with the increased risk of morbidity (increased cardiovascular disease, cancer, recurrent infection) or mortality, and both sepsis and TB are heterogenous diseases (66, 67). We expect that adjunctive metabolic interventions could most likely be reserved for the subset of sepsis and TB patients experiencing persistent pathologic inflammation despite successful antibiotics.
Methods
In Vitro Tolerance Model.
Plastic adhesion derived monocyte-macrophages or CD14 purified macrophages were used for the study and the origin is mentioned throughout the manuscript in the figure legends. Plastic adhesion was used for phenotype, DNA methylation, and microscopy, while CD14 negative selection magnetic bead selection was used for RPPA and quantifying TCA metabolites. The PBMCs, derived from healthy control donors, were isolated by density gradient centrifugation using ficoll. Plastic adhered monocytes were used starting with 1 × 10⁶ PBMC per well of a 48-well tissue culture plate and were allowed to adhere for 2 h in a CO2 incubator at 37 °C. The wells were washed three times with phosphate buffered saline (PBS) to remove nonadherent cells. The remaining adherent monocytes were retained for MDM. The purity of the plastic adhered monocytes was 80% on day 0 of the experiment and by day 5 it was >95% with no nonadherent cells present as determined by flow cytometry using cell markers CD14, CD16, CD19, CD3 to identify nonmacrophage populations. The CD14 -purified macrophages were obtained by the negative selection kit (STEMCELL), following the manufacturer’s instruction. The monocytes were cultured in R10 media, RPMI 1640 medium (Gibco) with 10% Human AB serum (MP Biomedical LLC) supplemented with 1% each of Penicillin-streptomycin (Gibco), sodium pyruvate (Corning), and L-glutamine (Gibco).
For the tolerance model, the monocytes were treated with Escherichia coli-derived LPS (Sigma-Aldrich) at a final concentration of 100 ng/mL for 48 h. After 48 h the cells were washed by removing the media and two PBS wash steps to remove any LPS from the wells, and the cells were replenished with the fresh R10-media. The cells were rested for 4 d with the media changed after 2 d. After 4 d the cells were retreated with LPS at a concentration of 10 ng/mL for 24 h and the supernatants collected for secreted cytokine level determination by enzyme-linked immunosorbent assay (ELISA). The unstimulated wells did not receive LPS and were treated with similar washing and media replenishing steps. For the metabolite experiments, the metabolites, either dimethyl succinate (Sigma Aldrich, #W239607) (17 mM, 8.5 mM, or 0.85 mM) or Itaconic acid (Sigma-Aldrich, Cat #I29204-100G) (10 mM, 5 mM, or 2.5 mM) were added to the monocytes without LPS for the first 48 h, followed by 4 d of rest, followed by LPS restimulation (10 ng/mL) for overnight stimulation. For treatment with Mtb–induced tolerant experiments, antigens preparation was used including H37Rv total lipids (NR-14837) and purified Mtb H37Rv Phthiocerol Dimycocerosate (PDIM;NR-20328) were obtained from BEI resources, NIAID, NIH. Both were used at a concentration of 1 μg/mL (0.1% dimethyl sulfoxide (DMSO)), followed by washing, 4 d of rest in normal media and then LPS restimulations on day 7 with supernatant collected the morning of d8. The cell numbers remained similar throughout the experiment as ascertained by confluency observations (<70% at all treatments and time points) and manual counting in the initial set-up experiments. The treatments including the metabolites and drugs, did not affect cell-viability as ascertained by trypan blue staining and confluence. TCA metabolites were quantified as previously described by the BCM metabolomics core (68).
Chemical Inhibitors.
For the inhibitor experiments, after isolation, monocytes were treated with the inhibitors, overnight (16 h) before LPS treatment. The inhibitors used were rapamycin at 5 mM, everolimus at 200 ng/mL in DMSO, metformin at 1 mM in H2O, BAY1436032 at 25 mM in DMSO, lycopene at 4 μM in chloroform (Sigma Aldrich), glycine at 5 mM in H2O (Sigma Aldrich), and N-acetyl-cysteine at 5 mM in H2O (Sigma Aldrich), combined 1:1 and used as GlyNAC.
ELISA.
A Human IL-6 ELISA kit (Biolegend) was implemented according to the manufacturer’s instruction and optical density recorded at 450 nm. ELISA data were analyzed using GainData (Arigo Biolaboratories, https://www.arigobio.com/elisa-analysis). Standards were plotted using five parameter logistic regression. The supernatants were diluted 1:1 and the readings obtained within the linear range of the standard curve were used to calculate the IL-6 concentrations. The standards were run in triplicate and the samples in duplicates. For multiplexed cytokine and chemokine detection, the supernatants were measured using an eight-analyte panel (IL-6, CXCL10, TNFα, IFNG, IL1β, IL-10, and IL-1RA) from LEGENDplex (Biolegend). The ELISA was carried out on 1:1 diluted supernatant as per the manufacturer’s instruction. The data were acquired on a Fortessa (BD Biosciences), and the fcs files were uploaded and processed using the BioLegend online ELISA software (https://legendplex.qognit.com) which process the FCS files and determines the unknown using the median fluorescent intensity of a standard curve. The processed data were downloaded in.csv format and analyzed further using GraphPad Prism (Version 9.3.0).
DNA Methylation.
Tolerance experiment protocol with and without drugs or metabolites were followed and the DNA extracted on the 8th day. DNA was extracted using the DNAeasy kit (Qiagen). The extracted DNA was quantified by fluorometry using the Qubit BR DNA measurement kit (Fisher Scientific). DNA methylation was analyzed using the Illumina DNA Methyl EPIC arrays (Illumina Inc.) as previously described (1, 24). Drugs used for the DNA methylation analysis Metformin (1 mM), Everolimus (200 ng/mL), GlyNAC (5 mM of equal parts Glycine and N-acetyl cysteine (NAC) each). In the experiments analyzing the effect of exogenous metabolites on DNA methylation, the monocytes were treated with 10 mM of Itaconic acid and 17 mM of Dimethyl succinate for 48 d, followed by washing, resting the cells for 5 d, and then extracting DNA at Day7, with no LPS stimulation. Captured IDAT files were processed using minfi package in R as previously described. The normalized, processed data were used for differential analysis (P < 0.05) between the treated and unstimulated groups and Log2FC values are depicted in heatmaps. DNA hypermethylation was defined as increased log2FC as compared to unstimulated samples; similarly, hypomethylation was a decrease in FC as compared to the unstimulated samples. Differential genes were used for Overrepresentation analysis for identifying common pathways using databases such as MsigDB (Hallmark gene sets). Web-based pathway enrichment including Metascape (Metascape online pathway analysis portal (https://metascape.org/gp/index.html#/main/step1) and Enrichr (https://maayanlab.cloud/Enrichr/) was also used for broader search as they include multiple ontology resources. The use of specific database and tools have been mentioned in the text as they appear and part of supplementary tables.
Confocal Microscopy.
Confocal microscopy was implemented using a Leica TCS SP8 confocal system (Leica Microsystems) in order to examine the subcellular localization of DNMT3B and the TCA cycle proteins (IDH3A and CS) after LPS, succinate, itaconate, and Mtb antigens (total lipids from H37Rv and PDIM) stimulation. The isolated monocytes were cultured in 12-well chamber slide (Ibidi), and nonadherent cells were washed off after 2 h. The cells were treated with LPS ± drugs or left untreated. A time course (2 h, 4 h, 8 h, 16 h,24 h,48 h and 7 d) was carried out to determine when the change was occurring within the cells. For subsequent experiments, 16 h drug pretreatment and 48-h LPS treatment was determined as the optimal time points. Cells were stained in the chamber for Isocitrate dehydrogenase (IDH3A) primary (abcam, ab154866), followed by Alexa Flour 488 conjugated secondary Ab (abcam, ab 150077) and CS, conjugated Ab on AF647. After staining and washing the cells were mounted in ProLong gold antifade (Life Technologies), including the nuclear stain DAPI. DNMT3B (abcam, ab227883) was visualized using the AF488 secondary Ab (abcam, ab196860). Acquired images at 65× and a 100× magnification were analyzed using Volocity software (PerkinElmer). Images were acquired and analyzed in the x-, y-, and z-axes at 0.5-μm-thick slices with a median thickness of 10 μm (range, 4 to 21 μm) per image. The scale bar range for the representative images is 3.8 μm to 9 μm. Approximately 20 to 80 cells per condition were analyzed from a minimum of 3 to 6 biologic replicates per experiment.
RPPA for Proteome Analysis.
Phosphoproteomic changes were identified using RPPA, an antibody-based targeted proteomics platform including 268 proteins (69). Unstimulated and 48-h LPS stimulated cells CD14-purified monocytes with and without drugs (Metformin, Everolimus, BAY1436032) were subjected to protein isolation as previously described (69). Approximately 4 × 10⁶ monocytes were analyzed. After treatment, the cells were spun at 300× g to obtain a pellet and the supernatant discarded. The pellets were flash frozen in liquid nitrogen, thawed on ice, and then, the pellet was resuspended in RPPA working solution (1 mL of 5× protease inhibitor, 1 mL 3 mL RPPA lysis buffer). After 30 min of incubation on ice, the samples were centrifuged at 14,000 × g for 15 min; for each sample, all the Protein concentrations were measured with a Qubit Protein assay (Thermofisher).
Gene Expression Pathway Analysis.
Whole blood gene expression from patients with TB patients (GSE42834) and sepsis (GSE154918) were downloaded from GEO. Overrepresentation pathway analysis, using Hallmark, Kyoto Encyclopedia of Genes and Genomes (KEGG), and GO, was implemented as previously described (1, 70).
Human In Vivo Validation.
In a previous clinic trial (59), active pulmonary TB patients received SOC antibiotics (rifampicin, isoniazid, pyrazinamide, ethambutol) or adjunctive host directed therapies with SOC. Cryopreserved PBMCs were available, with DNA methylation evaluated as described above for 35 participants who received SOC, and 33 participants who received SOC plus everolimus.
Supplementary Material
Appendix 01 (PDF)
Dataset S01 (XLSX)
Acknowledgments
Parts of this manuscript have been adapted from the dissertation of Andrew DiNardo, submitted to Radbound University. Abhimanyu (A) is supported by an NIH Integrated Network of Scholars in Global Health Research Training (INSIGHT) Fogarty Fellowship from NIH D43TW012274. A.R.D. is supported by National Institute of Allergy and Infectious Diseases (NIAID) K23 AI141681A, 1R01AG078268-01A1, and 1R01AI70774-01A1. A.M.M. is supported by NIH R01AI137527, U01GH00227847, and Department of Defense (DoD) (DTIC) W81XWH1910026. R.v.C. is supported by NIH (R01AI165721) and Cordis, EU (101007873), European & Developing Countries Clinical Trials Partnership (EDCTP) (RIA2018CO-2514). J.D.C. is supported by NIH grants 1R01AG078268-01A1 and 1R01AI70774-01A1 and funds provided by the Texas A&M University System. S.L.G. and C.C. were partially supported by the Cancer Prevention and Research Institute of Texas RP210227, the National Cancer Institute (NCI) Cancer Center Support Grant P30CA125123, National Institute of Environmental Health Science (NIEHS) grants P30 ES030285 and 1P42 ES0327725, and National Institute on Minority Health and Health Disparities (NIMHD) P50MD015496. The clinical trial of everolimus in patients with TB was supported by grant OPP1127276–2015 from the Bill & Melinda Gates Foundation (R.S.W., PI) and grant ACT4TB/HIV from the South African Medical Research Council (Gavin Churchyard, PI).
Author contributions
A. and A.R.D. designed research; A., S.C.L., T.N., M.L., D.S., A.L.M., T.C., and A.P.V. performed research; A., E.M.M., S.L.G., R.V.S., A.M.M., M.M., S.G., J.D.C., R.S.W., M.G.N., R.v.C., and A.R.D. contributed new reagents/analytic tools; A., S.L.G., and C.C. analyzed data; and A. and A.R.D. wrote the paper.
Competing interests
The authors declare no competing interest.
Footnotes
This article is a PNAS Direct Submission. M.D. is a guest editor invited by the Editorial Board.
Data, Materials, and Software Availability
DNA methylation array data have been deposited in Gene Expression Omnibus (GSE276988: LPS and Inhibitors and GSE277003: TB cohort) (71, 72). All other data are included in the article and/or supporting information.
Supporting Information
References
- 1.Dinardo A., et al. , DNA hyper-methylation during Tuberculosis dampens host immune responsiveness. J. Clin. Invest. 130, 3113–3123 (2020). [DOI] [PMC free article] [PubMed] [Google Scholar]
- 2.Waitt C. J., et al. , Monocyte unresponsiveness and impaired IL1beta, TNFalpha and IL7 production are associated with a poor outcome in Malawian adults with pulmonary tuberculosis. BMC Infect. Dis. 15, 513 (2015). [DOI] [PMC free article] [PubMed] [Google Scholar]
- 3.Divangahi M., Khan N., Kaufmann E., Beyond killing Mycobacterium tuberculosis: Disease tolerance. Front. Immunol. 9, 2976 (2018). [DOI] [PMC free article] [PubMed] [Google Scholar]
- 4.Hmama Z., Pena-Diaz S., Joseph S., Av-Gay Y., Immunoevasion and immunosuppression of the macrophage by Mycobacterium tuberculosis. Immunol. Rev. 264, 220–232 (2015). [DOI] [PubMed] [Google Scholar]
- 5.Sahiratmadja E., et al. , Dynamic changes in pro- and anti-inflammatory cytokine profiles and gamma interferon receptor signaling integrity correlate with tuberculosis disease activity and response to curative treatment. Infect. Immunity 75, 820–829 (2007). [DOI] [PMC free article] [PubMed] [Google Scholar]
- 6.Joosten S. A., et al. , Mycobacterial growth inhibition is associated with trained innate immunity. J. Clin. Invest. 128, 1837–1851 (2018). [DOI] [PMC free article] [PubMed] [Google Scholar]
- 7.Vachharajani V., Mccall C. E., Epigenetic and metabolic programming of innate immunity in sepsis. Innate Immun. 25, 267–279 (2019). [DOI] [PMC free article] [PubMed] [Google Scholar]
- 8.Van Der Slikke E. C., An A. Y., Hancock R. E. W., Bouma H. R., Exploring the pathophysiology of post-sepsis syndrome to identify therapeutic opportunities. Ebiomedicine 61, 103044 (2020). [DOI] [PMC free article] [PubMed] [Google Scholar]
- 9.Prescott H. C., Osterholzer J. J., Langa K. M., Angus D. C., Iwashyna T. J., Late mortality after sepsis: Propensity matched cohort study. BMJ 353, I2375 (2016). [DOI] [PMC free article] [PubMed] [Google Scholar]
- 10.Romanowski K., et al. , Long-term all-cause mortality in people treated for tuberculosis: A systematic review and meta-analysis. The Lancet. Infect. Dis. 19, 1129–1137 (2019). [DOI] [PubMed] [Google Scholar]
- 11.Sandvall B., Rueda A. M., Musher D. M., Long-term survival following pneumococcal pneumonia. Clin. Infect. Dis. 56, 1145–1146 (2013). [DOI] [PubMed] [Google Scholar]
- 12.Dinardo A. R., Netea M. G., Musher D. M., Postinfectious epigenetic immune modifications—A double-edged sword. N. Engl. J. Med. 384, 261–270 (2021). [DOI] [PMC free article] [PubMed] [Google Scholar]
- 13.Yates K. B., et al. , Epigenetic scars of CD8(+) T cell exhaustion persist after cure of chronic infection in humans. Nat. Immunol. 22, 1020–1029 (2021). [DOI] [PMC free article] [PubMed] [Google Scholar]
- 14.Pennini M. E., et al. , CCAAT/enhancer-binding protein beta and delta binding to CIITA promoters is associated with the inhibition of CIITA expression in response to Mycobacterium tuberculosis 19-kDa lipoprotein. J. Immunol. 179, 6910–6918 (2007). [DOI] [PMC free article] [PubMed] [Google Scholar]
- 15.Pennini M. E., Pai R. K., Schultz D. C., Boom W. H., Harding C. V., Mycobacterium tuberculosis 19-kDa lipoprotein inhibits IFN-gamma-induced chromatin remodeling of MHC2TA by TLR2 and MAPK signaling. J. Immunol. 176, 4323–4330 (2006). [DOI] [PubMed] [Google Scholar]
- 16.Wen H., Dou Y., Hogaboam C. M., Kunkel S. L., Epigenetic regulation of dendritic cell-derived interleukin-12 facilitates immunosuppression after a severe innate immune response. Blood 111, 1797–1804 (2008). [DOI] [PMC free article] [PubMed] [Google Scholar]
- 17.Zheng L., et al. , Unraveling methylation changes of host macrophages in Mycobacterium tuberculosis infection. Tuberculosis 98, 139–148 (2016). [DOI] [PubMed] [Google Scholar]
- 18.Martinez G. J., et al. , The transcription factor NFAT promotes exhaustion of activated CD8(+) T cells. Immunity 42, 265–278 (2015). [DOI] [PMC free article] [PubMed] [Google Scholar]
- 19.Mognol G. P., et al. , Exhaustion-associated regulatory regions in CD8(+) tumor-infiltrating T cells. Proc. Natl. Acad. Sci. U.S.A. 114, E2776–E2785 (2017). [DOI] [PMC free article] [PubMed] [Google Scholar]
- 20.Saeed S., et al. , Epigenetic programming of monocyte-to-macrophage differentiation and trained innate immunity. Science 345, 1251086 (2014). [DOI] [PMC free article] [PubMed] [Google Scholar]
- 21.Ahn E., et al. , Demethylation of the PD-1 promoter is imprinted during the effector phase of CD8 T cell exhaustion. J. Virol. 90, 8934–8946 (2016). [DOI] [PMC free article] [PubMed] [Google Scholar]
- 22.Ghoneim H. E., et al. , De novo epigenetic programs inhibit PD-1 blockade-mediated T cell rejuvenation. Cell 170, 142–157.e19 (2017). [DOI] [PMC free article] [PubMed] [Google Scholar]
- 23.Youngblood B., et al. , Cutting edge: Prolonged exposure to HIV reinforces a poised epigenetic program for PD-1 expression in virus-specific CD8 T cells. J. Immunol. 191, 540–544 (2013). [DOI] [PMC free article] [PubMed] [Google Scholar]
- 24.Dinardo A. R., et al. , Schistosomiasis induces persistent DNA methylation and tuberculosis-specific immune changes. J. Immunol. 201, 124–133 (2018). [DOI] [PMC free article] [PubMed] [Google Scholar]
- 25.Mcmurray D. N., Echeverri A., Cell-mediated immunity in anergic patients with pulmonary tuberculosis. Am. Rev. Respir. Dis. 118, 827–834 (1978). [DOI] [PubMed] [Google Scholar]
- 26.Sousa A. O., et al. , An epidemic of tuberculosis with a high rate of tuberculin anergy among a population previously unexposed to tuberculosis, the Yanomami Indians of the Brazilian Amazon. Proc. Natl. Acad. Sci. U.S.A. 94, 13227–13232 (1997). [DOI] [PMC free article] [PubMed] [Google Scholar]
- 27.Carson W. F., Cavassani K. A., Dou Y., Kunkel S. L., Epigenetic regulation of immune cell functions during post-septic immunosuppression. Epigenetics 6, 273–283 (2011). [DOI] [PMC free article] [PubMed] [Google Scholar]
- 28.Sweeney T. E., Shidham A., Wong H. R., Khatri P., A comprehensive time-course-based multicohort analysis of sepsis and sterile inflammation reveals a robust diagnostic gene set. Sci. Transl. Med. 7, 287ra271 (2015). [DOI] [PMC free article] [PubMed] [Google Scholar]
- 29.Foster S. L., Hargreaves D. C., Medzhitov R., Gene-specific control of inflammation by TLR-induced chromatin modifications. Nature 447, 972–978 (2007). [DOI] [PubMed] [Google Scholar]
- 30.Shi L., Jiang Q., Bushkin Y., Subbian S., Tyagi S., Biphasic dynamics of macrophage immunometabolism during Mycobacterium tuberculosis infection. mbio 10, e02550-18 (2019). [DOI] [PMC free article] [PubMed] [Google Scholar]
- 31.Buck M. D., Sowell R. T., Kaech S. M., Pearce E. L., Metabolic instruction of immunity. Cell 169, 570–586 (2017). [DOI] [PMC free article] [PubMed] [Google Scholar]
- 32.Bengsch B., et al. , Bioenergetic insufficiencies due to metabolic alterations regulated by the inhibitory receptor PD-1 are an early driver of CD8(+) T cell exhaustion. Immunity 45, 358–373 (2016). [DOI] [PMC free article] [PubMed] [Google Scholar]
- 33.Venet F., Monneret G., Advances in the understanding and treatment of sepsis-induced immunosuppression. Nat. Rev. Nephrol. 14, 121–137 (2018). [DOI] [PubMed] [Google Scholar]
- 34.Warburg O., Wind F., Negelein E., The metabolism of tumors in the body. J. Gen. Physiol. 8, 519–530 (1927). [DOI] [PMC free article] [PubMed] [Google Scholar]
- 35.Russell S. L., et al. , Compromised metabolic reprogramming is an early indicator of CD8(+) T cell dysfunction during chronic mycobacterium tuberculosis infection. Cell Rep. 29, 3564–3579.e5 (2019). [DOI] [PMC free article] [PubMed] [Google Scholar]
- 36.Mills E. L., et al. , Itaconate is an anti-inflammatory metabolite that activates Nrf2 via alkylation of KEAP1. Nature 556, 113–117 (2018). [DOI] [PMC free article] [PubMed] [Google Scholar]
- 37.Nair S., et al. , Irg1 expression in myeloid cells prevents immunopathology during M. tuberculosis infection. J. Exp. Med. 215, 1035-1045 (2018). [DOI] [PMC free article] [PubMed] [Google Scholar]
- 38.Dominguez-Andres J., et al. , The itaconate pathway is a central regulatory node linking innate immune tolerance and trained immunity. Cell Metab. 29, 211–220.e5 (2019). [DOI] [PubMed] [Google Scholar]
- 39.Ferreira A. V., et al. , Dimethyl itaconate induces long-term innate immune responses and confers protection against infection. Cell Rep. 42, 112658 (2023). [DOI] [PubMed] [Google Scholar]
- 40.Figueroa M. E., et al. , Leukemic IDH1 and IDH2 mutations result in a hypermethylation phenotype, disrupt TET2 function, and impair hematopoietic differentiation. Cancer Cell 18, 553–567 (2010). [DOI] [PMC free article] [PubMed] [Google Scholar]
- 41.Tyrakis P. A., et al. , S-2-hydroxyglutarate regulates CD8(+) T-lymphocyte fate. Nature 540, 236–241 (2016). [DOI] [PMC free article] [PubMed] [Google Scholar]
- 42.Bunse L., et al. , Suppression of antitumor T cell immunity by the oncometabolite (R)-2-hydroxyglutarate. Nat. Med. 24, 1192–1203 (2018). [DOI] [PubMed] [Google Scholar]
- 43.Ifrim D. C., et al. , Trained immunity or tolerance: Opposing functional programs induced in human monocytes after engagement of various pattern recognition receptors. Clin. Vaccine Immunol. 21, 534–545 (2014). [DOI] [PMC free article] [PubMed] [Google Scholar]
- 44.Vachharajani V. T., et al. , SIRT1 inhibition during the hypoinflammatory phenotype of sepsis enhances immunity and improves outcome. J. Leukoc. Biol. 96, 785–796 (2014). [DOI] [PMC free article] [PubMed] [Google Scholar]
- 45.Bloom C. I., et al. , Transcriptional blood signatures distinguish pulmonary tuberculosis, pulmonary sarcoidosis, pneumonias and lung cancers. PLoS One 8, E70630 (2013). [DOI] [PMC free article] [PubMed] [Google Scholar]
- 46.Lorente-Sorolla C., et al. , Inflammatory cytokines and organ dysfunction associate with the aberrant DNA methylome of monocytes in sepsis. Genome Med. 11, 66 (2019). [DOI] [PMC free article] [PubMed] [Google Scholar]
- 47.Shalova I. N., et al. , Human monocytes undergo functional re-programming during sepsis mediated by hypoxia-inducible factor-1alpha. Immunity 42, 484–498 (2015). [DOI] [PubMed] [Google Scholar]
- 48.Novakovic B., et al. , beta-glucan reverses the epigenetic state of LPS-induced immunological tolerance. Cell 167, 1354–1368.e14 (2016). [DOI] [PMC free article] [PubMed] [Google Scholar]
- 49.Martinez-Reyes I., Chandel N. S., Mitochondrial TCA cycle metabolites control physiology and disease. Nat. Commun. 11, 102 (2020). [DOI] [PMC free article] [PubMed] [Google Scholar]
- 50.Abhimanyu F. N., et al. , Reversing post-infectious epigenetic-mediated immune suppression. Front. Immunol. 12, 688132 (2021). [DOI] [PMC free article] [PubMed] [Google Scholar]
- 51.Dan L., et al. , The phosphatase PAC1 acts as a T cell suppressor and attenuates host antitumor immunity. Nat. Immunol. 21, 287–297 (2020). [DOI] [PubMed] [Google Scholar]
- 52.Chandel N. S., Navigating Metabolism (Cold Spring Harbor Laboratory Press, Cold Spring Harbor, NY, 2015), p. 248. [Google Scholar]
- 53.Coarfa C., et al. , Reverse-phase protein array: Technology, application, data processing, and integration. J. Biomol. Tech. 32, 15–29 (2021). [DOI] [PMC free article] [PubMed] [Google Scholar]
- 54.Chen L. L., et al. , Itaconate inhibits TET DNA dioxygenases to dampen inflammatory responses. Nat. Cell Biol. 24, 353–363 (2022). [DOI] [PMC free article] [PubMed] [Google Scholar]
- 55.Laukka T., et al. , Fumarate and succinate regulate expression of hypoxia-inducible genes via TET enzymes. J. Biol. Chem. 291, 4256–4265 (2016). [DOI] [PMC free article] [PubMed] [Google Scholar]
- 56.Warburg O., Gawehn K., Geissler A. W., Metabolism of leukocytes. Z. Naturforsch B 13b, 515–516 (1958). [PubMed] [Google Scholar]
- 57.Herwanto V., et al. , Blood transcriptome analysis of patients with uncomplicated bacterial infection and sepsis. BMC Res. Notes 14, 76 (2021). [DOI] [PMC free article] [PubMed] [Google Scholar]
- 58.Roquilly A., et al. , Alveolar macrophages are epigenetically altered after inflammation, leading to long-term lung immunoparalysis. Nat. Immunol. 21, 636–648 (2020). [DOI] [PubMed] [Google Scholar]
- 59.Wallis R. S., et al. , Adjunctive host-directed therapies for pulmonary tuberculosis: A prospective, open-label, phase 2, randomised controlled trial. The Lancet. Respirat. Med. 9, 897–908 (2021). [DOI] [PMC free article] [PubMed] [Google Scholar]
- 60.Onuchic V., et al. , Epigenomic deconvolution of breast tumors reveals metabolic coupling between constituent cell types. Cell Rep. 17, 2075–2086 (2016). [DOI] [PMC free article] [PubMed] [Google Scholar]
- 61.Christensen A. S., Roed C., Andersen P. H., Andersen A. B., Obel N., Long-term mortality in patients with pulmonary and extrapulmonary tuberculosis: A Danish nationwide cohort study. Clin. Epidemiol. 6, 405–421 (2014). [DOI] [PMC free article] [PubMed] [Google Scholar]
- 62.Figueroa M. E., et al. , DNA methylation signatures identify biologically distinct subtypes in acute myeloid leukemia. Cancer Cell 17, 13–27 (2010). [DOI] [PMC free article] [PubMed] [Google Scholar]
- 63.Arts R. J. W., et al. , Immunometabolic pathways in Bcg-induced trained immunity. Cell Rep. 17, 2562–2571 (2016). [DOI] [PMC free article] [PubMed] [Google Scholar]
- 64.Sreeramareddy C. T., Panduru K. V., Menten J., Van Den Ende J., Time delays in diagnosis of pulmonary tuberculosis: A systematic review of literature. BMC Infect. Dis. 9, 91 (2009). [DOI] [PMC free article] [PubMed] [Google Scholar]
- 65.Padmapriydarsini C., et al. Randomized trial of metformin with anti-tuberculosis drugs for early sputum conversion in adults with pulmonary tuberculosis. Clin. Infect. Dis. 75, 425–434 (2021). [DOI] [PMC free article] [PubMed] [Google Scholar]
- 66.Sweeney T. E., et al. , Unsupervised analysis of transcriptomics in bacterial sepsis across multiple datasets reveals three robust clusters. Crit. Care Med. 46, 915–925 (2018). [DOI] [PMC free article] [PubMed] [Google Scholar]
- 67.Dinardo A. R., et al. , Gene expression signatures identify biologically and clinically distinct tuberculosis endotypes. Eur. Respirat. J. 60, 2102263 (2022). [DOI] [PMC free article] [PubMed] [Google Scholar]
- 68.Yoon W. H., et al. , Loss of nardilysin, a mitochondrial co-chaperone for alpha-ketoglutarate dehydrogenase, promotes mTORC1 activation and neurodegeneration. Neuron 93, 115–131 (2017). [DOI] [PMC free article] [PubMed] [Google Scholar]
- 69.Wang X., et al. , High-High-throughput profiling of histone post-translational modifications and chromatin modifying proteins by reverse phase protein array. J. Proteomics (2022), 10.1016/J.Jprot.2022.104596,104596. [DOI] [PMC free article] [PubMed] [Google Scholar]
- 70.Bobak C. A., et al. , Increased DNA methylation, cellular senescence and premature epigenetic aging in guinea pigs and humans with tuberculosis. Aging (Albany NY) 14, 2174–2193 (2022). [DOI] [PMC free article] [PubMed] [Google Scholar]
- 71.Abhimanyu, et al. , TCA metabolism regulates DNA hypermethylation in LPS and Mycobacterium tuberculosis–induced immune tolerance. Gene Expression Omnibus. https://www.ncbi.xyz/geo/query/acc.cgi?acc=GSE276988. Deposited 12 September 2024. [DOI] [PMC free article] [PubMed]
- 72.Abhimanyu, et al. , TCA metabolism regulates DNA hypermethylation in LPS and Mycobacterium tuberculosis–induced immune tolerance. Gene Expression Omnibus. https://www.ncbi.xyz/geo/query/acc.cgi?acc=GSE277003. Deposited 12 September 2024. [DOI] [PMC free article] [PubMed]
Associated Data
This section collects any data citations, data availability statements, or supplementary materials included in this article.
Supplementary Materials
Appendix 01 (PDF)
Dataset S01 (XLSX)
Data Availability Statement
DNA methylation array data have been deposited in Gene Expression Omnibus (GSE276988: LPS and Inhibitors and GSE277003: TB cohort) (71, 72). All other data are included in the article and/or supporting information.