

Abstract
Background
Early reports showed that patients with COVID-19 had recrudescence of previously resolved coccidioidomycosis (Valley fever, VF), and there were indications that coinfection had more severe outcomes. We therefore investigated serial infection of Coccidioides posadasii and SARS-CoV-2 in a K18-hACE2 mouse model to assess disease outcomes.
Methods
In our model, we challenged K18-hACE2 mice sequentially with a sub-lethal dose of SARS-CoV-2 and 24 hours later with low virulence strain of Coccidioides posadasii, and vice versa, compared to mice that only received a single infection challenge. We performed survival and pathogenesis mouse studies as well as looked at the systemic immune response differences between treatment groups.
Results
Here we show that co-infected groups have a more severe disease progression as well as a decrease in survival. Importantly, results differ depending on the SARS-CoV-2 variant (WA-1, Delta, or Omicron) and infection timing (SARS-CoV-2 first, C. posadasii second or vice versa). We find that groups that are infected with the virus first had a decrease in survival, increased morbidity and weight loss, increased fungal and viral burdens, differences in immune responses, and the amount and size of fungal spherules. We also find that groups coinfected with C. posadasii first have a decrease fungal burden and inflammatory responses.
Conclusions
This is the first in vivo model investigation of a coinfection of SARS-CoV-2 and Coccidioides. Because of the potential for increased severity of disease in a coinfection, we suggest populations that live in areas of high coccidioidomycosis endemicity may experience higher incidence of complicated disease progression with COVID-19.
Subject terms: Fungal pathogenesis, SARS-CoV-2, Fungal infection, Viral infection, Clinical microbiology
Plain Language Summary
The Covid-19 pandemic presented significant challenges to healthcare systems. One of these was the increase in secondary infections, where a patient had both SARS-Cov2 and another infectious disease. Fungal infections co-occurring with or after a Covid-19 infection are of interest due to treatment challenges and more severe illness in patients. Valley fever is a fungal infection prevalent in the southwestern United States and arid regions of Central and South America. Reports from these regions showed an increase in Valley fever cases coinciding with the rise of Covid-19. We therefore investigated how these two pathogens interacted with each other and the host in laboratory-controlled mouse experiments. We observed increased mortality when mice were exposed to the virus first followed by a fungal infection. Although more investigations are needed, our results should be taken into consideration in a clinical setting.
Kollath et al. develop a murine model for testing the pathogenesis of a SARS-CoV-2 and Coccidioides posadasii co-infection and find that when mice are infected first with the virus, greater disease severity occurs. This has implications for people living in the endemic area for coccidioidomycosis as well as other emerging viruses.
Introduction
Globally, fungal infections are a significant cause of human morbidity and mortality, with disease manifestations ranging from cutaneous to systemic dissemination1,2. Many of these infections are caused by pathogens (e.g., Aspergillus spp. and Candida spp.) that exploit this host niche when the immune system is compromised. However, some fungi can cause severe disease in otherwise healthy hosts in addition to the immunocompromised. One of these is Coccidioides posadasii, the causative agent of coccidioidomycosis in Arizona, commonly known as Valley fever. This fungus is endemic to semi-arid to arid regions of North, South and Central America3. Although C. posadasii can cause disease in hosts with intact immune systems, conditions that suppress the immune system such as HIV and diabetes, can lead to a more severe disease outcome4,5. Clinical disease caused by Coccidioides posadasii, and its sister species C. immitis, ranges from primary pneumonia to fungal meningitis6–8.
Severe respiratory viral infections increase risk for coinfection with other microbes, including fungi, and are often associated with patient morbidity and mortality2. The emergence of severe acute respiratory syndrome coronavirus 2 (SARS-CoV-2), the causative agent of coronavirus disease 2019 (COVID-19) has the potential to lead to more severe outcomes when coinfections occur with other established pathogens, such as endemic fungi. Coinfection may play an important and underexplored role in increasing morbidity and mortality of patients with COVID-199,10. It is estimated that 50% of patients that died from SARS-CoV-2 infection had secondary microbial infections11. Thus, it is reasonable to consider whether SARS-CoV-2 infections result in more severe disease among people living in and traveling to regions endemic for Valley fever due to the potential risk for coinfection.
Epidemiological evidence shows a positive relationship between the incidence of COVID-19 and coccidioidomycosis in highly endemic regions such as Maricopa County in Arizona and Kern County in California12. Clinically, there are several examples that show recrudescence of Valley fever following COVID-19, as well as simultaneous presentation of both diseases, which led to a more rapid Valley fever disease progression13–15. For example, a medical center in Arizona reported 60 patients that had Valley fever simultaneously with SARS-CoV-2 infection from January 1st to December 31st 2020 and detailed complications with Valley fever after the development of COVID-1914. Another study showed that there was an increase in mortality in patients with SARS-CoV-2 and bacterial or fungal coinfections with notable increased inflammatory immune response syndrome (IRIS) and tissue damage16,17. However, no in vivo mouse model exists to evaluate SARS-CoV-2 and Coccidioides concurrent infections to discover mechanisms that might be responsible for these observations.
The immune response to fungal-viral coinfections is poorly understood, with much of the knowledge coming from invasive aspergillosis following influenza infection. The primary immune response to one pathogen can impact subsequent immunity to a secondary infection during the course of the disease of the primary infection. This phenomenon is mostly understood in the context of vaccines but can play a crucial role in viral-fungal coinfections2,18,19. Although few studies have investigated the immune response during viral-fungal coinfections, secondary fungal infection is thought to lead to the destruction of epithelium, which impairs certain cellular immune processes, including T-lymphocyte responses, phagocytosis, cytokine production, neutrophil recruitment and activation, and reactive oxygen species2,20–22. In the case of invasive aspergillosis, viral disruption of respiratory epithelium and impaired localized immunity in addition to viral-induced Th1/Th2 modulations and lymphopenia can result in the proliferation of the fungus after influenza infection23–26. However, the disease progression and immune responses of a SARS-CoV-2 infection (viral tropism, replication, and incubation period) is different from influenza which could result in variable outcomes during a fungal coinfection27–31. These differences can lead to modifications in immune responses that could either facilitate or prohibit the establishment of Coccidioides and the development of coccidioidomycosis.
To examine the pathogenesis and immune response of a SARS-CoV-2/Coccidioides posadasii coinfection we establish a model of sequential lung infections in transgenic K18-hACE2 mice. We observe higher morbidity and mortality in mice that are challenged with both the fungus and virus compared to mice that are challenged with one pathogen. We also find that the order in which the pathogens are introduced to the mice play an important role in both disease dynamics as well as immune responses.
Methods
Ethics statement
Mouse studies were performed in an animal biosafety level 3 (ABSL3) laboratory. The animal protocol for these studies was reviewed and approved by the institutional animal care and use committee (IACUC) of Northern Arizona University (Protocol # 21-025). We complied with all relevant ethical regulations for animal testing and research.
Viral variants and preparation
We used three variants (USA-WA1/2020, B.1.617.2-Delta, and the B.1.1.529-Omicron) of SARS-CoV-2 in this study. The WA1 and Omicron variants were obtained from the Biodefense and Emerging Infections Research Resources (BEI Resources WA1 # NR-52281, Omicron # NR-56461). The Delta variant was propagated from a clinical strain that was collected at The Translational Genomics Research Institute (TGen) North in Flagstaff, Arizona, USA. The viruses were propagated using Vero-E6 cells (ATCC) and were cultured in Dulbecco’s modified Eagle’s medium (DMEM) with the addition of 10% fetal bovine serum at 37o C and 5% CO2. Cells were inoculated with the virus at a multiplicity of infection of 0.001 and cultured for 96 hours. The supernatant was collected by ultracentrifugation and titrated using a plaque assay to quantify plaque-forming units (PFU) following our published protocols32.
Fungal strain and preparation
Coccidioides posadasii strain RMSCC 1038 was received from the Galgiani lab at the University of Arizona. This strain of C. posadasii has been shown to have decreased virulence in C57BL/6 J mice33. The fungus was grown on 2xGYE agar (2% glucose, 1% yeast extract, and 1.5% agar) at 30o C for 4-8 weeks at which time infectious arthroconidia were harvested and quantified using the methods described in Mead et al. 202034. Briefly, arthroconidia were discharged from agar plates using a cell scraper into 1x phosphate-buffered saline (PBS) to disrupt sufferance tension. The supernatant was passed through a 70-micron cell strainer filter (Corning, #431751) to ensure that hyphae and other cell debris are removed. The cells are then pelleted by centrifuging for 8 minutes at 12,000 x g. The supernatant is discarded and the cell pellet resuspended in clean PBS. This process is repeated and the cells concentrated to a 5 mL cell solution. Viable arthroconidia are quantified by a dilution series and grown on 2x GYE agar plates at 30o C for up to 4 days.
Mice
Six to eight-week-old male and female K18-hACE2 transgenic mice, in which the human keratin 18 promoter was inserted in the mouse genome to induce the expression of the human ACE2 receptor making these mice susceptible to SARS-CoV-232, were purchased from Jackson Laboratories. The genetic background of the transgenic mice is C57BL/6 N backcrossed to C57BL/6 J, which is a mouse model that is commonly used in coccidioidomycosis disease studies33. Mouse numbers were chosen to achieve adequate sample sizes for statistical analysis and led to the development of our infection model (Supplemental Fig. 1). No mice were excluded from these studies.
Infection models
Survival study
We developed a successive method for infecting mice with both pathogens (Supplemental Fig. 1). For survival studies, mice were observed for up to 21 days or euthanized earlier if significantly moribund (> 20% weight loss, or a combination of inactivity, ataxia, ruffled coat condition, or dehydration). For the first survival study, 6 mice per group with 11 different treatment groups were used. Groups are as follows: WA-1::Cp, Cp::WA-I, PBS::WA-1, Delta::Cp, Cp::Delta, PBS::Delta, Omicron::CP, Cp::Omicron, PBS::Omicron, Cp::PBS, PBS::Cp (::=followed by). The second survival study was conducted with only Delta and Omicron viral variants for 8 groups with 6 mice per group: Delta::Cp, Cp::Delta, PBS::Delta, Omicron::CP, Cp::Omicron, PBS::Omicron, Cp::PBS, PBS::Cp. Initial infections all occurred on day -1 and second infection occurred 24 hours later on day 0. All mice were intranasally infected under ketamine-xylazine (80/8 mg/kg) anesthesia34. Inoculum dosages used were 100 arthroconidia of C. posadasii strain 1038 and 100 plaque-forming units (PFU) of one viral variant in 25 µL volume using a micropipette. Based on previous publications, these dosages should not result in lethal infection32,33,35,36. Fungal burden was quantified by calculating colony forming units (CFUs) in lungs, brain, and spleen by serial dilution of homogenized tissues and plating on GYE agar supplemented with penicillin/streptomycin (1 mg/mL) antibiotics to discourage bacterial growth that may be present in the tissues. Lungs were split using half for fungal burden (all lobes of right lung) and half placed in 10% PBS-buffered formalin for histology (left lung). Agar plates were placed in an incubator at 30 oC for up to 7 days at which time colonies were visually counted.
Pathogenesis study
For the follow-up pathogenesis study, 48 mice were used with 4 groups of 12 mice per group, which were WA-1::Cp, Cp::WA-1, PBS::WA-1, and PBS::Cp. Three mice per group were euthanized on days 1-, 3-, 5-, and 6-days postinfection. Initial infections all occurred on day −1 and second infection occurred 24 hours later on day 0. All mice were intranasally infected under ketamine-xylazine (80/8 mg/kg) anesthesia34. Inoculum dosages used were 100 arthroconidia of C. posadasii strain 1038 and 100 PFU of WA-1 in 25 µL volume using a micropipette. To assess pathogenesis, three mice per treatment group were euthanized at prespecified time points, and no mice were euthanized early due to moribund condition. Lungs taken at the endpoint were split using half for fungal burden (all lobes of right lung) and half processed for RNA for viral burden (left lung). Fungal burden was quantified by calculating CFUs in lungs, brain, and spleen by serial dilution of homogenized tissues and plating on GYE agar supplemented with penicillin/streptomycin (1 mg/mL) antibiotics. Agar plates were placed in an incubator at 30 oC for up to 7 days at which time colonies were visually counted. Viral burden per gram of tissue was determined by quantifying viral RNA copy number using RT-PCR from homogenized left lung (weighed before processing)32,37. Viral RNA was isolated from homogenized lung tissue using the PureLink RNA Minikit (Invitrogen, Walthen, MA, USA). A one-step RT-PCR amplifying the Spike protein gene of SARS-CoV-2 with the following primer sets, S_Forward (5’-GCTGAACATGTCAACAACTC-3’) and S_Reverse (5’-GCAATGATGGATTGACTAGC-3’) was used to detect viral RNA. The assay utilizes Reliance One-Step Multiplex Supermix (Bio-Rad) run on the Applied Biosystems QuantStudio 7 Pro PCR system with the following conditions: reverse transcription 10 minutes at 50 oC, hot-start 10 minutes at 95 oC, 40 cycles of 10 seconds at 95 oC and annealing 30 seconds at 60 oC. The RT-qPCR results were normalized and expressed as viral copies per milligram of tissue.
Cytokine and chemokine analysis
Blood was collected from mice at days 1, 3, 5, and 6 post-infections in the pathogenesis study via a terminal cardiac puncture and serum was separated using centrifugation. Cytokines and chemokines in sera were assayed using the 26-plex Mouse Procarta Plex cytokine and chemokine assay (ThermoFisher Scientific) using the Magpix system from Luminex.
Tissue histopathology
Lungs were split as described above for histopathology. The left lobe of the lung was harvested and immediately submerged in 10% neutral buffered formalin for 24-48 hours and then moved and stored in 70% ethanol prior to tissue processing. Dehydration, clearing, and paraffinization were performed on a Tissue -Tek VIP Vacuum Infiltration Processor (SAKURA). The samples were embedded in paraffin using a Tissue-Tek TEC Tissue Embedding Station (SAKURA).
Immunofluorescence microscopy
Formalin-fixed paraffin-embedded (FFPE) mouse lung tissues were processed to 4μM thick sections on a Leica Rm2255 microtome by the histology core facility at Mayo Clinic-Scottsdale Arizona. Sections were warmed at 60 °C for 1 hour followed by deparaffinization with xylene and a graded series of ethanol washes. Sections were treated with 0.5% Sudan Black B (Thermo Fisher Scientific) for 25 minutes to reduce autofluorescence38. After rinsing in water, slides were subject to heat-induced epitope retrieval in 1X Citrate Buffer (Thermo Fisher Scientific) using a decloaking chamber (Biocare Medical). Sections were cooled, rinsed with 1X phosphate-buffered saline (PBS), then blocked for two hours with 1X carbo-free blocking solution (Vector Laboratories). Sections were then incubated with biotinylated goat polyclonal antibody against coccidioidin overnight at 4 °C using antibody gifted from Dr. D. Mitchell Magee, produced and characterized in previous reports39,40. After rinsing, sections were incubated with 4ug/ml streptavidin Alexa Fluor 555-conjugated antibody (Thermo Fisher Scientific) for two hours at room temperature. Coverslips were mounted using VECTASHIELD antifade mounting medium with DAPI (Vector Laboratories) and sealed with clear nail polish. Images were captured on a BZ-X810 fluorescence microscope (Keyence Corporation, Osaka, Japan). Slides were viewed and images were captured under a 40x objective (PlanApo, NA 0.95).
Images were selected at random from each treatment group to quantify both the number of spherules and the diameter of spherules utilizing BZ-X800 Analyzer software (Keyence Corporation, Osaka, Japan). Automated cell counts of intact spherules were performed in up to eight images, and any stained matter that measured under 5 µm was manually excluded from these counts. Spherule diameters were measured with the same software by manually tagging the edges of each spherule in three images for each group. Spherule diameters less than 5 µm were excluded, as these are likely endospores. Because the fungus first group had very few spherules to quantify, we preferentially chose slide sections containing spherules and thus may have overestimated counts.
Statistical analysis
For survival analysis, Kaplan-Meier survival curves were created and compared using a pairwise log-rank Mantel test. Viral and fungal burdens were log transformed and analyzed with two-way ANOVA followed by a post-hoc Tukey’s multiple comparison test. Cytokine concentrations were also analyzed with a two-way ANOVA followed by a post-hoc Tukey’s multiple comparison test. These statistical analyses were performed in GraphPad Prism version 9.0.
Principal component analysis for cytokine data was performed using the prcomp function in the nsprcomp R stats package version 0.5.1-2 with cytokine abundance data mean-centered and scaled to the unit variance41. The relatedness of treatment groups based on the mice immune profiles were assessed using a Z-score heat map using the pheatmap R stats package version 1.0.1242. For the heat map, a Z-score normalization was performed for the cytokine and chemokine counts across treatment groups for each immune marker. Z-scores are computed by subtracting the mean and then dividing by the standard deviation. The computed Z-score was used to create the heat map.
Reporting summary
Further information on research design is available in the Nature Portfolio Reporting Summary linked to this article.
Results
Survival and morbidity vary between treatment groups as well as viral variant
Here, we determined the susceptibility of mice coinfected with one of three different variants of SARS-CoV-2 (WA1, Omicron, and Delta) and C. posadasii. We examined whether SARS-CoV-2 first followed by C. posadasii challenge (virus first coinfection) or if C. posadasii first followed by SARS-CoV-2 challenge (fungus first coinfection) resulted in increased susceptibility for each SARS-CoV-2 variant as measured by survival. Importantly, we show that mice coinfected with virus first, regardless of the SARS-CoV-2 variant, had a decrease in survival (Fig. 1) compared to fungus-first, virus-only, and C. posadasii-only infected mice (Fig. 1), suggesting that the virus first coinfection model led to a worse outcome. Additionally, mice in the virus first group reveal differences among the viral variants, where the average mortality post infection with WA-1 is day 7 (Fig. 1A), Delta at day 9 (Fig. 1B), and Omicron at day 12 (Fig. 1C). We found that WA-1::C. posadasii showed significant decrease in survival compared to C. posadasii alone (Fig. 1Ap = 0.04). Delta::C. posadasii showed significant decrease in survival compared C. posadasii::Delta (Fig. 1Bp = 0.05) and C. posadasii only mice (Fig. 1Bp = 0.01). Mice that received an Omicron::C. posadasii infection showed significant decrease in survival compared to C. posadasii::Omicron infection (Fig. 1Cp = 0.006). No significant difference was seen among virus-alone and fungus-alone control groups (see Supplemental Table 1), and, as expected, most single-infection mice survived to the endpoint as the inoculum challenge was designed to be a sub-lethal dose. As the C. posadasii 1038 strain had not been previously tested in the K18-hACE2 mouse model, we completed both 1038::PBS and PBS::1038 (n = 6 per group) and observed no differences between these groups with 5 of 6 mice in either group surviving to day 21. This is similar to previous work in C57BL/6 J mice infected with 50 arthroconidia of strain 1038 where all mice survived to day 21 (mortality ensued at day 28 in their model)33.
Fig. 1. Viral variant and coinfection influence mortality.

There are significant differences in Kaplan-Meier survival curves between infection groups separated by viral variant. A WA-1 variant B Delta Variant and C) Omicron variant. All virus-C. posadasii groups, except for Omicron, had significant declining survival when compared to C. posadasii-only mice (WA-1 p = 0.04, Delta p = 0.01, Omicron p = 0.11). D Combining virus-C. posadasii and C. posadasii-virus mice, irrespective of viral strain for simplicity, Log-rank Mantel was used for pairwise comparison of each survival curve. The test shows a significant difference between the two treatment groups (p = 0.0008). The y-axis represents the probability of survival and the x-axis is days post infection. Criteria for euthanizing mice were based on weight loss (20% loss of starting body weight) or a poor condition score as described in methods.
To understand the overall probability of SARS-CoV-2 infection risk independent of viral variant, we repeated the statistical analysis with all the viral variants pooled together. When just considering order of infection, survival decreased in mice that were infected with the virus first when compared to the fungus first (Fig. 1Dp = 0.0008). Last, looking at virus-only infected mice, the WA−1 and Delta variants displayed earlier mortality (approximately day 7 for WA-1 and 9 for Delta; Figs. 1A and B) while the Omicron variant has a much later initial mortality (approximately day 12; Fig. 1C), although these results are not statistically significant as most mice survived to endpoint with this sublethal dose.
To determine whether coinfection resulted in changes in morbidity, we measured body weight loss. Similar to secondary infections post-influenza, both bacterial and fungal2, we found that in mice coinfected with WA-1 or Delta variant first resulted in a significant decrease in weight compared to fungus first coinfection (p < 0.0001) or C. posadasii only (p = 0.002) infected mice (Fig. 2A, B). Mice coinfected with Omicron variant first resulted in greater weight loss than mice coinfected with fungus first (p < 0.0001) and delayed weight loss compared to Omicron only infected mice (Fig. 2; p = 0.004). Also, when comparing variants of SARS-CoV-2, the Delta and WA-1 variants on average caused greater weight loss than the Omicron variant (Fig. 2; p = 0.04 and p = 0.008). All single infection mice on average gained weight over the course of infection (Fig. 2D).
Fig. 2. SARS-CoV2 followed by C. posadasii co-infected mice have increased morbidity.

Morbidity was quantified by weight loss during infection. Weight loss was more severe for SARS-CoV-2 regardless of variant followed by C. posadasii challenge. Weight loss progression differs by viral variant. Weights were monitored daily and are represented as percent of starting body weight depicted as average per group. A WA-1 variant co-infected group n = 12. B Delta Variant n = 24 and C) Omicron n = 24 variant. D Single pathogen controls averaged percent weight loss per group WA-1 only n = 6, Delta only n = 12, Omicron only n = 12, C. posadasii only n = 12.
Fungal burden is increased in the virus first group
Next, we sought to determine how coinfection affected the host’s ability to clear C. posadasii by measuring fungal burden. Fungal burden was measured by calculating colony-forming units (CFUs) from dilution series of homogenized tissues. We found that there were significant differences in CFUs between the infection groups (ANOVA; p < 0.0001), as well as a difference in CFUs in tissue type (ANOVA; p = 0.02). Figure 3 shows an overall higher fungal burden in the lungs compared to brain or spleen for all infections, which is expected for a respiratory pathogen at the early stages in disease progression. There were no statistical differences in fungal burden between the WA-1::C. posadasii group compared to C. posadasii only group (Fig. 3A). Interestingly, we were not able to grow C. posadasii out of any tissue from the C. posadasii::WA-1 coinfection at 21 days post infection, indicating that these mice may be clearing the fungus or that the fungal burden is too low to culture at this time point (Fig. 3A). For mice in the Delta variant infection group (Fig. 3B), we found that Delta::C. posadasii infected mice showed a significant increase in fungal burden compared to the C. posadasii::Delta coinfected mice (p = 0.006) and C. posadasii only group (p = 0.03) in lung tissue. For mice in the Omicron variant infection group (Fig. 3C), we found that only Omicron::C. posadasii co-infected mice showed a significant increase in fungal burden when compared to the C. posadasii::Omicron coinfected mice (p = 0.008) in lung tissue. Interestingly, we found no statistical differences in brain or spleen tissue for any of the variants, suggesting that dissemination was not altered by viral infection in the timeframe of the experiment (Supplemental Table 1).
Fig. 3. Fungal burden is increased in SARS-CoV-2 followed by C. posadasii coinfected mice.

Fungal burden is represented in log colony forming units (CFUs) per milliliter of tissue homogenate. Fungal burden was assessed in surviving mice at experimental end point (day 21). A WA-1 viral variant B Delta viral variant C Omicron viral variant. D WA-1 viral variant infected mice were used in a pathogenesis study, three male mice were euthanized at days 1, 3, 5, and 6 postinfection and lung tissues were harvested and cultured. Analysis of variance (ANOVA) followed by Tukey’s Multiple comparison test were used to assess differences between treatment groups in both experiments. Asterisks indicate significant relationships (N = 3 mice per day per group).
To assess changes in fungal burden through time we repeated the experiment using only SARS-CoV-2 variant WA-1. We chose to use the WA-1 variant because it produces a high virulence phenotype compared to the Delta variant (medium virulence) and the Omicron variant (low virulence) in this coinfection model. We found that there was an overall difference in CFUs by treatment group (ANOVA; p = 0.03) as well as CFU by day (ANOVA; p = 0.05; Fig. 3D). Compared to mice in the C. posadasii only group, we found a significant increase at day 6 only (p = 0.01; Fig. 3D) with all other timepoints and treatments not significant (Supplemental Table 1).
Viral burden is increased in the virus first group
We next determined how coinfection affected the host’s ability to clear WA-1 by measuring viral burden over time (Fig. 4). We found that there are differences in viral burden by treatment group (ANOVA; p = 0.008) and by day (ANOVA; p = 0.05). Supporting this, we found that lungs from mice coinfected with the virus first show significantly greater viral burden at day 1 post infection (p = 0.0004) when compared to mice coinfected with the fungus first (Fig. 4). The virus first mice also exhibited significantly more viral burden in lung tissue at day 1 (p = 0.03) and day 6 (p = 0.001) when compared to the virus only mice (Fig. 4). The remaining comparisons were not significant (Supplemental Table 1).
Fig. 4. Viral burden is increased in SARS-CoV2-C. posadasii mice at early time points.
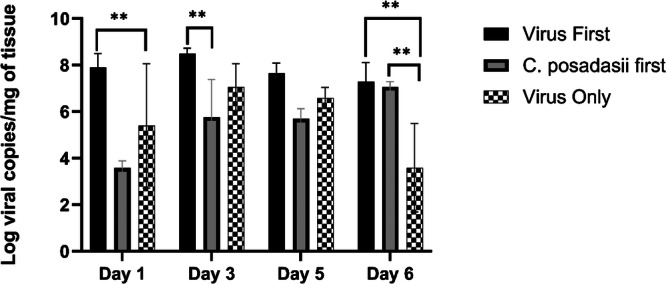
Viral burden was assessed in the lungs at days 1, 3, 5, and 6 post infection of the secondary pathogen. Viral variant WA-1 was used for this pathogenesis study. Viral burden is represented in log viral RNA copies per milligram of lung tissue of the different treatment groups. Mice that received a SARS-CoV-2 first followed by a C. posadasii challenge had a higher viral burden in early infection. However, C. posadasii first followed by SARS-CoV-2 challenge mice have a delayed increase in viral burden at day 6. Analysis of variance (ANOVA) followed by Tukey’s Multiple comparison test were used to assess differences between treatment groups. Asterisks indicate significant relationships (N = 3 mice per day per group).
Immunofluorescence shows virus first group has more abundant and larger spherules in lung
Spherules in lungs of mice that were infected with C. posadasii only and in mice coinfected with virus first are substantially larger and more abundant when compared to spherules in lungs of mice coinfected with fungus first (Fig. 5A). The virus first group had an average of approximately 118 spherules per image compared to just 2 spherules in the fungus first group and 92 in the C. posadasii only group (Fig. 5B). Although the diameter of spherules is dependent on the plane in which it is cut, the virus first group had significantly larger spherules (average diameter of 26.75 microns) when compared to the fungus first group (p = 0.014; average diameter of 8.5 microns), but virus first spherules were not significantly larger than the C. posadasii only group (average of 23.93 microns; Fig. 5C). The trend for increased number and size of spherules in the virus first coinfection suggests a favorable lung environment for spherule proliferation, and a viral secondary infection could create an inhospitable environment for the proliferation of C. posadasii as we see very few spherules in the lungs of mice in the fungus first coinfection group (Fig. 5). More representative images can be found in supplemental Figs. 2–6.
Fig. 5. Detection of Coccidioides spherules by immunofluorescence in FFPE lung tissues.

Representative images from all viral variants from day 10 post infection were used for detection by immunofluorescence A Immunofluorescence staining to detect Coccidioides spherules/ endospores (red) in FFPE lung tissue from mice infected with one or both pathogens. Nuclei are stained blue (DAPI). Images are captured under a 40x objective and scale bars are 50 µm in all images. B Average numbers of intact spherules per randomized slide images. C We used a two-way ANOVA to determine if there are differences in spherule diameter between the groups (p = 0.02). Diameters of intact spherules in the randomized slide section images, compared with an unpaired t-test the virus first group has significantly larger spherules then the fungus first group (p = 0.014). Asterisks indicate significant relationships. Scale bars are 50 microns.
Systemic cytokine/chemokine abundance
To begin to understand potential mechanisms driving differential outcome of infection, systemic immune responses in the serum of mice on days 1, 3, 5, and 6 post-infection were assessed (Fig. 6). We specifically focused on differences in proinflammatory cytokines. We found significantly increased levels of the anti-viral cytokine IFN-γ43 in mice coinfected with virus first compared to mice coinfected with fungus first (p < 0.001) or C. posadasii alone (p < 0.0001). Additionally, mice infected with WA-1 only had increased levels of IFN-γ compared to mice infected with C. posadasii (p = 0.002) at day 6 post infection. Furthermore, we found that any virus infected mouse had higher levels of proinflammatory cytokines IL-6, IL-12, and TNFα compared to mice infected with C. posadasii only.
Fig. 6. A Coccidioides infection prior to a SARS-CoV-2 infection reduces the inflammatory environment.
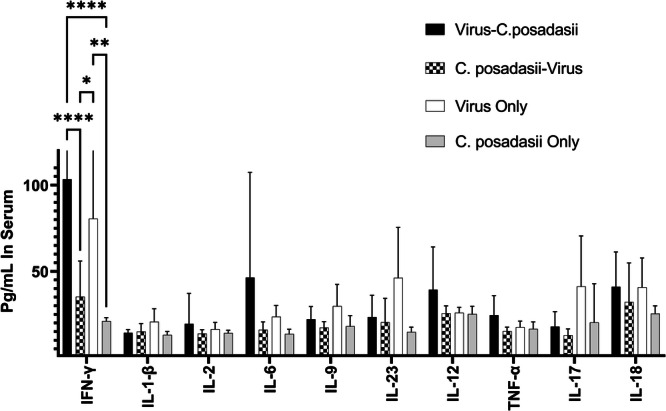
Day 5 and 6 sera were subjected to analysis using a commercial cytokine and chemokine panel to examine circulating immune markers between the different treatment groups. There was a more robust immune response in the virus first infected groups dominated by IFN-γ and other pro-inflammatory cytokines. (A two-way ANOVA revealed differences in cytokine concentrations between the infection groups; p < 0.0001, N = 3 mice per day per group).
To visualize differences in immune response between groups over the course of early infection, a heat map was created using Z-score normalization. We did not find significant changes in immune responses until days 5 and 6 postinfection. At days 5 and 6 post-infection, mice coinfected with the virus first showed an upregulation of IL-10, TNFα, MCP-1, MCP-3, IL-6, IFN-γ, IL-18, RANTES, MIP-1α and IL-12 compared to the other groups at that time point (Fig. 7). Mice infected with WA-1 virus only showed an upregulation of IL-10, RANTES, MIP-1α, IL-4, MIP-2α, MIP-1β, IL-5, Eotaxin, IL-22, IL-27, IL-1β, IL-23, IL-13, and IL-17 at days 5 and 6 post-infection compared to the other groups at that time point. The fungus first coinfected mice and the C. posadasii only mice did not demonstrate strong cytokine responses compared to the other groups, with slight up-regulation in CXCL1 (fungus first coinfection) and immunosuppressive IL-10 (C. posadasii only).
Fig. 7. Heat map of differential cytokine/chemokine expression.

Z-scores were computed by subtracting the mean and then dividing by the standard deviation. The computed Z-score was then used to create the heat map. The brighter the green the more upregulated the immune marker and the brighter the blue the more down regulated the immune marker compared to the other treatment groups (N = 3 mice per day per group).
Overall, cytokines and chemokines that are involved in acute pro-inflammatory processes were detected when mice were infected with virus only or virus first. Interestingly, when mice were coinfected with virus first, IL-1β, IL-4, IL-5, IL-9, IL-13, IL-17 IL-22, IL23, IL-27 as well as CCL4, CXCL2 and CCL11 were expressed only in mice infected with WA-1 (virus only group), not in the mice that received the virus first followed by fungus.
Discussion
In this study, we sought to understand outcomes of SARS-CoV-2 and C. posadasii coinfections in a murine model and develop methods to assess these coinfections. We observed increased mortality and morbidity in mice that received virus first coinfection compared to both mice that received fungus first coinfection and mice that were only infected with one pathogen (C. posadasii only or SARS-CoV-2 only). Initially, we anticipated that mice that had a coinfection, irrespective of the order of delivery, would have lower survival than mice with a single infection. However, there are distinct survival differences between mice that received SARS-CoV-2 as a primary infection and mice that received C. posadasii either as a fungus first coinfection or a single infection with the fungus alone (Fig. 1). Mice that received a virus first coinfection not only had greater viral burden, but also had a greater fungal burden in the lungs when compared to other treatment groups (Figs. 3–4).
It has been suggested in the literature that a primary infection with a bacteria or fungus can be protective against a secondary viral infection, where the induced antibacterial/antifungal infection immune response prevents the virus from replicating in the host44,45. On the other hand, a viral primary infection has been shown to alter the expression of attachment proteins on host cells enabling a secondary pathogen invasion as well as stimulating apoptosis and exposing cells to direct invasion from other microbes45–47. A recent phenomenon has been described known as viral “aftershock” where, following a viral infection, substantial damage to the epithelium, loss of cilia, increased mucus production, and decreased pattern recognition receptors for immune pathways allow for the establishment of secondary fungal infections48,49. These processes could be contributing to the patterns that we observed in this study. The initial infection of SARS-CoV-2 appeared to predispose the mice to proliferation of the fungus in the lungs (Fig. 3). Conversely, mice infected with the fungus first had significantly less tissue fungal burden and in some cases the fungus was cleared (Fig. 3).
Differences in virulence among variants of SARS-CoV-2 have been detected in the human population, quantified by hospitalizations and mortality, as well as in pathogenesis studies in mice50,51. Here, we observe similar trends to published observations49,52–54 with WA-1 being the most virulent strain tested, followed by Delta and the least virulent being Omicron in the virus first coinfection (Fig. 1). Mice that received the WA-1 variant before C. posadasii had earlier mortality compared to Delta or Omicron first, but these differences were not significant (Fig. 1). Interestingly, we observed a trend for an increase in survival among mice that received a C. posadasii-Omicron coinfection compared to mice that only receive an Omicron infection (Fig. 1C). Nateker et al. showed differences in virulence and pathogenesis between viral variants in K18-hACE2 mice infected with the Omicron variant compared to those infected with WA-1 or Delta35. As the virus continues to evolve, we hypothesize that each variant might interact differently in hosts with a Coccidioides coinfection leading to variable pathogenesis.
In other coinfection models (e.g., influenza/bacteria, influenza/fungi), differences in immune response and physiological lung damage accounted for differences in pathogen virulence and burden among coinfected groups and single infected groups of mice48,55,56. Interestingly, there are no noticeable differences in immune responses before days 5 and 6 post infection when the most significant pattern was an increase of circulating IFN-γ in the blood of mice that received the virus first and a secondary C. posadasii challenge (Figs. 6 and 7). The timing of the influx of cytokines is consistent with the observations in human patients hospitalized with COVID-19 where the cytokine storm happens on average 5-7 days post infection57. There is evidence showing that during infection with SARS-CoV-2 excessive production of TNFα and IFN-γ induced inflammatory cell death (PANoptosis) and that mice treated with neutralizing antibodies against TNFα and IFN-γ were protected from mortality and cytokine shock during SARS-CoV-2 infection58. In this study, we show concurrent elevated TNFα and IFN-γ levels in mice in the virus first coinfection group compared to all other groups (Figs. 1, 6, 7). Elevated levels of IFN-γ and TNFα in virus first coinfection could lead to a combination of inflammatory cell death and increased susceptibility for C. posadasii to proliferate and lead to increased mortality. However, follow up mechanistic studies are needed to confirm the involvement of both immune responses and cell damage.
Other studies have shown that interferons are important antiviral cytokines in viral coinfections59 and type I and III interferons (IFN) appear to impede viral replication during infection but are also crucial for antifungal responses in the lungs during fungal infections60,61. We did not directly measure type I or III IFN in the current study; however, it would be beneficial to measure these interferons, as well as tissue damage in follow up studies to mechanistically understand the immune response differences. During invasive pulmonary aspergillosis (IPA), monocytes are an important source of the type I IFN response, and type III IFN mucosal production acts on neutrophils to activate the antifungal response60–62. Proper IFN responses and signaling are therefore likely to be important in determining whether or not a secondary fungal infection establishes after a primary viral infection63,64. Consequently, this pathway may be a crucial determinant of fungal coinfection (such as coccidioidomycosis) during or after an initial SARS-CoV-2 infection.
Concurrent infection studies with Influenza A virus and the pathogenic yeast Cryptococcus gattii show that early in the viral infection there is an increase in type I IFN. This increase supports establishment and potentially more severe disease after coinfection by C. gattii due to reduced fungicidal macrophage activity and no increase in fungal engulfment by macrophages exposed to high levels of IFN-γ59. We observed that mice exposed to the virus first have higher IFN-γ levels than mice in all other groups, with the caveat that only IFN-γ was measured, not type I interferons (alpha/beta) specifically. In parasite/viral coinfections, IFN-alpha/beta can modulate IFN-γ, which is required for the clearance of the parasite. A reduction in IFN-γ after an initial viral infection is associated with increased parasite pathology65. We observed an increase in systemic IFN-γ, but the effect that IFN-alpha/beta may have on this response is unknown. Another limitation to the study is that we did not measure the cytokine response directly in the lungs. The cytokine and chemokine patterns could be different in the lungs and calls for further investigation. Other viruses such as Influenza and Human Respiratory Syncytial Virus are also worth exploring in the context of a concurrent infection with Coccidioides, as these are seasonal viruses that infect a substantial proportion of the population every year66,67. To date, no investigations have been undertaken to understand the impact of viral infections in the context of Valley fever. Investigating the immune response locally in the lungs as well as the role of tissue damage can also provide useful information to better elucidate the pathology of coinfection, as this can differ from the systemic response found in serum68.
Interestingly, we obverse a protective response in mice that are in the fungus first group, with decreased mortality and lower fungal proliferation in the lungs (Figs. 1 and 3). Interferons are critical for controlling viral replication and establishing viral immunity10,62. Our data show that mice infected with the fungus first have decreased levels of circulating IFN-γ (Figs. 6 and 7). These decreased levels could be preventing the virus from being cleared. Our data show that the viral burden in these mice is increasing at day 6 compared to the virus-only control mice which are clearing the virus at this time point (Fig. 4). In other fungal pathogen systems, such as Cryptococcus neoformans and Candida albicans, there is pathogen-induced modulation of inflammatory signals, such as TNFα and IFN-γ69,70. It has been hypothesized that Coccidioides could be modulating the host immune response upon establishing infection71. This could contribute to a reduced inflammatory response in the fungus first coinfected mice and affecting how the virus proliferates. The virus seems to be replicating at a slower rate in mice coinfected with fungus first followed by the virus which reduces mortality (Fig. 1). Interestingly, at 24 hours Coccidioides arthroconidia begin to swell into spherules and dampen some inflammatory cytokines that could reduce the cytokine storm against SARS-CoV-2 infection72. However, studies in IFN-γ knock out mice are needed to confirm these mechanisms. Here, we show that IFN-γ is elevated in the blood of mice coinfected with virus first, although more mechanistic studies that block the production of IFN-γ are needed to confirm our observations. We also see increases in CXCL10 and IL-18 that could be important in this superinfection dynamic. Because we only measured the responses to coinfection 24 hours apart, future investigations into the kinetics of susceptibility/protection at different coinfection timepoints is warranted.
This observational study reveals differences in mortality, morbidity, fungal/viral proliferation, and immune response in mice that were sequentially infected with SARS-CoV-2 and C. posadasii. The differences in pathology when mice were infected with SARS-CoV-2 first vs. Coccidioides first were striking14. This is the first study to examine this relationship in a murine model and the model we detail here will support future work. We realize that there are limitations to this study. Follow-up studies are needed to further examine immune mechanisms as we measured fluctuations in cytokines/chemokines that are influenced by a number of variables, including less virulent viral variants. We did not directly compare the susceptibility of K18-hACE2 mice to Coccidioides spp. with wildtype C57BL/6 J mice, relying on comparisons to the literature on the strain we chose (C. posadasii 1038). As SARS-CoV-2 becomes endemic in the human population, seasonal outbreaks in the endemic regions can expose hosts to new variants with variable disease severity73–75. Hosts living in areas of endemicity for Valley fever could develop exacerbated disease when exposed to both pathogens. SARS-CoV-2 and fungal coinfections from other studies with Aspergillus and Candida have been investigated, but Coccidioides has a very different infection dynamic with a specific pathogenic morphology (spherule) that is unique in the fungal kingdom, and much remains to be explored with regard to viral coinfections with this fungus.
Supplementary information
Description of Additional Supplementary Files
Acknowledgements
This work was funded by the Arizona Board of Regents Translational Research Initiative Fund Regent’s award to PK, BMB, ES and NIH/NIAID 5U19AI166058 to PK, BMB, ES.
Author Contributions
D.R.K. performed mouse experiments, analyzed data, and wrote the manuscript. F.J.G. performed microscopy and immunofluorescence. A.N.I, E.T.L., and J.Y. performed the cytokine/chemokine experiment. M.M.M., A.F.B., M.L.B., and M.L.R. assisted in all of the mouse experiments. K.R.C. cultured and maintained virus used in the mouse experiments. P.S.K., E.W.S., and D.L. supervised work. K.M.S. consulted on the writing of the manuscript and interpretation of data. B.M.B conceptualized and designed experiments, supervised work, and assisted with manuscript. All authors read and revised the manuscript.
Peer review
Peer review information
Communications Medicine thanks Fabián Salazar and the other, anonymous, reviewer(s) for their contribution to the peer review of this work. A peer review file is available.
Data availability
The raw data that support the findings of this study are available from the corresponding author upon request. Source data underlying the figures are available as Supplementary Data 1-8.
Competing interests
The authors declare no competing interests
Footnotes
Publisher’s note Springer Nature remains neutral with regard to jurisdictional claims in published maps and institutional affiliations.
Supplementary information
The online version contains supplementary material available at 10.1038/s43856-024-00610-y.
References
- 1.Brown, G. D. et al. Hidden killers: human fungal infections. Sci. Transl. Med.4, 165rv13 (2012). [DOI] [PubMed] [Google Scholar]
- 2.Salazar, F. et al. Pathogenesis of respiratory viral and fungal coinfections. Clin. Microbiol. Rev.35, e00094-21 (2022). [DOI] [PMC free article] [PubMed] [Google Scholar]
- 3.Kirkland, T. N. & Fierer, J. Coccidioides immitis and posadasii; A review of their biology, genomics, pathogenesis, and host immunity. Virulence9, 1426–1435 (2018). [DOI] [PMC free article] [PubMed] [Google Scholar]
- 4.Blair, J. E., Ampel, N. M. & Hoover, S. E. Coccidioidomycosis in selected immunosuppressed hosts. Med. Mycol.57, S56–S63 (2019). [DOI] [PubMed] [Google Scholar]
- 5.Rosenstein, N. E. et al. Risk factors for severe pulmonary and disseminated coccidioidomycosis: Kern County, California, 1995–1996. Clin. Infect. Dis.32, 708–714 (2001). [DOI] [PubMed] [Google Scholar]
- 6.Agarwal, M., B. Nokes, and J. E. Blair, Coccidioidomycosis and Solid Organ Transplantation. Current Fungal Infection Reports, 2021: p. 1-8.
- 7.Ampel, N. M. & Hoover, S. E. Pathogenesis of coccidioidomycosis. Curr. Fungal Infect. Rep.9, 253–258 (2015). [Google Scholar]
- 8.Hernandez, H., Erives, V. H. & Martinez, L. R. Coccidioidomycosis: epidemiology, fungal pathogenesis, and therapeutic development. Curr. Tropical Med. Rep.6, 132–144 (2019). [DOI] [PMC free article] [PubMed] [Google Scholar]
- 9.Chen, Y.-Q. et al. Influenza infection in humans induces broadly cross-reactive and protective neuraminidase-reactive antibodies. Cell173, 417–429. e10 (2018). [DOI] [PMC free article] [PubMed] [Google Scholar]
- 10.Krammer, F. & Palese, P. Influenza virus hemagglutinin stalk-based antibodies and vaccines. Curr. Opin. Virol.3, 521–530 (2013). [DOI] [PMC free article] [PubMed] [Google Scholar]
- 11.Zhou, F. et al. Clinical course and risk factors for mortality of adult inpatients with COVID-19 in Wuhan, China: a retrospective cohort study. lancet395, 1054–1062 (2020). [DOI] [PMC free article] [PubMed] [Google Scholar]
- 12.Heaney, A. K. et al. Coccidioidomycosis and COVID-19 co-infection, United States, 2020. Emerg. Infect. Dis.27, 1266 (2021). [DOI] [PMC free article] [PubMed] [Google Scholar]
- 13.Chang, C. C. et al. An acute pulmonary coccidioidomycosis coinfection in a patient presenting with multifocal pneumonia with COVID-19. J. Invest. Med. High Impact Case Reports 2020. p. 2324709620972244. [DOI] [PMC free article] [PubMed]
- 14.Huff, D., Ampel, N. M. & BlairJ. E. Coccidioidomycosis and COVID-19 Infection. An Analysis from a Single Medical Center Within the Coccidioidal Endemic Area. Mycopathologia, 1–6 (2022). [DOI] [PMC free article] [PubMed]
- 15.Krauth, D. S. et al. Accelerated progression of disseminated coccidioidomycosis following SARS-CoV-2 infection: a case report. Mil. Med.186, 1254–1256 (2021). [DOI] [PMC free article] [PubMed] [Google Scholar]
- 16.Paget, C. & Trottein, F. Mechanisms of bacterial superinfection post-influenza: a role for unconventional T cells. Front. Immunol.10, 336 (2019). [DOI] [PMC free article] [PubMed] [Google Scholar]
- 17.Touny, A. et al. Incidence of Co-infection and its Impact on COVID-19 Patients admitted in the Intensive Care Unit. Egypt. J. Anaesth.39, 141–148 (2023). [Google Scholar]
- 18.Balz, K. et al. Virus-induced T cell-mediated heterologous immunity and vaccine development. Front. Immunol.11, 513 (2020). [DOI] [PMC free article] [PubMed] [Google Scholar]
- 19.Messina, N., Zimmermann, P. & Curtis, N. The impact of vaccines on heterologous adaptive immunity. Clin. Microbiol. Infect.25, 1484–1493 (2019). [DOI] [PubMed] [Google Scholar]
- 20.Arastehfar, A. et al. COVID-19 associated pulmonary aspergillosis (CAPA)—from immunology to treatment. J. Fungi6, 91 (2020). [DOI] [PMC free article] [PubMed] [Google Scholar]
- 21.Feldman, C. & Anderson, R. The role of co-infections and secondary infections in patients with COVID-19. Pneumonia13, 1–15 (2021). [DOI] [PMC free article] [PubMed] [Google Scholar]
- 22.Tavakoli, M. et al. Immunological response to COVID-19 and its role as a predisposing factor in invasive aspergillosis. Curr. Med. Mycol.6, 75 (2020). [DOI] [PMC free article] [PubMed] [Google Scholar]
- 23.Astry, C. L. & Jakab, G. J. Influenza virus-induced immune complexes suppress alveolar macrophage phagocytosis. J. Virol.50, 287–292 (1984). [DOI] [PMC free article] [PubMed] [Google Scholar]
- 24.Barthelemy, A. et al. Influenza A virus-induced release of interleukin-10 inhibits the anti-microbial activities of invariant natural killer T cells during invasive pneumococcal superinfection. Mucosal Immunol.10, 460–469 (2017). [DOI] [PubMed] [Google Scholar]
- 25.Crum-Cianflone, N. F. Invasive aspergillosis associated with severe influenza infections. in Open Forum Infectious Diseases. 2016. Oxford University Press. [DOI] [PMC free article] [PubMed]
- 26.Small, C.-L. et al. Influenza infection leads to increased susceptibility to subsequent bacterial superinfection by impairing NK cell responses in the lung. J. Immunol.184, 2048–2056 (2010). [DOI] [PubMed] [Google Scholar]
- 27.Flerlage, T. et al. Influenza virus and SARS-CoV-2: pathogenesis and host responses in the respiratory tract. Nat. Rev. Microbiol.19, 425–441 (2021). [DOI] [PMC free article] [PubMed] [Google Scholar]
- 28.Lauer, S. A. et al. The incubation period of coronavirus disease 2019 (COVID-19) from publicly reported confirmed cases: estimation and application. Ann. Intern. Med.172, 577–582 (2020). [DOI] [PMC free article] [PubMed] [Google Scholar]
- 29.Reizine, F. et al. Influenza-and COVID-19-associated pulmonary aspergillosis: are the pictures different? J. Fungi7, 388 (2021). [DOI] [PMC free article] [PubMed] [Google Scholar]
- 30.Vardhana, S. A. and J. D. Wolchok, The many faces of the anti-COVID immune response. Journal of Experimental Medicine, 2020. 217. [DOI] [PMC free article] [PubMed]
- 31.Ziegler, C. G. et al. SARS-CoV-2 receptor ACE2 is an interferon-stimulated gene in human airway epithelial cells and is detected in specific cell subsets across tissues. Cell181, 1016–1035. e19 (2020). [DOI] [PMC free article] [PubMed] [Google Scholar]
- 32.Dong, W. et al. The K18-human ACE2 transgenic mouse model recapitulates non-severe and severe COVID-19 in response to an infectious dose of the SARS-CoV-2 virus. J. Virol.96, e00964-21 (2022). [DOI] [PMC free article] [PubMed] [Google Scholar]
- 33.Shubitz, L. F. et al. A chronic murine disease model of coccidioidomycosis using Coccidioides posadasii, strain 1038. J. Infect. Dis.223, 166–173 (2021). [DOI] [PMC free article] [PubMed] [Google Scholar]
- 34.Mead, H. L., Van Dyke, M. C. C. & Barker, B. M. Proper Care and Feeding of Coccidioides: A Laboratorian’s Guide to Cultivating the Dimorphic Stages of C. immitis and C. posadasii. Curr. Protoc. Microbiol.58, e113 (2020). [DOI] [PMC free article] [PubMed] [Google Scholar]
- 35.Natekar, J. P. et al. Differential pathogenesis of SARS-CoV-2 variants of concern in human ACE2-expressing mice. Viruses14, 1139 (2022). [DOI] [PMC free article] [PubMed] [Google Scholar]
- 36.Yinda, C. K. et al. K18-hACE2 mice develop respiratory disease resembling severe COVID-19. PLoS Pathog.17, e1009195 (2021). [DOI] [PMC free article] [PubMed] [Google Scholar]
- 37.Zarn, K. E. et al. Stenoparib, an inhibitor of cellular poly (ADP-ribose) polymerases (PARPs), blocks in vitro replication of SARS-CoV-2 variants. Plos one17, e0272916 (2022). [DOI] [PMC free article] [PubMed] [Google Scholar]
- 38.Sun, Y. et al. Sudan black B reduces autofluorescence in murine renal tissue. Arch. Pathol. Lab. Med.135, 1335–1342 (2011). [DOI] [PubMed] [Google Scholar]
- 39.Cox, R. A. & Britt, L. A. Antigenic identity of biologically active antigens in coccidioidin and spherulin. Infect. Immun.55, 2590–2596 (1987). [DOI] [PMC free article] [PubMed] [Google Scholar]
- 40.Yang, C. et al. Molecular cloning and characterization of the Coccidioides immitis complement fixation/chitinase antigen. Infect. Immun.64, 1992–1997 (1996). [DOI] [PMC free article] [PubMed] [Google Scholar]
- 41.Sigg, C. and M. C. Sigg, Package ‘nsprcomp’. 2018.
- 42.Kolde, R. & Kolde, M. R. Package ‘pheatmap’. R. package1, 790 (2015). [Google Scholar]
- 43.Galani, I.-E. et al. Untuned antiviral immunity in COVID-19 revealed by temporal type I/III interferon patterns and flu comparison. Nat. Immunol.22, 32–40 (2021). [DOI] [PubMed] [Google Scholar]
- 44.McCullers, J. A. & Rehg, J. E. Lethal synergism between influenza virus and Streptococcus pneumoniae: characterization of a mouse model and the role of platelet-activating factor receptor. J. Infect. Dis.186, 341–350 (2002). [DOI] [PubMed] [Google Scholar]
- 45.Rippee‐Brooks, M. D., Marcinczyk, R. N. & Lupfer, C. R. What came first, the virus or the egg: Innate immunity during viral coinfections. Immunological Rev.297, 194–206 (2020). [DOI] [PubMed] [Google Scholar]
- 46.McCullers, J. A. & Bartmess, K. C. Role of neuraminidase in lethal synergism between influenza virus and Streptococcus pneumoniae. J. Infect. Dis.187, 1000–1009 (2003). [DOI] [PubMed] [Google Scholar]
- 47.Plotkowski, M.-C. et al. Adherence of type I Streptococcus pneumoniae to tracheal epithelium of mice infected with influenza A/PR8 virus. Am. Rev. Respiratory Dis.134, 1040–1044 (1986). [DOI] [PubMed] [Google Scholar]
- 48.Obar, J. J. & Shepardson, K. M. Coinfections in the lung: How viral infection creates a favorable environment for bacterial and fungal infections. Plos Pathog.19, e1011334 (2023). [DOI] [PMC free article] [PubMed] [Google Scholar]
- 49.Oliva, J. & Terrier, O. Viral and bacterial co-infections in the lungs: dangerous liaisons. Viruses13, 1725 (2021). [DOI] [PMC free article] [PubMed] [Google Scholar]
- 50.Fisman, D. N. & Tuite, A. R. Evaluation of the relative virulence of novel SARS-CoV-2 variants: a retrospective cohort study in Ontario, Canada. Cmaj193, E1619–E1625 (2021). [DOI] [PMC free article] [PubMed] [Google Scholar]
- 51.Shuai, H. et al. Attenuated replication and pathogenicity of SARS-CoV-2 B. 1.1. 529 Omicron. Nature603, 693–699 (2022). [DOI] [PubMed] [Google Scholar]
- 52.Kannan, S., Ali, P. S. S. & Sheeza, A. Evolving biothreat of variant SARS-CoV-2-molecular properties, virulence and epidemiology. Eur. Rev. Med Pharm. Sci.25, 4405–4412 (2021). [DOI] [PubMed] [Google Scholar]
- 53.Saito, A. et al. Enhanced fusogenicity and pathogenicity of SARS-CoV-2 Delta P681R mutation. Nature602, 300–306 (2022). [DOI] [PMC free article] [PubMed] [Google Scholar]
- 54.Suzuki, R. et al. Attenuated fusogenicity and pathogenicity of SARS-CoV-2 Omicron variant. Nature603, 700–705 (2022). [DOI] [PMC free article] [PubMed] [Google Scholar]
- 55.Feys, S. et al. Lung epithelial and myeloid innate immunity in influenza-associated or COVID-19-associated pulmonary aspergillosis: an observational study. Lancet Respiratory Med.10, 1147–1159 (2022). [DOI] [PMC free article] [PubMed] [Google Scholar]
- 56.Hohl, T. M. et al. Aspergillus fumigatus triggers inflammatory responses by stage-specific β-glucan display. PLoS Pathog.1, e30 (2005). [DOI] [PMC free article] [PubMed] [Google Scholar]
- 57.Sun, X. et al. Cytokine storm intervention in the early stages of COVID-19 pneumonia. Cytokine growth factor Rev.53, 38–42 (2020). [DOI] [PMC free article] [PubMed] [Google Scholar]
- 58.Karki, R. et al. Synergism of TNF-α and IFN-γ triggers inflammatory cell death, tissue damage, and mortality in SARS-CoV-2 infection and cytokine shock syndromes. Cell184, 149–168. e17 (2021). [DOI] [PMC free article] [PubMed] [Google Scholar]
- 59.Yan, F. et al. Characterization of two heterogeneous lethal mouse-adapted SARS-CoV-2 variants recapitulating representative aspects of human COVID-19. Front. Immunol.13, 821664 (2022). [DOI] [PMC free article] [PubMed] [Google Scholar]
- 60.Dutta, O., et al., Dectin-1 promotes type I and III interferon expression to support optimal antifungal immunity in the lung. Frontiers in Cellular and Infection Microbiology, 2020: p. 321. [DOI] [PMC free article] [PubMed]
- 61.Espinosa, V. et al. Type III interferon is a critical regulator of innate antifungal immunity. Sci. Immunol.2, eaan5357 (2017). [DOI] [PMC free article] [PubMed] [Google Scholar]
- 62.Iwasaki, A. A virological view of innate immune recognition. Annu. Rev. Microbiol.66, 177–196 (2012). [DOI] [PMC free article] [PubMed] [Google Scholar]
- 63.Parker, D. Impact of type I and III interferons on respiratory superinfections due to multidrug-resistant pathogens. J. Infect. Dis.215, S58–S63 (2017). [DOI] [PMC free article] [PubMed] [Google Scholar]
- 64.Shahangian, A. et al. Type I IFNs mediate development of postinfluenza bacterial pneumonia in mice. J. Clin. Investig.119, 1910–1920 (2009). [DOI] [PMC free article] [PubMed] [Google Scholar]
- 65.Yadav, P. et al. Isolation of SARS-CoV-2 B. 1.1. 28.2 (P2) variant and pathogenicity comparison with D614G variant in hamster model. J. Infect. public health15, 164–171 (2022). [DOI] [PMC free article] [PubMed] [Google Scholar]
- 66.Rossi, M. et al. Type I interferons induced by endogenous or exogenous viral infections promote metastasis and relapse of leishmaniasis. Proc. Natl Acad. Sci.114, 4987–4992 (2017). [DOI] [PMC free article] [PubMed] [Google Scholar]
- 67.Santiago-Tirado, F. H. et al. Trojan horse transit contributes to blood-brain barrier crossing of a eukaryotic pathogen. MBio8, e02183-16 (2017). [DOI] [PMC free article] [PubMed] [Google Scholar]
- 68.Chung, J. R. et al. Interim estimates of 2021–22 seasonal influenza vaccine effectiveness—United States, February 2022. Morbidity Mortal. Wkly. Rep.71, 365 (2022). [DOI] [PMC free article] [PubMed] [Google Scholar]
- 69.Re, F. & Strominger, J. L. Toll-like receptor 2 (TLR2) and TLR4 differentially activate human dendritic cells. J. Biol. Chem.276, 37692–37699 (2001). [DOI] [PubMed] [Google Scholar]
- 70.Vecchiarelli, A. et al. Purified capsular polysaccharide of Cryptococcus neoformans induces interleukin-10 secretion by human monocytes. Infect. Immun.64, 2846–2849 (1996). [DOI] [PMC free article] [PubMed] [Google Scholar]
- 71.Ward, R. A. et al. The known unknowns of the immune response to Coccidioides. J. Fungi7, 377 (2021). [DOI] [PMC free article] [PubMed] [Google Scholar]
- 72.Beaman, L., Pappagianis, D. & Benjamini, E. Mechanisms of resistance to infection with Coccidioides immitis in mice. Infect. Immun.23, 681–685 (1979). [DOI] [PMC free article] [PubMed] [Google Scholar]
- 73.Cohen, C. & Pulliam, J. COVID-19 infection, reinfection, and the transition to endemicity. Lancet401, 798–800 (2023). [DOI] [PMC free article] [PubMed] [Google Scholar]
- 74.Gómez-Carballa, A. et al. A multi-tissue study of immune gene expression profiling highlights the key role of the nasal epithelium in COVID-19 severity. Environ. Res.210, 112890 (2022). [DOI] [PMC free article] [PubMed] [Google Scholar]
- 75.Wambua, J., et al., Drivers of respiratory syncytial virus seasonal epidemics in children under 5 years in Kilifi, coastal Kenya. Plos one, 2022. 17: p. e0278066. [DOI] [PMC free article] [PubMed]
Associated Data
This section collects any data citations, data availability statements, or supplementary materials included in this article.
Supplementary Materials
Description of Additional Supplementary Files
Data Availability Statement
The raw data that support the findings of this study are available from the corresponding author upon request. Source data underlying the figures are available as Supplementary Data 1-8.