

Abstract
Underrepresented minority (URM) faculty face challenges in many domains of academia, from university admissions to grant applications. We examine whether this translates to promotion and tenure (P&T) decisions. Data from five US universities on 1,571 faculty members’ P&T decisions show that URM faculty received 7% more negative votes and were 44% less likely to receive unanimous votes from P&T committees. A double standard in how scholarly productivity is rewarded is also observed, with below-average h-indexes being judged more harshly for URM faculty than for non-URM faculty. This relationship is amplified for faculty with intersectional backgrounds, especially URM women. The differential treatment of URM women was mitigated when external reviewers highlighted candidates’ scholarship more in their review letters. In sum, the results support the double standard hypothesis and provide evidence that different outcomes in P&T decision-making processes contribute to the sustained underrepresentation of URM faculty in tenured faculty positions.
Subject terms: Careers; Science, technology and society; Education
Masters-Waage et al. report that underrepresented minority (URM) faculty in the USA face barriers in the promotion and tenure process, receiving more negative votes and fewer unanimous positive decisions at the college level. This is partly due to a double standard: URM faculty are held to a higher standard than non-URM faculty in terms of scholarly productivity.
Main
The academic community is not representative of the society it serves. In the USA, of the 840,000 full-time faculty at degree-granting postsecondary institutions, academics are disproportionately white or Asian (82%) relative to the US population (66%). This overrepresentation corresponds to a staggering underrepresentation of Black and Hispanic individuals, who make up 31% of the US population but only a tenth of faculty appointments at institutions of higher education1.
Not only does this inequality harm equitable access to academic careers, but it also harms academia by reducing the quality and breadth of research. Diverse teams of academics produce more innovative2–4 and highly cited research5. Additionally, given that faculty have a tendance to study topics that are relevant to their societal, cultural and ethnic backgrounds, the lack of Black and Hispanic scholars results in less focus on the issues facing Black and Hispanic communities in the USA6. Furthermore, undergraduate and graduate URM students are more likely to pursue and sustain academic careers when given access to faculty mentors who share their lived experiences7, and they perform better when working with faculty who share their intersectional identity8. For these reasons, universities, governments and global academic organizations have taken steps to address underrepresentation among faculty9.
A variety of different barriers have contributed to underrepresentation in academia10. To begin, individuals with URM backgrounds, on average, have been disadvantaged by admissions processes at elite universities that privilege legacy admissions and donors as well as students who have greater access to resources designed to help them succeed in the admissions process11. It is therefore not surprising that URM students have been admitted into graduate school and completed doctoral degrees at lower rates than either white or Asian individuals4. Within academia, URM academics have faced barriers in the peer-review process12–15, the funding of grants from government agencies16,17 and the acquisition of patents18,19. In addition, they can be stereotyped as less competent and less hireable within the academic community20. These factors affect URM academics throughout their careers, but they come to a crux in promotion and tenure (P&T) decision-making, which constitutes a key advancement step impacting faculty diversity in tenured positions. It is these decisions that determine a scholar’s ability to stay at their current institution or be forced to relocate to another postsecondary institution or choose a different career path entirely21,22. Anecdotal and qualitative data suggest that faculty of colour experience unique challenges when it comes to P&T23. In an effort to challenge structural racism within academia, several scholars have offered guidance on how external review letter (ERL) writers can help guard against these challenges24,25. Considering the criticality of P&T decisions for individual faculty careers and the diversity of the academy, there is a staggering lack of empirical, quantitative research on the P&T processes and the role that bias plays in P&T decision-making.
Although academia presents itself as a meritocratic system20,21, past research has found that irrelevant demographic factors can affect outcomes. This has been most heavily studied in the context of gender. For example, women in academia face challenges in applications to academic positions22, invitations to present their research23 and teaching evaluations24, which have all been attributed to the different perceptions held about men versus women academics. Race-based perceptions also affect URM academics17,25, but less research has examined how these translate into different outcomes within the academic reward system. In this paper, we hypothesize that racial disparities in academia extend to the P&T process, and we examine the conditions under which this association is more or less pronounced. We also consider how ERL writers can help mitigate this and support URM faculty who deserve promotion. (Hypothesis 1: URM status is negatively related to P&T voting outcomes.)
Decades of research has shown that there are specific conditions under which minority group members are treated differently than majority group members26–28. In terms of judgement formation, the differences can manifest as minority versus majority group members being held to different standards28–31. Past research has shown that these standards are most likely to shift when individuals are being judged in terms of ability to perform at a high standard, with experimental research showing that URMs are judged more harshly for similar levels of performance31. This is the basis of the frequent remark that minorities must “work twice as hard to be considered half as good”32.
Within the P&T process, particularly among R1 institutions, the most important metric for evaluating faculty is research productivity18,29–31, which in theory appears to be an objectively quantifiable metric (for example, the number of publications, citations and grant dollars accrued). Research productivity is typically assessed in terms of faculty’s research output and impact33, evaluated through standardized research impact metrics (such as h-index scores) and ERLs, which provide holistic evaluations of faculty (including their scholarly productivity) by experts in the field34. Tenure-track/tenured faculty are typically expected to spend more time and effort on research than on other activities. It is therefore not surprising that past research has shown that scholarly productivity is weighted more heavily in annual reviews and P&T decision-making than teaching, service to the institution and/or public, and contributions to diversity9–12. In line with the shifting standards model22–25, we hypothesize that when voting on whether a P&T candidate should be promoted, committees will hold URM faculty’s research output and impact to a higher standard than that of non-URM faculty. In other words, URM faculty with lower levels of scholarly productivity will be treated more negatively than non-URM faculty with lower levels of productivity. (Hypothesis 2: Scholarly productivity will moderate the relationship between URM status and P&T voting, such that the racial disparities will be greatest for faculty with lower levels of scholarly productivity.)
Furthermore, we argue that the challenges faced by URM faculty are particularly likely to affect URM women, whose intersectional identities expose them to different perceptions associated with their URM status and gender. Intersectionality, as defined by Collins33, is the “critical insight that race, class, gender, sexuality, ethnicity, nation, ability, and age operate not as unitary, mutually exclusive entities, but as reciprocally constructing phenomena that in turn shape complex social inequalities” (p. 2). Intersectional analysis encapsulates a paradigm shift in which social categories are best understood within cultural and political histories, in the context of other categories and as jointly associated with experiences and outcomes35,36. A substantial amount of empirical research has examined evidence for gender bias in academia5,37–41 and to a lesser extent racial bias42,43. However, empirical research on intersectionality has been limited, with the majority of the work being qualitative6,44. This gap is significant, given that URM women face increased challenges in the P&T process and are potentially “double taxed”45,46. We critically examine this hypothesis by considering whether URM women specifically face amplified double standards for scholarly productivity in the P&T process. (Hypothesis 3: The moderating effect of scholarly productivity on the relationship between URM status and P&T voting will be most pronounced for URM women.)
Thus far, this paper has considered the conditions under which URM candidates, and URM women candidates in particular, are treated differently in the P&T process. Next, we investigate factors that could close this gap. Specifically, we examine the role of ERLs, which provide decision makers with an outsider’s view of a P&T candidate’s quality when making their recommendations. Administrators have described ERLs as one of the most critical factors determining P&T decisions24,47,48. The level of influence that letter writers have in the P&T process highlights the importance of how they choose to describe P&T candidates34.
In recent years, academics have written guidelines for how letter writers can champion minority faculty24—for example, by adopting ‘anti-racist’ approaches in their ERLs25. However, such recommendations are generally based on academics’ qualitative experiences in the P&T process and applications from other fields. We further develop this work by advancing theory on how the linguistic qualities of ERLs relate to outcomes for URM faculty in the P&T process34. Building on the shifting standards model, we theorize that the discussion of academic scholarship within ERLs may play a particularly important role in the evaluation of URM faculty. Given that minority group members are held to a higher standard in terms of performance31, URM faculty whose scholarship is discussed in more depth in their ERLs are likely to fare better in the P&T process. In particular, beyond the rigid measures of scholarship (most notably faculty h-index), the letter writer’s discussion of a candidate’s scholarship can provide a more nuanced assessment of a faculty member’s scholarly impact on their field of study and on society. External reviewers can demonstrate an appreciation for the innovations and novel contributions that are being made by a URM scholar6. By doing so, letter writers who champion the scholarship of URM candidates might mitigate the extent to which they experience challenges in the P&T process. (Hypothesis 4: The extent to which letter writers discuss candidates’ scholarship in their ERLs for P&T candidates will moderate the relationship between URM status and P&T voting, such that increased mention of the quality and impact of scholarship will reduce racial disparities.)
To summarize, this paper interrogates a potential crux in academia’s underrepresentation problem: racial disparities in P&T voting. To do so, we use a multi-institution dataset containing 1,571 P&T decisions for faculty members seeking promotion to associate professor (with tenure) or promotion to full professor49. This dataset is supplemented with linguistic analyses of ERLs written for P&T candidates and publicly available data scraped from the Internet (for example, the h-index). Through examining our hypotheses, we close three practically, theoretically and empirically relevant research gaps. First, we empirically examine whether URM faculty are evaluated more negatively in the P&T process. Second, we investigate whether this is linked to a P&T candidate’s intersectional identity and a double standard in which URM (and particularly URM women) faculty are judged more harshly for low faculty productivity. Third, we determine whether and how more negative evaluations of URM faculty and URM women can be mitigated through ERLs. We thus provide practical contributions to university administrators whose areas of responsibility include oversight of P&T processes. We also provide recommendations for faculty members who are interested in writing identity-affirming, supportive ERLs for faculty of colour and particularly women of colour.
Results
Descriptive statistics and correlations for all study variables are provided in Extended Data Table 1 (see the online supplementary materials).
Extended Data Table 1.
Correlations and Descriptive Statistics

Note. N = 1571. Candidate URM status is coded 1 for candidates who are underrepresented minorities (Black/African American or Hispanic) and 0 for candidates who are White/Caucasian or Asian/Asian American. Woman candidate is coded 1 for women and 0 for men. External grants refers to the number of external grants awarded as principal investigator. STEM discipline is coded 1 for candidates from a STEM discipline and 0 for candidates from a non-STEM discipline. Full professor is coded 1 for candidates seeking promotion to full professor and 0 for candidates seeking promotion to associate professor. Tenure in rank refers to the number of years a candidate has been in their present rank. University ranking refers to the rank of the candidate’s university, according to the US News and World Report. Dep. refers to department level voting. Coll. refers to college level voting. Provost vote is coded 1 for a ‘yes’ vote from the Provost and 0 for a ‘no’ vote from the Provost. Scholarship language is aggregated at the candidate level. * p < 0.05; ** p < 0.01; *** p < 0.001.
Association between URM status and P&T decisions
Our first set of analyses examined the relationship between URM status and P&T decisions at all levels of voting (Hypothesis 1). We analysed both the percentage of negative votes faculty received (continuous variable) and whether they received a unanimous positive vote (dichotomous variable). Both these outcomes are important. A unanimous vote can be seen as a gold standard for faculty, reducing the scrutiny they receive later in the process. The negative vote percentage is a key indicator of the degree of support a faculty candidate received.
First, we examined the association between candidate URM status and department-level voting outcomes. As shown in Tables 1 and 2, with and without control variables, there was no evidence of a relationship between candidate URM status and department negative vote percentage or department unanimous votes. There was a different trend for the relationship between candidate URM status and college-level voting outcomes. As shown in Tables 1 and 2, without control variables, candidate URM status was associated with more negative votes (β = 0.33; P < 0.001; 95% confidence interval (CI), (0.15, 0.51)) and fewer unanimous votes (odds ratio (OR), 0.56; P = 0.004; 95% CI, (0.38, 0.83)) at the college level. Similarly, with control variables, candidate URM status was associated with more negative votes (β = 0.31; P = 0.002; 95% CI, (0.12, 0.51)) and fewer unanimous votes (OR = 0.56; P = 0.017; 95% CI, (0.34, 0.90)) at the college level. To contextualize this result, we calculated the unstandardized coefficients, which indicated that URM faculty received 7% more negative votes at the college level (b = 0.07; P = 0.002; 95% CI, (0.03, 0.12)) keeping other factors constant. Furthermore, interpreting the ORs shows that URM faculty were 44% less likely to receive a unanimous vote.
Table 1.
Ordinary least squares (OLS) regression results for candidate URM status predicting negative vote percentage
| Department negative vote percentage | College negative vote percentage | |||||||||||
|---|---|---|---|---|---|---|---|---|---|---|---|---|
| Model 1 | Model 2 | Model 1 | Model 2 | |||||||||
| Variable | β | 95% CI | P | β | 95% CI | P | β | 95% CI | P | β | 95% CI | P |
| URM status | 0.15 | −0.027, 0.336 | 0.096 | 0.08 | −0.116, 0.285 | 0.407 | 0.33*** | 0.150, 0.505 | <0.001 | 0.31** | 0.116, 0.508 | 0.002 |
| Woman candidate | −0.06 | −0.177, 0.066 | 0.370 | −0.05 | −0.171, 0.670 | 0.392 | ||||||
| External grants | −0.02 | −0.082, 0.037 | 0.459 | −0.01 | −0.073, 0.045 | 0.650 | ||||||
| STEM discipline | 0.06 | −0.253, 0.378 | 0.698 | 0.15 | −0.149, 0.458 | 0.319 | ||||||
| Full professor | 0.17** | 0.051, 0.284 | 0.005 | 0.19** | 0.070, 0.301 | 0.002 | ||||||
| Tenure in rank | 0.08** | 0.023, 0.132 | 0.006 | 0.06* | 0.004, 0.117 | 0.036 | ||||||
| University ranking | −0.30* | −0.543, −0.062 | 0.014 | −0.12 | −0.343, 0.095 | 0.266 | ||||||
| R2 | 0.002 | 0.06 | 0.01 | 0.07 | ||||||||
| F | 2.78 | 1.98 | 13.09 | 2.41 | ||||||||
| N | 1,422 | 1,261 | 1,457 | 1,308 | ||||||||
The key hypothesis test is indicated in bold. The statistical test is two-tailed. STEM, science, technology, engineering and mathematics. ‘URM status’ is coded 1 for candidates who are URMs (Black/African American or Hispanic) and 0 for candidates who are white/Caucasian or Asian/Asian American. ‘Woman candidate’ is coded 1 for women and 0 for men. ‘External grants’ refers to the number of external grants awarded as principal investigator. ‘STEM discipline’ is coded 1 for candidates from a STEM discipline and 0 for candidates from a non-STEM discipline. ‘Full professor’ is coded 1 for candidates seeking promotion to full professor and 0 for candidates seeking promotion to associate professor. ‘Tenure in rank’ refers to the number of years a candidate has been in their present rank. ‘University ranking’ refers to the rank of the candidate’s university, according to the US News and World Report. The institution and the Classification of Instructional Programs (CIP) code were also used as controls but are not presented in the table due to the large number of parameters. *P < 0.05; **P < 0.01; ***P < 0.001.
Table 2.
Logistic regression results for candidate URM status predicting unanimous votes
| Department unanimous vote | College unanimous vote | |||||||||||
|---|---|---|---|---|---|---|---|---|---|---|---|---|
| Model 1 | Model 2 | Model 1 | Model 2 | |||||||||
| Variable | OR | 95% CI | P | OR | 95% CI | P | OR | 95% CI | P | OR | 95% CI | P |
| URM status | 0.79 | 0.530, 1.193 | 0.268 | 0.83 | 0.505, 1.349 | 0.444 | 0.56** | 0.378, 0.833 | 0.004 | 0.56* | 0.344, 0.903 | 0.017 |
| Woman candidate | 1.07 | 0.787, 1.467 | 0.651 | 0.91 | 0.657, 1.269 | 0.590 | ||||||
| External grants | 0.96 | 0.844, 1.099 | 0.583 | 0.96 | 0.843, 1.105 | 0.605 | ||||||
| STEM discipline | 0.81 | 0.389, 1.690 | 0.577 | 0.69 | 0.326, 1.452 | 0.326 | ||||||
| Full professor | 0.73* | 0.544, 0.976 | 0.034 | 0.56*** | 0.407, 0.759 | <0.001 | ||||||
| Tenure in rank | 0.89 | 0.780, 1.009 | 0.069 | 0.89 | 0.771, 1.019 | 0.091 | ||||||
| University ranking | 3.07** | 1.48, 6.364 | 0.002 | 1.75 | 0.951, 3.204 | 0.072 | ||||||
| Nagelkerke R2 | 0.001 | 0.12 | 0.01 | 0.16 | ||||||||
| N | 1,422 | 1,261 | 1,457 | 1,308 | ||||||||
The key hypothesis test is indicated in bold. The statistical test is two-tailed. ‘URM status’ is coded 1 for candidates who are URMs (Black/African American or Hispanic) and 0 for candidates who are white/Caucasian or Asian/Asian American. ‘Woman candidate’ is coded 1 for women and 0 for men. ‘External grants’ refers to the number of external grants awarded as principal investigator. ‘STEM discipline’ is coded 1 for candidates from a STEM discipline and 0 for candidates from a non-STEM discipline. ‘Full professor’ is coded 1 for candidates seeking promotion to full professor and 0 for candidates seeking promotion to associate professor. ‘Tenure in rank’ refers to the number of years a candidate has been in their present rank. ‘University ranking’ refers to the rank of the candidate’s university, according to the US News and World Report. Institution and CIP code were also used as controls but are not presented in the table due to the large number of parameters. *P < 0.05; **P < 0.01; ***P < 0.001.
On an exploratory basis, we also conducted a split-sample analysis to see whether the results were more pronounced at the promotion to associate professor (with tenure) level or promotion to the full professor level. As shown in Supplementary Tables 4–7, the results are significant in the promotion-to-associate sub-sample but not in the promotion-to-full sub-sample. These results tentatively suggest that racial disparities are more pronounced at the stage of promotion to associate professor (with tenure).
Provost vote
We analysed the direct and indirect effects of URM status on the provost vote. Within the universities in this sample, the final vote in the P&T process is the provost’s assessment of a candidate’s portfolio and committee recommendations that culminate in a final recommendation to the university president and board of regents. In theory, the provost’s vote is informed by the voting outcomes at the department and college level. Consistent with this, as shown in Extended Data Table 2, we found that both department negative vote percentage (OR = 0.76; P = 0.048; 95% CI, (0.57, 0.998)) and college negative vote percentage (OR = 0.30; P < 0.001; 95% CI, (0.22, 0.42)) were associated with receiving a ‘no’ vote from the provost. Similarly, also shown in Extended Data Table 2, both department unanimous vote (OR = 4.73; P < 0.001; 95% CI, (2.04, 10.97)) and college unanimous vote (OR = 42.04; P < 0.001; 95% CI, (12.80, 138.08)) were associated with receiving a ‘yes’ vote from the provost.
Extended Data Table 2.
Logistic Regression Results for Committee Voting Outcomes Predicting Provost Vote (Full Sample)

Next, we considered whether—directly or indirectly (via voting at the college level)—URM status was related to a negative provost vote. We found that there is a significant indirect effect of URM status on provost vote both via college-level negative vote percentage (OR = 0.87; P < 0.001; 95% CI, (0.83, 0.92)) and via college-level unanimous vote (OR = 0.90; P < 0.001; 95% CI, (0.86, 0.94)); see Extended Data Table 3. However, we found no evidence for a direct effect of URM status on the provost vote (OR = 1.12; P = 0.835; 95% CI, (0.38, 3.29)); see Supplementary Table 1. These results therefore highlight that URM status is related to a negative provost vote but only via college-level voting.
Extended Data Table 3.
Indirect Effect of URM Status on Provost Vote Via College-Level Voting Outcomes (Full Sample)

Note. N = 1162. R2 (indirect effect via neg. vote %) = 0.75. R2 (indirect effect via unanimous vote) = 0.54. The key hypothesis test is indicated in bold. The statistical test is two-tailed. URM status is coded 1 for URM and 0 for non-URM. Woman candidate is coded 1 for women and 0 for men. External grants refers to the # of grants awarded as the PI. STEM discipline is coded 1 for a STEM discipline and 0 for a non-STEM discipline. Full professor is coded 1 for promotion to full and 0 for promotion to associate. Tenure in rank refers to the number of years a candidate has been in their current rank. University ranking refers to the rank of the candidate’s university. Institution and CIP Code were also used as controls. * p < 0.05; ** p < 0.01; *** p < 0.001.
Scholarly productivity as a moderating variable
We analysed the hypothesized double standard for URM candidates in terms of research productivity (Hypothesis 2). To investigate this, we regressed P&T voting outcomes on the interaction between candidate URM status and scholarly productivity (operationalized as their h-index). First, as shown in Table 3, h-index moderated the association between candidate URM status and college negative vote percentage (β = −0.34; P = 0.044; 95% CI, (−0.915, −0.010); Fig. 1). Additionally, as shown in Table 3, h-index moderated the relationship between candidate URM status and college unanimous votes (OR = 4.24; P = 0.003; 95% CI, (1.62, 11.06); Extended Data Fig. 1). As seen in the graphs below, specifically URM candidates with lower h-indexes received more negative votes and fewer unanimous decisions than majority member P&T candidates. Together this provides evidence for the hypothesized double standard faced by URM candidates in the P&T process.
Table 3.
OLS and logistic regression results for the interaction effect of candidate URM status and candidate h-index on college-level voting outcomes
| Variable | College negative vote percentage | College unanimous vote | ||||
|---|---|---|---|---|---|---|
| β | 95% CI | P | OR | 95% CI | P | |
| URM | 0.08 | −0.162, 0.314 | 0.531 | 0.94 | 0.487, 1.817 | 0.855 |
| h-index | −0.10* | −0.169, −0.021 | 0.012 | 1.42** | 1.100, 1.827 | 0.007 |
| URM × h-index | −0.34* | −0.915, −0.010 | 0.044 | 4.24** | 1.624, 11.062 | 0.003 |
| Woman candidate | −0.02 | −0.155, 0.119 | 0.799 | 0.87 | 0.587, 1.279 | 0.471 |
| External grants | −0.03 | −0.102, 0.045 | 0.443 | 1.09 | 0.903, 1.306 | 0.383 |
| STEM discipline | 0.22 | −0.122, 0.557 | 0.209 | 0.44 | 0.190, 1.020 | 0.056 |
| Full professor | 0.32*** | 0.176, 0.459 | <0.001 | 0.30*** | 0.199, 0.453 | <0.001 |
| Tenure in rank | 0.08* | 0.019, 0.148 | 0.011 | 0.86 | 0.725, 1.008 | 0.063 |
| University ranking | −0.07 | −0.327, 0.195 | 0.620 | 1.63 | 0.787, 3.369 | 0.189 |
| R2/Nagelkerke R2 | 0.08 | 0.22 | ||||
| F | 1.98 | |||||
For ‘College negative vote percentage’, OLS regression was used. For ‘College unanimous vote’, logistic regression was used. N = 989. The key hypothesis test is indicated in bold. The statistical test is two-tailed. ‘URM’ is coded 1 for candidates who are URMs (Black/African American or Hispanic) and 0 for candidates who are white/Caucasian or Asian/Asian American. The variable ‘h-index’ refers to the candidate’s h-index at the time of P&T. ‘Woman candidate’ is coded 1 for women and 0 for men. ‘External grants’ refers to the number of external grants awarded as principal investigator. ‘STEM discipline’ is coded 1 for candidates from a STEM discipline and 0 for candidates from a non-STEM discipline. ‘Full professor’ is coded 1 for candidates seeking promotion to full professor and 0 for candidates seeking promotion to associate professor. ‘Tenure in rank’ refers to the number of years a candidate has been in their present rank. ‘University ranking’ refers to the rank of the candidate’s university, according to the US News and World Report. Institution and CIP code were also used as controls but are not presented in the table due to the large number of parameters. *P < 0.05; **P < 0.01; ***P < 0.001.
Fig. 1. Double standard for URM faculty.
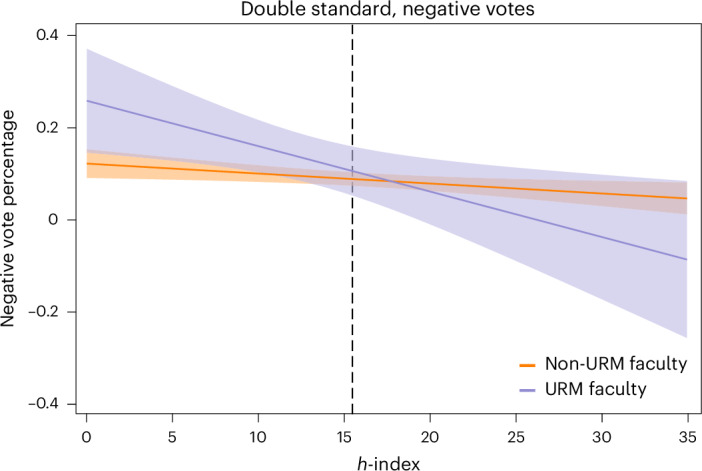
Interaction between URM status and scholarly productivity for negative vote percentage (OLS linear regression; β = −0.34; P = 0.044; 95% CI, (−0.92, −0.01)). The trend lines are presented as mean values with the shaded areas around the lines representing the 95% CIs. The statistical test used for this figure is two-tailed.
Extended Data Fig. 1. Interaction Between URM Status and Scholarly Productivity for College-Level Unanimous Votes (Logistic Regression).

Note. The statistical test used for this figure is two-tailed.
Examining the intersection between URM status and gender
We examined whether the different outcomes experienced by URM faculty were amplified for URM women. To investigate this, we regressed voting at the college level on the interaction between candidate URM status and the ‘woman candidate’ variable. As shown in Supplementary Table 2, there is no evidence that candidate gender moderates the relationship between candidate URM status and college-level voting outcomes—namely, negative vote percentage and unanimous votes.
Next, we investigated whether woman URM candidates specifically face a double standard in terms of scholarly productivity (Hypothesis 3). To investigate this, we regressed P&T decisions on the interaction between candidates’ woman/URM status and h-index. Specifically, a dummy variable was generated that indicated whether candidates were a non-URM man (‘1’), a URM woman (‘2’), a URM man (‘3’) or a non-URM woman (‘4’). This categorical variable was then interacted with h-index, with non-URM man being the omitted reference category. The analyses were also conducted using a three-way interaction between URM status, gender and h-index, with consistent results; these are reported in the supplementary materials (Supplementary Table 3).
As shown in Table 4, the results indicate support for a two-way interaction for college negative vote percentage (β = −0.97; P = 0.002; 95% CI, (1.547, −0.384)) and for college unanimous votes (OR = 6.59; P = 0.019; 95% CI, (1.37, 31.73)), when comparing non-URM men with URM women. The interaction for negative vote percentage is broken down by URM and woman status in Fig. 2, highlighting how the relationship reflects a double standard of intersectionality for URM women in terms of scholarly productivity; a similar graph for unanimous votes is provided in Extended Data Fig. 2.
Table 4.
OLS and logistic regression results for the interaction effect of candidate URM status, woman candidate and candidate h-index on college-level voting outcomes
| College negative vote percentage | College unanimous vote | |||||||||||
|---|---|---|---|---|---|---|---|---|---|---|---|---|
| Variable | Model 1 | Model 2 | Model 1 | Model 2 | ||||||||
| β | 95% CI | P | β | 95% CI | P | OR | 95% CI | P | OR | 95% CI | P | |
| Woman URM | 0.08 | −0.305, 0.472 | 0.674 | 0.64 | 0.220, 1.836 | 0.403 | ||||||
| Man URM | −0.05 | −0.344, 0.254 | 0.768 | 1.20 | 0.521, 2.754 | 0.672 | ||||||
| Woman non-URM | −0.06 | −0.202, 0.084 | 0.419 | 0.94 | 0.624, 1.425 | 0.781 | ||||||
| h-index | −0.11** | −0.182, −0.035 | 0.004 | −0.08* | −0.165, −0.004 | 0.041 | 1.52** | 1.176, 1.958 | 0.001 | 1.39* | 1.036, 1.855 | 0.028 |
| Woman URM × h-index | −0.97** | −1.547, −0.384 | 0.001 | 6.59* | 1.370, 31.733 | 0.019 | ||||||
| Man URM × h-index | −0.05 | −0.442, 0.347 | 0.814 | 3.23 | 0.961, 10.852 | 0.058 | ||||||
| Woman non-URM × h-index | −0.06 | −0.210, 0.081 | 0.384 | 1.11 | 0.708, 1.735 | 0.654 | ||||||
| External grants | −0.03 | −0.105, 0.043 | 0.409 | −0.03 | −0.107, 0.040 | 0.369 | 1.09 | 0.910, 1.311 | 0.342 | 1.09 | 0.908, 1.315 | 0.347 |
| STEM discipline | 0.20 | −0.138, 0.544 | 0.244 | 0.23 | −0.110, 0.566 | 0.187 | 0.48 | 0.209, 1.102 | 0.083 | 0.42* | 0.182, 0.991 | 0.048 |
| Full professor | 0.31*** | 0.171, 0.453 | <0.001 | 0.32*** | 0.183, 0.465 | <0.001 | 0.31*** | 0.211, 0.471 | <0.001 | 0.30*** | 0.197, 0.449 | <0.001 |
| Tenure in rank | 0.08* | 0.015, 0.145 | 0.016 | 0.08** | 0.020, 0.149 | 0.001 | 0.87 | 0.742, 1.027 | 0.101 | 0.85 | 0.725, 1.007 | 0.061 |
| University ranking | −0.07 | −0.327, 0.196 | 0.624 | −0.07 | −0.334, 0.186 | 0.577 | 1.71 | 0.835, 3.519 | 0.142 | 1.62 | 0.780, 3.352 | 0.196 |
| R2/Nagelkerke R2 | 0.07 | 0.09 | 0.20 | 0.22 | ||||||||
| F | 1.91 | 2.09 | ||||||||||
| N | 997 | 989 | 997 | 989 | ||||||||
For ‘College negative vote percentage’, OLS regression was used. For ‘College unanimous vote’, logistic regression was used. The key hypothesis test is indicated in bold. The statistical test is two-tailed. The interaction between woman candidate and candidate URM status was operationalized as a categorical variable with four groups (woman URM, man URM, woman non-URM and man non-URM) and is presented via k − 1 dummy variables in the output. The ‘h-index’ variable refers to the candidate’s h-index at the time of P&T. ‘External grants’ refers to the number of external grants awarded as principal investigator. ‘STEM discipline’ is coded 1 for candidates from a STEM discipline and 0 for candidates from a non-STEM discipline. ‘Full professor’ is coded 1 for candidates seeking promotion to full professor and 0 for candidates seeking promotion to associate professor. ‘Tenure in rank’ refers to the number of years a candidate has been in their present rank. ‘University ranking’ refers to the rank of the candidate’s university, according to the US News and World Report. Institution and CIP code were also used as controls but are not presented in the table due to the large number of parameters. *P < 0.05; **P < 0.01; ***P < 0.001.
Fig. 2. Double standard for URM women faculty.

Interaction between URM/gender status and scholarly productivity in predicting negative voting percentage (OLS linear regression; β = −0.97; P = 0.002; 95% CI, (−1.55, −0.38)). The trend lines are presented as mean values with the shaded areas around the lines representing the 95% CIs. The statistical test used for this figure is two-tailed.
Extended Data Fig. 2. Interaction Between URM/Woman Status and Scholarly Productivity in Predicting Unanimous Voting (Logistic Regression).

Note. The statistical test used for this figure is two-tailed.
Mitigating effect of ERL content on P&T decisions
Finally, we examined how the content of candidates’ ERLs could help mitigate the challenges faced by URM faculty and specifically URM women (Hypothesis 4). Given the above results demonstrating intersectionality in the double standard regarding scholarly productivity, we focused our analysis on outcomes for URM women faculty. We regressed voting outcomes at the college level on the interaction between candidates’ URM status and gender status (1 = ‘Woman URM candidate’, 0 = ‘All other candidates’) and scholarship language in ERLs. As shown in Table 5, scholarship language negatively moderated the relationships between woman URM status and college negative voting percentage (β = −0.22; P = 0.007; 95% CI, (−0.38, −0.06); Fig. 3) and college unanimous votes (OR = 15.67; P = 0.005; 95% CI, (2.33, 105.54); Extended Data Fig. 3). These results demonstrate that emphasizing URM women candidates’ scholarship in the P&T process could help mitigate the double standard they face in academia.
Table 5.
Multilevel regression results for the interaction effect of candidate woman URM status and scholarship language on college-level voting outcomes
| Variable | College negative vote percentage | College unanimous vote | ||||||||||
|---|---|---|---|---|---|---|---|---|---|---|---|---|
| Model 1 | Model 2 | Model 1 | Model 2 | |||||||||
| β | 95% CI | P | β | 95% CI | P | OR | 95% CI | P | OR | 95% CI | P | |
| Woman URM | 0.13* | 0.007, 0.160 | 0.039 | 0.22** | 0.08, 0.62 | 0.004 | ||||||
| Scholarship | 0.02 | −0.007, 0.051 | 0.143 | 0.03 | −0.001, 0.059 | 0.060 | 0.81 | 0.62, 1.05 | 0.104 | 0.75* | 0.58, 0.97 | 0.020 |
| Woman URM × scholarship | −0.22** | −0.385, 0.061 | 0.007 | 15.67** | 2.33, 105.5 | 0.005 | ||||||
| h-index | −0.002** | −0.003, −0.001 | .002 | −0.002** | −0.004, −0.000 | 0.004 | 1.05** | 1.02, 1.08 | 0.004 | 1.04** | 1.01, 1.08 | 0.004 |
| External grants | −0.001 | −0.003, 0.001 | 0.429 | −0.001 | −0.003, 0.001 | 0.471 | 1.01 | 0.98, 1.04 | 0.405 | 1.01 | 0.98, 1.04 | 0.441 |
| STEM discipline | 0.04 | −0.044, 0.135 | 0.327 | 0.05 | −0.042, 0.136 | 0.304 | 0.48 | 0.18, 1.26 | 0.135 | 0.45 | 0.17, 1.22 | 0.117 |
| Full professor | 0.08*** | 0.043, 0.112 | <0.001 | 0.08*** | 0.042, 0.112 | <0.001 | 0.28*** | 0.18, 0.42 | <0.001 | 0.28*** | 0.18, 0.42 | <0.001 |
| Tenure in rank | 0.004 | −0.001, 0.009 | 0.184 | 0.004 | −0.002, 0.009 | 0.199 | 0.96 | 0.91, 1.02 | 0.169 | 0.96 | 0.91, 1.02 | 0.190 |
| University ranking | 8.02 × 10⁻⁶ | −0.000, 0.000 | 0.995 | 1.00 × 10⁻⁶ | −0.000, 0.000 | 0.991 | 1.00 | 0.99, 1.00 | 0.194 | 1.00 | 0.99, 1.00 | 0.175 |
| R2/Nagelkerke R2 | 0.08 | 80.0 | 0.12 | 0.13 | ||||||||
For ‘College negative vote percentage’, multilevel regression was used. For ‘College unanimous vote’, multilevel logistic regression was used. The key hypothesis test is indicated in bold. The statistical test is two-tailed. For candidates, N = 935; for ERLs, N = 5,191. Due to a dependency between two independent variables (university ranking and institution), we omitted institution as a control variable. Note that the interaction term was significant if we omitted either variable. ‘Woman URM’ is coded 1 for candidates who are women and URMs (Black/African American or Hispanic) and 0 for candidates who did not classify as both women and URMs. ‘Scholarship’ refers to the score of scholarship language aggregated at the candidate level. The variable ‘h-index’ refers to the candidate’s h-index at the time of P&T. ‘External grants’ refers to the number of external grants awarded as principal investigator. ‘STEM discipline’ is coded 1 for candidates from a STEM discipline and 0 for candidates from a non-STEM discipline. ‘Full professor’ is coded 1 for candidates seeking promotion to full professor and 0 for candidates seeking promotion to associate professor. ‘Tenure in rank’ refers to the number of years a candidate has been in their present rank. CIP code was also used as a control but is not presented in the table due to the large number of parameters. *P < 0.05; **P < 0.01; ***P < 0.001.
Fig. 3. Scholarship language moderates disparities for URM women.
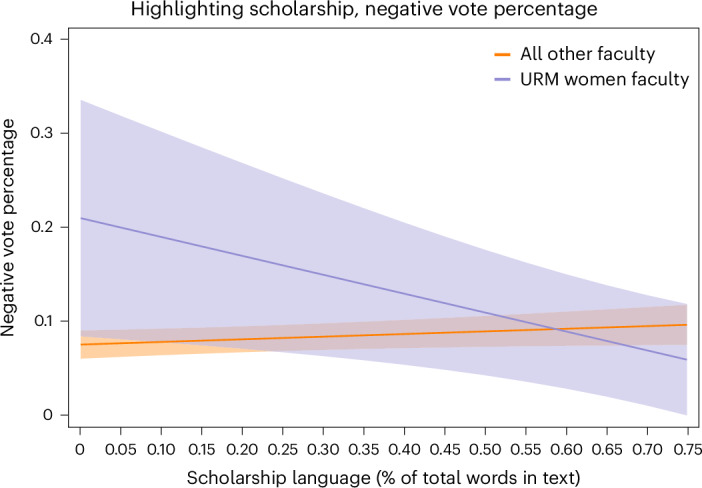
Interaction between URM status and scholarship language for negative vote percentage (OLS linear regression; β = −0.22; P = 0.007; 95% CI, (−0.38, −0.06)). The trend lines are presented as mean values with the shaded areas around the lines representing the 95% CIs. The statistical test used for this figure is two-tailed.
Extended Data Fig. 3. Interaction Between URM Woman and Scholarship Language for College-Level Unanimous Votes (Multilevel Logistic Regression).

Note. The statistical test used for this figure is two-tailed.
One limitation of the Linguistic Inquiry and Word Count (LIWC) analysis is that instances of words related to scholarship are coded, but how these words are used is not coded. We therefore conducted a robustness check where ‘tone’—a dictionary measuring the instances of positive (versus negative) words—was included as a control variable. The moderating effect of scholarship language was replicated for both college negative voting percentage (β = −0.23; P = 0.007; 95% CI, (−0.39, −0.06)) and college unanimous votes (OR = 15.42; P = 0.005; 95% CI, (2.28, 104.12)). Further analyses controlled for the core linguistic dictionaries from the LIWC program—tone, clout, authenticity and analytic language—and again replicated the results for college negative voting percentage (β = −0.23; P = 0.006; 95% CI, (−0.38, −0.07)) and college unanimous votes (OR = 15.39; P = 0.005; 95% CI, (2.30, 103.13)). The results for scholarship language are therefore consistent when controlling for other linguistic features of ERLs.
Discussion
The underrepresentation problem in academia is a multifaceted issue. Contributing factors to continued underrepresentation include differential treatment of URM faculty in grant funding50–52, topic selection6 and the peer review process15,53. Using a multi-university sample, this paper found that on top of these contributing factors, URM faculty face barriers in the P&T process, receiving more negative votes and fewer unanimous positive decisions at the college level. Specifically, URM faculty in the sample received 7% more negative votes at the college level and were 44% less likely to receive a unanimous vote. Furthermore, the results show that these associations are most prominent at the intersection between race and gender. These results help explain the attrition in the representation of Black and Hispanic faculty from assistant professor (14%) to associate professor (11%) and to full professor (8%), highlighting the key role that the P&T process plays in academia’s representation problem54.
We found that the representation problem appears to be at least partly related to a double standard in how URM and non-URM faculty are evaluated relative to their scholarly productivity. An interaction between URM status and h-index (a proxy for scholarly productivity) shows that differential treatment in voting outcomes is present for URM faculty with a below-average h-index (<15) but not for those with an average or above-average h-index. In other words, URM faculty are held to a higher standard than non-URM faculty in terms of scholarly productivity. This creates a difficulty for URM faculty because increasing scholarly productivity is problematic given the challenges they face in obtaining grants55,56 and publishing their work57. Furthermore, this finding speaks to the broader discussion on whether racial disparities in academia are driven by disparate resources or biased evaluation58. This paper highlights that taking into account disparate resources (for example, grants), the evaluation of a P&T candidate’s scholarly productivity is still biased, on the basis of the race/ethnicity of the candidate. Although this does not rule out the existence and effect of disparate resources, it highlights the significance and distinct presence of biased evaluations even given comparable resources.
The double-standard finding also raises an intriguing question for future research: do URM faculty with an above-average h-index perform better than non-URM faculty with the same h-index? From Fig. 2 and Extended Data Fig. 1, the trend for URM women faculty would appear to suggest so. This would be consistent with the stereotype literature, which finds that as the competence of an individual increases, the role of stereotypes in evaluating these individuals decreases59. However, given that there is more data on the low end of the h-index for URM faculty, more data would be needed to appropriately explore this hypothesis.
Our analyses also point to an avenue for addressing the challenge faced by URM women specifically. We found that URM women who had their scholarship emphasized in their ERLs received more positive voting outcomes. Furthermore, the interaction pattern showed that the presence of scholarship language in ERLs was uniquely related to benefits for URM women, while no such credible association existed for other faculty. This finding underlines the critical role that ERLs play in P&T decision-making processes34,47,60. However, instead of focusing on differences in how letter writers evaluated different candidates on the basis of their gender/race—which has been a major focus of research on external reviews60,61—this paper highlights how ERLs have the potential to mitigate the challenges faced by URM women by focusing on different aspects of a faculty member’s profile. Critically, outcomes were found to be beneficially associated with scholarship language in ERLs even when controlling for faculty productivity (that is, h-index and number of grants received as a principal investigator). Therefore, university policy encouraging letter writers to focus on scholarship for URM women faculty could close the gaps in the P&T process. This paper also provides empirical evidence for how scholars can develop anti-racist letter-writing guidelines that will be conducive to the promotion of URM faculty25. However, before doing so, scholars should consider some critical questions. First, research needs to be conducted on whether letter writers are responsive to training or guidance (for example, structured ERL letters), and, if so, what the best techniques are. Assuming this is possible, there is also an important discussion to be had on whether ERL writers should adjust their content for URM faculty to be more like that for non-URM faculty, or vice versa.
An interesting result from this paper is that credible associations with URM status were seen only at the college level. A possible explanation for this is that at the college level, the voters are more removed from the candidates, may never have met them and are less likely to be familiar with their research. Therefore, because college-level voters have less background information on the candidate, they may be more likely to rely on race-based perceptions when making their decision62.
Another interesting result from this paper is the relationship between URM status and the provost vote. We found that although there was no evidence of racial disparities in the provost vote, disparities in college-level voting were associated with a lower likelihood of receiving a positive promotion or tenure (that is, a positive provost vote). Furthermore, it is important to note that URM faculty receiving a higher proportion of negative votes at the college level probably impacts their careers beyond influencing the provost vote. First, given that faculty probably learn about the voting results through their network, receiving more negative votes may make URM faculty feel less supported by their university. Coupled with the fact that URM faculty already face epistemic exclusion in academia (the devaluation of scholarship that falls outside the domain of ‘mainstream’ research63), learning that a portion of one’s colleagues did not vote for your tenure or promotion is likely to lead to greater feelings of isolation and a lack of belonging. Second, even if they do not learn about the result of the vote, the other (senior) faculty members will know. Receiving more negative votes may therefore make other faculty members view URM faculty as less competent academics, potentially affecting the likelihood of seeking collaborative relationships or advocating for colleagues (for example, through award nominations and other supportive behaviours).
This paper supports calls for reforms to the P&T process21,64. Despite the critical role that these decisions play in faculty careers and although some changes have been made at institutions included in this study, P&T policies remain largely unchanged from when they were first developed, in terms of how they aim to increase diversity64,65. However, while many have called for change, this paper provides empirical evidence that the current system disadvantages URM faculty. The paper highlights two mechanisms of the P&T process that are associated with the lack of diversity in tenured positions. The first is the role of scholarly productivity in P&T decisions. Scholars have long argued that an h-index is not an appropriate measure of research performance66,67. However, as shown in this paper, it plays a critical role in the differential treatment of URM faculty. Future reforms could consider a different metric for scholarly productivity. The second mechanism that was shown to be important is ERLs. In this paper, we highlight how letter writers who evaluate candidates can serve as a mechanism to mitigate the differential treatment of URM faculty. Reforms to the ERL process could make letter writers aware of the challenges faced by URM faculty—and particularly by URM women—and encourage them to adequately represent candidates’ scholarship in their evaluations.
The policy implications of this study can be built on through future research. One limitation of this paper is that we focused our analyses on the P&T process, but the mechanisms we describe could play a larger role in academia. For example, there could also be a double standard in how URM faculty research productivity is weighed in annual performance and merit evaluations that are tied to compensation. Another limitation of this research is that we did not examine interventions to support URM faculty in the P&T process. The National Science Foundation has funded a variety of interventions to address gender bias in academia68,69, and future research should examine how such interventions could be adjusted to address the different outcomes experienced by URM candidates. The development of such interventions requires academics to establish why URM faculty who have below-average levels of scholarly productivity are judged more harshly in the P&T process.
A key limitation of this research is the external generalizability of the findings. While this project’s consortium approach uniquely demonstrates that racial disparities in P&T decisions are probably prevalent across universities, the institutions are still all US based and primarily research intensive. Future research could examine how these relationships change when the consortium includes prestigious (top 50) institutions, teaching-focused institutions and community/two-year colleges. Similarly, researchers could determine the role that networks and greater access to academic labour (that is, funded post-doctoral and graduate students)—both of which have been shown to vary greatly across institutions70,71—play in exacerbating or mitigating racial disparities in P&T. Furthermore, future research can build on the exploratory finding (Supplementary Tables 4–7) that racial disparities are more evident at the promotion-to-associate-professor (with tenure) stage than at the promotion-to-full-professor stage.
The interdisciplinary nature of this dataset is both a strength and a limitation. On the one hand, demonstrating the generalizability of racial disparities across disciplines shows the universality of this problem, encouraging the entirety of the academic field to consider how these differences can be addressed. On the other hand, adopting a generalist approach means that this research was not able to examine the discipline-specific nuances that are driving these disparities. We therefore encourage future research to go beyond our general observation and look more closely at how racial disparities emerge and can be addressed in specific disciplines (for example, medical schools).
There are also limitations of the variables used as proxies in this study. For example, scholars have highlighted both the strengths and the weaknesses of the h-index as a proxy of scholarly productivity66,72,73. However, there is little doubt that it is one of the most influential metrics used in practice74–77. Furthermore, given our interest in how P&T decision makers perceive faculty productivity, we view the h-index as an appropriate operationalization of scholarly productivity. Equally, the measure of grant productivity used in this paper only captures the number of grants a P&T candidate has as a principal investigator. Part of the reason for using this information is that it was readily available to the team, and (unlike the h-index) there is no widely available metric for quantifying grants. Nevertheless, while the grant measure is simple, it is also worth noting that this is the information that was most readily available in the P&T portfolios and thus corresponds to what P&T decision makers had easy access to. This underlines the need for academics and universities to develop richer metrics for quantifying candidates’ ability to obtain grants, as this is an important skill for faculty.
Along with addressing this study’s limitations, future research can also extend the strengths of this paper. The data used in this paper included faculty P&T decisions for over 1,500 faculty members from across five universities. The size of this dataset allowed for analyses to examine questions related to intersectionality, which have seen less attention, partly due to a lack of statistical power. Furthermore, by collecting data from across a variety of universities, disciplines and departments, we can show that these results are generalizable. This demonstrates the value of creating a large multi-institutional dataset for investigating diversity issues in academia, and future research should consider further data collections at other universities to help grow this dataset.
To conclude, academia’s representation problem can be associated with differential treatment in the P&T process. On the basis of the raw numbers, URM faculty in this sample received 7% more negative votes and are 44% less likely to receive a unanimous vote at the college level of the P&T process. This is associated with a double standard in which URM faculty with below-average research metrics are judged particularly harshly, and—for URM women—this can be mitigated by ERLs emphasizing faculty members’ scholarship. These results show the current and substantially different treatment of URM faculty, meaning that future efforts to improve diversity in academia will need to address these issues in the P&T process.
Methods
Sample
The present study used data gathered on P&T decisions for 1,571 P&T candidates across the years 2015–2022. The data were collected from five research-intensive institutions. These data were collected by the Center for Equity in Faculty Advancement, a consortium of ten universities that collected data on P&T decisions over a seven-year period. Three were not able to provide the appropriate data (that is, P&T voting outcomes) to be included in the analyses. Another two universities were not included in this study’s analyses due to the high proportion of URM faculty: both were Historically Black Colleges and Universities (HBCUs). Past research on the challenges faced by URMs in academia has focused on predominantly white schools, because such schools constitute the majority of higher education institutions and are more likely to have hostile environments for URM faculty78–81. We therefore did not include the two HBCUs in the analyses, as historically URMs are in fact not a minority within these institutions. Specifically, at these institutions the majority of faculty going up for P&T were Black and Hispanic (66%); in the five schools included, URM faculty make up 9% of the population.
The dataset includes decisions to promote faculty to associate professor with tenure and to full professor. Although associate professors with tenure (49%) and full professors (45%) made up the majority of decisions, there were two unique P&T decisions. First, there were faculty being considered for promotion to associate professor without tenure (1%) and tenure without promotion (5%). Given that these decisions were a small minority, are “generally only considered under exceptional circumstances”82 and may not be associated with the same rewards (such as a pay increase83), we do not include these decisions in our analyses. The dataset also includes ERLs written for each candidate, with a total of 9,032 letters across all candidates. The language in these letters was analysed using LIWC software from Pennebaker et al.84.
Data collection, ethics and availability
This study was reviewed by the primary institution’s Institutional Review Board (IRB) and declared to be non-human-subjects research (STUDY00002463; MOD00003374). The data were de-identified at the candidate and university levels; for more detail, see the section below on data privacy. Access to the archival data was granted by each university’s Academic Affairs leadership. The IRB declaration from the primary university was then used to create IRB reliance agreements for the other partner institutions to agree to.
Data collection
Given the sensitivity of the data collected, a coding protocol was developed to ensure that faculty data would only be accessed locally and entered into individual spreadsheets at each institution exclusively by individuals who worked in the provost’s office, or the equivalent, and who typically had access to this confidential data as part of their routine job responsibilities. Personnel at each institution selected coders who already had access to P&T data and portfolios through their institutional role. Institutional data included P&T processes, candidate characteristics (that is, faculty demographics, discipline, tenure at the university, the rank they were seeking promotion to and voting outcomes), ERL writer characteristics and ERL linguistic features. Our research team provided training on how to extract linguistic content from different file format versions of the ERLs using LIWC software from Pennebaker et al.84. However, to ensure the utmost data confidentiality, none of the principal investigators or investigators analysing the data had access to the raw review letter files. The extracted LIWC data contained information about the percentage of words in a letter relevant to a given domain. Coding teams at each institution submitted LIWC variable data for each ERL entailed in a given candidate’s portfolio. We held weekly meetings with coders from each institution to clarify coding questions and ensure consistent coding practices across schools. Senior administrators who worked with our project cross-checked 2% of the cases for coding errors and refined coding practices in collaboration with the coders. None of the coders or administrators who cross-checked data were involved in the P&T decision-making processes at the respective institutions, nor did they attend P&T committee meetings or deliberations.
Completed coding sheets that were provided by institution-based coders were merged into the dataset by the research team. This dataset initially included an identifier for each candidate that was used to scrape productivity data (that is, publication statistics, grants and patents) from Google Scholar profiles and Academic Analytics by our research team. The scraped information is stored in a database separate from the dataset used in the analysis. The scraping identifier was imported into the database, and each candidate was assigned a (randomized) candidate number. The primary identifiable data were then removed from the dataset.
Ensuring coding reliability
Given the confidentiality of the source data used in this paper, the number of individuals with access to this data was confined to administrative personnel (such as assistant provosts and associate provosts) who already had data access. This, along with the high costs of coding each P&T portfolio, limits the opportunity to use multiple raters and traditional interrater reliability measures. Therefore, to ensure the best possible coding reliability, we developed processes to minimize coding errors. First, our team developed a set of videos with coding instructions for coders at each institution. Second, to keep coding protocols consistent across institutions, the project team held weekly group meetings with all of the coders to answer questions, verify they were correctly coding the information and share best practices for the coding. Third, the site principal investigator (a faculty member or senior administrator at each participating institution) independently recoded a random sample of cases to verify interrater reliability. Discrepancies identified through this process were minimal, suggesting that a full coding of the entire dataset by multiple individuals would have resulted in high interrater reliability estimates/coefficients. Fourth, to supplement our manual checks for coding accuracy, a custom-developed automated checking tool was run to create a preflight report (a custom tool created by our team of data scientists) to point out obvious errors (for example, an incorrect number of variables in the coding sheet submitted, errors in the recorded candidate and letter writer codes based on an established coding scheme, and errors in recorded links to Google Scholar profiles).
Data privacy
Six steps have been taken to ensure the confidentiality of the P&T candidates and letter writers in the data made available through the Open Science Framework (OSF):
No personal identifiable information for the candidates or letter writers is included in the dataset.
Institutions are dummy coded in the dataset.
The US News ranking number was removed from the dataset.
Candidate discipline is dummy coded such that researchers can distinguish between candidates from different disciplines but cannot identify which discipline they are in.
Year codes for when the candidate went up to promotion/tenure have been removed from the dataset.
The h-index was standardized in the online dataset to increase anonymity by ensuring that individuals’ specific citation metrics could not be ascertained from the dataset.
Measures
Candidate URM status
Candidate demographics were recorded in candidates’ human resources profiles (or an equivalent) and shared with us by the institution. Our partner institutions based their records on self-reported data that the candidates provided (generally during the institution’s onboarding process), meaning that race/ethnicity was self-identified. A dummy variable was created indicating whether participants were from a URM (coded as ‘1’) or not (coded as ‘0’), using the definition from the National Science Foundation85. The low number of individuals identifying as Native American/Native Hawaiian (0.1%; N = 2) and other (1%; N = 16) makes it difficult to interpret the results for these ethnic groups; thus, they were not included in the analyses. Candidate URM status was therefore coded as ‘1’ for Black or Hispanic faculty and ‘0’ for white or Asian faculty.
Negative voting percentage
The dataset included voting decisions at various levels of the P&T process. This included voting at the department level, college level and university level. All five institutions had voting at the department and college level. However, only two of the five universities (16% of candidates) had voting at the university level. Due to the small percentage of candidates whose P&T process involved university-level voting, university-level voting was excluded from analysis. Voters could give a ‘yes’ vote, give a ‘no’ vote or abstain. ‘Negative voting percentage’ refers to the percentage of ‘no’ votes that a faculty member received at each voting level.
Unanimous votes
Another voting outcome variable that we computed was unanimous votes. A candidate was marked as having received a unanimous vote (1) if they received all ‘yes’ votes. If a candidate received any ‘no’ votes, their voting outcome was marked as a non-unanimous vote (0). Abstentions were not factored into the coding of this dummy variable.
h-index
Scholarly productivity was measured using the faculty member’s h-index at the time of the P&T decision. Each faculty member’s h-index was retrieved from their publicly available Google Scholar and personal information found on their home university website.
Scholarship language
ERL language was analysed using LIWC software from Pennebaker et al.84, which uses a word-count mechanism, calculating the percentage of words in a given text that reflect a linguistic dictionary. For this study, we developed a new dictionary for the academic setting related to ‘scholarship’, which included terms such as ‘top journal’, ‘funding’, ‘citation’, ‘impact’ and ‘internal grant’ (see Appendix 1 for the full list of terms). The scholarship scores were aggregated at the candidate level. The average percentage of words related to scholarship in each ERL was 0.26%.
Control variables
Control variables included a variety of external factors that influence P&T decision-making. These variables were (1) institution (the universities—among the five universities represented—at which the faculty member was employed), (2) discipline (faculty academic discipline determined using CIP codes86), (3) university ranking (according to the US News database), (4) rank (whether candidates were seeking promotion to associate professor or full professor), (5) grants (the number of external grants for which faculty members were principal investigators), (6) STEM status using the Department of Homeland Security’s determinations of which disciplines are considered STEM (whether faculty were (1) or were not (0) in a STEM field; note that the results replicate without this control variable included (Supplementary Tables 8–10)), (7) woman candidate (coded as ‘1’ for women and ‘0’ for men) and (8) tenure (the number of years a candidate has spent in their current position at their university). For analyses where the h-index was not hypothesized as a moderator, we included it as a control variable.
Analysis plan
The analyses used a variety of regression models for hypothesis tests. For analyses using negative vote percentage, a continuous dependent variable, OLS linear regression was used. For analyses using unanimous votes, a dichotomous dependent variable, logistic regression was used. For analyses using ERL linguistic content (for example, scholarship language), the ERL linguistic content scores were aggregated at the candidate level and then used as a moderator for regression analyses. All statistical tests in this manuscript are two-tailed. Formal tests of normality and homogeneity of variances were not conducted.
Analyses of the main effect of URM status on voting outcomes were conducted with and without controls. Using control variables helps rule out alternative explanations (for example, the disciplinary field of URM faculty). However, as numerous scholars have noted, there are also benefits to conducting models without control variables87–89. Given that this paper is seeking to empirically investigate racial disparities in the academic system as a whole, it is important that we examine the differences across the entire sample. This is because there is ample evidence of URM faculty being discriminated against in various aspects of academia—for example, discipline choice6, ability to obtain grants52 and scholarly productivity15. Therefore, by controlling for each of these factors, we are assuming there is equal opportunity for URM and non-URM faculty (which there is not); thus, by including controls, the model is potentially underestimating the racial disparities in the entire academic system. Although the results of models both with and without controls converged, they do produce different effect sizes, so we decided to include both to provide a more nuanced representation of the results.
Reporting summary
Further information on research design is available in the Nature Portfolio Reporting Summary linked to this article.
Supplementary information
Supplementary Tables 1–10 and Appendix 1.
Acknowledgements
We acknowledge our grantors, including the Alfred P. Sloan Foundation and the National Science Foundation (NSF grant no. 1409928 to R. Khator and NSF grant no. 2100034 to J.M.). The funders had no role in study design, data collection and analysis, decision to publish or preparation of the manuscript. We also thank our entire team within the P&T collaborative research consortium and our External Advisory Board members that support the consortium.
Extended data
Author contributions
J.M., E.H., M.P.M., C.W., T.R., C.S. and P.L. are jointly responsible for conceptualization and funding acquisition. T.M.W., J.M., M.P.M., E.H., A.S.A., E.E.S., C.W., T.R., C.S. and P.L. contributed to the methodology, investigation and writing (original draft, reviewing and editing). T.M.W., E.E.S. and P.L. provided data visualization. J.M., M.P.M., E.H. and C.S. supervised the project.
Peer review
Peer review information
Nature Human Behaviour thanks Molly King, Damani K. White-Lewis and the other, anonymous, reviewer(s) for their contribution to the peer review of this work. Peer reviewer reports are available.
Data availability
Due to the extreme sensitivity of the data, variables that could potentially reveal the identity of the candidates or the institution were not made publicly available. Following this approach, one variable that was omitted from the publicly available dataset is the US News ranking, because individuals would be able to identify the institutions on the basis of their rankings, and we intend to keep these identities private. All other variables are available, and this subset of the data has been made available at OSF (https://tinyurl.com/URMCEFA).
Code availability
The code (run in RStudio, R4.1.0) for all analyses and a codebook for interpreting the data file are publicly available at OSF (https://tinyurl.com/URMCEFA).
Competing interests
The authors declare no competing interests.
Footnotes
Publisher’s note Springer Nature remains neutral with regard to jurisdictional claims in published maps and institutional affiliations.
Extended data
is available for this paper at 10.1038/s41562-024-01977-7.
Supplementary information
The online version contains supplementary material available at 10.1038/s41562-024-01977-7.
References
- 1.National Center for Education Statistics. Table 315.20. Full-time faculty in degree-granting postsecondary institutions, by race/ethnicity, sex, and academic rank: fall 2019, fall 2020, and fall 2021. Digest of Education Statisticshttps://nces.ed.gov/programs/digest/d22/tables/dt22_315.20.asp (2022).
- 2.Allen-Ramdial, S.-A. A. & Campbell, A. G. Reimagining the pipeline: advancing STEM diversity, persistence, and success. BioScience64, 612–618 (2014). [DOI] [PMC free article] [PubMed] [Google Scholar]
- 3.Hofstra, B. et al. The diversity–innovation paradox in science. Proc. Natl Acad. Sci. USA117, 9284–9291 (2020). [DOI] [PMC free article] [PubMed] [Google Scholar]
- 4.Stewart, A. J. & Valian, V. An Inclusive Academy: Achieving Diversity and Excellence (MIT Press, 2018).
- 5.Yang, Y., Tian, T. Y., Woodruff, T. K., Jones, B. F. & Uzzi, B. Gender-diverse teams produce more novel and higher-impact scientific ideas. Proc. Natl Acad. Sci. USA119, e2200841119 (2022). [DOI] [PMC free article] [PubMed] [Google Scholar]
- 6.Kozlowski, D., Larivière, V., Sugimoto, C. R. & Monroe-White, T. Intersectional inequalities in science. Proc. Natl Acad. Sci. USA119, e2113067119 (2022). [DOI] [PMC free article] [PubMed] [Google Scholar]
- 7.Cole, D. & Espinoza, A. Examining the academic success of Latino students in science technology engineering and mathematics (STEM) majors. J. Coll. Stud. Dev.49, 285–300 (2008). [Google Scholar]
- 8.Fay, D. L., Hicklin Fryar, A., Meier, K. J. & Wilkins, V. Intersectionality and equity: dynamic bureaucratic representation in higher education. Public Adm.99, 335–352 (2021). [Google Scholar]
- 9.National Academies of Sciences, Engineering, and Medicine Advancing Antiracism, Diversity, Equity, and Inclusion in STEMM Organizations: Beyond Broadening Participation (National Academies Press, 2023). [PubMed]
- 10.Odekunle, E. A. Dismantling systemic racism in science. Science369, 780–781 (2020). [DOI] [PubMed] [Google Scholar]
- 11.Karabel, J. The Chosen: The Hidden History of Admission and Exclusion at Harvard, Yale, and Princeton (Houghton Mifflin Harcourt, 2005).
- 12.Roberts, S. O., Bareket-Shavit, C., Dollins, F. A., Goldie, P. D. & Mortenson, E. Racial inequality in psychological research: trends of the past and recommendations for the future. Perspect. Psychol. Sci.15, 1295–1309 (2020). [DOI] [PubMed] [Google Scholar]
- 13.Bertolero, M. A. et al. Racial and ethnic imbalance in neuroscience reference lists and intersections with gender. Preprint at bioRxiv10.1101/2020.10.12.336230 (2020).
- 14.Murray, D. et al. Author-reviewer homophily in peer review. Preprint at bioRxiv10.1101/400515 (2018).
- 15.Strauss, D., Gran-Ruaz, S., Osman, M., Williams, M. T. & Faber, S. C. Racism and censorship in the editorial and peer review process. Front. Psychol.10.3389/fpsyg.2023.1120938 (2023). [DOI] [PMC free article] [PubMed]
- 16.Ginther, D. K., Kahn, S. & Schaffer, W. T. Gender, race/ethnicity, and National Institutes of Health R01 research awards: is there evidence of a double bind for women of color?. Acad. Med.91, 1098–1107 (2016). [DOI] [PMC free article] [PubMed] [Google Scholar]
- 17.Ginther, D. K. et al. Race, ethnicity, and NIH research awards. Science333, 1015–1019 (2011). [DOI] [PMC free article] [PubMed] [Google Scholar]
- 18.Schuster, W. M., Davis, E., Schley, K. & Ravenscraft, J. An empirical study of patent grant rates as a function of race and gender. Am. Bus. Law J.57, 281–319 (2020). [Google Scholar]
- 19.Fechner, H. & Shapanka, M. S. Closing diversity gaps in innovation: gender, race, and income disparities in patenting and commercialization of inventions. Technol. Innov.19, 727–734 (2018). [Google Scholar]
- 20.Eaton, A. A., Saunders, J. F., Jacobson, R. K. & West, K. How gender and race stereotypes impact the advancement of scholars in STEM: professors’ biased evaluations of physics and biology post-doctoral candidates. Sex Roles82, 127–141 (2020). [Google Scholar]
- 21.Schimanski, L. A. & Alperin, J. P. The evaluation of scholarship in academic promotion and tenure processes: past, present, and future. F1000Res.7, 1605 (2018). [DOI] [PMC free article] [PubMed] [Google Scholar]
- 22.Berenbaum, M. R. Impact factor impacts on early-career scientist careers. Proc. Natl Acad. Sci. USA116, 16659–16662 (2019). [DOI] [PMC free article] [PubMed] [Google Scholar]
- 23.Turner, C. S. V. & González, J. C. Faculty women of color: the critical nexus of race and gender. J. Divers. High. Educ.4, 199–211 (2011). [Google Scholar]
- 24.Gottlieb, M., Chan, T. M., Yarris, L. M., Linden, J. A. & Coates, W. C. Promotion and tenure letters: a guide for faculty. AEM Educ. Train.6, e10759 (2022). [DOI] [PMC free article] [PubMed] [Google Scholar]
- 25.Bellamy, P. et al. A guide for writing anti-racist tenure and promotion letters. eLife11, e79892 (2022). [DOI] [PMC free article] [PubMed] [Google Scholar]
- 26.Tajfel, H. Social psychology of intergroup relations. Annu. Rev. Psychol.33, 1–39 (1982). [Google Scholar]
- 27.Turner, J. C. in Rediscovering Social Identity (eds Postmes, T. & Branscombe, N. R.) 243–272 (Psychology Press, 2010).
- 28.Biernat, M., Manis, M. & Nelson, T. E. Stereotypes and standards of judgment. J. Pers. Soc. Psychol.60, 485–499 (1991). [Google Scholar]
- 29.Bauer, N. M. Shifting standards: how voters evaluate the qualifications of female and male candidates. J. Polit.82, 1–12 (2020). [Google Scholar]
- 30.Holder, K. & Kessels, U. Gender and ethnic stereotypes in student teachers’ judgments: a new look from a shifting standards perspective. Soc. Psychol. Educ.20, 471–490 (2017). [Google Scholar]
- 31.Biernat, M. & Kobrynowicz, D. Gender- and race-based standards of competence: lower minimum standards but higher ability standards for devalued groups. J. Pers. Soc. Psychol.72, 544–557 (1997). [DOI] [PubMed] [Google Scholar]
- 32.Carter, S. L. Reflections of an Affirmative Action Baby (Basic Books, 1991).
- 33.Collins, P. H. Intersectionality’s definitional dilemmas. Annu. Rev. Sociol.41, 1–20 (2015). [Google Scholar]
- 34.Madera, J. M., Spitzmueller, C., Yu, H., Edema-Sillo, E. & Clarke, M. S. F. External review letters in academic promotion and tenure decisions are reflective of reviewer characteristics. Res. Policy53, 104939 (2024). [Google Scholar]
- 35.Cole, E. R. Intersectionality and research in psychology. Am. Psychol.64, 170–180 (2009). [DOI] [PubMed] [Google Scholar]
- 36.McCall, L. The complexity of intersectionality. Signs J. Women Cult. Soc.30, 1771–1800 (2005). [Google Scholar]
- 37.Moss-Racusin, C. A., Dovidio, J. F., Brescoll, V. L., Graham, M. J. & Handelsman, J. Science faculty’s subtle gender biases favor male students. Proc. Natl Acad. Sci. USA109, 16474–16479 (2012). [DOI] [PMC free article] [PubMed] [Google Scholar]
- 38.Aragón, O. R., Pietri, E. S. & Powell, B. A. Gender bias in teaching evaluations: the causal role of department gender composition. Proc. Natl Acad. Sci. USA120, e2118466120 (2023). [DOI] [PMC free article] [PubMed] [Google Scholar]
- 39.Holman, L., Stuart-Fox, D. & Hauser, C. E. The gender gap in science: how long until women are equally represented? PLoS Biol.16, e2004956 (2018). [DOI] [PMC free article] [PubMed] [Google Scholar]
- 40.West, J. D., Jacquet, J., King, M. M., Correll, S. J. & Bergstrom, C. T. The role of gender in scholarly authorship. PLoS ONE8, e66212 (2013). [DOI] [PMC free article] [PubMed] [Google Scholar]
- 41.Witteman, H. O., Hendricks, M., Straus, S. & Tannenbaum, C. Are gender gaps due to evaluations of the applicant or the science? A natural experiment at a national funding agency. Lancet393, 531–540 (2019). [DOI] [PubMed] [Google Scholar]
- 42.Salazar, J. W., Claytor, J. D., Habib, A. R., Guduguntla, V. & Redberg, R. F. Gender, race, ethnicity, and sexual orientation of editors at leading medical and scientific journals: a cross-sectional survey. JAMA Intern. Med.181, 1248–1251 (2021). [DOI] [PMC free article] [PubMed] [Google Scholar]
- 43.Capers, Q. I., Clinchot, D., McDougle, L. & Greenwald, A. G. Implicit racial bias in medical school admissions. Acad. Med.92, 365–369 (2017). [DOI] [PubMed] [Google Scholar]
- 44.Johnson, A., Brown, J., Carlone, H. & Cuevas, A. K. Authoring identity amidst the treacherous terrain of science: a multiracial feminist examination of the journeys of three women of color in science. J. Res. Sci. Teach.48, 339–366 (2011). [Google Scholar]
- 45.Williams, J. C. Double jeopardy? An empirical study with implications for the debates over implicit bias and intersectionality. Harv. J. Law Gend.37, 185–242 (2014). [Google Scholar]
- 46.Greenman, E. & Xie, Y. Double jeopardy? The interaction of gender and race on earnings in the United States. Soc. Forces86, 1217–1244 (2008). [DOI] [PMC free article] [PubMed] [Google Scholar]
- 47.Abbott, A. et al. Metrics: do metrics matter? Nature465, 860–862 (2010). [DOI] [PubMed] [Google Scholar]
- 48.Dennis, A., Valacich, J., Fuller, M. & Schneider, C. Research standards for promotion and tenure in information systems. Manage. Inf. Syst. Q.30, 1–12 (2006). [Google Scholar]
- 49.Masters-Waage, T. C. et al. CEFA dataset: underrepresented minority faculty face double standard in P&T decisions. Open Science Framework10.17605/OSF.IO/9XU65 (2024).
- 50.Chen, C. Y. et al. Systemic racial disparities in funding rates at the National Science Foundation. eLife11, e83071 (2022). [DOI] [PMC free article] [PubMed] [Google Scholar]
- 51.Shavers, V. L. et al. Barriers to racial/ethnic minority application and competition for NIH research funding. J. Natl Med. Assoc.97, 1063–1077 (2005). [PMC free article] [PubMed] [Google Scholar]
- 52.Check Hayden, E. Racial bias continues to haunt NIH grants. Nature527, 286–287 (2015). [DOI] [PubMed] [Google Scholar]
- 53.Bancroft, S. F., Ryoo, K. & Miles, M. Promoting equity in the peer review process of journal publication. Sci. Educ.106, 1232–1248 (2022). [Google Scholar]
- 54.Race/Ethnicity of College Faculty (National Center for Education Statistics, 2020); https://nces.ed.gov/fastfacts/display.asp?id=61
- 55.Ebadi, A. & Schiffauerova, A. How to boost scientific production? A statistical analysis of research funding and other influencing factors. Scientometrics106, 1093–1116 (2016). [Google Scholar]
- 56.Wang, X., Liu, D., Ding, K. & Wang, X. Science funding and research output: a study on 10 countries. Scientometrics91, 591–599 (2012). [Google Scholar]
- 57.Avery, D. R. et al. Racial biases in the publication process: exploring expressions and solutions. J. Manage.48, 7–16 (2022). [Google Scholar]
- 58.Shauman, K. A. & Huynh, J. Gender, race-ethnicity and postdoctoral hiring in STEMM fields. Soc. Sci. Res.113, 102854 (2023). [DOI] [PubMed] [Google Scholar]
- 59.Koch, A. J., D’Mello, S. D. & Sackett, P. R. A meta-analysis of gender stereotypes and bias in experimental simulations of employment decision making. J. Appl. Psychol.100, 128–161 (2015). [DOI] [PubMed] [Google Scholar]
- 60.Madera, J. M., Hebl, M. R. & Martin, R. C. Gender and letters of recommendation for academia: agentic and communal differences. J. Appl. Psychol.94, 1591–1599 (2009). [DOI] [PubMed] [Google Scholar]
- 61.Steinpreis, R. E., Anders, K. A. & Ritzke, D. The impact of gender on the review of the curricula vitae of job applicants and tenure candidates: a national empirical study. Sex Roles41, 509–528 (1999). [Google Scholar]
- 62.Bodenhausen, G. V. & Wyer, R. S. Effects of stereotypes in decision making and information-processing strategies. J. Pers. Soc. Psychol.48, 267–282 (1985). [PubMed] [Google Scholar]
- 63.Settles, I. H., Buchanan, N. T. & Dotson, K. Scrutinized but not recognized: (in)visibility and hypervisibility experiences of faculty of color. J. Vocat. Behav.113, 62–74 (2019). [Google Scholar]
- 64.Nyunt, G., O’Meara, K., Bach, L. & LaFave, A. Tenure undone: faculty experiences of organizational justice when tenure seems or becomes unattainable. Equity Excell. Educ.22, 107–121 (2022). [Google Scholar]
- 65.Hurtado, S. & Sharkness, J. Scholarship is changing, and so must tenure review. Academe94, 37–39 (2008). [Google Scholar]
- 66.Koltun, V. & Hafner, D. The h-index is no longer an effective correlate of scientific reputation. PLoS ONE16, e0253397 (2021). [DOI] [PMC free article] [PubMed] [Google Scholar]
- 67.Bornmann, L., Mutz, R. & Daniel, H.-D. Are there better indices for evaluation purposes than the h index? A comparison of nine different variants of the h index using data from biomedicine. J. Am. Soc. Inf. Sci. Tec.59, 830–837 (2008). [Google Scholar]
- 68.Moss-Racusin, C. A. et al. Scientific diversity interventions. Science343, 615–616 (2014). [DOI] [PubMed] [Google Scholar]
- 69.Casad, B. J. et al. Gender inequality in academia: problems and solutions for women faculty in STEM. J. Neurosci. Res.99, 13–23 (2021). [DOI] [PubMed] [Google Scholar]
- 70.Li, W., Zhang, S., Zheng, Z., Cranmer, S. J. & Clauset, A. Untangling the network effects of productivity and prominence among scientists. Nat. Commun.13, 4907 (2022). [DOI] [PMC free article] [PubMed] [Google Scholar]
- 71.Zhang, S., Wapman, K. H., Larremore, D. B. & Clauset, A. Labor advantages drive the greater productivity of faculty at elite universities. Sci. Adv.8, eabq7056 (2022). [DOI] [PMC free article] [PubMed] [Google Scholar]
- 72.Costas, R. & Bordons, M. Is g-index better than h-index? An exploratory study at the individual level. Scientometrics77, 267–288 (2008). [Google Scholar]
- 73.Conroy, G. What’s wrong with the H-index, according to its inventor. Nat. Index (4 March 2020).
- 74.Bornmann, L. & Daniel, H.-D. What do we know about the h index? J. Am. Soc. Inf. Sci. Tec.58, 1381–1385 (2007). [Google Scholar]
- 75.Waltman, L. & van Eck, N. J. The inconsistency of the h-index. J. Am. Soc. Inf. Sci. Tec.63, 406–415 (2012). [Google Scholar]
- 76.Bornmann, L. & Daniel, H.-D. Does the h-index for ranking of scientists really work? Scientometrics65, 391–392 (2005). [Google Scholar]
- 77.Hirsch, J. E. Does the h index have predictive power? Proc. Natl Acad. Sci. USA104, 19193–19198 (2007). [DOI] [PMC free article] [PubMed] [Google Scholar]
- 78.Edwards, W. J. & Ross, H. H. What are they saying? Black faculty at predominantly white institutions of higher education. J. Hum. Behav. Soc. Environ.28, 142–161 (2018). [Google Scholar]
- 79.McClain, K. S. & Perry, A. Where did they go: retention rates for students of color at predominantly white institutions. Coll. Stud. Aff. Leadersh.4, 3 (2017). [Google Scholar]
- 80.Zambrana, R. E. et al. Blatant, subtle, and insidious: URM faculty perceptions of discriminatory practices in predominantly White institutions. Sociol. Inq.87, 207–232 (2017). [Google Scholar]
- 81.Ward, L. W. M. & Hall, C. N. Seeking tenure while Black: lawsuit composite counterstories of Black professors at historically white institutions. J. High. Educ.93, 1012–1036 (2022). [Google Scholar]
- 82.Procedures for Granting Academic Tenure and Promotion (Purdue Univ., 2018); https://www.purdue.edu/provost/policies/promotion-procedure.html
- 83.Academic Personnel: Promotion/Tenure Review Process Possible Outcomes (Univ. Washington, accessed January 2024); https://ap.washington.edu/ahr/actions/promotions-tenure/possible-outcomes/
- 84.Pennebaker, J. W., Booth, R. J., Boyd, R. L. & Francis, M. E. Linguistic Inquiry and Word Count: LIWC2015 (Lawrence Erlbaum Associates, 2015).
- 85.Diversity and STEM: Women, Minorities, and Persons with Disabilities 2023 (National Center for Science and Engineering Statistics, 2023); https://ncses.nsf.gov/pubs/nsf23315/report/glossary
- 86.CIP Codes: The Classification of Instructional Programs (NCES, 2023); https://nces.ed.gov/ipeds/cipcode/browse.aspx?y=55
- 87.Bernerth, J. B. & Aguinis, H. A critical review and best-practice recommendations for control variable usage. Pers. Psychol.69, 229–283 (2016). [Google Scholar]
- 88.Child, J. Strategies of control and organizational behavior. Adm. Sci. Q.18, 1–17 (1973). [Google Scholar]
- 89.Li, M. Uses and abuses of statistical control variables: ruling out or creating alternative explanations? J. Bus. Res.126, 472–488 (2021). [Google Scholar]
Associated Data
This section collects any data citations, data availability statements, or supplementary materials included in this article.
Supplementary Materials
Supplementary Tables 1–10 and Appendix 1.
Data Availability Statement
Due to the extreme sensitivity of the data, variables that could potentially reveal the identity of the candidates or the institution were not made publicly available. Following this approach, one variable that was omitted from the publicly available dataset is the US News ranking, because individuals would be able to identify the institutions on the basis of their rankings, and we intend to keep these identities private. All other variables are available, and this subset of the data has been made available at OSF (https://tinyurl.com/URMCEFA).
The code (run in RStudio, R4.1.0) for all analyses and a codebook for interpreting the data file are publicly available at OSF (https://tinyurl.com/URMCEFA).