

Abstract
Background:
Predicting mortality and specific morbidities before they occur may allow for interventions that may improve health trajectories.
Hypothesis:
Integrating key maternal and post-natal infant variables in the first 2 weeks of age into machine learning (ML) algorithms will reliably predict survival and specific morbidities in VLBW preterm infants.
Methods:
ML algorithms were developed to integrate 47 features for predicting mortality, bronchopulmonary dysplasia (BPD), neonatal sepsis, necrotizing enterocolitis (NEC), intraventricular hemorrhage (IVH), cystic periventricular leukomalacia (PVL), and retinopathy of prematurity (ROP). A retrospective cohort (n=3341) was used to train and validate the models with a repeated 10-fold cross validation strategy. These models were then tested on a separate cohort (n=447) to evaluate the final model performance.
Results:
Among the seven ML algorithms employed, tree-based ensemble models, specifically Random Forest (RF) and XGBoost, had the best performance metrics. The area under the receiver operating characteristic curve (AUROC) of sepsis with or without meningitis (0.73), NEC (0.73), BPD (0.71), and mortality (0.74) exceeded 0.7, while area under Precision-Recall curve (AUPRC) for all outcomes were greater than the prevalence, demonstrating effective risk stratification in VLBW preterm infants.
Conclusions:
Our study demonstrates the potential of predictive analytics leveraging ML techniques in advancing precision medicine.
Category of study: Clinical Research
INTRODUCTION
Prematurity, characterized by birth before 37 weeks gestation,1–3 continues to be a pressing concern worldwide, leading to increased risks of mortality, major morbidities, financial and psychosocial burden on families and the society. It is estimated that one in ten babies are born preterm and more than 380,000 preterm infants were born in the US alone in 2023. Preterm infants born at less than 1500 g (very low birth weight, VLBW) have higher rates of mortality and suffer from major morbidities and complications. In 2021, preterm low birth weight infants accounted for about 14.8% of infant deaths in the US.3 Infants who survive hospitalization often suffer from long-term disabilities including blindness, hearing loss, cerebral palsy, intellectual disabilities, and chronic lung disease requiring respiratory support. The societal economic burden associated with prematurity was estimated to exceed $26.3 billion annually in the US, as of 2005.2 Preterm infants born at 24 weeks had the highest per infant average expenditure of $603,778 annually, one hundred-fold higher than full-term infants who had an average spending of $6370 annually.4 Given the significant morbidities, along with the financial and psychosocial stressors, there is an urgent need to shift from traditional reactive medicine to a proactive precision medicine, where the clinical course of disease can be predicted before it occurs, allowing for appropriate interventions that will alter the health trajectory beneficially and improve patient outcomes.
Conventionally, single or few objective measures, such as gestational age and birth weight are used to estimate the likelihood of morbidities and mortality for preterm infants. Clinical Risk Index for Babies (CRIB I & II) scores, SNAP-II and SNAPPE-II scores are used in neonatal intensive care units (NICU) for assessing the severity of illness in preterm newborns by incorporating several clinical and laboratory parameters collected within the first 12 or 24 hours of life.5,6 While these methods provide valuable insights into the health status of preterm infants, they’re recognized as poor predictors due to their limited accuracy in assessing individual risk.7,8 To advance precision medicine in neonatal care, it’s imperative to integrate additional maternal and fetal predictors, recognizing the multifaceted nature of neonatal health outcomes.
Previous studies have employed machine learning (ML) models to incorporate additional features for enhancing precision medicine in the context of VLBW infants. Researchers have developed ML models utilizing data from the Korean Neonatal Network Database to predict adverse birth outcomes, NEC, surgical NEC, postnatal growth failure, yielding AUROC values ranging from 0.70 to 0.75.9–12 Similarly, a study utilizing ML models and data from the Taiwan Neonatal Network predicted length of stay with an AUROC of 0.72.13 While these approaches demonstrate improved accuracy, they are based on data from singular sources without external validation to ensure the generalizability of the models. Moreover, they predominantly focus on singular adverse outcomes or proxies thereof, rather than offering predictions across a broader spectrum of morbidities directly.
In this study, ML models were developed to predict mortality and major morbidities including BPD, IVH, NEC, ROP, and sepsis with or without meningitis, by integrating 47 maternal and VLBW preterm infant, demographic and clinical features in the first two weeks after delivery. A retrospective cohort sourced from the Vermont Oxford Network (VON) database of TCH spanning 2008–2021 (n= 3341 VLBW preterm infants) was leveraged to train and validate the ML models. Subsequently, a separate cohort from the TCH Children’s Hospital Neonatal Consortium (CHNC) database (n=447 VLBW preterm infants) was employed to assess model generalizability. This study is the first attempt to leverage TCH VON and CHNC databases for examining the feasibility of integrating ML techniques into NICU, and thus advancing neonatal care. Our approach also identified previously unreported clinical features that impacted the predictive models for mortality and several morbidities, leading to novel hypothesis generation for future studies.
Methods
Study Design:
We tested the hypothesis that a comprehensive predictive ML model could predict mortality and major morbidities including ROP, IVH, BPD, NEC, and sepsis with or without meningitis by utilizing key antenatal and post-natal features from the first 2 weeks of life in VLBW preterm infants. A retrospective cohort of VLBW preterm neonates queried from the TCH VON database spanning the years 2008 to 2021 (n=3341) was used to train and validate the model. Subsequently, a second retrospective cohort queried from the TCH CHNC database spanning the years 2010 to 2021 (n=447) was used to assess model generalizability. All VLBW preterm neonates who were admitted to the tertiary level NICUs at TCH were included in both cohorts, irrespective of gestational age (Table 1). This study was approved by the Institutional Review Board at Baylor College of Medicine.
Table 1.
Patient demographics
| Number of participants in TCH VON Data n=3341 (%) | Number of participants in TCH CHNC Data n=447 (%) | p value | ||
|---|---|---|---|---|
| Ethnicity | American Indian | 6 (0.18) | 1 (0.22) | <0.0001 |
| Asian | 181 (5.42) | 18 (4.03) | ||
| Black | 1069 (32.00) | 138 (30.87) | ||
| Native Hawaiian | 142 (4.25) | 1 (0.22) | ||
| White | 1906 (57.05) | 270 (60.40) | ||
| Other/Unknown | 37 (1.11) | 19 (4.25) | ||
| Sex | Female | 1655 (49.54) | 202 (45.19) | 0.0938 |
| Male | 1686 (50.46) | 245 (54.81) | ||
| Gestational Age | Extreme Preterm (<28 weeks) | 1594 (47.71) | 300 (67.11) | <0.0001 |
| Very Preterm (28–32 weeks) | 1393 (41.69) | 119 (26.62) | ||
| Moderately Preterm (32–34 weeks) | 263 (7.87) | 20 (4.47) | ||
| Late Preterm (34–37 weeks) | 91 (2.72) | 8 (1.79) | ||
| Birth weight (grams) | 1–300 | 1 (0.03) | 0 (0.00) | <0.0001 |
| 301–600 | 335 (10.03) | 81 (18.12) | ||
| 601–900 | 988 (29.57) | 184 (41.16) | ||
| 901–1200 | 954 (28.55) | 105 (23.49) | ||
| 1201–1500 | 1063 (31.88) | 77 (17.23) | ||
Demographic and Clinical Feature Extraction:
In total, 47 demographic and clinically relevant features were curated for analysis (Table 3). These features were selected based on their documented significant associations with mortality and morbidities within the NICU population in prior studies, their utilization in previous ML-driven neonatal outcome prediction research, and their ease and accuracy of collection within the VON and CHNC databases. Furthermore, these features were categorized into several categories: At Birth, Maternal Characteristics, Initial Resuscitation, After Initial Resuscitation, and Medications and Procedures. To prevent potential information leakage in each prediction task, medications or interventions administered to treat the corresponding adverse outcomes were excluded. The significance of differences in demographic feature distributions between the two databases were assessed with Mann-Whitney U test14 for continuous features and Pearson’s Chi-Square test15 for categorical features.
Table 3 -.
FEATURES FOR MODEL DEVELOPMENT
| At birth | Initial Resuscitation | Medications and procedures |
|---|---|---|
| Birth Weight (grams) | APGAR Score, 1 Minute | Steroids for lung disease |
| Gestational age | APGAR Score, 5 Minutes | Indomethacin for Any Reason |
| Location of birth (inbound/outbound) | Oxygen | Ibuprofen for PDA |
| Sex of Infant | Face Mask Ventilation | PDA Ligation |
| Congenital anomaly | Endotracheal Tube Ventilation | Surgery for NEC, or Bowel Perforation |
| Maternal characteristics | Epinephrine | Other Surgery |
| Race of Mother | Cardiac Compression | Patent Ductus Arteriosus |
| Prenatal Care (Yes or No) | Surfactant during Initial Resuscitation | Respiratory Distress Syndrome |
| Antenatal Steroids | After Initial Resuscitation | |
| Chorioamnionitis | Temperature measured within the first hour after admission | Focal Intestinal Perforation |
| Maternal Hypertension (chronic or pregnancy induced) | Oxygen after Initial Resuscitation | Bacterial Sepsis and/or Meningitis after day 3 |
| Mode of Delivery | Conventional Ventilation | Coagulase Negative Staphylococcal Infection after Day 3 |
| Multiple Gestation | High Frequency Ventilation | Fungal Infection after day 3 |
| Hispanic | High Flow Nasal Cannula | Seizures |
| Nasal Ventilation | ECMO | |
| Nasal CPAP | ||
| Nasal CPAP or Nasal Ventilation before or without ever having received ETT Ventilation | ||
| Surfactant at any Time | ||
| Inhaled Nitric Oxide | ||
| Bacterial Sepsis and/or Meningitis on or before day 3 |
Correlation Network Visualization:
The interrelationship among 47 clinical features were visualized using correlation network structure.16 Each clinical feature was denoted by a node and the network layout was calculated using the Uniform Manifold Approximation and Projection (UMAP) algorithm17 applied to the complete correlation coefficient matrix. Node colors corresponded to the categories to which the features belong. For visualization purposes, only the edges with Spearman correlation p values of less than 0.05 and absolute Spearman correlation coefficient greater than 0.1 were visualized. The node size denotes the significance of correlation with each corresponding outcome with Bonferroni-corrected Spearman correlation p values.
Missing Value Imputation:
Missing values for all features were imputed using a non-parametric multivariate model based on random forests.18 This approach imputes missing data for each feature by leveraging complex interactions and non-linear relationships with other features within the dataset. For each feature with missing data, a random forest model uses the remaining features as predictors to impute the missing values.
Multivariate Modeling:
For every adverse outcome, infants with missing outcomes were filtered out first. In addition, 7 multivariate models, including eXtreme Gradient Boosting (XGBoost),19 Random Forest,20 Logistic Regression without regularization,21 Logistic Regression with Lasso Regularization,22 Logistic Regression with Ridge Regularization,23 Support Vector Classifier,24 and K-nearest neighbors Classifier,25 were developed. Every model was rigorously assessed using a 10-fold cross-validation (CV) strategy26 across 10 repetitions with the cohort from TCH VON database for validation. Metrics were computed for each repetition and aggregated to derive mean and standard deviation values as the final validation result. After validation, ML models were tested on the TCH CHNC database to interrogate the predictive power and model generalizability.
Model performances were evaluated using several metrics for both the TCH VON and CHNC datasets. The risk scores predicted by the ML models were examined to determine significant differences across VLBW infants with and without the respective diseases utilizing Mann-Whitney U test14 for binary outcomes and MANOVA27 for multi-class outcomes. The area under the receiver operating characteristic curve (AUROC) was then computed to assess the discriminatory ability of the models between positive and negative classes, while the area under precision-recall curve (AUPRC) was utilized to evaluate model performance under scenarios of class imbalance. For ROP stages, a multi-class outcome, AUROC and AUPRC were macro- and micro-averaged across all stages. Additionally, the receiver operating characteristic (ROC) curve and precision-recall (PR) curve of the model with the highest AUROC in testing results were plotted for all outcomes. Normalized AUPRC values were calculated as AUPRC divided by prevalence to enable comparison across all adverse outcomes.
Feature Attribution Analysis:
The models generating AUROC greater than 0.70 in the testing result using the VLBW preterm infant in the TCH CHNC database were selected to conduct feature attribution analysis. SHAP (SHapely Additive exPlanations)28 values for all features were computed to evaluate their relative contributions to model output. Without retraining, the change of the model’s output was measured for various combinations of feature subsets. Feature importance was quantified with the average absolute change across these samples, with the larger mean changes indicating higher significance. Subsequently, the most significant 10 features identified were visualized using the feature correlation network, highlighting them with black edges and darker colors for emphasis. The impact of higher or lower values of these top features on the model’s output was illustrated using a beeswarm plot.
RESULTS
Two cohorts of mother-infant dyads were obtained from the TCH VON and CHNC databases, respectively. The VON database was used to train and validate ML models, while the CHNC database was utilized to test ML models. The models producing AUROC values greater than 0.70 were used for feature attribution analysis to interrogate the significant features (Fig 1a). A total of 3,341 VLBW preterm infants were available in the TCH VON database, and 447 VLBW preterm infants in the TCH CHNC database. The distribution of various features, including ethnicity, birth weight (BW), and gestational age (GA), exhibit significant differences between the two datasets (Table 1). Regarding adverse outcomes, such as BPD, NEC, ROP, sepsis with or without meningitis, and mortality, positive cases display comparable percentages across both dataset. However, the incidence of positive cases for IVH appears to be more prevalent in the VON dataset (Table 2).
Figure 1. Study Overview.

1a. A schematic representation of the machine learning (ML) pipeline is depicted here. Various ML models were trained and validated with the Texas Childrens’ Hospital (TCH) Vermont Oxford Network (VON) database for each adverse outcome. After that, these models were tested utilizing the TCH Children’s Hospital Neonatal Consortium (CHNC) database to assess final performance. The models with testing AUROC > 0.70 in each outcome were selected for downstream analysis to mitigate potential biases.
1b. A two-dimensional representation of clinical features from the first 2 weeks post-delivery was generated by applying the UMAP algorithm on their correlation coefficient matrix. Nodes within this framework correspond to specific features from the dataset and are color-coded according to their respective categories. The presence of edges between nodes signifies statistically significant correlations, with an absolute Spearman correlation coefficient exceeding 0.1 and a Spearman correlation p value below 0.05. The width of edges reflects the strength of correlation. (Abbreviations used: BW: birth weight; GA: gestational age; PDA: patent ductus arteriosus; RDS: Respiratory distress syndrome; FIP: Focal Intestinal Perforation)
Table 2.
Patient Morbidities and Mortality
| Prevalence in TCH VON Data (%) | Prevalence in TCH CHNC Data (%) | ||
|---|---|---|---|
| Bronchopulmonary Dysplasia | 37.19 | 35.12 | |
| Intraventricular Hemorrhage | 2.27 | 18.70 | |
| Necrotizing Enterocolitis | 6.51 | 6.94 | |
| Retinopathy of Prematurity (ROP) | Stage 0 | 57.61 | 29.13 |
| Stage 1 | 11.42 | 14.89 | |
| Stage 2 | 23.96 | 34.95 | |
| Stage 3+ | 7.01 | 21.04 | |
| Sepsis with or without Meningitis | 13.41 | 24.48 | |
| Mortality | 14.94 | 9.01 | |
Forty-seven maternal and newborn clinical features, including neonatal and maternal characteristics, maternal medication and pregnancy history, as well as neonatal interventions, medications, and conditions in NICU, were integrated in this study (Table 3). To elucidate the interrelationships among these combined features, a correlation network structure was constructed to visualize them in a two-dimensional space (Fig 1b). The presence of edges between nodes signifies statistically significant correlations (absolute Spearman correlation coefficient greater than 0.1, Spearman correlation p value less than 0.05) between these features, while the width denotes the strength of correlation. Notably, certain features emerged as hub nodes in this network, including BW, GA, Delivery Mode, APGAR score, and several interventions administered during the initial resuscitation stage. These hub nodes underscore their pivotal role in shaping subsequent intervention and medication strategies and may be strongly correlated to the development of conditions observed in the NICU.
For each adverse outcome studied, seven commonly used multivariate ML algorithms, including XGBoost,19 Random Forest,20 Logistic Regression21 with or without Lasso22 or Ridge Regularization,23 Support Vector Classifier,24 and K-nearest neighbors Classifier25 were assessed for their predictive ability. Model performance was evaluated utilizing AUROC and AUPRC on the TCH VON dataset for validation and the TCH CHNC dataset for testing (Supplementary Table 1). In the validation result, the highest AUROC mean values obtained for BPD, IVH, Mortality, NEC, ROP, and sepsis with or without meningitis were 0.86, 0.80, 0.92, 0.80, 0.77, 0.79. However, in the testing phase, these values decreased to 0.71, 0.66, 0.78, 0.73, 0.65, 0.73, respectively. The notable discrepancies suggest potential overfitting of the models during the validation stage.
The top-performing models, as determined by the highest AUROC in testing results for each adverse outcome, were selected for subsequent analysis. The risk scores generated from these models varied significantly among distinct VLBW preterm infant groups, indicating their ability to discriminate high-risk neonatal profiles from those at lower risk for all adverse outcomes (Supplementary Fig 1). Notably, tree-based ensemble models, namely Random Forest20 and XGBoost,19 outperformed other algorithms like Support Vector Classifier24 and K-nearest neighbors Classifier25 in estimating the likelihood associated with BPD, IVH, NEC, ROP and mortality (Supplementary Table 1). Across all adverse outcomes, the AUROC of BPD, NEC, sepsis with or without meningitis, and mortality were greater than 0.7, while the macro-averaged AUROC of ROP and AUROC of IVH fell within the range of 0.65–0.7, indicating moderate discriminative ability across the majority of VLBW preterm infants (Fig 2a). Furthermore, given the imbalanced nature of the outcomes, the AUPRC of the testing dataset was evaluated. The AUPRC values for all morbidities and mortality exceeded the prevalence in the dataset (Fig 2b, Table 2), thus demonstrating the capability of these ML models to accurately predict VLBW preterm infants with adverse outcomes. In addition, the highest normalized AUPRC values were observed in predicting mortality, indicating the effectiveness of the model to predict positive instances in this task (Supplementary Fig 2).
Figure 2. Receiver operating characteristic (ROC) and precision-recall (PRC) curves.

(a) ROC curves, AUROC and (b) PRC curves, AUPRC were obtained by evaluating the model with the best testing performance utilizing the TCH CHNC database for every adverse outcome prediction task. The AUROC of BPD, NEC, sepsis with or without meningitis, and mortality were greater than 0.7, indicating fair predictive power leveraging ML models on these two databases. However, the AUPRC values for all adverse outcomes exceeded the prevalence in the dataset, thus demonstrating the capability of these ML models to accurately predict positive cases among VLBW preterm infants.
Feature attribution analysis was conducted employing SHAP (SHapely Additive exPlanations) method28 to identify the most important features utilized by the models with the best testing result in BPD, NEC, and sepsis with or without meningitis, mortality, all of which generating testing AUROC values greater than 0.70. The 10 most significant features from each model are highlighted with black edges around the nodes and deeper hues in the preceding correlation network layout (Fig. 3). The size of each node represents the significance of the univariate association between that feature and the corresponding outcome. Moreover, the effect of varying levels of these top 10 features on prediction results is depicted through SHAP beeswarm plots (Fig. 4), which illustrate whether higher or lower feature values are associated with increased or decreased model outputs, namely the risk scores pertaining to corresponding adverse outcomes. Our prediction model identified delivery mode was significantly associated in the prediction of NEC (Fig 3b, 4b), and multiple gestation in the prediction of sepsis with or without meningitis (Fig 3c, 4c). Not surprisingly, BW and GA appeared to be two of the most important features across these adverse outcomes, with lower values indicating higher risk generated by ML models. Finally, in predicting BPD (Fig 3a, 4a), the presence of PDA with indomethacin administration would lead to an increased risk score, while in predicting mortality (Fig 3d, 4d), sepsis with or without meningitis emerged as a significant feature.
Figure 3. Correlation networks of clinical features with adverse outcomes.
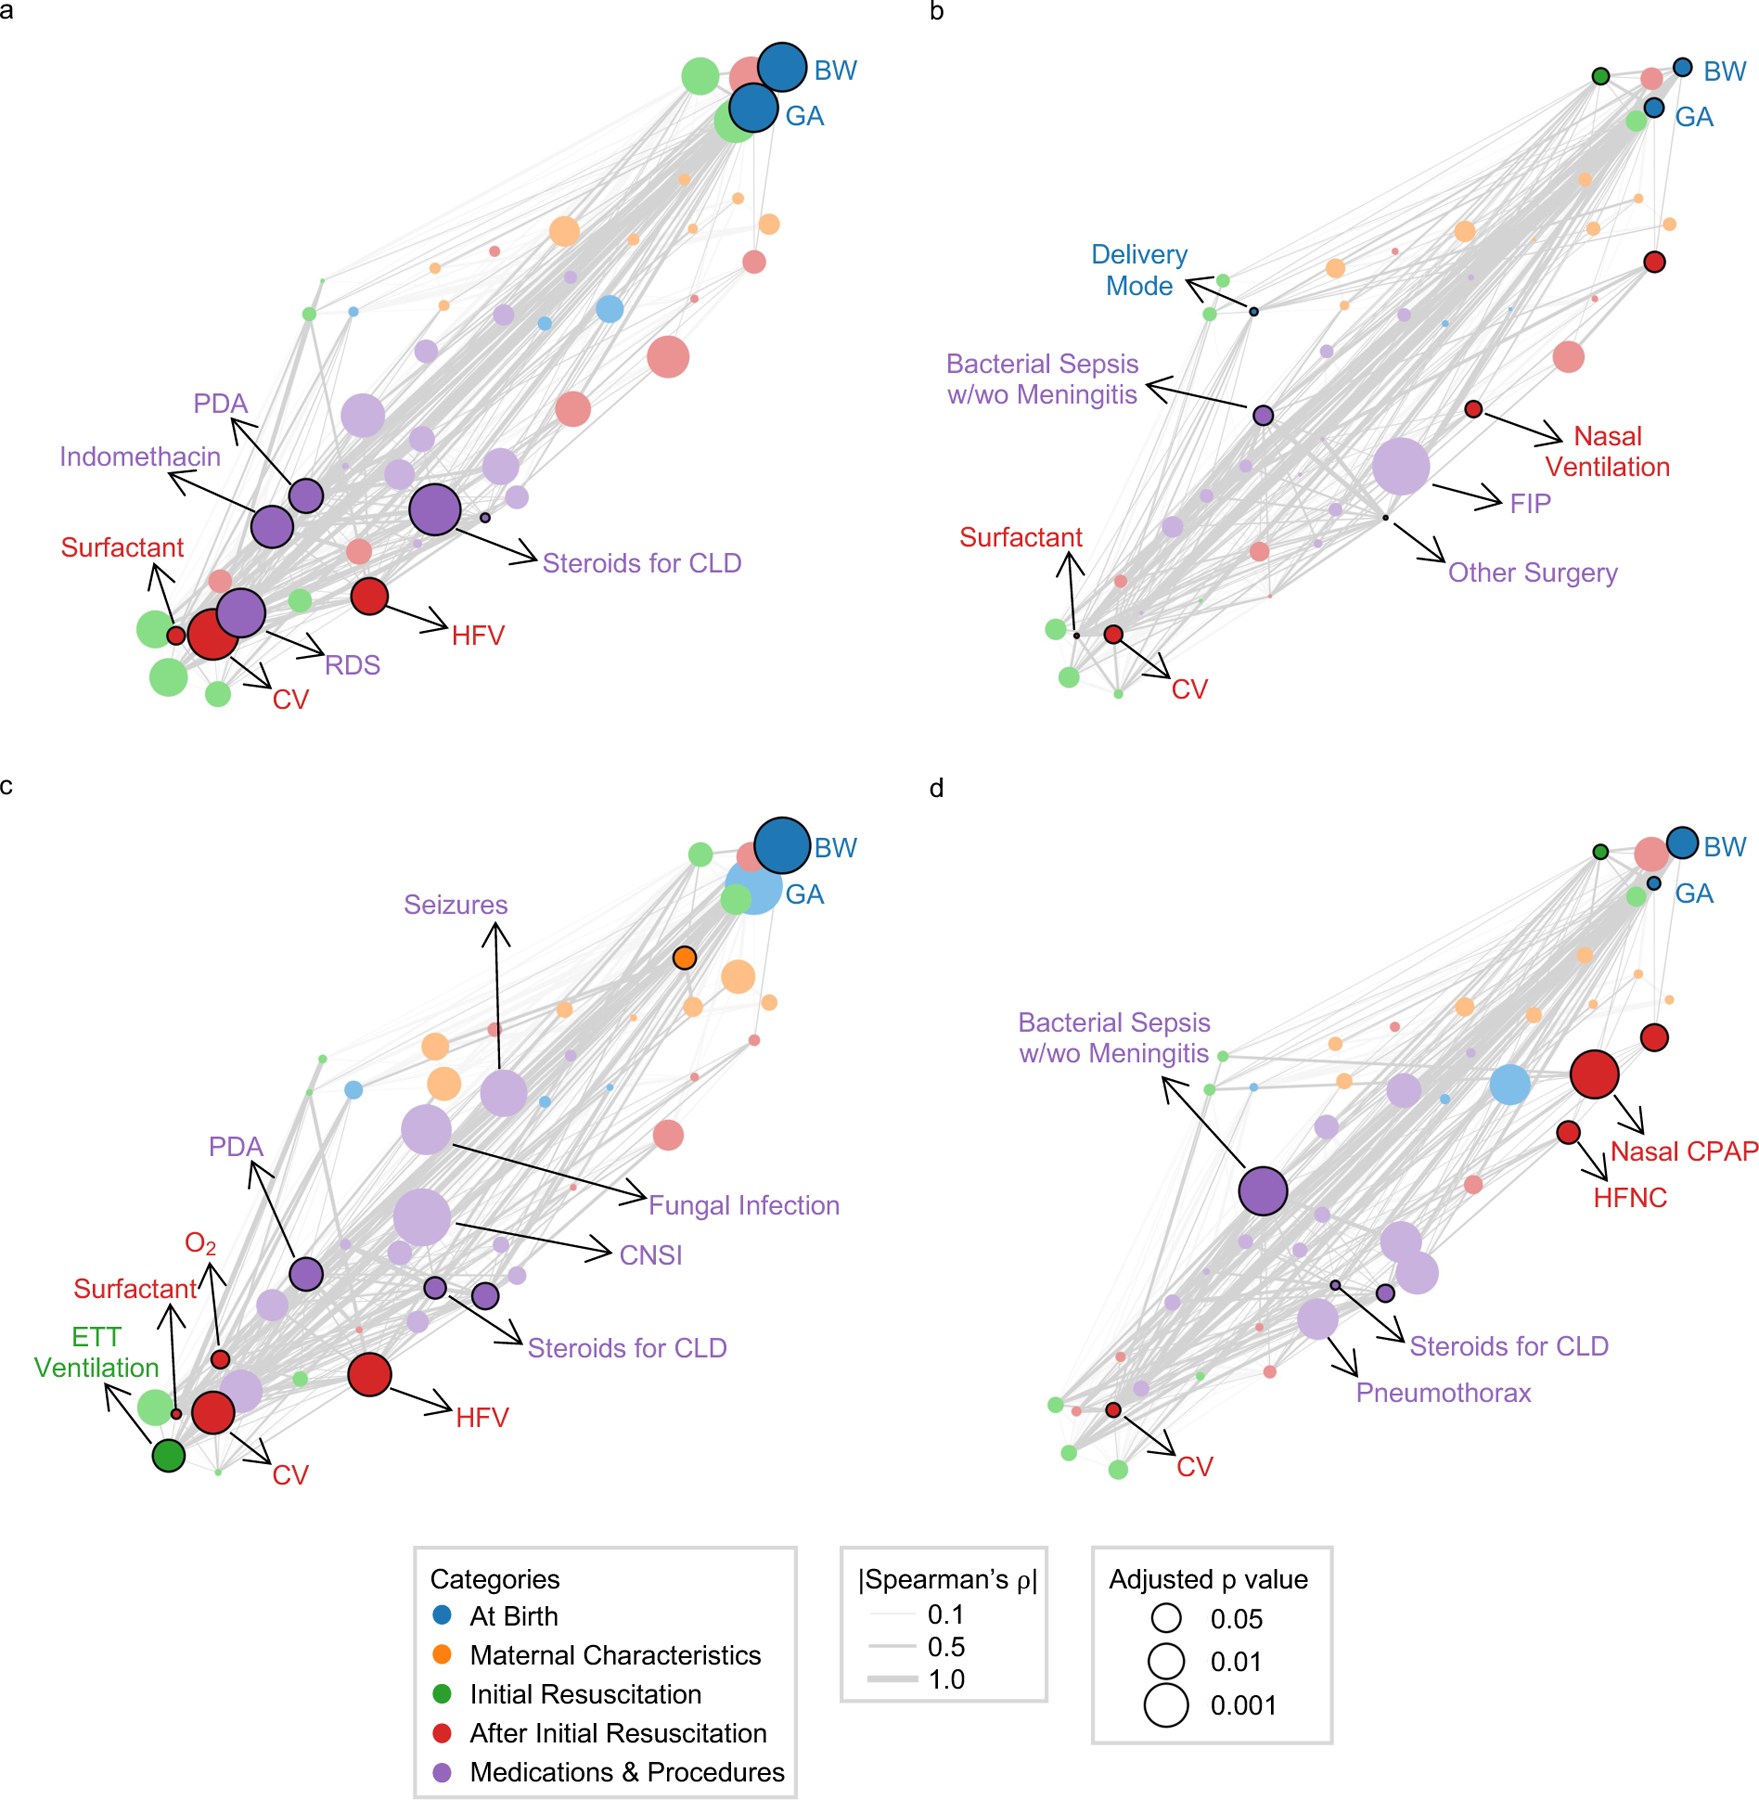
The top 10 significant features derived from SHAP method in the optimal models for (a) Bronchopulmonary Dysplasia (b) Necrotizing Enterocolitis (c) Sepsis with or without meningitis (d) Mortality are highlighted with black edges around the nodes and the darker color using the correlation network layout. The significance of univariate correlations between the features and the corresponding outcomes after Benjamini-Hochberg adjustment for multiple hypothesis correction are represented by node sizes. (Abbreviations used: BW: birth weight; GA: gestational age; PDA: patent ductus arteriosus; RDS: Respiratory distress syndrome; FIP: Focal Intestinal Perforation; CLD: chronic lung disease; CNSI: coagulase negative staphylococcal infection; CV: conventional ventilation; HFV: high frequency ventilation; ETT: endotracheal tube ventilation; HFNC: high flow nasal cannula; CPAP: continuous positive airway pressure)
Figure 4. SHAP swarm plots.

The influence of the top 10 significant features derived from SHAP method in the optimal models for (a) Bronchopulmonary Dysplasia (b) Necrotizing Enterocolitis (c) Sepsis with or without Meningitis (d) Mortality on model outputs, namely the corresponding risk scores are demonstrated here. Features on the left are ranked in descending order of importance. Red color represents higher feature values, while blue color indicates lower feature values. Points to the right of the baseline contribute to a higher disease risk score, while points on the left contribute to a lower disease risk score. (Abbreviations used: NICU: neonatal intensive care units; BW: birth weight; GA: gestational age; PDA: patent ductus arteriosus; RDS: Respiratory distress syndrome; CLD: chronic lung disease; FIP: Focal Intestinal Perforation; CLD: chronic lung disease; CNSI: coagulase negative staphylococcal infection; CV: conventional ventilation; HFV: high frequency ventilation; ETT: endotracheal tube ventilation; HFNC: high flow nasal cannula; CPAP: continuous positive airway pressure)
DISCUSSION
Machine learning holds significant promise for various applications to advance neonatal care in NICU including predictive analytics, risk stratification, imaging interpretation, real-time remote monitoring, stream-lining documentation and billing, and enhancing patient safety.29 In this study, several ML models were developed to assess the feasibility of utilizing predictive analytics for estimating neonatal risks preemptively. The TCH VON database (n=3341) was used to train and validate the ML models, while the CHNC database (n=447) was used to evaluate their generalizability. All VLBW preterm infants with a GA below 37 weeks were included to ensure an unbiased estimation of neonatal outcomes, given the understanding that infants with a GA exceeding 32 weeks demonstrate reduced susceptibility to adverse outcomes. The statistically significant testing results in this study have demonstrated the potential utility of ML techniques in neonatal risk stratification. Future endeavors should focus on integrating predictive modeling into electronic medical systems that would assist clinical decision-making, thereby fostering a transition toward precision medicine in neonatal care. Ultimately, this would improve neonatal outcomes and reduce healthcare costs in NICU.30,31
Additionally, our approach has identified previously unrecognized clinical features that are associated with neonatal risk. In NEC prediction, VLBW preterm infants delivered via cesarean section exhibit lower NEC risks compared to those delivered vaginally. Although this finding lacks previous support, a prior research suggested that cesarean delivery in VLBW preterm infants have higher survival rate, possibly due to decreased birth trauma.32,33 Consequently, cesarean delivery may confer better preservation of the gastrointestinal tract, thereby reducing the risk of NEC occurrence. As for the prediction of sepsis with or without meningitis, VLBW preterm neonates from multiple gestations displayed lower risk scores, which is consistent with a former study observing lower rates of sepsis in multiple gestation VLBW infants.34 Though the exact rationale remains unstudied, it is conceivable that improved prenatal management for the mothers and enhanced postnatal care for these neonates could contribute to decreased risks of sepsis with or without meningitis. While these findings may shed light on new hypothesis generation, future studies should be conducted to validate them by controlling confounding features and establishing causality.
Furthermore, our approach has ascertained previously published risk factors of adverse outcomes in VLBW preterm infants. For instance, BW and GA emerged as two of the significant features across various outcomes. And as a systematic review pointed out, they were the most cited risk factors for neonatal mortality.35 Moreover, in predicting BPD, the presence of PDA and indomethacin administration were associated with an increased risk score, which is consistent with literature suggesting their roles in pulmonary hemodynamic changes and increased inflammation, thus inducing potential lung injury and BPD development.36,37 Lastly, in mortality prediction, the presence of sepsis with or without meningitis, previously recognized as a significant mortality risk factor38,39, could lead to higher mortality risks significantly. In the pursuit of fully integrating ML techniques to support decision-making in NICU, validating these widely studied risk factors in the ML models would not only foster trust among clinicians and patients that may lead to greater clinical adoption, but also ensure transferability and generalization across different settings and patient populations.40
On the other hand, while the usage of various ventilation techniques such as conventional ventilation, nasal ventilation, and high-frequency ventilation are significant features for predicting BPD, NEC, and sepsis with or without meningitis and are positively correlated with the risk scores, it is important to note that this does not imply causation. Studies have indicated that ventilator-induced lung injury may increase the likelihood of BPD development.41 However, it is also plausible that these neonates require breathing support due to severe respiratory underdevelopment, consequently resulting in higher risk scores for adverse outcomes. In predicting mortality, the utilization of nasal continuous positive airway pressure (CPAP) and high-flow nasal cannula following initial resuscitation show a negative correlation with infant risk scores. This may suggest that infants requiring these interventions may have milder respiratory issues, necessitating only noninvasive approaches and potentially reducing chances to develop adverse outcomes.
Remarkably, within our comparative analysis of ML algorithms in the testing result, ensemble models utilizing gradient boosting (XGBoost)19 and bagging (Random Forest)20 techniques yield superior performance across all adverse outcomes, with the exception of sepsis with or without meningitis. These state-of-the-art algorithms could capture both linear and non-linear relationships among the selected clinical features. Additionally, by combining outputs from multiple base models, these ensemble approaches effectively reduce generalization errors in predictions and attenuate the influence of noisy data, thereby enhancing overall robustness in predicting VLBW preterm infant adverse outcomes.
Nonetheless, noticeable disparities were observed between the validation and testing results across all adverse outcomes, suggesting limited generalizability in the models. This discrepancy may result from inconsistent demographic distributions between the TCH VON and CHNC databases. Additionally, the lower prevalence of IVH in the training dataset may hinder the capability of the model to learn patterns from positive cases, thus yielding unsatisfactory results. To reduce errors arising from large variances during validation, ensuring diversity and representativeness in the training data, and employing more sophisticated model architectures or regularization techniques may enhance overall performance. Furthermore, the moderate performance in the testing result may underscore the challenges of predictive tasks based solely on maternal and newborn demographic and clinical features after delivery. Previous research has shown promising results by utilizing longitudinal maternal and neonatal medical history data from prenatal to postnatal periods for neonatal adverse outcome prediction.42 Incorporating a broader range of data sources, including biological (multiomics data from biospecimens) or socioeconomic features, may also strengthen ML approaches in outcome prediction and advancing neonatal care.43
Limitations
Several limitations of this study should be considered. First, both VON and CHNC databases were sourced from a single institution, which can limit the generalizability of the models to broader populations in different settings. Furthermore, the relatively modest sample sizes in both datasets may decrease the robustness of our models and have the potential to introduce bias into our analyses.44 Sepsis and IVH occur before 2 weeks of life and as such the model may not be predictive for LOS before 2 weeks or IVH but may be the result of those morbidities. Moreover, as a retrospective study, we are unable to prospectively validate the performance of our models in predicting neonatal adverse events. However, we intend to address this limitation by testing our models in a prospective cohort. Prospective validation in a real-time clinical setting would be invaluable for assessing the practical utility of the ML models.
Conclusions
ML models were developed to significantly predict each of the five major morbidities, including BPD, NEC, and sepsis with or without meningitis, as well as mortality in VLBW preterm infants. Our study shows the potential of ML techniques in facilitating early prediction of adverse outcomes in VLBW preterm infants, further advancing neonatal care and outcomes in NICU. To implement ML techniques in clinical settings, future studies will focus on prospective validation of the predictive models, external validation in large national or international datasets and bedside implementation of these models.
Supplementary Material
IMPACT STATEMENT.
Reliable prediction of adverse outcomes before they occur has the potential to institute interventions and possibly improve health trajectories in VLBW preterm infants.
We used machine learning to develop and test predictive models for mortality and five major morbidities in VLBW preterm infants.
Individualized prediction of outcomes and individualized interventions will advance Precision Medicine in Neonatology
Funding/Support:
MP is funded by the following extramural source: NIH 1R01HD112886. NA was supported by the NIH (R35GM138353), Burroughs Wellcome Fund (1019816), the March of Dimes, Alfred E. Mann Foundation, and the Bill and Melinda Gates Foundation (INV-037517).
Footnotes
Competing Interests
There are no conflict of interest disclosures, including financial disclosures)
Consent Statement
This study was performed on deidentified retrospective patient data and consent was not required.
REFERENCES
- 1.Quinn J-A et al. Preterm Birth: Case Definition & Guidelines for Data Collection, Analysis, and Presentation of Immunisation Safety Data. Vaccine 34, 6047–6056 (2016). [DOI] [PMC free article] [PubMed] [Google Scholar]
- 2.Preterm Birth: Causes, Consequences, and Prevention (National Academies Press, 2007). [PubMed] [Google Scholar]
- 3.in Centers for Disease Control and Prevention (2023).
- 4.Beam AL et al. Estimates of Healthcare Spending for Preterm and Low-Birthweight Infants in a Commercially Insured Population: 2008–2016. Journal of Perinatology 40, 1091–1099 (2020). [DOI] [PMC free article] [PubMed] [Google Scholar]
- 5.Youssef MRL Clinical Risk Index for Babies (Crib Ii) Scoring System in Prediction of Mortality in Premature Babies. JOURNAL OF CLINICAL AND DIAGNOSTIC RESEARCH (2015). [DOI] [PMC free article] [PubMed] [Google Scholar]
- 6.Richardson DK, Corcoran JD, Escobar GJ & Lee SK Snap-Ii and Snappe-Ii: Simplified Newborn Illness Severity and Mortality Risk Scores. The Journal of Pediatrics 138, 92–100 (2001). [DOI] [PubMed] [Google Scholar]
- 7.Tyson JE, Parikh NA, Langer J, Green C & Higgins RD Intensive Care for Extreme Prematurity — Moving Beyond Gestational Age. New England Journal of Medicine 358, 1672–1681 (2008). [DOI] [PMC free article] [PubMed] [Google Scholar]
- 8.Stoll BJ et al. Trends in Care Practices, Morbidity, and Mortality of Extremely Preterm Neonates, 1993–2012. JAMA 314, 1039 (2015). [DOI] [PMC free article] [PubMed] [Google Scholar]
- 9.Cho H, Lee EH, Lee K-S & Heo JS Machine Learning-Based Risk Factor Analysis of Adverse Birth Outcomes in Very Low Birth Weight Infants. Scientific Reports 12, 12119 (2022). [DOI] [PMC free article] [PubMed] [Google Scholar]
- 10.Cho H, Lee EH, Lee K-S & Heo JS Machine Learning-Based Risk Factor Analysis of Necrotizing Enterocolitis in Very Low Birth Weight Infants. Scientific Reports 12, 21407 (2022). [DOI] [PMC free article] [PubMed] [Google Scholar]
- 11.Han JH et al. Application of Machine Learning Approaches to Predict Postnatal Growth Failure in Very Low Birth Weight Infants. Yonsei Medical Journal 63, 640 (2022). [DOI] [PMC free article] [PubMed] [Google Scholar]
- 12.Kim SH et al. Machine Learning-Based Analysis for Prediction of Surgical Necrotizing Enterocolitis in Very Low Birth Weight Infants Using Perinatal Factors: A Nationwide Cohort Study. European Journal of Pediatrics (2024). [DOI] [PMC free article] [PubMed] [Google Scholar]
- 13.Lin W-T et al. Predicting in-Hospital Length of Stay for Very-Low-Birth-Weight Preterm Infants Using Machine Learning Techniques. Journal of the Formosan Medical Association 121, 1141–1148 (2022). [DOI] [PubMed] [Google Scholar]
- 14.Mann HB & Whitney DR On a Test of Whether One of Two Random Variables Is Stochastically Larger Than the Other. The Annals of Mathematical Statistics 18, 50–60 (1947). [Google Scholar]
- 15.Pearson KX on the Criterion That a Given System of Deviations from the Probable in the Case of a Correlated System of Variables Is Such That It Can Be Reasonably Supposed to Have Arisen from Random Sampling. The London, Edinburgh, and Dublin Philosophical Magazine and Journal of Science 50, 157–175 (1900). [Google Scholar]
- 16.Becker M et al. Large-Scale Correlation Network Construction for Unraveling the Coordination of Complex Biological Systems. Nature Computational Science 3, 346–359 (2023). [DOI] [PMC free article] [PubMed] [Google Scholar]
- 17.McInnes L, Healy J, Saul N & Großberger L Umap: Uniform Manifold Approximation and Projection. Journal of Open Source Software 3, 861 (2018). [Google Scholar]
- 18.Stekhoven DJ & Bühlmann P Missforest—Non-Parametric Missing Value Imputation for Mixed-Type Data. Bioinformatics 28, 112–118 (2012). [DOI] [PubMed] [Google Scholar]
- 19.Chen T & Guestrin C in KDD ‘16: The 22nd ACM SIGKDD International Conference on Knowledge Discovery and Data Mining. 785–794 (ACM; ). [Google Scholar]
- 20.Breiman L Random Forests. Machine Learning 45, 5–32 (2001). [Google Scholar]
- 21.Cox DR The Regression Analysis of Binary Sequences. Journal of the Royal Statistical Society: Series B (Methodological) 20, 215–232 (1958). [Google Scholar]
- 22.Tibshirani R Regression Shrinkage and Selection Via the Lasso. Journal of the Royal Statistical Society: Series B (Methodological) 58, 267–288 (1996). [Google Scholar]
- 23.Hoerl AE & Kennard RW Ridge Regression: Biased Estimation for Nonorthogonal Problems. Technometrics 12, 55–67 (1970). [Google Scholar]
- 24.Cortes C & Vapnik V Support-Vector Networks. Machine Learning 20, 273–297 (1995). [Google Scholar]
- 25.Cover T & Hart P Nearest Neighbor Pattern Classification. IEEE Transactions on Information Theory 13, 21–27 (1967). [Google Scholar]
- 26.Stone M Cross-Validatory Choice and Assessment of Statistical Predictions. Journal of the Royal Statistical Society: Series B (Methodological) 36, 111–133 (1974). [Google Scholar]
- 27.Tabachnick BG & Fidell LS in International Encyclopedia of Statistical Science (Lovric M ed.) 902–904 (Springer; Berlin Heidelberg, 2011). [Google Scholar]
- 28.Lundberg S & Lee S-I A Unified Approach to Interpreting Model Predictions. (2017).
- 29.Beam K, Sharma P, Levy P & Beam AL Artificial Intelligence in the Neonatal Intensive Care Unit: The Time Is Now. Journal of Perinatology 44, 131–135 (2024). [DOI] [PubMed] [Google Scholar]
- 30.Dzau VJ & Ginsburg GS Realizing the Full Potential of Precision Medicine in Health and Health Care. JAMA 316, 1659 (2016). [DOI] [PubMed] [Google Scholar]
- 31.Dzau VJ, Ginsburg GS, Van Nuys K, Agus D & Goldman D Aligning Incentives to Fulfil the Promise of Personalised Medicine. The Lancet 385, 2118–2119 (2015). [DOI] [PMC free article] [PubMed] [Google Scholar]
- 32.Lee HC & Gould JB Survival Advantage Associated with Cesarean Delivery in Very Low Birth Weight Vertex Neonates. Obstetrics & Gynecology 107, 97–105 (2006). [DOI] [PubMed] [Google Scholar]
- 33.AlQurashi MA Impact of Mode of Delivery on the Survival Rate of Very Low Birth Weight Infants: A Single-Center Experience. Cureus (2020). [DOI] [PMC free article] [PubMed] [Google Scholar]
- 34.Jang HG et al. Comparison of Neonatal Outcomes between Multiples and Singletons among Very Low Birth Weight Infants: The Korean Neonatal Network Cohort Study. The Journal of Maternal-Fetal & Neonatal Medicine 36, 2245530 (2023). [DOI] [PubMed] [Google Scholar]
- 35.Kermani F, Sheikhtaheri A, Zarkesh MR & Tahmasebian S Risk Factors for Neonatal Mortality in Neonatal Intensive Care Units (Nicus): A Systematic Literature Review and Comparison with Scoring Systems. Journal of Pediatric and Neonatal Individualized Medicine 9, e090226 (2020). [Google Scholar]
- 36.Hamrick SEG et al. Patent Ductus Arteriosus of the Preterm Infant. Pediatrics 146, e20201209 (2020). [DOI] [PMC free article] [PubMed] [Google Scholar]
- 37.Parkerson S, Philip R, Talati A & Sathanandam S Management of Patent Ductus Arteriosus in Premature Infants in 2020. Frontiers in Pediatrics 8, 590578 (2021). [DOI] [PMC free article] [PubMed] [Google Scholar]
- 38.Miselli F et al. Late-Onset Sepsis Mortality among Preterm Infants: Beyond Time to First Antibiotics. Microorganisms 11, 396 (2023). [DOI] [PMC free article] [PubMed] [Google Scholar]
- 39.Goh GL et al. Risk Factors for Mortality from Late-Onset Sepsis among Preterm Very-Low-Birthweight Infants: A Single-Center Cohort Study from Singapore. Frontiers in Pediatrics 9, 801955 (2022). [DOI] [PMC free article] [PubMed] [Google Scholar]
- 40.Keles E & Bagci U The Past, Current, and Future of Neonatal Intensive Care Units with Artificial Intelligence: A Systematic Review. npj Digital Medicine 6, 220 (2023). [DOI] [PMC free article] [PubMed] [Google Scholar]
- 41.Jobe AH & Ikegami M Lung Development and Function in Preterm Infants in the Surfactant Treatment Era. Annual Review of Physiology 62, 825–846 (2000). [DOI] [PubMed] [Google Scholar]
- 42.De Francesco D et al. Data-Driven Longitudinal Characterization of Neonatal Health and Morbidity. Science Translational Medicine 15, eadc9854 (2023). [DOI] [PMC free article] [PubMed] [Google Scholar]
- 43.Crilly CJ, Haneuse S & Litt JS Predicting the Outcomes of Preterm Neonates Beyond the Neonatal Intensive Care Unit: What Are We Missing? Pediatric Research 89, 426–445 (2021). [DOI] [PMC free article] [PubMed] [Google Scholar]
- 44.Rajput D, Wang W-J & Chen C-C Evaluation of a Decided Sample Size in Machine Learning Applications. BMC Bioinformatics 24, 48 (2023). [DOI] [PMC free article] [PubMed] [Google Scholar]
Associated Data
This section collects any data citations, data availability statements, or supplementary materials included in this article.