

Abstract
Aims
About 10%–30% of individuals with obesity are metabolically healthy, but the specific characteristics of the metabolically healthy obesity (MHO) phenotype remain unclear. We aimed to examine how physical activity, education, depressive symptoms and genetic predisposition to obesity differ between individuals with MHO and those with metabolically unhealthy obesity (MUO), and whether these factors predict stability in MHO or conversion to a metabolically unhealthy state.
Materials and Methods
We retrieved data on 9809 individuals with obesity from the Health and Retirement Study collected between 2006 and 2016. We compared how physical activity, education, depressive symptoms and a polygenic score for higher body mass index (BMI) (PGSBMI) differed cross‐sectionally between MHO and MUO using logistic regression. We then examined if the same factors predict conversion to a metabolically unhealthy state over 4 years in individuals with MHO.
Results
Individuals with MHO had higher physical activity (odds ratio [OR] = 0.81), higher education (OR = 0.83) and lower depressive symptoms (OR = 1.14) compared to those with MUO but did not differ in the PGSBMI. The associations were slightly attenuated in mutually adjusted models. None of the factors were associated with conversion from MHO to a metabolically unhealthy state. However, a higher PGSBMI indicated 24% lower risk of conversion to a metabolically unhealthy state (p = 0.07).
Conclusions
Physical activity, education and depressive symptoms differed between MHO and MUO, even when mutually adjusted for, but did not predict conversion from a metabolically healthy to unhealthy state. Although not statistically significant, the results indicated that those with genetically predicted high BMI are more likely to maintain MHO and not convert to a metabolically unhealthy state.
Keywords: body mass index, metabolically healthy obesity, obesity, population study
1. INTRODUCTION
Obesity, defined as a body mass index (BMI) ≥30, frequently accompanies other metabolic health issues, including elevated blood pressure, increased glucose levels and abnormal lipid profiles. 1 Nevertheless, a high BMI does not consistently coincide with poor metabolic health. In reality, approximately 10%–30% of individuals with obesity exhibit no indications of metabolic dysfunction. 2 Obesity characterized by the absence of metabolic health issues is referred to as metabolically healthy obesity (MHO) and is linked to substantially lower risk of negative health consequences compared to metabolically unhealthy obesity (MUO), although usually higher compared to metabolically healthy normal weight. 2 , 3 , 4 Most studies define MHO as a BMI ≥30 in the absence of the metabolic syndrome (MetS, healthy untreated lipid levels, blood sugar and blood pressure), but it should be noted that there is no universally accepted definition of MHO. 2 , 4 Differences in the definition of MHO may impact research findings and our understanding of the phenotype. In fact, a recent study that used an empiric data‐driven approach to define MHO indicated no difference in risk of cardiovascular mortality or all‐cause mortality between individuals with MHO and metabolically healthy normal weight, despite categorizing as much as 40% of individuals with obesity as MHO. 4 , 5
Limited knowledge exists regarding what enables a large proportion of individuals living with obesity to maintain metabolic health, highlighting the complex and multifaceted nature of obesity. 2 It is well established that a variety of factors, including lifestyle, psychosocial and genetic factors, affect our BMI, metabolic health and risk of adverse health outcomes, 6 , 7 , 8 , 9 , 10 , 11 but less is known regarding how such factors differ between those with metabolically healthy and unhealthy obesity. The most extensively researched area is the role of physical fitness; specifically, a systematic review and meta‐analysis found that individuals with MHO exhibit higher physical activity and better cardiorespiratory fitness compared to those with MUO. 12 Additionally, MHO is a transient phenotype where a majority will eventually convert to a metabolically unhealthy state. 2 , 4 The largest study to date included 90 257 women from the Nurses' Health Study and showed that 84% of those with MHO at baseline converted to a metabolically unhealthy state. 13 However, it remains unclear what factors predict conversions or the maintenance of stable metabolic health in obesity. 2
To increase our understanding of factors influencing metabolic health in obesity, we used longitudinal data from the Health and Retirement Study (HRS) to investigate whether physical activity, education, depressive symptoms and genetic predisposition to a higher BMI differ between MHO and MUO, and whether these factors are associated with stability in metabolic health or conversion to a metabolically unhealthy state in individuals with MHO. To understand if the associations are specific to metabolic health in obesity, we investigated the same associations in individuals with normal weight and overweight. Therefore, we aimed to contribute to the understanding of the MHO phenotype and what factors may influence maintained metabolic health in obesity.
2. MATERIALS AND METHODS
2.1. Study population
The study population originates from the longitudinal HRS 14 that includes individuals ≥50 years together with their spouse of any age, with more than 40 000 individuals. The HRS is based on a comprehensive interview‐based design, with biennial follow‐up since 1992 (currently 15 waves) and additional participants recruited every 6 years to account for attrition. Since wave 8 in 2006, it involves a structured alternation between face‐to‐face and telephone interviews. For each wave, half of the sample is interviewed face to face, whereas the other half is interviewed over telephone. This alternates at each subsequent wave so that the face‐to‐face interview data are systematically collected at 4‐year intervals. 14 Each interview session includes the collection of extensive self‐reported data, and the face‐to‐face interviews additionally include physical assessments and collection of blood samples. The current study includes information from all face‐to‐face interviews from waves 8 to 13, available for 22 377 individuals with 42 839 measurement occasions. Saliva samples for genotyping were collected in waves 8–11, from which polygenic scores for BMI (PGSBMI) and other phenotypic characteristics were computed and are available for 15 190 individuals.
2.2. Ethics
All HRS participants provided informed consent, and the data collection was approved by the Institutional Review Board at the University of Michigan. The current study was approved by the Swedish Ethical Review Authority (2022‐06634‐01).
2.3. BMI measurement
Height and weight were measured as part of the face‐to‐face interviews. To remove the data for outliers we used the procedure as described in Karlsson et al. 15 Briefly, the mean and standard deviation (SD) in height were calculated for each individual based on their height measures, and values >0.05 SD from the individual mean were set to missing to remove outliers. If only two measurements were available, both were set to missing. In addition, individuals whose height was <1.47 or >2.10 m were excluded. In total, this led to excluding 1229 individuals. The mean of individual height measures was then used to calculate BMI as kg/m2 and categorized into normal weight (BMI: 18.5–24.9), overweight (BMI: 25–29.9) and obesity (BMI: ≥30). Individuals with a BMI <18.5 were excluded due to a low number (n = 136).
2.4. Assessment of metabolic health
Biomarkers were measured from dried blood spot samples, collected in connection with the face‐to‐face interview, and converted to National Health and Nutrition Examination Survey equivalents. 16 We used measures of high‐density lipoprotein (HDL) cholesterol and glycosylated haemoglobin (HbA1c), an indicator of glycaemic control over the past 2–3 months. HDL was collected from blood lipid levels (measured in mg/dL) and HbA1c from whole blood (presented in %). Systolic blood pressure and diastolic blood pressure were also measured during each face‐to‐face data collection. Self‐reported information on diabetes or hypertension diagnosis was included to complement the biomarker data.
Metabolic health was defined based on the The National Cholesterol Education Program Adult Treatment Panel III (NCEP ATP III) criteria for MetS, 17 , 18 modified to the current study (triglyceride measures are included in the criteria but not available in the HRS). Participants were defined as metabolically healthy if they fulfilled none and as metabolically unhealthy if they fulfilled more than one of the following criteria: (1) hyperglycaemia: HbA1c: >5.7% or doctor‐diagnosed type 2 diabetes; (2) elevated blood pressure: systolic ≥130 or diastolic ≥85 mm Hg, or doctor‐diagnosed hypertension; and (3) reduced HDL: <40 mg/dL for men or <50 mg/dL for women. Those with one metabolic complication criterion were excluded from the main analyses based on our modified metabolic health criterion due to lack of data on triglycerides but included as metabolically healthy or unhealthy in two sets of sensitivity analyses.
2.5. Exposure variables and covariates
The exposure variables were physical activity, education, depressive symptoms and PGSBMI. Physical activity was measured as light, moderate and vigorous, all divided into five categories: ‘never’, ‘1–3 times per month’, ‘1 per week’, ‘>1 per week’ and ‘everyday’. 19 Light physical activity meant mildly energetic activities such as walking or housework or other. Moderate physical activity meant activities like dancing or gardening, and vigorous physical activity referred to activities like jogging, swimming, gym workout or other. Education was divided into five different categories: ‘less than high school’, ‘General Education Development (GED)’, ‘high school graduate’, ‘some college’ and ‘college and above’ (bachelor's degree and above). Physical activity and education were treated as continuous measures ranging from one to five. Depressive symptoms were measured using the Center for Epidemiologic Studies Depression (CES‐D) scale, a revised summary score of the respondents' feelings the week prior to the interview, including the sum of six ‘negative’ indicators plus the inverse of two ‘positive’ indicators. 20 The six negative indicators were ‘felt depressed’, ‘everything is an effort’, ‘sleep is restless’, ‘felt alone’, ‘felt sad’ and ‘could not get going’. The positive indicators ask whether the respondent ‘felt happy’ and ‘enjoyed life’ and the inverse of the response used in the score. 19 The resulting score was used as a continuous measure ranging from zero to eight. As a measure of genetically predicted BMI, we used a PGSBMI from the SSGAC PGI Repository, 21 based on a genome‐wide associations study for BMI which identified 941 genetic variants associated with BMI in almost 700 000 individuals. 22 The significant genetic variants explained 6% together, whereas a PGS explained 14% of the trait variation. 22 The PGSBMI was standardized to a mean of zero and an SD of one prior to analyses. Additionally, five principal components were included together with the PGSBMI in analyses to account for genetic ancestry. It should be noted that the PGS from the PGI Repository was available only for HRS participants of European ancestry, with a total N of 11 996 individuals. 21
All analyses included smoking, age at measurement, ethnicity and sex as covariates. Smoking was measured as a binary variable (yes/no) and contained information on smoking status during the time of the interview. Ethnicity was reported in three categories: Caucasian, African American or other.
2.6. Statistical analyses
All analyses were conducted in R, version 4.3.1. 23 Descriptive statistics at baseline were calculated to characterize the study population with a BMI ≥30, as well as stratified by metabolic health status, and present the total number of individuals and percentage of the total for categorical variables or mean and SD for continuous variables.
We implemented multiple imputation by chained equations, 24 with a detailed description provided in the Supplementary Material. All available measurements were included for each individual, and the correlation of repeated measurements within the same individual was accounted for with a clustered sandwich estimator of variance. 25 Logistic regression models were used to analyse the 10 imputed datasets, adjusting for sex, age at measurement, ethnicity and smoking. We first analysed cross‐sectional associations between metabolic health and the exposure variables, by regressing each measurement of metabolic health on the concomitant exposure measurement. Second, we analysed the association between the exposure variables and conversion from MHO to a metabolically unhealthy state by selecting all MHO measurements and regressing their concomitant exposure measurements on metabolic health at the following measurement. In both the first and second analyses, we first fitted separate models with one exposure variable at a time and then mutually adjusted models with all exposure variables included. Because the PGSBMI is available only for individuals of European ancestry, we did not adjust for ethnicity in the mutually adjusted models.
To test if associations were specific to metabolic health in obesity, we repeated all analyses in subsamples with overweight and normal weight. To explore the robustness of the metabolic health measure, we conducted two sets of sensitivity analyses, including those with one metabolic complication criterion as (1) healthy and (2) unhealthy. Because the PGSBMI is based on individuals of European ancestry, the separate and mutually adjusted models had different sample sizes; therefore, we conducted sensitivity analyses of (1) the separate models restricted to the same sample as in the mutually adjusted models and (2) mutually adjusted models of the full sample, excluding the PGSBMI. To investigate whether age contributes to the estimated associations, we performed interaction analyses in both cross‐sectional analysis and models assessing the conversion to a metabolically unhealthy state.
3. RESULTS
3.1. Population characteristics
After individuals who were <40 years (n = 77) at baseline (baseline age ranged from 40 to 104 years), where height was missing or <1.47 or >2.10 m (n = 1229) or weight <30 kg (n = 528), were excluded, 20 407 individuals remained, of whom 9077 (44.47%) were individuals with obesity, 7116 (34.86%) were individuals with overweight, and 4214 (20.66%) were individuals with normal weight. After individuals fulfilling one criterion for metabolic dysfunction were excluded, 589 individuals were categorized as MHO and 4948 as MUO at baseline. In the normal weight group, 1573 individuals were metabolically healthy and 2615 were metabolically unhealthy at baseline; in the overweight group, 1669 were metabolically healthy and 5934 were metabolically unhealthy at baseline. For analyses including the PGSBMI, data were available for 10 994 individuals, of whom 4910 had a BMI ≥30. Baseline characteristics of the study population prior to imputation are provided in Table 1. The study population, including all observations, is presented in Table S1, and baseline characteristics, including the normal weight and overweight categories, are provided in Table S2.
TABLE 1.
Baseline characteristics of the study population with BMI ≥30.
| Variables | All (N = 9077) | MHO (N = 589) | MUO (N = 4948) |
|---|---|---|---|
| Females, N (%) | 5349 (58.93) | 354 (60.10) | 3014 (60.91) |
| Age, M (SD) | 63.16 (9.79) | 58.95 (8.66) | 63.86 (9.69) |
| Ethnicity: Caucasian, N (%) | 6220 (68.74) | 475 (80.78) | 3173 (64.35) |
| Ethnicity: African American, N (%) | 2041 (22.56) | 66 (11.22) | 1303 (26.42) |
| Ethnicity: Other, N (%) | 787 (8.70) | 47 (7.99) | 455 (9.23) |
| BMI, M (SD) | 35.32 (4.58) | 33.88 (3.43) | 35.86 (4.79) |
| Current smoker, N (%) | 1220 (13.52) | 64 (10.88) | 721 (14.65) |
| CES‐D scale, M (SD) | 1.68 (2.11) | 1.26 (8.66) | 1.81 (9.69) |
| Light physical activity, M (SD) | 3.45 (1.07) | 3.67 (0.97) | 3.39 (1.10) |
| Moderate physical activity, M (SD) | 3.00 (1.30) | 3.32 (1.16) | 2.90 (1.32) |
| Vigorous physical activity, M (SD) | 1.92 (1.27) | 2.29 (1.38) | 1.82 (1.22) |
| Education, M (SD) | 3.18 (1.36) | 3.51 (1.30) | 3.05 (1.37) |
| PGSBMI, M (SD) | 0.33 (0.94) | 0.33 (0.96) | 0.37 (0.95) |
| HbA1c, M (SD) | 6.10 (1.20) | 5.31 (0.27) | 6.44 (1.28) |
| HDL, M (SD) | 52.08 (15.13) | 61.28 (13.46) | 48.19 (14.12) |
| Total cholesterol, M (SD) | 198.94 (42.57) | 214.08 (39.94) | 195.37 (42.33) |
| Doctor‐diagnosed diabetes, N (%) | 2608 (28.73) | 0 (0.00) | 2118 (42.81) |
| Doctor‐diagnosed hypertension, N (%) | 5769 (63.56) | 0 (0.00) | 3855 (77.91) |
| Systolic blood pressure, M (SD) | 131.41 (20.19) | 115.53 (9.16) | 133.92 (20.15) |
| Diastolic blood pressure, M (SD) | 81.79 (11.84) | 75.09 (6.31) | 82.58 (12.09) |
Notes: Baseline characteristics prior to imputation for all individuals with a BMI ≥30 and stratified into individuals with metabolically healthy and unhealthy obesity. Metabolically healthy obesity includes those that fulfilled none and metabolically unhealthy obesity if they fulfilled more than one of the criteria for metabolic complications, excluding those with one criterion. Statistics are presented as number (%) of individuals for categorical variables and mean level (SD) for continuous variables.
Abbreviations: BMI, body mass index; CES‐D, Center for Epidemiologic Studies Depression; HbA1C, glycosylated haemoglobin; HDL, high‐density lipoprotein; M, mean; MHO, metabolically healthy obesity; MUO, metabolically unhealthy obesity; N, number, PGS, polygenic score; SD, standard deviation.
3.2. Associations with metabolic health in individuals with BMI ≥30
In the separate models, every unit higher light physical activity, moderate physical activity, vigorous physical activity and attained education were associated with 16%, 19%, 18% and 17% lower odds of being MUO, respectively, whereas every unit higher CES‐D scale was associated with 14% higher odds of being MUO (Figure 1; Table S3). For the PGSBMI, the estimate was in the positive direction but of small magnitude (8% higher odds of MUO) and not statistically significant (Figure 1; Table S3). In the mutually adjusted model, the results were attenuated compared to the separate models, but the associations remained statistically significant except for light physical activity, which had an effect estimate close to one (Figure 1; Table S3).
FIGURE 1.
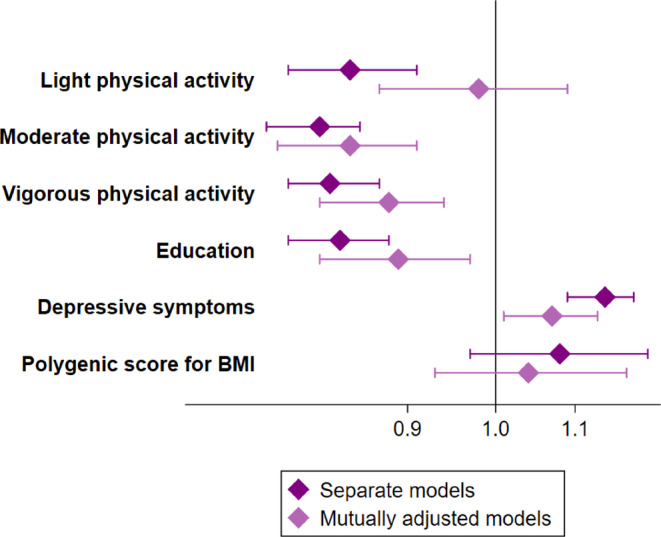
Cross‐sectional associations with metabolically unhealthy obesity. Odds ratios and 95% confidence intervals of MUO (metabolically unhealthy obesity) compared to MHO (metabolically healthy obesity) from cross‐sectional associations. All models were adjusted for age, sex, ethnicity and smoking. Separate models of physical activity, education and CES‐D (Center for Epidemiologic Studies Depression) scale in association with MUO included N = 7943 unique individuals with N = 12 014 observations in each model. The separate model of PGSBMI (polygenic score for higher body mass index) and the mutually adjusted models included N = 4910 unique individuals and N = 9089 observations. BMI, body mass index.
In individuals with normal weight and overweight, the results were similar to those with obesity. Small differences included a smaller estimate for the CES‐D scale (odds ratio [OR] = 1.09, CI = 1.05–1.14 for metabolically unhealthy normal weight; OR = 1.11, CI = 1.07–1.15 for metabolically unhealthy overweight) and larger estimates for education (OR = 0.75, CI = 0.71–0.80 for metabolically unhealthy normal weight; OR = 0.77, CI = 0.73–0.81 for metabolically unhealthy overweight) and the PGSBMI (OR = 1.09, CI = 1.00–1.19 for metabolically unhealthy overweight), as presented in Tables S4 and S5.
3.3. Associations of conversion from MHO to a metabolically unhealthy state
None of the exposure variables were associated with conversion from MHO to a metabolically unhealthy state at the α = 0.05 level, and the estimates were close to zero for physical activity, education and the CES‐D scale. For the PGSBMI the estimate was larger, but not statistically significant, and indicated that each SD higher PGSBMI was associated with 23% and 24% lower odds of conversion from MHO to a metabolically unhealthy state in the separate and mutually adjusted model (Figure 2; Table S6). Results from the groups with normal weight and overweight indicated no association between the PGSBMI and conversion to a metabolically unhealthy state (OR = 1.04 and 0.89, respectively; Tables S7 and S8). In contrast, higher education was associated with 24% lower odds of conversion in people with overweight, and associations with physical activity were not statistically significant but indicated lower odds of conversion from a metabolically healthy to unhealthy state in both groups.
FIGURE 2.
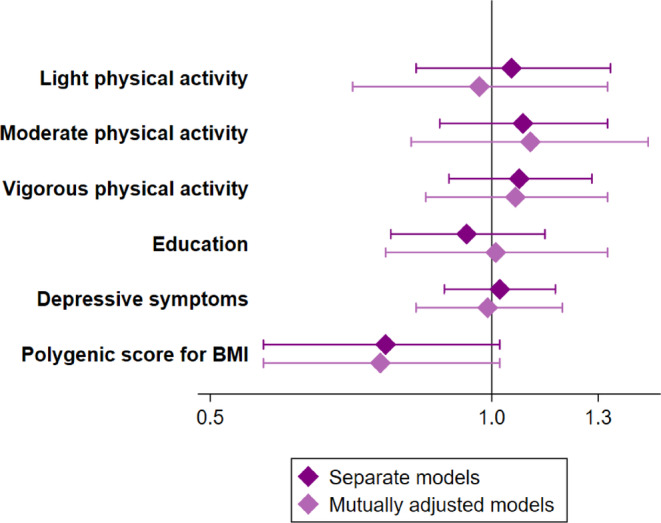
Associations of conversion from metabolically healthy obesity to a metabolically unhealthy state. Odds ratios and 95% confidence intervals of conversion from MHO (metabolically healthy obesity) to a metabolically unhealthy state. All models are adjusted for age, sex, ethnicity and smoking. A separate model of physical activity, education and CES‐D (Center for Epidemiologic Studies Depression) scale as predictors of a metabolically unhealthy state included N = 536 unique individuals. The separate model of PGSBMI (polygenic score for higher body mass index) as predictors of a metabolically unhealthy state and the mutually adjusted models included N = 380 unique individuals. BMI, body mass index.
3.4. Sensitivity analyses
The results from the sensitivity analyses, where those fulfilling one of the criteria for metabolic dysfunction were included as either metabolically healthy or unhealthy, were generally slightly attenuated but consistent with the results from the main analyses. The larger sample size increased statistical power, and the association between the PGSBMI and conversion from MHO to a metabolically unhealthy state was statistically significant when metabolic health allowed for one criterion (OR = 0.80, 95% CI = 0.65–0.99). Results from the cross‐sectional analyses are presented in Tables S9 and S10, and results from models of conversion from MHO to a metabolically unhealthy state are presented in Tables S11 and S12. The results from the sensitivity analyses that used the same sample as those in either the separate models or the mutually adjusted models are presented in Tables S13 and S14. The results were generally the same as in the main analyses, except the CES‐D scale that had a higher OR = 3.42 (95% CI = 2.70–4.32) when the mutually adjusted model included the same sample as the separate model and excluded the PGSBMI. The results from the sensitivity analyses that adjusted for waist circumference are presented in Tables S15 and S16 and were similar to the main analyses but slightly attenuated in the cross‐sectional model. Sensitivity analyses of interactions between age and exposure variables showed no statistically significant interactions (Tables S17 and S18).
4. DISCUSSION
In our initial cross‐sectional analyses, individuals with MHO were more physically active, had higher education and lower depressive symptoms compared to individuals with MUO, but did not differ in the PGSBMI. In contrast, physical activity, education or depressive symptoms were not associated with conversion to a metabolically unhealthy state in people with MHO. Although the association between PGSBMI and conversion did not reach statistical significance at the α = 0.05 level, our results suggest that MHO may be easier to maintain in people with genetic predisposition to a higher BMI. This finding was further supported by the sensitivity analyses where the association reached statistical significance and was robust to adjustment for physical activity, education and depressive symptoms.
Some previous studies have explored the differences between MHO and MUO. Ortega and colleagues conducted a systematic review and meta‐analysis, revealing that individuals with MHO exhibit higher physical activity, reduced sedentary behaviour and better cardiorespiratory fitness compared to those with MUO. 12 Another systematic review highlighted that individuals with MHO tend to adopt healthier dietary patterns compared to their MUO counterparts. 26 Our findings of differences between MHO and MUO align with previous work and demonstrate that associations remain robust in the mutually adjusted models. However, physical activity, education and depressive symptoms are also related to health and well‐being, 27 , 28 , 29 making it difficult to disentangle these factors one by one as they are interrelated. 30 , 31 Indeed, the differences in physical activity, education and depressive symptoms between the MHO and MUO groups were similar between those being metabolically healthy and unhealthy in the normal weight and overweight groups, which indicates that these factors are associated with metabolic health regardless of BMI category.
MHO is considered to be a transient state, 2 , 32 , 33 although it should be noted that conversions to a metabolically unhealthy state are also common among those with a normal weight. 4 , 13 Existing research on factors associated with conversion from MHO to MUO has primarily focused on biomarkers and shown that higher low‐density lipoprotein cholesterol 34 and abnormal levels of alanine aminotransferase, aspartate aminotransferase and uric acid 35 are associated with an increased risk of transitioning to MUO. Less is known about influences from environmental and lifestyle factors, and we did not find associations between physical activity, education or depressive symptoms with conversions from MHO to a metabolically unhealthy state. In contrast, in the cross‐sectional analyses, the PGSBMI did not differ between the MHO and MUO groups but was associated with conversion from MHO to a metabolically unhealthy state. This association was seen only among people with obesity and not among those with a lower BMI.
Previous research has demonstrated that a PGSBMI influences the association between obesity and risk of disease, based on data from the HRS and the Swedish Twin Registry. 15 , 36 , 37 , 38 Individuals with obesity and a high PGSBMI have a lower risk of dementia, mortality and CVD, and less decline in cognitive abilities, compared to those with obesity and a low PGSBMI, indicating that obesity may be less detrimental in individuals with genetic predisposition to a higher BMI. In line with these findings, those with a high PGSBMI were more likely to maintain MHO and not convert to a metabolically unhealthy state. It is not clear what may explain these differences, but as individuals with MHO and MUO had similar genetically predicted BMI (PGSBMI levels) in cross‐sectional analyses, the differences in disease risk in people with obesity and a high versus low PGSBMI seen in previous work are likely not explained by differences in metabolic health. Davidson et al. 37 highlight the complexity of interrelationships between genetics, behaviour and health outcomes in older adults, emphasizing the need to focus on both biological and environmental factors in understanding obesity and health. In particular, in the gene–environment interplay, where genetic variants interact with environmental cues, for example, certain genetic markers associated with appetite regulation might respond differently based on dietary patterns.
It should be noted that there are no universal criteria to identify MHO, but metabolic health is often defined as the absence of MetS 39 based on the NCEP ATP III criteria 17 , 18 : maximum one of the metabolic complications dyslipidaemia, hypertension, hyperglycaemia and hypertriglyceridaemia. However, it has been suggested that metabolic health in obesity is better defined as the absence of the MetS criteria. 40 The current material did not contain data on triglycerides, and we therefore used a modified version of the NCEP ATP III criteria; additionally, we exercised caution by excluding individuals with one metabolic complication. We also conducted sensitivity analyses using alternative definitions of metabolic health, which yielded similar results as the main analyses. We could thereby strengthen the findings by comparing the robustness of different definitions of metabolic health. However, newer definitions of metabolic health may better identify differences in the risk of adverse health between MHO and MUO. Indeed, using a data‐driven approach, Zembic and colleagues defined metabolic health based on self‐reported diagnosis of type 2 diabetes, use of blood‐pressure‐lowering medication, systolic blood pressure and waist–hip ratio. 5 This definition categorized approximately 40% of individuals with obesity as MHO, but the authors could show that, compared to those with a metabolically healthy normal weight, the risk of all‐cause mortality or cardiovascular mortality was not increased in those with MHO or metabolically healthy overweight, whereas the metabolically unhealthy groups had significantly increased risk in all BMI categories, including normal weight. Together with our findings, indicating similar associations with metabolic health in all BMI categories, this highlights the importance of focusing on metabolic health across all BMI categories and not only in obesity.
The present study encountered statistical power limitations due to a smaller sample size when restricting the analysis to individuals with obesity, especially when the sample was further divided into MHO and MUO. Furthermore, only a subset had genetic information, and the PGSBMI was available only for individuals of European ancestry, resulting in a further reduced sample size for analyses, including the PGSBMI. In addition, the HRS is a study that has a higher mean age as it targets individuals >50 together with their spouse of any age; therefore, the mean age of 63 years in the study population is slightly higher compared to other studies of metabolic health and could therefore present some selection bias. Measures of body fat distribution, such as waist–hip ratio, may be an important aspect of metabolic health in obesity. 4 , 41 In the current study, only waist circumference was available, and although sensitivity analyses adjusting for waist circumference did not affect the associations, it is possible that other measures of body fat distribution would have had larger effects. In addition, data collection through interviews can introduce subjectivity that impacts the validity and reliability of the findings. For example, only self‐reported information was available for physical activity, and as such behaviour can be overestimated compared to objective measures such as an accelerometer 42 ; difference in the presence or extent of overestimation between the metabolically healthy and unhealthy groups may have biased the results. It would also have been relevant to examine other lifestyle factors such as dietary habits or sleep quality, but such data are not routinely collected in the HRS. Moreover, medication use was not available and may have substantial effects on body weight and metabolic health, and similarly, the length of time a person has been living with obesity may influence his or her likelihood of being and maintaining MHO. Further studies that consider such additional factors could refine our understanding of MHO. Despite these limitations, the HRS is an extensive longitudinal dataset and offers a notable strength to the current study as we could analyse both cross‐sectional associations and conversion from MHO to a metabolically unhealthy state. The population‐based cohort is well established and includes measurements of obesity and metabolic health, together with a wide range of information on environmental and lifestyle factors, enhancing the study's analytical capabilities.
5. CONCLUSION
In conclusion, this study contributes to the growing body of research on metabolic health in obesity. Our findings highlight differences between MHO and MUO in lifestyle and psychosocial aspects, including physical activity, education and depressive symptoms. It should be noted that the same patterns were observed in people with overweight and normal weight, underlining that these factors are important to metabolic health regardless of BMI level. Additionally, our results suggest that those with genetic predisposition to a higher BMI may be more likely to remain MHO, warranting further investigation. Previous studies have highlighted the importance of metabolic health, especially with a refined definition of metabolic health, as the risk of adverse health is lower in MHO than in metabolically unhealthy BMI categories, including normal weight. 4 Continued research into how metabolic health can be promoted and maintained may advance our understanding so that we can develop more targeted interventions to improve metabolic health across the BMI spectrum.
FUNDING INFORMATION
The Swedish Research Council for Health, Working Life and Welfare (Forte, 2022‐00672); the Strategic Research Program in Epidemiology (SFOepi) at Karolinska Institutet, Karolinska Institutet's Research Foundation (2022‐01718); Loo and Hans Osterman's Foundation (2022‐01222, 2023‐01855, 2024‐02197); and the Foundation for Geriatric Diseases at Karolinska Institutet (2022‐01296, 2023‐01854, 2024‐02197).
CONFLICT OF INTEREST STATEMENT
The authors have no conflicts of interest to declare.
PEER REVIEW
The peer review history for this article is available at https://www.webofscience.com/api/gateway/wos/peer-review/10.1111/dom.16004.
Supporting information
Appendix S1. Supporting information.
Table S1. Description of the study population fromthe original dataset including all observations.
Table S2. Description of the total study population.
Table S3. Cross sectional associations with metabolically unhealthy obesity.
Table S4. Cross sectional associations with metabolic health in individualswith BMI 18−24.9 kg/m2.
Table S5. Cross sectional associations with metabolic health in individualswith BMI kg/m2.
Table S6. Associations of conversion from metabolically healthy obesity toa metabolically unhealthy state.
Table S7. Associations of conversion from metabolically healthy normalweight to a metabolically unhealthy state.
Table S8. Associations of conversion from metabolically healthy overweightto a metabolically unhealthy state.
Table S9. Cross sectional associations with metabolic health in individualswith BMI ≥30 (1= healthy).
Table S10. Cross sectional associations with metabolic health in individualswith BMI ≥30 (1= unhealthy).
Table S11. Associations of conversion from metabolically healthy obesity toa metabolically unhealthy state (1 = healthy).
Table S12. Associations of conversion from metabolically healthy obesity toa metabolically unhealthy state (1 = unhealthy).
Table S13. Cross sectional associations with metabolic health in individualswith BMI ≥30, all models based on the same sample as separate models.
Table S14. Cross sectional associations with metabolic health in individualswith BMI ≥30, all models restricted to the same sample as mutually adjusted models.
Table S15. Cross sectional associations with metabolically unhealthy obesityadjusted for waist circumference.
Table S16. Associations of conversion frommetabolically healthy obesity to a metabolically unhealthy state adjusted forwaist circumference.
Table S17. Interactions between exposure variables and age in cross‐sectionalassociations with metabolic health in individuals with BMI ≥30.
Table S18. Interactions between exposure variables and age in relation toconversion from metabolically healthy obesity to a metabolically unhealthystate health in individuals with BMI ≥30.
ACKNOWLEDGEMENTS
The Health and Retirement Study data is sponsored by the National Institute on Aging (grant number U01AG009740) and is conducted by the University of Michigan. This study used the Health and Retirement Study, ([RAND HRS Longitudinal File 2020]) public use dataset, produced and distributed by the University of Michigan with funding from the National Institute on Aging (grant number NIA U01AG009740). Ann Arbor, MI, (2024).
Ojalehto Lindfors E, De Oliveira TL, Reynolds CA, et al. Genetic influences, lifestyle and psychosocial aspects in relation to metabolically healthy obesity and conversion to a metabolically unhealthy state. Diabetes Obes Metab. 2025;27(1):207‐214. doi: 10.1111/dom.16004
DATA AVAILABILITY STATEMENT
The HRS and RAND files are public use datasets (sensitive health data requires supplemental registration), available through: https://hrs.isr.umich.edu/
REFERENCES
- 1. Fahed G, Aoun L, Bou Zerdan M, et al. Metabolic syndrome: updates on pathophysiology and management in 2021. Int J Mol Sci. 2022;23(2):1–38. [DOI] [PMC free article] [PubMed] [Google Scholar]
- 2. Blüher M. Metabolically healthy obesity. Endocr Rev. 2020;41:3. [DOI] [PMC free article] [PubMed] [Google Scholar]
- 3. Zhou Z, Macpherson J, Gray SR, et al. Are people with metabolically healthy obesity really healthy? A prospective cohort study of 381,363 UK biobank participants. Diabetologia. 2021;64(9):1963‐1972. [DOI] [PMC free article] [PubMed] [Google Scholar]
- 4. Schulze MB, Stefan N. Metabolically healthy obesity: from epidemiology and mechanisms to clinical implications. Nat Rev Endocrinol. 2024;20:397–409. [DOI] [PubMed] [Google Scholar]
- 5. Zembic A, Eckel N, Stefan N, Baudry J, Schulze MB. An empirically derived definition of metabolically healthy obesity based on risk of cardiovascular and Total mortality. JAMA Netw Open. 2021;4(5):e218505. [DOI] [PMC free article] [PubMed] [Google Scholar]
- 6. Hemmingsson E. Early childhood obesity risk factors: socioeconomic adversity, family dysfunction, offspring distress, and junk food self‐medication. Curr Obes Rep. 2018;7(2):204‐209. [DOI] [PMC free article] [PubMed] [Google Scholar]
- 7. Lavie CJ, Ozemek C, Carbone S, Katzmarzyk PT, Blair SN. Sedentary behavior, exercise, and cardiovascular health. Circ Res. 2019;124(5):799‐815. [DOI] [PubMed] [Google Scholar]
- 8. Haynes A, Kersbergen I, Sutin A, Daly M, Robinson E. Does perceived overweight increase risk of depressive symptoms and suicidality beyond objective weight status? A systematic review and meta‐analysis. Clin Psychol Rev. 2019;73:101753. [DOI] [PubMed] [Google Scholar]
- 9. Stanley SH, Laugharne JD. Obesity, cardiovascular disease and type 2 diabetes in people with a mental illness: a need for primary health care. Aust J Prim Health. 2012;18(3):258‐264. [DOI] [PubMed] [Google Scholar]
- 10. Wray NR, Goddard ME, Visscher PM. Prediction of individual genetic risk to disease from genome‐wide association studies. Genome Res. 2007;17(10):1520‐1528. [DOI] [PMC free article] [PubMed] [Google Scholar]
- 11. Lee H, Shin H, Chung Y, Kim JS. Association between the transition to metabolically unhealthy obesity and lifestyle behavior: a nationwide cohort study. Public Health Nurs. 2024;41:675‐683. [DOI] [PubMed] [Google Scholar]
- 12. Ortega FB, Cadenas‐Sanchez C, Migueles JH, et al. Role of physical activity and fitness in the characterization and prognosis of the metabolically healthy obesity phenotype: a systematic review and meta‐analysis. Prog Cardiovasc Dis. 2018;61(2):190‐205. [DOI] [PubMed] [Google Scholar]
- 13. Eckel N, Li Y, Kuxhaus O, Stefan N, Hu FB, Schulze MB. Transition from metabolic healthy to unhealthy phenotypes and association with cardiovascular disease risk across BMI categories in 90 257 women (the Nurses' health study): 30 year follow‐up from a prospective cohort study. Lancet Diabetes Endocrinol. 2018;6(9):714‐724. [DOI] [PubMed] [Google Scholar]
- 14. Sonnega A, Faul JD, Ofstedal MB, Langa KM, Phillips JW, Weir DR. Cohort profile: the health and retirement study (HRS). Int J Epidemiol. 2014;43(2):576‐585. [DOI] [PMC free article] [PubMed] [Google Scholar]
- 15. Karlsson IK, Lehto K, Gatz M, Reynolds CA, Dahl Aslan AK. Age‐dependent effects of body mass index across the adult life span on the risk of dementia: a cohort study with a genetic approach. BMC Med. 2020;18(1):131. [DOI] [PMC free article] [PubMed] [Google Scholar]
- 16. Crimmins E, Ki Kim J, Weir D, Arbor A. HRS data documentation for 2016 DBS release . HRS Documentation Report 2020.
- 17. Eckel RH, Grundy SM, Zimmet PZ. The metabolic syndrome. Lancet. 2005;365(9468):1415‐1428. [DOI] [PubMed] [Google Scholar]
- 18. Alberti KG, Eckel RH, Grundy SM, et al. Harmonizing the metabolic syndrome: a joint interim statement of the international diabetes federation task force on epidemiology and prevention; National Heart, Lung, and Blood Institute; American Heart Association; world heart federation; international atherosclerosis society; and International Association for the Study of obesity. Circulation. 2009;120(16):1640‐1645. [DOI] [PubMed] [Google Scholar]
- 19. RAND HRS Longitudinal File 2020 (V1) . Available from: https://www.rand.org/well-being/social-and-behavioral-policy/centers/aging/dataprod/hrs-data.html
- 20. Turvey CL, Wallace RB, Herzog R. A revised CES‐D measure of depressive symptoms and a DSM‐based measure of major depressive episodes in the elderly. Int Psychogeriatr. 1999;11(2):139‐148. [DOI] [PubMed] [Google Scholar]
- 21. Becker J, Burik CAP, Goldman G, et al. Resource profile and user guide of the polygenic index repository. Nat Hum Behav. 2021;5(12):1744‐1758. [DOI] [PMC free article] [PubMed] [Google Scholar]
- 22. Yengo L, Sidorenko J, Kemper KE, et al. Meta‐analysis of genome‐wide association studies for height and body mass index in ∼700000 individuals of European ancestry. Hum Mol Genet. 2018;27(20):3641‐3649. [DOI] [PMC free article] [PubMed] [Google Scholar]
- 23. R Core Team, R and others . R Core Team R: A language and environment for statistical computing. R Foundation for Statistical Computing; 2023. [Google Scholar]
- 24. Van Buuren S. Flexible Imputation of Missing Data. CRC press; 2018. [Google Scholar]
- 25. Stefanski LA, Boos DD. The calculus of M‐estimation. Am Stat. 2002;56(1):29‐38. [Google Scholar]
- 26. Abiri B, Valizadeh M, Nasreddine L, Hosseinpanah F. Dietary determinants of healthy/unhealthy metabolic phenotype in individuals with normal weight or overweight/obesity: a systematic review. Crit Rev Food Sci Nutr. 2023;63(22):5856‐5873. [DOI] [PubMed] [Google Scholar]
- 27. Silveira EA, Mendonça CR, Delpino FM, et al. Sedentary behavior, physical inactivity, abdominal obesity and obesity in adults and older adults: a systematic review and meta‐analysis. Clin Nutr ESPEN. 2022;50:63‐73. [DOI] [PubMed] [Google Scholar]
- 28. Luppino FS, de Wit LM, Bouvy PF, et al. Overweight, obesity, and depression: a systematic review and meta‐analysis of longitudinal studies. Arch Gen Psychiatry. 2010;67(3):220‐229. [DOI] [PubMed] [Google Scholar]
- 29. Anekwe CV, Jarrell AR, Townsend MJ, Gaudier GI, Hiserodt JM, Stanford FC. Socioeconomics of obesity. Curr Obes Rep. 2020;9(3):272‐279. [DOI] [PMC free article] [PubMed] [Google Scholar]
- 30. Carek PJ, Laibstain SE, Carek SM. Exercise for the treatment of depression and anxiety. Int J Psychiatry Med. 2011;41(1):15‐28. [DOI] [PubMed] [Google Scholar]
- 31. Wang X, Arafa A, Liu K, Eshak ES, Hu Y, Dong JY. Combined healthy lifestyle and depressive symptoms: a meta‐analysis of observational studies. J Affect Disord. 2021;289:144‐150. [DOI] [PubMed] [Google Scholar]
- 32. Bi J, Song L, Wang L, et al. Transitions in metabolic health status over time and risk of heart failure: a prospective study. Diabetes Metab. 2022;48(1):101266. [DOI] [PubMed] [Google Scholar]
- 33. Zhao M, Zhang N, Wang M, et al. Transitions in metabolic health and onset age of cardiovascular diseases. Am J Prev Med. 2023;65:1059‐1068. [DOI] [PubMed] [Google Scholar]
- 34. Gilardini L, Zambon A, Soranna D, Croci M, Invitti C. Predictors of the transition from metabolically healthy obesity to unhealthy obesity. Eat Weight Disord. 2018;23(6):739‐744. [DOI] [PubMed] [Google Scholar]
- 35. Zhang H, Tang X, Hu D, Li G, Song G. Transition patterns of metabolism‐weight phenotypes over time: a longitudinal study using the multistate Markov model in China. Front Public Health. 2022;10:1026751. [DOI] [PMC free article] [PubMed] [Google Scholar]
- 36. Ojalehto E, Zhan Y, Jylhävä J, Reynolds CA, Dahl Aslan AK, Karlsson IK. Genetically and environmentally predicted obesity in relation to cardiovascular disease: a nationwide cohort study. EClinicalMedicine. 2023;58:101943. [DOI] [PMC free article] [PubMed] [Google Scholar]
- 37. Davidson T, Vinneau‐Palarino J, Goode JA, Boardman JD. Utilizing genome wide data to highlight the social behavioral pathways to health: the case of obesity and cardiovascular health among older adults. Soc Sci Med. 2021;273:113766. [DOI] [PMC free article] [PubMed] [Google Scholar]
- 38. Vinneau JM, Huibregtse BM, Laidley TM, Goode JA, Boardman JD. Mortality and obesity among U.S. older adults: the role of polygenic risk. J Gerontol B Psychol Sci Soc Sci. 2021;76(2):343‐347. [DOI] [PMC free article] [PubMed] [Google Scholar]
- 39. Tsatsoulis A, Paschou SA. Metabolically healthy obesity: criteria, epidemiology, controversies, and consequences. Curr Obes Rep. 2020;9(2):109‐120. [DOI] [PubMed] [Google Scholar]
- 40. Szczerbinski L, Florez JC. Precision medicine of obesity as an integral part of type 2 diabetes management ‐ past, present, and future. Lancet Diabetes Endocrinol. 2023;11(11):861‐878. [DOI] [PubMed] [Google Scholar]
- 41. Salmón‐Gómez L, Catalán V, Frühbeck G, Gómez‐Ambrosi J. Relevance of body composition in phenotyping the obesities. Rev Endocr Metab Disord. 2023;24(5):809‐823. [DOI] [PMC free article] [PubMed] [Google Scholar]
- 42. Prince SA, Adamo KB, Hamel M, Hardt J, Connor Gorber S, Tremblay M. A comparison of direct versus self‐report measures for assessing physical activity in adults: a systematic review. Int J Behav Nutr Phys Act. 2008;5(1):56. [DOI] [PMC free article] [PubMed] [Google Scholar]
Associated Data
This section collects any data citations, data availability statements, or supplementary materials included in this article.
Supplementary Materials
Appendix S1. Supporting information.
Table S1. Description of the study population fromthe original dataset including all observations.
Table S2. Description of the total study population.
Table S3. Cross sectional associations with metabolically unhealthy obesity.
Table S4. Cross sectional associations with metabolic health in individualswith BMI 18−24.9 kg/m2.
Table S5. Cross sectional associations with metabolic health in individualswith BMI kg/m2.
Table S6. Associations of conversion from metabolically healthy obesity toa metabolically unhealthy state.
Table S7. Associations of conversion from metabolically healthy normalweight to a metabolically unhealthy state.
Table S8. Associations of conversion from metabolically healthy overweightto a metabolically unhealthy state.
Table S9. Cross sectional associations with metabolic health in individualswith BMI ≥30 (1= healthy).
Table S10. Cross sectional associations with metabolic health in individualswith BMI ≥30 (1= unhealthy).
Table S11. Associations of conversion from metabolically healthy obesity toa metabolically unhealthy state (1 = healthy).
Table S12. Associations of conversion from metabolically healthy obesity toa metabolically unhealthy state (1 = unhealthy).
Table S13. Cross sectional associations with metabolic health in individualswith BMI ≥30, all models based on the same sample as separate models.
Table S14. Cross sectional associations with metabolic health in individualswith BMI ≥30, all models restricted to the same sample as mutually adjusted models.
Table S15. Cross sectional associations with metabolically unhealthy obesityadjusted for waist circumference.
Table S16. Associations of conversion frommetabolically healthy obesity to a metabolically unhealthy state adjusted forwaist circumference.
Table S17. Interactions between exposure variables and age in cross‐sectionalassociations with metabolic health in individuals with BMI ≥30.
Table S18. Interactions between exposure variables and age in relation toconversion from metabolically healthy obesity to a metabolically unhealthystate health in individuals with BMI ≥30.
Data Availability Statement
The HRS and RAND files are public use datasets (sensitive health data requires supplemental registration), available through: https://hrs.isr.umich.edu/