

Abstract
Studying cell heterogeneity can provide a deeper understanding of biological activities, but appropriate studies cannot be performed using traditional bulk analysis methods. The development of diverse single cell bioanalysis methods is in urgent need and of great significance. Mass spectrometry (MS) has been recognized as a powerful technique for bioanalysis for its high sensitivity, wide applicability, label-free detection, and capability for quantitative analysis. In this review, the general development of single cell mass spectrometry (SCMS) field is covered. First, multiple existing SCMS techniques are described and compared. Next, the development of SCMS field is discussed in a chronological order. Last, the latest quantification studies on small molecules using SCMS have been described in detail.
Keywords: Single cell mass spectrometry, Single cell metabolomics, Vacuum-based techniques, Ambient techniques, Cell heterogeneity, Quantitative analysis, High throughput
1. Introduction
Limited by the sensitivity of instrument and sampling methods with relatively low spatial resolution in the past, so-called “bulk analysis” has been the dominating method in the field of mass spectrometry (MS) for bioanalysis. However, traditional bulk analysis has several shortcomings that cannot be easily overlooked. First of all, the results of traditional bulk analysis methods are based upon the measurements of a population of cells, whereas cell heterogeneity, which plays an important role in biological activities and human diseases, is inevitably concealed. Individual responses from single cells might provide unique information that could revolutionize our current understanding. Moreover, bulk analysis methods tend to require a larger number of analytes, whereas certain samples (e.g., rare cells and limited patient samples) may not be easily obtained in a large quantity. Single-cell analysis, which enables studies on cell heterogeneity and reduces sample consumption, has become an emerging field in MS bioanalysis.
To study molecular changes (e.g., RNA/DNA, proteins, and metabolites) at single-cell level, many techniques, including DNA/RNA sequencing [1,2], Raman spectroscopy [3,4], flow cytometry [5–8], mass cytometry and fluorescence optical microscopy [9–11], have been developed. DNA/RNA sequencing techniques are well established, and these methods have been further developed for single cell study because of their powerful amplification technologies. Compared with DNA, the high variability of RNA in single cell due to selective transcription could better represent cell activity, and therefore, single cell RNA sequencing has been widely used in single cell studies [12,13]. Raman spectroscopy is a non-destructive label-free technique mainly focusing on interactions between cells and drug molecules as well as carrier systems and other nanomaterials [3,4]. Flow cytometry utilizes laser to produce scattered light and fluorescence signals, which are produced from fluorescent labeled antibodies, to detect antigens reflecting characteristics of individual cells. As a specialized type of flow cytometry, fluorescence-activated cell sorting (FACS) is widely used to target and isolate subpopulations of cells based on fluorescent labels [5–7,14]. However, the overlapped fluorophore emission spectra limit cellular features to be simultaneously detected. Fluorescence optical microscopy can be used to investigate cellular processes in single cells labeled with dye or fluorescent proteins such as GFP (green fluorescent protein) [9]. However, applications of these above techniques are largely limited by their intrinsic drawbacks: DNA/RNA sequencing provide genetic information but cannot directly reflect cellular activity; only specific components (e.g., protein markers) can be detected by Raman, fluorescence microscopy, flow cytometry, and mass cytometry. A majority of cellular species cannot be directly detected by these techniques.
MS is becoming a powerful bioanalytical method for untargeted analysis of biomolecules in single cells [15]. Its wide coverage of different types of molecules allows for a large amount of biological information to be obtained from a minimal quantify of samples [16]. Among different single cell MS (SCMS) methods, the vacuum-based techniques, including matrix-assisted laser desorption/ionization (MALDI) and secondary ion MS (SIMS), were first developed primarily due to their high spatial resolution for sampling [17,18]. However, the requirement of high vacuum environment of sampling and ionization and complex sample preparation can limit their applications such as analysis of live cells [19]. With the development of novel sampling and ionization methods, ambient-based SCMS techniques have been developed [20]. These methods allow for measurement of single cells in their near-native environment with little or no sample preparation. Mass cytometry, a unique single cell assay tool technique combining elemental MS with flow cytometry, allows for studies of cells labeled with antibodies, which are conjugated with unique stable metal isotopes [21]. The integration of elemental MS empowers mass cytometry to simultaneously detect significantly more cellular characteristics.
SCMS analysis can provide broad coverages of molecules to acquire rich molecular information of single cells. Both qualitative and quantitative analyses are critical for better understanding of molecular targets ranging from subcellular changes to biological systems. All SCMS methods are capable of qualitative analysis to obtain molecular compositions, and most of them can be used as semi-quantitative analysis methods to acquire the relative abundances of substances in single cells [16,19,22,23]. However, only a few techniques have been established for quantitative analysis, i.e., to quantify the absolute amounts or concentrations of molecules of interest at cellular level.
Compared with traditional quantitative studies using bulk samples, such as lysates prepared from populations of cells and tissues [24–26], a major limitation of single cell quantitative analysis is the extremely small amounts of analytes in individual cells. Therefore, molecules with very low abundances may not be differentiated from background signal or noise detected for confident identification [27,28]. Other common challenges in SCMS measurements include matrix effect, sample loss, molecular identification, and instrument fluctuation [27,28]. In this review, we first briefly summarized multiple existing SCMS methods, and then focus on methods allowing for quantitative analysis of small molecules.
2. Current SCMS techniques
Current SCMS techniques can be generally classified into two major categories according to their sampling and ionization environment: vacuum-based and ambient methods. Vacuum-based ion sources often require complex sample pretreatments, such as dehydration and matrix application, to assist laser or ion beam to generate ions. The vacuum-based ion sources provided high sensitivity and high throughput by reducing the interfering species in the experimental environments, but live cells cannot be analyzed due to sample pretreatments [17,27]. In contrast, ambient ionization methods allow for more flexible experiment design to analyze live cells with minimum or no sample pretreatment [20]. Particularly, some ambient SCMS methods enable in-situ analysis of in-vivo cells at their native or near-native environment of cell growth [29–32]. However, compared with vacuum-based SCMS methods, ambient SCMS methods usually have relatively lower sensitivity, primarily due to the ionization efficiency influenced by matrix molecules coexisting with cells. In addition, most of these ambient-based methods have relatively low throughput, restricting their applications to studies of large number of cells [20]. However, a great effort has been made by multiple research groups to increase the throughput of SCMS methods. Here, we will introduce these different categories based upon their chronological order of development.
2.1. Vacuum-based techniques
Sample ionization is critical as it is the first step to convert analytes into ions for MS analysis. Vacuum-based MS methods generally provide high sensitivity and high spatial resolution, making them to be naturally considered for single cell analysis. The SCMS technologies in this category include SIMS (Fig. 1A), gas cluster ion beam (GCIB) (Fig. 1B), MALDI (Fig. 1C), and lastly matrix-free laser desorption/ionization (LDI) (Fig. 1D).
Fig. 1.
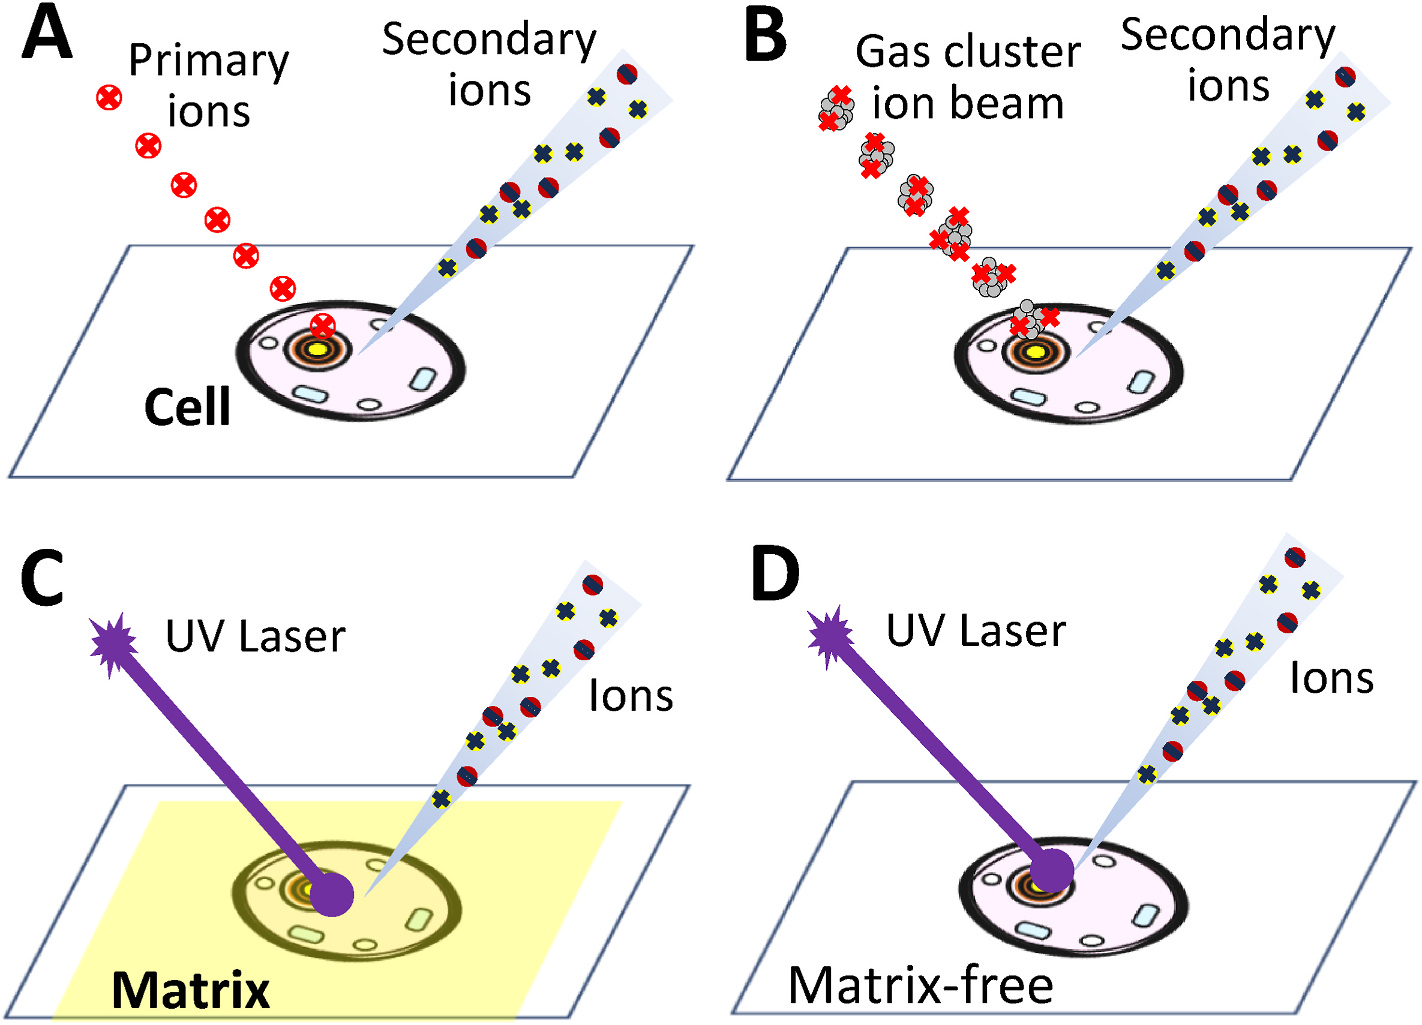
Vacuum-based SCMS methods using (A) SIMS (secondary ion MS), (B) GCIB-SIMS (gas cluster ion beam-secondary ion mass spectrometry) (C) MALDI (matrix-assisted laser desorption/ionization) and (D) matrix-free LDI (laser desorption/ionization).
2.1.1. SIMS
The first reported SIMS experiment was performed by Herzog and Biehböck in 1949 [33], and this technique was further developed for single cell analysis in 1960s [34–36]. SIMS allows for sensitive analysis of surface compositions by sputtering surface analytes with a focused primary ion beam (e.g., 16O−, 16O2+, 40Ar+, Xe+, SF5+, and Cs+) to generate secondary ions from surface molecules (Fig. 1A). These techniques generally provide superior spatial resolution (e.g., nanoSIMS can reach a spatial resolution as high as 50 nm37). However, there are several major disadvantages of analyzing small biological samples (e.g., single cells) using these methods. First, the vacuum needed for the instruments is very high (e.g., ~1.9 × 10⁻⁹ mbar), requiring powerful pumping systems and careful sample preparation. Because the primary ion beam can also collide with gaseous molecules present between the primary ion source and the surface sample, the produced interfering ions can affect the analysis of cellular species [38]. In addition, extra care is needed during sample preparation and measurement because the surface of analytes could absorb gas particles during these processes [22]. Second, conventional SIMS ion beams have relatively low ionization efficiencies of biomolecules (e.g., a typical ionization efficiency is about 10−4), which aggravate challenges of analyzing single cells [39,40]. Third, as a hard ionization method, analytes undergo bombardment by high-energy ion beam, resulting in large numbers of fragments that are challenging for data analysis [40,41]. Because fragmentation is reduced when each atom in the primary ion carries a smaller portion of incident kinetic energy, new ion sources based on the gas cluster ion beam (GCIB) have been developed (Fig. 1B) [40,42]. In our review of SIMS-based techniques, we mainly focus on the discussion of two well-established methods, time-of-flight (TOF)-SIMS [22,39,43–46] and Nanoscale SIMS (Nanoscale SIMS) [37,47,48], and one new technique, GCIB-SIMS [42], that have been applied for single cell analysis.
2.1.1.1. TOF-SIMS (time-of-flight SIMS).
TOF-SIMS couples a pulsed primary ion beam source with a TOF analyzer, which detects ions based on their difference of drift time in field-free region. The utilization of the TOF analyzer enables the analysis of the precursor ions and their fragments at the same time, allowing for better identification abilities and enhanced mass coverage compared with conventional SIMS methods using other types of mass analyzers such as ion microscope analyzer and quadrupole [15,17,49].
TOF-SIMS has been applied to various mass spectrometry imaging (MSI) studies of a broad range of species (e.g., lipids [45,50,51], metal ions [52,53], and metabolites [54]) with spatial resolutions high enough for SCMS experiments (e.g., as high as 100 nm). MSI can provide spatial distributions of molecules in 2D and 3D space. Currently, there are two strategies for MSI studies to obtain 3D information: microtomy and ablation. Microtomy has been widely used in nearly all MSI methods to prepare tissue samples [51,55,56]. In 3D MSI studies, samples are embedded in a supporting medium, such as nitrocellulose in freezing temperature (~−20 °C), and sliced into micrometers size films (6–20 μm). Multiple 2D MS images from consecutive slices are used to reconstruct 3D spatial distributions. In single cell studies, microtomy has also been applied to slicing mouse germinal vesicle (GV) oocyte cells into successive section stacks (with 2 μm in thickness), which were then used to reconstruct 3D single cell MS images as demonstrated by Pogorelov et al. [57] Ablation does not require slicing samples, so this technique not only reduces the sample treatments, but provides a very crucial advantage to handle samples in small sizes such as single cells [44,46,58]. Ablation is a combination of dynamic and static SIMS. Dynamic SIMS uses a higher dose of primary ions (sputter beam) to remove several top monolayers on the sample surface, whereas static SIMS utilizes a secondary ion beam (analytical beam) to sputter only the topmost atomic layer [22]. Molecules on sample surface are desorbed and ionized by analytical beam, then a thin layer on the surface is ablated by sputter beam. The ablation depth needs to be measured since the ablating efficiency varies and is influenced by surface temperature [22]. Atomic force microscopy (AFM), scanning electron micorsocpy (SEM) [43,59,60], and multilayer Irganox standard samples [61–63] have been applied to measuring the ablating efficiencies (i.e., depth in each ablation). Single cell 3D-MSI-TOF-SIMS has been used in many different studies such as chemotherapeutic drug delivery (Fernandez-Lima et al.) [46] and proteins and lipids (Chen et al.) [44]. However, the depth resolution of ablation methods is normally better than microtomy methods since microtomy depth resolution is limited by the sectioning methods[23].
2.1.1.2. Nano-SIMS.
NanoSIMS provides further improved spatial resolution (e.g., as high as 50 nm37) for the detection of elemental and isotopic compositions in samples. Although the fundamental principles of nanoSIMS and conventional SIMS techniques are similar, the major differences between them arise from the primary ion beam and mass detector. NanoSIMS usually uses a continuous primary ion beam with the most electropositive (Cs+ for negative ion mode) or electronegative (O− or O2− for positive ion mode) to achieve the highest ionization efficiencies [15]. Different from TOF-SIMS, nanoSIMS is equipped with magnetic sector mass analyzer [15]. High lateral resolutions can be achieved for nanoSIMS methods due to the combination of multiple factors, including the type of primary ion source, optimized ion beam optics, and specially designed mass analyzer [64]. NanoSIMS has become an indispensable tool for analyzing biomaterials and biological samples requiring ultra-high spatial-resolution (e.g., sub-cellular) as discussed in recent reviews [37,47,48,65–68]. Due to its excellent resolution, nanoSIMS has been used to study cells with smaller sizes (e.g., microbes) and subcellular structures. For example, Dekas et al. studied the influence of sample preparation on isotopic enrichment in archaeal and bacterial cells [69]. This research group also investigated deep-sea microbial activities and intracommunity heterogeneity using nanoSIMS [70,71]. By taking the advantage of the ultrahigh spatial resolution of nanoSIMS, multiple studies have been carried out to acquire subcellular distribution of drugs and metabolites [72–74].
2.1.1.3. GCIB-SIMS.
Although most SIMS-based techniques are wellknown for high spatial resolution but a low mass range (<m/z 1000) measurements, a new generation of ion beam source, GCIB, has been developed to shift their capabilities from fragment detection to molecular profiling (Fig. 1B) [40]. The clustered ions in GCIB-SIMS instruments are created through a supersonic expansion where high pressure gas (e.g., noble gases, such as helium or argon, under ~106 psi) expands and cools in a vacuum (~1 psi) [42]. Because these new ion beam sources use ion clusters with relatively large sizes and low energies, they can significantly reduce fragmentation, improve the ionization efficiency, and expand the mass range. Thus, GCIB-SIMS allows for the study of relatively large biomolecules, such as lipids and fatty acids, in single cells with high spatial resolutions (1 μm) [40,50,75]. However, compared with traditional SIMS, GCIB-SIMS has relatively low spatial resolutions and it is not generally available for all users.
2.1.2. Laser desorption/ionization
Laser desorption/ionization (LDI)-based MS methods use a laser beam at a certain wavelength to illuminate a sample surface where certain molecules are desorbed and ionized. After the first laser machine was developed in 1960 b y Maiman, LDI was observed by Honig and Woolston in 1963 that the laser induced emission of different types of charged particles, such as electrons and ions, and neutral atoms from different solid surfaces [76]. However, this technique had not been widely used until the 1980s due to the limited types molecules that could be ionized. The energy from the laser beam with certain wavelengths can only be absorbed by specific molecules. The major LDI-based techniques include matrix assisted laser desorption/ionization mass spectrometry (MALDI-MS) and matrix-free LDI methods.
2.1.2.1. MALDI-MS.
MALDI-MS was developed in the 1980s. This strategy significantly increased the ionization efficiency of large biomolecules (up to 100 k Da) such as proteins and polymers [77,78]. The application of matrix, usually organic compounds with strong UV absorption, enables efficient absorption of the laser energy and ionization of the applied matrix molecules. The ionized matrix molecules transfer the energy to the analyte molecules for desorption, and the ionization of analytes occurs through interactions with ionized matrix molecules (Fig. 1C) [79]. MALDI-MS measurements generally render high spatial resolutions, providing a great potential for subcellular analysis as reported as early as 1990s [80–82]. High vacuum environment is required for MALDI to avoid the interference of the laser and atmosphere [17].
However, the pretreatments by matrix and the requirement of high-vacuum working environments always draw concern about the alternation of the sample (e.g., delocalization of molecules). In addition, traditional matrix molecules commonly induce interferences with the detection of low-molecular weight compounds (<1000 m/z), limiting studies of small molecules such as metabolites and drug compounds [83–85]. Atmospheric pressure (AP) MALDI-MS, in which desorption and ionization occur at ambient environment, can simplify the sample pretreatment procedures and increase the experiment throughput [86].
The first MALDI-MS experiment used a 266 nm laser to analyze a mixture of alanine and tryptophan [87]. Since then, a variety of different matrices have been developed for detecting different types of analytes. For example, α-cyano-4-hydroxycinnamic acid (CHCA), a popular matrix, performs well at 337 or 355 nm wavelength for analyses of peptides, nucleotides, and lipids [84]. Due to its excellent capability of spatially-resolved analyses, MALDI has become one of the most popular ion sources in MSI studies, including at the single-cell level. Based on the nature of different species of interest, detailed procedures of sample preparation for MALDI-MSI experiments may vary, but tissue sectioning and matrix application are generally required [88]. With different types of matrix molecules, the performance of MALDI-MS can be optimized to cover lipids [88,89], peptides [90], proteins [91], or polymers [92]. A variety of different MALDI-MS instruments are commercially available, and they have been commonly used for tissue imaging and single cell analysis [89]. The quantitative studies on single cells using MALDI-MS are reviewed in Section 3.2.4.
To date, although most commercial MALDI–MSI instruments enable the analysis of samples with reasonably high spatial resolutions (e.g., pixel sizes ranging between 5 and 20 μm), the ion yields are <10−6 for many types of analytes [93,94], limiting their abilities for single cell analysis. To promote single cell studies, numerous efforts have been devoted to improving the spatial resolution and ionization efficiency, while suppressing matrix interference. The laser-induced post-ionization (MALDI-2) utilizes two pulsed lasers: one is for analyte desorption and the other is for ionization in the expanding particle plum. MALDI-2 greatly enhances the ion yields for biomolecules such as lipids and metabolites. Combined with transmission mode (t-) of laser desorption, the t-MALDI-2 technique achieved a small pixel size of 600 nm [95].
The selection of suitable matrix compounds is crucial for a successful MALDI experiment. Even though numerous efforts have been made to search for matrix molecules with minimal interference at low m/z range, there is no report of perfect matrix with clean background that can cover the whole mass range. To minimize undesired matrix interference, different strategies have been adopted. First, inorganic materials, including nano cobalt oxide, carbon nanotubes, gold and silver nanoparticles, graphene, and nanostructure-based surfaces, were adopted in place of traditional organic matrices. Second, functionalized surfaces and substrates have been used to replace matrices. For example, self-assembled surfaces (SAMs) have highly organized, reproducible surfaces, where the samples are pretreated with a cationic solution without using any solid matrix [96]. Another approach to surface modification is achieved by desorption ionization on porous silicon (DIOS), introduced by the Siuzdak group in 1999, that can be used for analyte deposition during sample preparation [97]. Many other methods, such as using sol-gels and polymer coatings, have also been developed to modify the surface for sample loading [98,99]. With these efforts, numerous SCMS studies have been performed using MALDI-MS techniques. Sweedler et al. observed lipid heterogeneity between neurons and astrocytes [89]. They also integrated microscopy imaging with MALDI-MS for high-throughput single-cell analysis, in which the spatial locations of single dense-core vesicles were determined from the pixels in microscopy images [100].
2.1.2.2. Matrix-free laser desorption/ionization (LDI).
To eliminate the interference of matrix molecules, matrix-free laser desorption/ionization mass spectrometry (LDI-MS) (Fig. 1D) [101,102] and label-assisted laser desorption/ionization mass spectrometry (LALDI-MS) [103,104] have been developed [85]. These techniques have been used for MS studies of relatively large cells such as plant [105] and algae cells [106].
In the LALDI experiments, target molecules (e.g., peptides) need to be labeled with certain functional groups (e.g., fluorophores or polyaromatic structures) for desorption and ionization by soft lasers with visible wavelengths. Although some of these LDI approaches are claimed as matrix-free, it is rare to completely avoid using any assistive molecules (such as 1,5-Diaminonapthalene) to analyze biological samples, primarily because of the complexity of biomolecules that require different levels of desorption and ionization energy [85]. In fact, in previous experiments without using any assistive molecules, such analysis of unicellular microalgae by Pohnert et al. [107] and studies of genus Hypericum by Svatos et al. [105], the molecular coverages are generally lower than MALDI. Regardless of these achievements, an ideal material for universal coverage has not yet been reported.
2.2. Ambient techniques
Although the above vacuum-based MS techniques have been well demonstrated for single cell studies, the alternation of sample environment, such as matrix application and requirements of high-vacuum, can change metabolomic profiles of cells compared with those in their living status. To overcome these challenges, numerous ambient SCMS techniques have been designed. Compared with vacuum-based techniques, most ambient-based techniques require less or even no sample preparation, allowing for the preservation or minimized alteration of the cell environment. However, in exchange for the simplified sample preparation process, additional time is often needed for single cell sampling; therefore, most ambient-based techniques generally have relatively lower throughput compared with vacuum-based methods. Most of these ambient SCMS techniques generally use physical probes, laser, or charged solvent droplets for analyte sampling and ionization.
2.2.1. Probe-based methods
2.2.1.1. Direct probe suction.
Since the size of a single cell can be as small as a few micrometers, it is challenging to use regular sampling and preparation methods adopted in bulk analysis. Microprobes stratified the requirements of single cell analysis.
The idea of microprobe was first proposed by Masujima in 1999 [108], whereas the first SCMS experiment was successfully carried out using live single-cell video mass spectrometry (live single-cell MS or Video-MS) in 2008 [109]. In their studies, cells were monitored by a video-microscope, and the tip (1–2 μm) of a gold-coated capillary nano-ESI emitter was used as a micropipette for sucking the cell contents (cytoplasm or organelle) (Fig. 2A). The nanoESI emitter was then used for ionization in MS analysis. The results showed the specific peaks of cytoplasm, organelle, cell culture medium, and solvent could be distinguished through statistical analyses (e.g., t-test). Later, Masujima applied this technique to study plant cells, and they also improved the coverage for larger molecules, such as lipids, by sonicating the tips containing single cell [20,110,111]. In 2016, the same group reported quantitative analysis using the live single-cell mass spectrometry [112]. To further improve this technique, many efforts have been made such as coupling it with fluorescence imaging [113], laser microscopy [112], and micro-droplet array device [114].
Fig. 2.
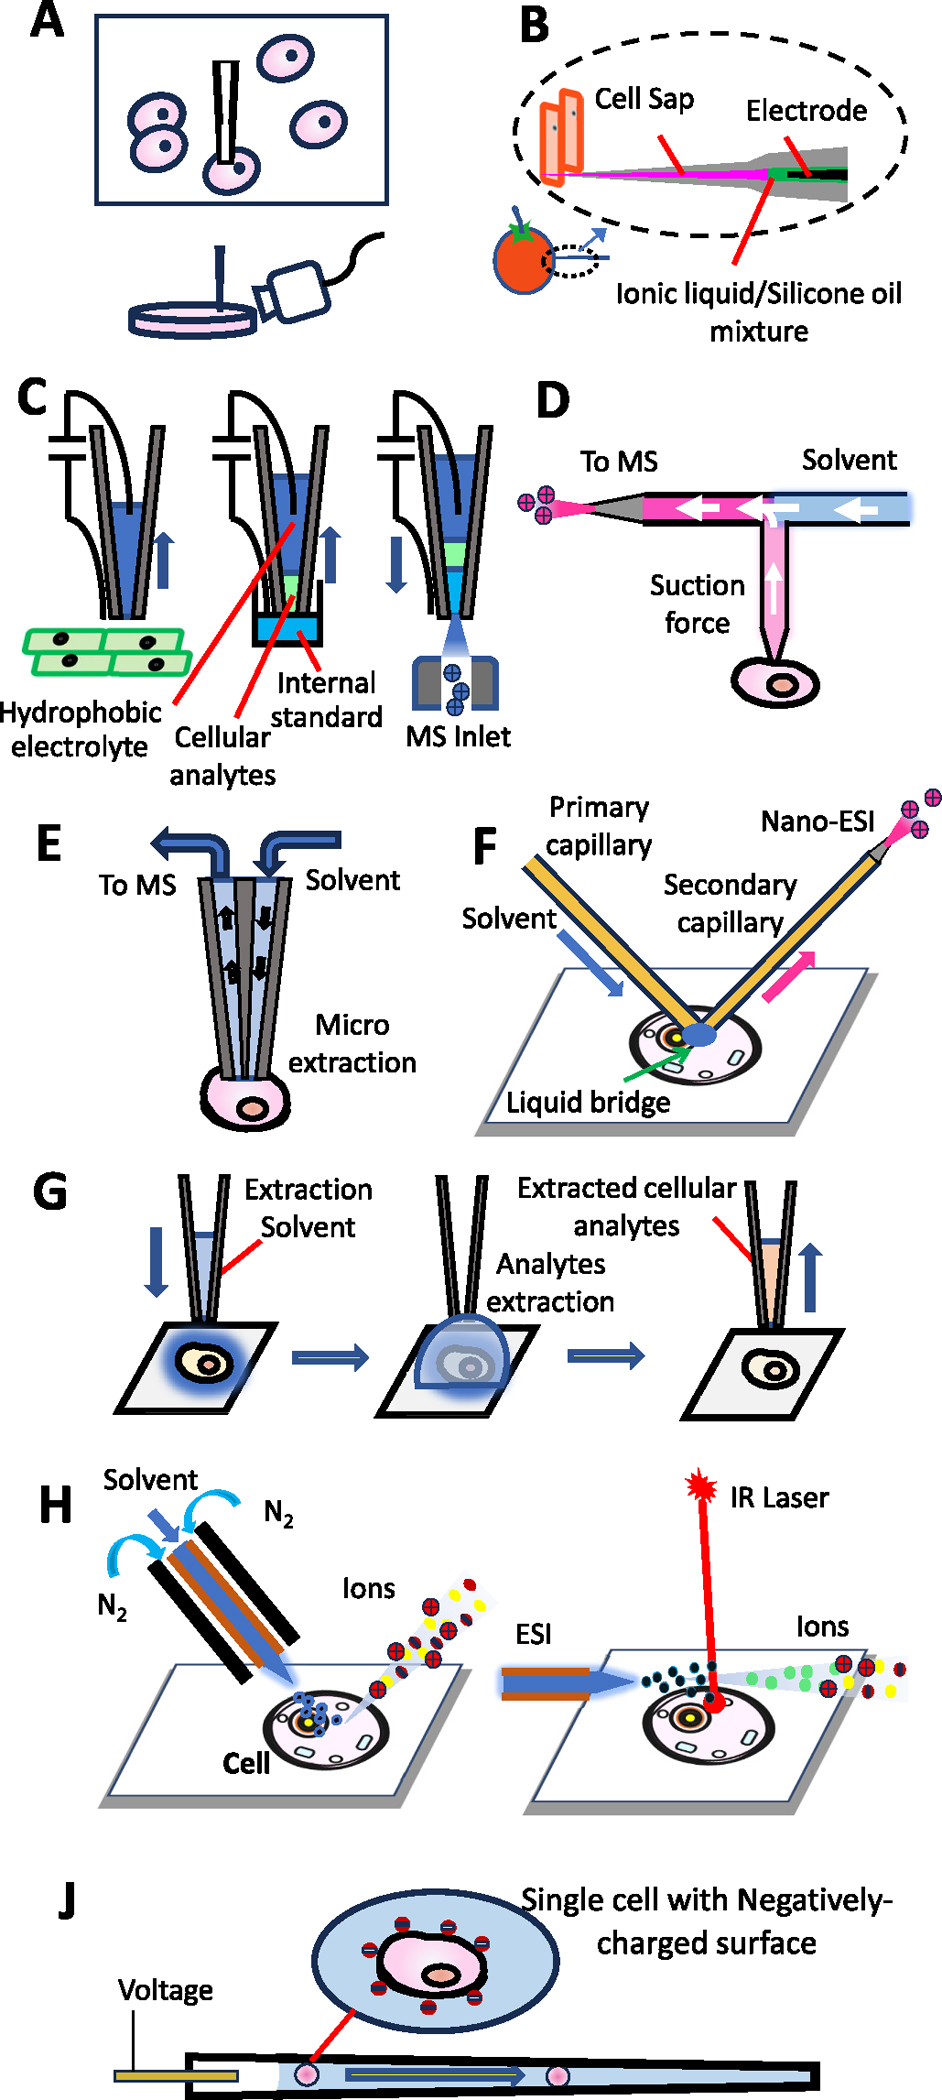
Ambient SCMS methods based on (A) nano-ESI emitter, (B) cell pressure probe, (C) electroosmotic extraction, (D) the T-probe, (E) the Single-probe, (F) Nano-DESI (nano desorption electrospray ionization), (G) droplet extraction, (H) DESI (nano desorption electrospray ionization), (I) LAESI (laser ablation electrospray ionization), and (J) cell electro-migration and electroporation.
Single cell sampling can be achieved through capillarity, by which cellular contents is spontaneously drawn into capillaries without a suction force provided by a pump. The Vertes group reported capillary micro-sampling system coupled with ion mobility MS detection for single cell analysis [115]. A glass capillary was pulled to form a sharp tip (~1 μm), which was inserted into the plant cells for sampling. Due to the capillary action and turgor pressure, the cytoplasm automatically entered the glass capillary. After suction of cellular contents, the capillary was backfilled with 1 μL electrospray solution, and a platinum wire was inserted from the back to contact the electrospray solution. During the MS analysis, an ionization voltage (2 kV) was applied on the platinum wire to induce nanoESI. About 200 peaks were found in the mass spectra, and the application of ion mobility led to resolving 400 different ions from these peaks. Significant differences have been found between trichome and the other two types of cells, but not between pavement and basal cells. In 2015, 22 metabolites and 54 lipids were identified from human hepatocytes (HepG2/C3A) using similar techniques [116]. In 2018, this group measured peptides in single neurons of the mollusk Lymnaea stagnalis [117]. Cytoplasm and nucleus were separately analyzed by coupling the capillary micro-sampling system with a fluorescence microscope.
Hiroshi Nonami’s group introduced cell pressure probe (Fig. 2B) [118–120]. To reduce the sample preparation time, they modify the previous cell pressure probe [121–123] to implement direct injection via the ESI source [120]. In this design, a high voltage was applied on an electrode, which is a metal wire coiled around the capillary tip or an internal wire electrode inserted from the back of the ESI emitter, to ionize sampled cellular compounds. MS analyses were then conducted using an Orbitrap mass spectrometer.
A method based on electroosmotic extraction has been adopted by Laskin et al. [124] A nanopipette, which has a small tip (diameter <1 μm) and was pre-filled with hydrophobic electrolyte, was used to draw cytoplasm by the electroosmotic force, which was produced from the voltage applied on two electrodes (Fig. 2C). Depending on the voltage polarities, either extraction or injection was performed. Changes in ion current from the power supply were observed when the nanopipette tip approached the cell wall.
More methods have been developed based on the direct probe suction. For example, the micropipette needle, which is a multifunctional device, was developed by the Yang group for SCMS studies [125]. As a sampling device, the orifice of the micropipette needle is large enough (~15 μm) to extract an intact cell, instead of inserting into a single cell, for sampling single cells. The micropipette needle was also used as the container for cell lysis (by organic solvents such as acetone and acetonitrile) and Paternò–Büchi (PB) reaction (assisted by UV irradiation) to determine the carbon-carbon double-bond (C═C) positions in unsaturated lipids (through analyses of diagnostic MS [2] fragments) at the single-cell level.
The T-probe is another device developed by the Yang group in 2018 for direct suction of contents from single cells for MS studies (Fig. 2D) [30,126]. In a T-probe, three fused silica capillaries (i.e., solvent-providing capillary, nanoESI emitter, and cell probe) sandwiched by two polycarbonate slides to join together at a T-shaped junction. The solvent is provided through one horizontal channel (liquid providing capillary) and flows towards the other horizontal channel (nanoESI emitter). Unlike other probes for direct suction using mechanical devices, such as a syringe or microinjector, to withdraw analytes from single cells, the T-probe takes advantages of the self-aspiration in nanoESI processes. During the SCMS experiment, ESI induces liquid displacement inside the nanoESI emitter and further generates a suction force in the cell probe, which is inserted into a cell. Cellular contents are extracted by the cell probe, mixed with the solvent from the solvent-providing capillary, and then immediately delivered to the nanoESI emitter for MS analysis. The Yang group has also developed another self-aspiration-based device, the Single-probe (Fig. 2E), for SCMS studies as detailed in Section 3.2.3.
2.2.1.2. Probe microextraction by solid or liquid phases.
In addition to direct, non-separative extraction of cellular contents, microscale extraction can be performed through solid or liquid phases within the device to selectively extract or preconcentrate analytes of interest from the original cellular contents. In these processes, the extraction phase absorbs or dissolves the analytes during sampling processes. Due to the small sample size for single cell analysis, microextraction needs to be performed using a lower phase ratio of extractant to sample [127]. In SCMS studies, microextraction is operated using modified tips or MS compatible solvents, and experiments are conducted under ambient and open-air conditions.
There are two microextraction-based methods reported in previous studies: solid-phase microextraction (SPME) [128] and liquid-liquid microextraction (LLME) [129]. SPME utilizes a solid needle as the extractant to insert into a single cell, while LLME utilizes organic solvents, such as methanol or acetonitrile, for extraction in ambient conditions. LLME methods usually have no requirement for another solvent for MS analysis, thus tend to have a higher throughput compared with SPME. More detailed explanation for SPME-AMS have been provided in studies reported by Reyes-Garces et al. [130].
The sampling process of the SPME-based single cell ambient MS (SPME–SC–AMS) is operated by inserting a needle in a single cell to absorb cellular contents onto the needle surface. Since molecules in the solvent interact with the solid sorbent on the probe, i.e., selective partitioning between a solid sorbent and a liquid sample, the molecules in single cell are absorbed by the probe for the MS analysis. However, the extraction efficiency is a primary concern for SPME–SC–AMS. In order to enhance the extraction efficiency, tips were modified or coated with different materials, which could play a significant role in analysis. During MS analysis, the absorbed cellular analytes are released and ionized thought two different strategies. In the first strategy, the absorbed analytes need to be redissolved by dipping the tips inside an organic solvent, which is then ionized for MS analysis. This concept was first introduced by Hiraoka et al., in 2012. Luan et al. modified this technique by using coated probes, surface-coated probe nanoelectrospray ionization MS (SCP-nanoESI-MS), to enhance the extraction efficiency in studies reported 2014 and 2015 [131–133]. Specifically, a tungsten microdissecting needles (~1 μm tip size) with silane coating was inserted into single cell, aiming to enhance the adsorption of cellular contents. The probe was then inserted into a nanoESI emitter, which was preloaded with desorption/spray solvent (1 μL of methanol), for a short period of time (~30 s) to desorb extracted molecules. An ionization voltage was then applied on this nanoESI emitter for ionization and MS analysis. Quantitative analysis of perfluorinated compounds (PFCs) from single egg cells of Daphnia magna was performed using this technique. In the second strategy, the absorbed analytes are ionized with the assistance of solvent spray. As reported by Suzuki et al. in 2007, an ionization voltage was applied on the probe (a rust-free high-quality stainless-steel needle) upon finishing sampling a single cell, and the solvent (normally organic solvent) was then sprayed on the probe. With the assistance of the solvent and a high voltage, analytes absorbed on the probe were ionized [134]. Similar desorption and ionization methods were used by the DSP, in which the auxiliary solvent droplets were generated by a piezoelectric inkjet system [135]. Many metabolites, including amino acids and flavonoids, in single plant cells were successfully analyzed using the DSP method. By reducing the solvent volume and modifying tip surfaces differently, the throughput and sensitivity were further increased [136].
In LLME-based SCMS studies, organic solvents, such as methanol and acetonitrile, were frequently used as extraction solutions for small molecules due to their ability to break cytomembrane and high extraction efficiency. The basic strategy is to provide a solvent, normally by capillary, for dissolution or extraction of single cell contents, then deliver the solution to mass spectrometers for subsequent analysis. Solvent choice and the way of solvent delivery can dramatically influence the extraction and MS profiling.
Nanospray desorption electrospray ionization (nano-DESI), which used a primary capillary for solvent delivery on sample and a secondary capillary for solution extraction and ionization, was introduced by the Laskin group in 2012 for MS tissue imaging [137]. A spatial resolution of 12 μm with high signal-to-noise ratio in each individual pixel was reached, enabling its functions for SCMS studies (Fig. 2F). In 2017, Lanekoff et al. detected amino acids and plasmalogens in single cheek cells with nano-DESI [32].
The Single-probe, a miniaturized multifunctional device for in situ and real-time sampling, was introduced by the Yang group in 2014 [29]. A dual-bore quartz needle was pulled on one side to form a sharp tip (~10 μm), and a solvent-providing capillary and a nano-ESI emitter were inserted into the two channels from the back. During analysis, the solvent-providing capillary connected with a syringe continuously provides solvent. Liquid junction is formed at the dual-bore quartz needle tip, which is inserted into a single cell, to extract cellular analytes. The solution containing cellular analytes is automatically drawn to the nano-ESI emitter channel through self-aspiration followed by ionization. A schematic working mechanism of the Single-probe is shown in Fig. 2E. Metabolites detected using this method include lipids, fatty acids, amino acids, adenosine monophosphates (i.e., AMP, ADP, and ATP), species involved in TCA (tricarboxylic acid cycle) cycle, and drug metabolites [125,138–141]. Using the Single-probe combined with an integrated cell manipulation system, studies have been extended to include both adherent and non-adherent cells in 2021 [142,143]. Recently, Lu group modified the Single-probe by immobilizing TiO2 onto the inner wall of the transfer capillary [144] and applying porous graphitic carbon for the Single-probe mass spectrometry imaging (MSI) to enrich the signals of low-abundance sphingolipids [145].
Droplet-based microextraction was developed by the Zhang group in 2016, and this technique has been used to detect numerous metabolites, such as uridine diphosphate N-acetylglucosamine (UDP-Glc-NAc), glutathione(GSH), and adenosine monophosphates, from breast cancer cells (Fig. 2G) [146]. In 2018, this group further combined their droplet extraction technique with Pico-ESI-MS (pulsed direct current electrospray ionization mass spectrometry). Compared with nanoESI, the flow rate of pico-ESI was dramatically reduced, leading to significantly increased ion signal duration (i.e., ~2 min) and improved molecular identification (>300 phospholipids were identified) from single cells [147].
In 2014, nanomanipulation-coupled nanospray MS was introduced by Phelps et al. [148] This method used a quartz probe to puncture the cell membrane, and then used a nanoESI emitter to extract analytes from the cell. Using “two-tip” method can reduce the risk of tip clogging of the nanoESI emitter during cellular analytes extraction. In their studies, a Pd/Au-coated nanoESI emitter was pre-filled with 10 μL solution (chloroform:methonal (2:1, v/v) with 0.1% ammonium acetate). The solvent in the nanoESI emitter was injected into cells at a pressure of ~5 psi for 500 ms to extract analytes such as triacylglycerol (TAG) content. The solution was drawn back at a pressure of ~20 psi, and the nanoESI emitter was then transferred to a mass spectrometer for analysis, with the focus on differences of TAGs between healthy and tumorous adipocytes. In 2015, Phelps et al. used this technique to expand the molecular coverage to cellular lipids [148].
2.2.2. Desorption/ionization
2.2.2.1. ESI-based desorption/ionization.
The concept of desorption electrospray ionization (DESI) was introduced by the Cooks group in 2004, focusing on direct surface analysis [149]. By spraying charged droplets generated by ESI onto the sample surface, molecules on the sample surface are desorbed and ionized in the atmosphere (Fig. 2H). Although DESI has been widely used in MSI of small molecules, such as lipids [150], detection of proteins has been reported [151,152]. With the improved spatial resolution, this method was first applied on single cell analysis in 2012 to reveal significant differences in the lipids of mouse oocytes at different status (unfertilized oocytes, two- and eight-cell embryos) [153].
2.2.2.2. Laser-based desorption/ionization.
Lasers can also be a source of energy for the desorption/ionization of sample molecules. The first laser assisted ambient MS technique is laser ablation electrospray ionization (LAESI) [154], which was introduced by Nemes and Vertes in 2007. In this study, an etched optical fiber tip was used to transmit mid-IR laser pulses to sample for ablation. Desorbed molecules were intercepted by the electrospray and delivered to the mass spectrometer (Fig. 2I). In 2009, the first single cell application of LAESI-MS was reported by Vertes et al. in studies of Allium cepa, Narcissus pseudonarcissus bulb epidermis, and single eggs of Lytechnius pictus [155]. Later in 2010, LAESI-MS was applied for MSI of metabolites as well [154]. Laser desorption/ionization droplet delivery mass spectrometry (LDIDD-MS) is an ambient MS technique, and it was first introduced by Nam and Zare in 2016 [156]. In their studies, laser (266 nm at 15Hz) and DESI (methanol:waster, 1:1 v/v, 5 kV) were combined for desorption/ionization. With the assistance of laser, DESI created around 10 times higher extracted ion current. MSI experiments of mouse brain tissue and single cell analysis of HEK 293T cells were performed using this integrated method with 3 μm spatial resolution.
As a complementary method of vacuum MALDI, AP-MALDI (atmospheric-pressure matrix-assisted laser desorption/ionization) techniques have been used for SCMS studies. For example, a high spatial resolution (7 μm pixel size) AP-MALDI imaging source was coupled to a Thermo Exactive Orbitrap mass spectrometer to study single HeLa cells, and results indicated well correlated MS images and fluorescence images of cells [157].
To study live single cells, matrix-free laser desorption/ionization (LDI) technique (Fig. 1D) has been developed by Baumeister et al. [107] In their studies, algae cells were washed with methanol and then manually collected by a pipette for matrix-free LDI-MS measurements. Experiments were performed using an AP-SMALDI (atmospheric pressure-scanning microprobe matrix-assisted laser desorption/ionization) ion source coupled to a Thermo Q-Exactive Plus mass spectrometer. This AP-SMALDI source provided UV laser spot size of 10 μm for measurements of single cells in their living state.
2.2.3. High throughput SCMS using vacuum-based techniques
MALDI-based methods allow for high throughput measurements due to their automative operation, high repetition rate of laser, and fast MS scan (particularly when coupled with TOF mass analyser). MALDI-MSI techniques have been applied for high throughput cellular and sub-cellular analyses. Sweedler et al. utilized the image-guided MALDI-MSI technique to study single organelles (i.e., dense-core vesicles (DCVs) and lucent vesicles (LVs)) [100]. In their studies, vesicles were deposited onto the ITO slides, and brightfield microscopy images were taken. Software tools were used to analyze microscopy images and recognize pixels representing vesicles. Samples were then coated with matrix for MALDI-MSI analysis. In total, 598 DCVs and 123 LVs were analyzed, and both lipids and peptides from single vesicles were detected. Similar techniques were also used to obtain neuropeptide profiles of Aplysia californica neurons, and 26,000 single neurons from 18 animals were analyzed [158]. This group then developed a new workflow, DATSIGMA (DAta-driven Tools for Single-cell analysis using Image-Guided MAss spectrometry), and used supervised and unsupervised machine learning methods to extract features from MALDI-MSI data of large numbers of cells (ranging from 717 to 124,464 cells) for cell classification [159].
2.2.4. High throughput SCMS using ambient-based techniques
Although numerous ambient probe-based methods have been developed, these experiments generally require precise operating stage system, locating target single cells, and carefully optimizing experimental conditions. Therefore, these methods generally have relatively lower experiment throughput comparing to vacuum-based SCMS techniques. To overcome this drawback, developing fluidic-based high throughput ambient SCMS techniques is regarded as an important direction. Inductively coupled plasma (ICP)-MS has been widely used for metal ion detection [160]. In 2018, the Yu and Wang groups developed the MicroCross sampling interface to quantify nanoparticles using ICP-SC-MS instrument [161]. A MicroCross adapter was connected by four quartz capillaries. The organic-continuous phase was injected from the first and second head-on flowing inlets, and the dispersed phase (i.e., cell suspension) was delivered from the third inlet of the MicroCross adapter. Mixing these two phases formed monodisperse droplets in the transport capillary, which was connected with the fourth inlet of the MicroCross adapter, to introduce single cells to ICP-MS. High throughput (~12 ms/cell) experiments were conducted to reveal cell heterogeneity based on the significant discrepancy of cellular uptake of nanoparticles (AuNPs). In 2021, Hang et al. developed a MSI method by coupling laser ablation with ICP-MS, and they obtained adjustable spatial resolutions (ranging from 400 nm to 10 μm) for metal-containing photosensitive drugs. In addition, they were able to visualize gold nanorods and carboplatin at organelle level in single cells [162].
Inertial-force-assisted droplet-free single-cell sampling (IDSS) was performed using eight circle spiral channels with a series of periodic dimensional confinement micropillars [163]. Inside these channels, 104 periodic dimensional confinement micropillars were fabricated to accelerate Dean-like secondary flow to align and sample single cells from cell suspension. Cells with different sizes are separated due to Dean Flow Fractionation in curved channels: larger cells are gradually enriched and separated at the inner wall of the channel by the vortexes (Fig. 3A). To perform quantitative analysis, another channel was used to provide the internal standard solution. This channel was connected with the outlet of the cell sample channel, and the mixture was measured by ICP-MS. High through analyses (3.7 ms/cell) were carried out to determine the accumulation of Cu2+ by MCF-7, bEnd3, and HepG2 cells to study cell heterogeneity. In addition to metal ions, Dean flow microfluidic chip has been coupled to MS for high throughput (~40 cells/minute) detection of single-cell proteins and untargeted metabolites [164]. Quantitative SCMS analyses of cells separated by Dean Flow Fraction are detailed in Section 3.2.1.
Fig. 3.
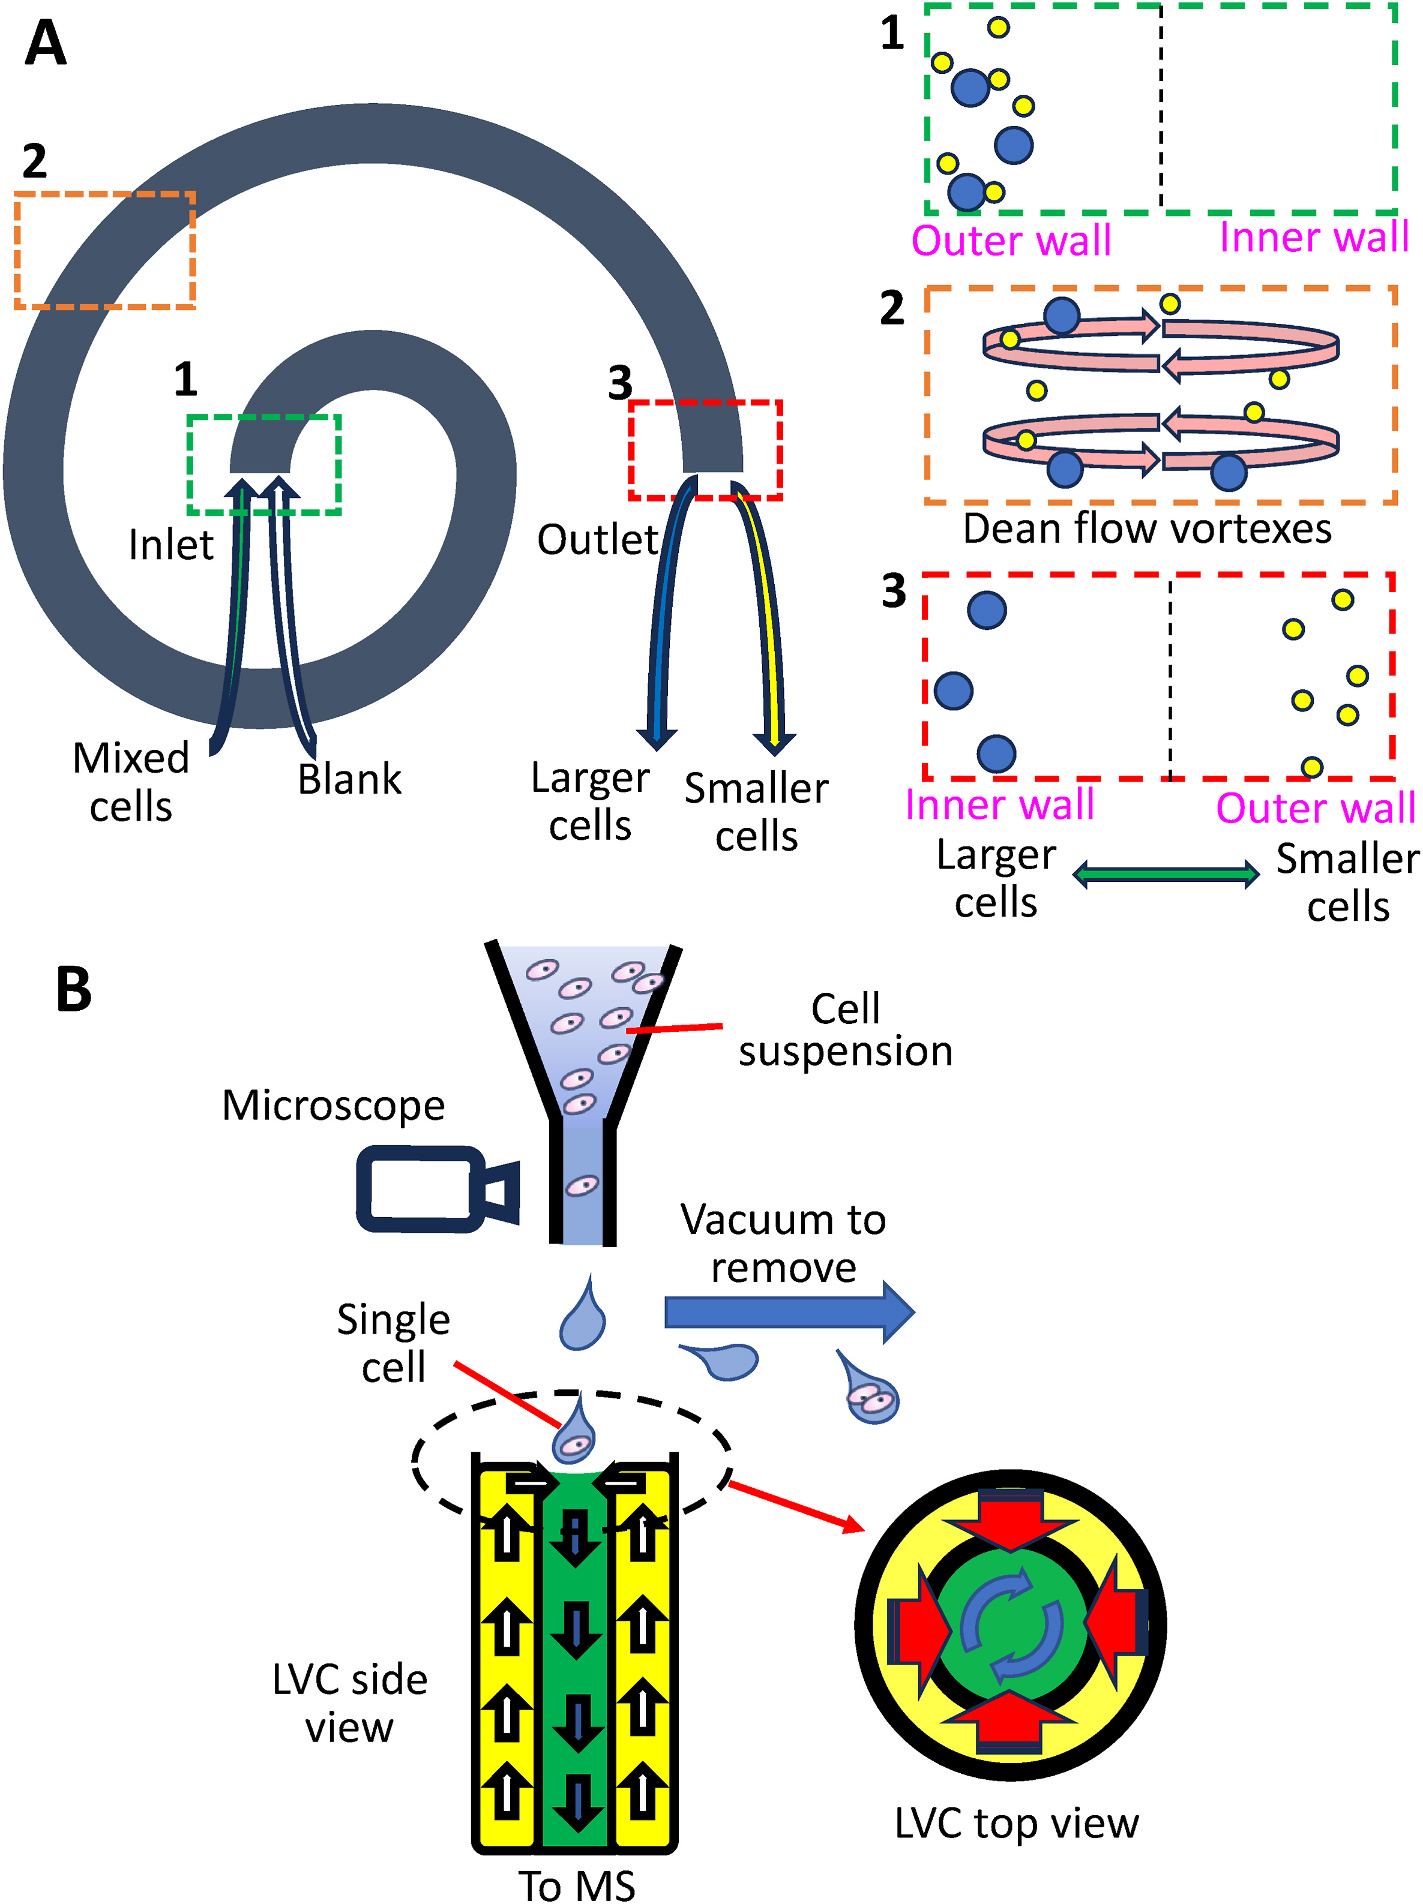
Quantitative ambient SCMS methods with different cell separation techniques. (A) Dean flow fractionation. Left panel: Top view of the microfluidic device. Right panel: cross-section views of different regions of device: (1) the inlet, (2) vortex inside the curved channel, and (3) outlet. (B) SCP (Single-cell printer) coupled to LVC (liquid vortex capture) device. Schematic shows the cross-section views of SCP and LVC devices.
Single-cell printer (SCP) is a commercially available device (Cytena Gmbh, Freiburg, Germany) that isolates single cells based upon microscopy and droplet operation. Cell suspension was continuously delivered to the nuzzle, which was monitored with microscopic devices, before being ejected. Droplets containing no cell or more than one cell were removed by vacuum suction to ensure single-cell isolation. Cahill et al. combined a SCP with the liquid vortex capture-mass spectrometry (SCP-LVC-MS) for high-throughput SCMS measurements (Fig. 3B) [165]. SCP has also been adopted in single-cell proteomics studies, but this is out of the focus of this review.
High throughout SCMS experiments can also be conducted without using microfluidics or SCP. The intact living-cell electrolaunching ionization mass spectrometry (ILCEI-MS), which was introduced by the Wang group [166], stands out due to its relatively simple design. Cell suspension was put in an in-house-built pressurized chamber, which was sealed and connected to a capillary with a constant inner diameter and a thin-walled tip. One end of the capillary was dipped into the cell suspension, and cells were introduced into the capillary driven by pressure from nitrogen gas. Because the inner diameter of the capillary was slightly smaller than cells, single cells moved in sequence to achieve single-cell isolation. A stainless-steel needle was inserted in the cell suspension to apply a high voltage (1–2 kV), and the electric field between the emitter and MS inlet induced single-cell electrolaunching. The ionization of single-cell components occurred in the ion-transfer tube of the mass spectrometer. More than 700 ions from over 5000 cells were detected with a throughput of 51 cells/min.
2.3. Applications of SCMS in metabolomics and lipidomics studies
MS is an indispensable technique for proteomics, metabolomics, and lipidomics studies. Accordingly, SCMS studies in these areas have been successfully conducted. Although SCMS proteomics studies are becoming increasingly important, with numerous new techniques and applications have been reported [167,168], this review is focused on SCMS analyses of small molecules such as metabolites, lipids, and drug compounds. Numerous studies of single cell metabolites have been performed for better understanding of cell status and heterogeneity. Yang et al. measured single marine algae cells grown under different levels of illumination and dissolved nitrogen [169]. Significant differences in the cellular metabolome were observed, reflecting cell metabolism affected by their growing conditions. Ouyang et al. investigated cell heterogeneity based on the ratios of specific metabolites, including ATP/AMP (relevant to energy production) and glutathione (GSH)/oxidized glutathione (GSSG) (relevant to oxidative stress) [170]. In addition, the influence of external stimuli, such as by the treatment of protein inhibitor, was observed from metabolic changes. Similar to metabolomics studies, lipid analyses of single cells provide rich chemical information. Yang et al. carried out a series of SCMS lipidomics studies, including descrimination between cancer stem cells and non-stem cancar cells [141], characterization of drug-resistant cells [171–173], and studies of cell heterogeneity [138,140]. Li et al. intrgrated ion mobility with MALDI-MSI to visualize intercellular and cell-to-cell lipidome heterogeneity, allowing for potential applications in pharmacological intervention [174].
3. Quantitative SCMS
Although most SCMS techniques are capable of qualitatively analyzing molecular compositions, quantitative chemical information with spatial distribution at subcellular level, which is fundamentally important for understanding cell functions, is understudied due to the limitations of most existing SCMS methods. Quantitative SCMS techniques have been developed generally based on qualitative methods with improved sensitivity of instrument, enhanced resolution of microscope, liquid control of better precision, and introduction of standards.
3.1. Types of quantitative SCMS methods
We classified major quantitative SCMS analysis techniques based on their methods for calibration, sampling, volumetric measurement, and ionization.
Quantification relies on establishing a correlation between sample concentration or amount and instrument response. To build such a relationship with high reproducibility, calibration with relatively stable species must be performed to relate signal intensity with chemical abundance. In general, an internal standard is commonly introduced through the solvent containing a known concentration of calibration compounds. The internal standard and the target molecule are simultaneously ionized and detected by MS. As for the selection of calibration standards, compared with absolute quantification that is generally done with isotopically labeled standard compounds possessing the same ionization efficiency [124,175], the selection calibration standards in semi-quantitative analysis has more flexibility. The standards can be chosen from molecules in the same class of the target compounds [165] or the substance that does not exist in sample [120]. In addition, without using any standard, the ion signals of different compounds can be normalized to the total ion current (TIC) [147].
Single-cell isolation is a critical step for most SCMS methods, with two major types of mechanisms: probe-based and fluidic-based methods. Probe-based methods rely on a miniaturized device with sharp tip [29] or focused laser beam [176] to precisely sample a specific spot with a spatial resolution high enough to sample single cells among multiple cells. The process usually requires the operation by experienced personnel performed under a microscope. With fluidic-based methods, sizes of the liquid droplets will be strictly limited to contain only one cell within each aliquot, thus reaching single-cell isolation for further analysis [165]. As the sizes of the liquid droplets are usually controlled by an automated system, fluidic-based sampling methods avoid the costly improvised sampling process to achieve a higher throughput [165].
To conduct an accurate quantitative SCMS measurement, sample volumes need to be carefully measured. The fluidic-based sampling methods are generally operated with precise volumetric control. Probe-based sampling methods are commonly coupled with microscopes, and the volume measurement can be obtained from the images captured from different angles (Fig. 2A) [177]. In addition to the traditional brightfield microscopy, holographic and tomographic microscopy also contribute to this category [112]. Ionization method-based classification is similar to that in Section 2, where ionization methods can be classified as vacuum-based [17,27] and ambient-based techniques [20].
3.2. Current quantitative SCMS applications
There are multiple ways to classify and organize various quantitative SCMS studies. Here, we list them based on the calibration methods used in the corresponding studies.
3.2.1. Relative quantification without internal standard
For a certain sample analyzed using a specific instrument with a reproducible method, the total ion count (TIC) from the mass spectrum tends to be consistent from run to run. In this case, the signal from a uniform ‘constant’ background can potentially serve as a reference to measure the change of other species [16]. This method relies on the reproducible manner of stable response from a substance that exists across all samples measured under the same experimental conditions. When a relative change in concentration is convincing enough to draw a conclusion, this strategy can be applied with ease, especially for substances in the complex mixture without addition of standards. However, this method has been criticized for its critical dependency on the stability of the signal from selected reference substances and has a large room for error due to the competing ion suppression from all other species [178].
Zhang et al. have coupled two different methods, droplet extraction and pulsed direct current electrospray ionization (pico-ESI) together, for single-cell analysis [147]. In situ single-cell analysis usually has the cell samples submerged in culture medium, which introduces a severe matrix effect interfering with MS detection at the single-cell level. Droplet extraction is a probe-based sampling method which is capable of minimizing the matrix effect of MS detection [146]. Cells were first washed with cold washing solution to remove culture medium, and the biochemical reactions in cells were weakened. A vacuum drying oven was used to dry the washed cells and localize cell contents on the surface of the cell culture dish. An emitter tip was used to soak the dried cells with extraction solvent, suck the extracts, and deliver to MS with the assisted solvent (Fig. 2G) [146]. During the ionization process, pico-ESI was adopted by connecting a DC electrode at the rear of the emitter. With the pulsed voltage applied onto the electrode and careful tuning, pulsed electrospray was established. The extended ion signal duration (up to 100 times) allowed for acquiring more MS2 spectra for molecular identification [179]. The stability of this method was tested using glucose and isotopically labeled glucose prior to studying human glioblastoma cell line (A172) and normal human astrocyte cell (HA) lines. Experimental results indicated that these two cell lines were differentiated on the PCA plot, with glioblastoma cells associated with a higher degree of PC desaturation. A potential biomarker for the cancer cell line, PE(20:1), was also identified in MS2 spectra. In addition, m/z 508.3398 was identified as PC(17:1) in A172 cell line only, whereas this peak was contributed from two isobaric ions, PC(17:1) and PE(20:1), in HA cells [147].
Nakashima et al. conducted single-cell metabolites’ profiling using the pressure probe electrospray ionization-mass spectrometry (IEC-PPESI-MS) [177]. The cell pressure probe was originally developed to measure cellular properties, including turgor pressure and cell volume, of plant cells. The cell pressure probe has a sharp tip (3–5 μm), which is pre-filled with silicone oil, for precise sampling from a specific single cell. Using a microscope, images of tip geometry and position changes of meniscus, which is between the cell sap and silicone oil inside the tip, were captured to calculate sample volumes. Coupled to a mass spectrometer, a titanium wire electrode was inserted into the quartz capillary tip for ionization and detection of cellular analytes. In this study, the pressure probe was used to sample a small amount of sap directly from stalk cells of tomato cultivar “Micro-tom” (Fig. 2B). As the volume extracted from each cell is very small, adjacent cells can be analyzed in one batch. The lower limit of detection of several standard metabolites was reported as femtomole level, with a higher sensitivity in the negative ion mode due to lower background peaks. For example, the lower limit of detection of ascorbic acid was dropped down to 1 and 0.01 fmol for positive and negative ion mode, respectively. Compared with the design with an external electrode, the one with an internal electrode increased the detection sensitivity of ascorbic acid by 32,000 and 4000 times under the positive and negative ion modes, respectively. Differences in metabolite composition of cells from different trichomes were discovered, especially in flavonoids and acyl sugars. Molecular compositions were quantified based on relative peak intensity [177].
Ouyang et al. reported a method integrating electro-migration and electroporation into MS analysis (Fig. 2J) [170]. A vareity of different types cells with cell walls, including yeast, algae, and microalgae cells, were analyzed using this method. In their experiments, a small aliquot of cell solution (i.e., 104 cells/mL) was pre-loaded into a nano-ESI emitter. By carefully tuning of the DC voltage, the single cell was smoothly delivered (by electro-migration) to the nano-ESI tip, and then an elevated pulsed voltage was applied to open channels on the cell membrane (by electroporation). Cellular analytes were then released into the solvent for ionization and MS detection.
Abouleila et al. conducted live SCMS analyses of circulating tumor cells (CTC) [180]. CTCs are considered to be directly related to cancer metastasis, and studies of this type of rare cells are crucial for cancer diagnosis and treatment. Blood samples from gastric cancer (GC) and colorectal cancer (CRC) patients were collected for single cell analysis. Red blood cells were first removed from the blood samples with red blood cells lysis buffer. The remaining cells, including CTCs and lymphocytes, were isolated by the ClearCell FX system prior to being transferred to an imaging petri dish. Cells are separated through Dean Flow Fractionation in curved channels (Fig. 3A). Separated single cells were then picked up by nanospray tips under a microscope and then kept in −80°C environment until subsequential metabolite extraction and MS analysis. PCA-DA (principal component analysis followed by discriminant analysis) of MS data was carried out, and the results indicated clear separations between different cell types. 155 different species showed significant differences between CTCs and lymphocytes (with log2-fold change >1 and p < 0.05). Among these 155 species, acylcarnitine metabolites, sterol lipids, and eicosanoids were more abundant in CRC, whereas glycerophospholipids showed higher abundances in GC CTCs [180].
3.2.2. Relative quantification with internal standards
When an exogenous compound (i.e., the internal standard) is added to all samples with a fixed amount, signals from other compounds can be normalized to the internal standard for the comparison of their relative abundances.
The Masujima group coupled 3D holographic and tomographic (HT) laser microscopy with live single-cell mass spectrometry to obtain mass spectra with 3D spatial resolution [112]. In their studies, human hepatocellular carcinoma cells (HepG2) were placed under the HT laser microscope. With a micromanipulator, a small volume of cytoplasm was extracted using a nanospray tip. The extraction volume was estimated according to the refractive index change in HT microscopy images captured from different angles. The spatial information of the extract was also monitored using the HT microscope. The nanospray tip was then coupled to an Orbitrap Velos Pro mass spectrometer for analysis. To quantify one of the detected species, methionine sulfoxide, a stable isotopically labeled internal standard, l-histidine-15N3, was added in the ionization solvent. The trapped volume in each measurement was estimated at around 1 pL ± 11 aL. Using a calibration curve, the concentration of methionine sulfoxide in the extract was estimated as 5.1 pmol/mL [112].
The Nonami group has also used the cell pressure probe for MS studies of tulip cells [120]. In this particular study, the pressure probe was coupled with an external electrode to apply high voltage to the analyte for electrospray ionization. A number of species (e.g., sugars, amino acids, vitamins, fatty acids, and secondary metabolites) were detected from different types of tulip cells. Particularly, metabolites related to the Krebs cycle were investigated in more detail. To obtain more accurate concentrations of the substances, mannitol was added in the cell sap as the internal standard, and the relative abundances of other species were compared by normalizing their peak intensities to potassiated mannitol [120].
Kertesz group combined single-cell printer technology with liquid vortex capture mass spectrometry (SCP-LVC-MS) for quantitative single-cell analysis [165]. The isolated droplets containing only one cell were selected by SCP and then captured by the LVC probe. At the upper surface, the dropped cells were mixed with a solvent that causes cell rupture due to osmotic pressure (Fig. 3B) [181]. Cell contents were released and transported towards the mass spectrometer for ionization within several seconds. LVC has the potential to be coupled with different liquid-based ionization methods, and ESI has been adopted in this study. With this sampling method, a high throughput (>20 cells/minute) analysis has been achieved. For normalization, 1 nM of diacylglyceryltrimethylhomo-Ser(32:0) (DGTS(32:0)), a lipid not detected in single cells but shares great structural similarity with DGTS class lipids in cells, was added into the LVC solvent as the internal standard. The system was tested using three different types of cells: Euglena gracilis (EuGr), Chlamydomonas reinhardtii (ChRe), and Hela cells. Untargeted chemical profiling was performed, and the difference in chemical compositions was clearly observed among three different types of cells, allowing for a rapid classification of cell types based upon specific lipids. Quantification of lipids in ChRe cells under nutrient deprivation treatment was performed, and it was discovered that nutrient conditions affected the abundances of DGTS(34:4), DGTS (34:3), DGTS(38:4), MGDG(34:7), pheophytin a, and chlorophyll a [165].
3.2.3. Absolute quantification with internal standards
In conventional MS analysis of bulk samples, applying internal standards for absolute quantification is generally used. Compared to the selection of the internal standards for relative quantification, stricter criteria are needed for absolute quantification, particularly for single cell studies [112,124,139,175,182]. First, to compensate for the difference in ionization efficiency, the internal standard needs to have a structure that is highly similar to the compound to be quantified, preferably isotopically-labeled isomer. Second, the internal standard should also have a comparable abundance as the target compound to avoid artifacts caused by the competition in the ionization process. Last but not least, a single internal standard may not be adequate for simultaneous quantification of multiple components in the same assay, and corrections of the recovery rate of internal standards and target molecules need to be measured. Although most absolute quantitative studies were performed using ambient SCMS techniques, nanoSIMS is the only vacuum-based method that has been reported for such type of measurements.
3.2.3.1. Studies performed using ambient-based techniques.
Yin et al. developed a method using precise electroosmotic extraction for quantitative single-cell analysis [124]. The electroosmotic extraction was performed using a custom-built platform combined with two electrodes and one pulled sharp nanopipette (Fig. 2B). Extracted volume was measured using images acquired by a high-resolution microscope. To perform quantitative analysis, 40 pL of 2 mM glucose-d2 solution (the internal standard) was also extracted by the device after the extraction of cytoplasm from an Allium cepa cells. The nanopipette was then transferred to a mass spectrometer and used as a nanoESI emitter for MS analysis. More than 50 metabolites, including four flavonoids that were not previously reported, were detected from the 2–5 pL of extracted cytoplasm in the positive ion mode. Intensities of glucose and glucose-d2 were found to be well-correlated with their concentrations. It was discovered that, compared with other in situ SCMS analysis without separation, separation of compounds due to the mixing of water and hydrophobic electrolyte alleviated signal suppression [124].
Pedro and Rudewicz quantified the drug amiodarone (AMIO) and its metabolite, N-desethylamiodarone (NDEA), in single liver HepG2 and HepaRG cells [183]. In these studies, live cell 3D confocal microscopy imaging was coupled with high-resolution MS. To visualize different cellular components, cells were stained with three different fluorescent dyes: HCS LipidTOX Red phospholipidosis detection reagent (for phospholipids), Hoechst 33,342 (for nucleus), and CellTracker Green CMFDA (for cytoplasm). A Yokogawa single-cell sampling system was used for whole-cell sampling. With the fluorescence label, cells ruptured during the sampling process could be easily ruled out. Each intact cell was isolated under the guidance of the confocal microscope, sucked into a platinum-coated glass tip (10 μm ID), completely lysed by methanol and water, dried by a heating block (70–95°C), redissolved by methanol/water containing the internal standard (AMIO-D4 and NDEA-D4) with a known concentration, and then sprayed into the mass spectrometer. Calibration curves were established using a series of solutions of AMIO and NDEA containing their internal standards (AMIO-D4 and NDEA-D4) at different concentrations. The volume of each cell was measured from sliced images using the 3D fluorescence confocal microscope. Concentrations of AMIO and NDEA in each cell were determined using the external calibration curve, amounts of AMIO and NDEA in each cell, and the volume of the analyzed cells. Using the interquartile range method, outliers were excluded from statistical analysis. 38 HepG2 cells and 31 HepaRG cells were analyzed to determine their intracellular AMIO and NDEA concentrations. NDEA concentration was found to be positively correlated with AMIO concentration in both types of cells, and a higher conversion ratio from AMIO to NDEA was found in HepaRG cells compared with HepG2 cells. Morphological changes were also studied in terms of the shape and volume of cell, phospholipid droplets, and nucleus [183].
The Yang group developed the Single-probe quantitative SCMS methods to determine the amounts and concentrations of intracellular drug compounds in single cells [139,184]. The unique design of the Single-probe allows for flexible adoptions of sampling solutions with different compositions (Fig. 2E). In these quantitative SCMS experiments, the internal standard (e.g., an isotopically labeled drug compound) with a known concentration was added in the sampling solution (e.g., acetonitrile or methanol/water). Both the target molecules (e.g., intracellular drug compounds) and their internal standard were simultaneously detected by MS. To measure the drug amount in adherent cells, a glass chip containing microwells (diameter: 55 μm; depth: 25 μm) was used as a substrate in cell culture and drug treatment. The Single-probe was used to analyze single cells located inside individual wells, which minimized the diffusion loss of both intracellular drug and internal standard molecules during experiments. In these studies, HCT-116 and HeLa cell lines were used as models and treated by irinotecan with a series of treatment times and concentrations. The intracellular amounts of irinotecan were determined based on its peak areas relative to the internal standard (irinotecan-d10), the concentration of irinotecan-d10, flowrate of sampling solution, and data acquisition time. Comparative LC/MS studies were performed, and the results indicated that LC/MS experiments resulted in lower drug uptake, likely due to drug loss during sample preparation [184]. To measure intracellular drug concentrations, the Single-probe SCMS setup was coupled with an integrated cell manipulation platform [139,142,143]. T24 and K562 cells were treated by gemcitabine, rinsed by PBS, and resuspended in PBS. A single cell was captured by a cell-selection probe through a gentle suction from a connected microinjector, and the captured cell was transferred to the tip of the Single-probe by moving the manipulation platform. The single cell underwent a rapid lysis in the sampling solution containing the internal standard (13C, 15N-labeled gemcitabine), followed by immediate MS analysis. The intracellular gemcitabine concentration in a single cell was determined from the measured drug amount, using the similar method as described above, and the cell volume, which was measured using an inverted microscopy during single cell selection [142,143].
Circulating tumor cells (CTCs) have also been studied by Zhang et al. [175] Suspended CTCs were sampled with nanocapillaries and microcapillary holder with Ag/AgCl wire inserted for electro-osmotic extraction of cellular contents. In order to perform ease-to-use volumetric measurement during real sample analysis, experiments were conducted using a microscope to monitor the relationship between volume sucked into the tip and the electro-osmotic extration parameters (i.e., time and voltage). A linear relationship was found between extraction voltage and volume, and the combination of −2 V and 40 s was selected to acquire an extraction volume of ~120 fL. Two pairs of colorectal cancer cell lines were selected with different metastatic ability. Cell lysates were analyzed using LC-MS to screen meaningful metabolites. Kyoto Encyclopedia of Genes and Genomes (KEGG) pathway analysis was carried out, and 14 metabolites from six different pathways were selected as the target analytes for the next-step single cell analysis. Isotopically labeled compounds were added as internal standards for quantification. With the observed cell heterogeneity and 11 quantified target metabolites, an unsupervised non-negative matrix factorization machine learning algorithm was adopted for clustering, and a 4-metabolite fingerprint classifier was built to divide CTCs into groups with different metastatic potentials [175].
3.2.3.2. Studies performed using vacuum-based techniques.
Compared with studies performed using ambient SCMS methods, to the best our knowledge, nanoSIMS is the only vacuum-based technqiue reported for absolute quantitative single cell analysis. Ewing et al. used nanoSIMS imaging to measure the absolute concentrations of dopamine at subcellular levels [71]. In their studies, PC12 cells were subjected to the treatment of 13C-labeled dopamine, chemical fixiation, and embedding. Sample sections were then analyzed using the nanoSIMS setup with optimized parameters, resulting in an ultrahigh spatial resolution of <100 nm. Depth profiles were generated by reconstructing all MS images from the same single cells. The concentrations (30 ± 9 mM) of 13C-labeled dopamine and its metabolites in vesicles were calculated based on comprehensive calibrations. In addition, these concentrations exhibited uneven distributions across different vesicles, agreeing well with results obtained from electrochemical measurements.
3.2.4. Absolute quantification with standard addition
In addition to using the internal standard, standard addition method is commonly used in conventional MS analysis of bulk samples, particularly when multiple target molecules are present in a complex matrix but the internal standards are unavailable [185]. In these experiments, each sample is split into multiple portions, and each portion is spiked with a different amount of standard. Using the response curve produced from the outputs of these spiked samples, the abundance of the target molecules in the original sample can be determined. This traditional strategy has been adopted for quantitative SCMS studies [176].
Although MALDI-MS has been commonly used to detect a wide range of biomolecules, quantitative analysis using this technique is non-trivial due to multiple factors. For example, co-crystallization of analytes and matrix molecules can hardly be controlled, whereas having homogeneous crystals is vital to maintain a reproducibility in quantitative MALDI-MS analysis [185]. In addition, the variation in ion current, fluctuation in laser power, and competitive ionization are obstacles for MALDI-MS quantification. Despite these disadvantages, MALDI-based techniques have unique advantages for SCMS studies: high sensitivity, high tolerance to salts, broad mass coverage, ease of automation, and high throughput.
Rubakhin et al. used MALDI-MS for quantitative analysis of signaling peptides (SPs) in single neurons [176]. Neurons in the central nervous system contain highly varied abundances of SPs, which are critical for decoding brain functions. In these studies, tissues were harvested from Aplysia californica, and individual neurons were surgically isolated under a microscope. Single neurons were then dried on the sample plate and isotopically labeled with succinic anhydride or iTRAQ (isobaric tags for relative and absolute quantitation) for MALDI-MS studies for relative quantifications of SPs such as cerebrin and Cβ peptides. In addition, absolute quantification of cerebrin was performed with standard addition. Briefly, the same spot is consecutively spiked with known amounts of cerebrin and re-analyzed after each addition. Each MALDI sampling process consumes a limited portion of the analyte, allowing for standard addition method to be used for the same sample. The consistency of the signal from angiotensin I, which was added as an internal standard in the first step of sample preparation, validated the non-destructive nature of the sampling process. This is a very sensitive technique with a reported limit of detection and limit of quantification as 19 and 64 fmol, respectively. The experimental results indicated that an average of 230 fmol of cerebin were detected in the F- and C-clusters compared with 700 fmol in ULAB nerves, which are in good agreement with the succinic anhydride labeling approach [176].
3.2.5. Quantification assisted by chemical reactions
Although SCMS metabolomics and lipidomics studies, particularly using ambient-based methods, can be performed without complex sample preparation, chemical reactions can be implemented to extend the capabilities of SCMS techniques.
In SCMS studies, structural characterization of target molecules and detection of low-abundances molecules in single cells are particularly challenging due to their low abundances, inefficient ionization, and complex structures. Novel methods involving chemical reactions have been developed to overcome these challenges [186]. Yang et al. conducted Paternò–Büchi (PB) reactions for single cells to determine locations of carbon-carbon double (C═C) bonds in unsaturated lipids. Ouyang et al. incorporated PB reactions with electromigration SCMS method to investigate C═C locations and sn-positions in lipids [187]. In addition, cell heterogeneity was determined based on the relative abundances of C═C location isomers. To increase MS detection sensitivity, the charge tag containing a quaternary ammonium cation can be conjugated with target molecules through click reactions [188].
In addition to relative quantification, chemical reactions have been utilized in absolute quantitative measurements of single cells. Yang et al. recently reported quantification of nitric oxide (NO) amounts in single cells. In fact, the detection and quantification of NO in single cells is challenging due to the low abundance, high reactivity, small molecular weight, and diffusive properties of NO. In this work, intracellular NO was produced by both exogenous (released from a NO donor compound nitroprusside) and endogenous (stimulated by an anticancer drug doxorubicin) NO resources [189]. Intracellular NO then underwent quantitatively (~100%) reactions with amlodipine (AML) to produce a stable molecule: dehydro amlodipine (DAM). Using the Single-probe SCMS method, DAM in single cells were quantified with the presence of an internal standard (oxasulfuron). In addition, the heterogeneity of NO amounts in single cells was discovered for both endogenous and exogenous NO.
4. Future perspectives
Although SCMS is an emerging area, numerous studies of technology development, applications, and data analysis have been reported. In this review, we are only able to cover a limited number of studies. With the improvements on the sensitivity of mass spectrometers, resolution of microscopes, and precision of mechanical systems (e.g., manipulators and pumps), more possibilities of single-cell analysis are rising and keeping this field active. In addition to the development of novel SCMS experimental techniques, advanced data analysis is critical in mining biological information of SCMS data. With given peaks as targets, Student’s t-test can be used as a basic tool to find statistical difference between two groups [190]. However, more advanced tools have been adopted for classification, visualization, dimensionality reduction and other purposes to make better use of the high sensitivity and wide applicability of MS [191–193]. Machine learning algorithms have also gained popularity with the ability to handle data with more complex structures, with both supervised and unsupervised methods commonly seen in MS field [16,190–192].
Besides the metabolomics analysis of small molecules in single cells, single-cell proteomics, genomics, and transcriptomics are also developing at an incredible speed [1,194,195]. With the combined single-cell multi-omics, a better understanding on biological, physiological, and pathological studies can be expected in the near future.
Acknowledgement
This work was supported by funds from National Institutes of Health (1R01AI177469), National Science Foundation (2305182), Research Council of the University of Oklahoma Norman Campus, and the University of Oklahoma’s Office of the Vice President for Research and Partnerships.
Footnotes
Declaration of competing interest
The authors declare the following financial interests/personal relationships which may be considered as potential competing interests.
Zhibo Yang reports financial support was provided by National Institutes of Health. Zhibo Yang reports financial support was provided by National Science Foundation. Zhibo Yang reports financial support was provided by The University of Oklahoma.
CRediT authorship contribution statement
Yunpeng Lan: Conceptualization, Writing – original draft, Writing – review & editing. Zhu Zou: Conceptualization, Writing – original draft, Writing – review & editing. Zhibo Yang: Conceptualization, Funding acquisition, Project administration, Writing – review & editing.
Data availability
No data was used for the research described in the article.
References
- [1].Kalisky T, Quake SR, Single-cell genomics, Nat. Methods 8 (4) (2011) 311–314. [DOI] [PubMed] [Google Scholar]
- [2].Yan L, Yang M, Guo H, Yang L, Wu J, Li R, Liu P, Lian Y, Zheng X, Yan J, Single-cell RNA-Seq profiling of human preimplantation embryos and embryonic stem cells, Nat. Struct. Mol. Biol. 20 (9) (2013) 1131–1139. [DOI] [PubMed] [Google Scholar]
- [3].Kann B, Offerhaus HL, Windbergs M, Otto C, Raman microscopy for cellular investigations—from single cell imaging to drug carrier uptake visualization, Adv. Drug Deliv. Rev. 89 (2015) 71–90. [DOI] [PubMed] [Google Scholar]
- [4].Schie IW, Huser T, Methods and applications of Raman microspectroscopy to single-cell analysis, Appl. Spectrosc. 67 (8) (2013) 813–828. [DOI] [PubMed] [Google Scholar]
- [5].Wang D, Bodovitz S, Single cell analysis: the new frontier in ‘omics’, Trends Biotechnol. 28 (6) (2010) 281–290. [DOI] [PMC free article] [PubMed] [Google Scholar]
- [6].Davey HM, Kell DB, Flow cytometry and cell sorting of heterogeneous microbial populations: the importance of single-cell analyses, Microbiol. Rev. 60 (4) (1996) 641–696. [DOI] [PMC free article] [PubMed] [Google Scholar]
- [7].Andersson H, van den Berg A, Microtechnologies and nanotechnologies for single-cell analysis, Curr. Opin. Biotechnol. 15 (1) (2004) 44–49. [DOI] [PubMed] [Google Scholar]
- [8].Schmid A, Kortmann H, Dittrich PS, Blank LM, Chemical and biological single cell analysis, Curr. Opin. Biotechnol. 21 (1) (2010) 12–20. [DOI] [PubMed] [Google Scholar]
- [9].Muzzey D, van Oudenaarden A, Quantitative time-lapse fluorescence microscopy in single cells, Annu. Rev. Cell Dev. Biol. 25 (2009) 301. [DOI] [PMC free article] [PubMed] [Google Scholar]
- [10].Wang Q, Niemi J, Tan CM, You L, West M, Image segmentation and dynamic lineage analysis in single-cell fluorescence microscopy, Cytometry Part A: The Journal of the International Society for Advancement of Cytometry 77 (1) (2010) 101–110. [DOI] [PMC free article] [PubMed] [Google Scholar]
- [11].Sandmann M, Lippold M, Saalfrank F, Odika CP, Rohn S, Multidimensional single-cell analysis based on fluorescence microscopy and automated image analysis, Anal. Bioanal. Chem. 409 (16) (2017) 4009–4019. [DOI] [PubMed] [Google Scholar]
- [12].Aldridge S, Teichmann SA, Single cell transcriptomics comes of age, Nat. Commun. 11 (1) (2020) 1–4. [DOI] [PMC free article] [PubMed] [Google Scholar]
- [13].Tasic B, Menon V, Nguyen TN, Kim TK, Jarsky T, Yao Z, Levi B, Gray LT, Sorensen SA, Dolbeare T, Adult mouse cortical cell taxonomy revealed by single cell transcriptomics, Nat. Neurosci. 19 (2) (2016) 335–346. [DOI] [PMC free article] [PubMed] [Google Scholar]
- [14].Ormerod MG, Imrie PR, Flow cytometry, in: Animal Cell Culture, Springer, 1990, pp. 543–558. [DOI] [PubMed] [Google Scholar]
- [15].Yin L, Zhang Z, Liu Y, Gao Y, Gu J, Recent advances in single-cell analysis by mass spectrometry, Analyst 144 (3) (2019) 824–845. [DOI] [PubMed] [Google Scholar]
- [16].Liu R, Yang Z, Single cell metabolomics using mass spectrometry: techniques and data analysis, Anal. Chim. Acta 1143 (2021) 124–134. [DOI] [PMC free article] [PubMed] [Google Scholar]
- [17].Zhang L, Vertes A, Single-cell mass spectrometry approaches to explore cellular heterogeneity, Angew. Chem. Int. Ed. 57 (17) (2018) 4466–4477. [DOI] [PubMed] [Google Scholar]
- [18].Duncan KD, Fyrestam J, Lanekoff I, Advances in mass spectrometry based single-cell metabolomics, Analyst 144 (3) (2019) 782–793. [DOI] [PubMed] [Google Scholar]
- [19].Klepárník K, Foret F, Recent advances in the development of single cell analysis—a review, Anal. Chim. Acta 800 (2013) 12–21. [DOI] [PubMed] [Google Scholar]
- [20].Yang Y, Huang Y, Wu J, Liu N, Deng J, Luan T, Single-cell analysis by ambient mass spectrometry, TrAC, Trends Anal. Chem. 90 (2017) 14–26. [Google Scholar]
- [21].Spitzer MH, Nolan GP, Mass cytometry: single cells, many features, Cell 165 (4) (2016) 780–791. [DOI] [PMC free article] [PubMed] [Google Scholar]
- [22].Massonnet P, Heeren RM, A concise tutorial review of TOF-SIMS based molecular and cellular imaging, J. Anal. Atomic Spectrom. 34 (11) (2019) 2217–2228. [Google Scholar]
- [23].Buchberger AR, DeLaney K, Johnson J, Li L, Mass spectrometry imaging: a review of emerging advancements and future insights, Anal. Chem. 90 (1) (2018) 240. [DOI] [PMC free article] [PubMed] [Google Scholar]
- [24].Bian Y, Zheng R, Bayer FP, Wong C, Chang Y-C, Meng C, Zolg DP, Reinecke M, Zecha J, Wiechmann S, Robust, reproducible and quantitative analysis of thousands of proteomes by micro-flow LC–MS/MS, Nat. Commun. 11 (1) (2020) 157. [DOI] [PMC free article] [PubMed] [Google Scholar]
- [25].Li W, Tse FL, Dried blood spot sampling in combination with LC-MS/MS for quantitative analysis of small molecules, Biomed. Chromatogr. 24 (1) (2010) 49–65. [DOI] [PubMed] [Google Scholar]
- [26].Ramalingam P, Ko YT, A validated LC-MS/MS method for quantitative analysis of curcumin in mouse plasma and brain tissue and its application in pharmacokinetic and brain distribution studies, J. Chromatogr. B 969 (2014) 101–108. [DOI] [PubMed] [Google Scholar]
- [27].Ali A, Abouleila Y, Shimizu Y, Hiyama E, Emara S, Mashaghi A, Hankemeier T, Single-cell metabolomics by mass spectrometry: advances, challenges, and future applications, TrAC, Trends Anal. Chem. 120 (2019) 115436. [Google Scholar]
- [28].Tajik M, Baharfar M, Donald WA, Single-cell mass spectrometry, Trends Biotechnol. 40 (2022) 1374–1392. [DOI] [PubMed] [Google Scholar]
- [29].Pan N, Rao W, Kothapalli NR, Liu R, Burgett AWG, Yang Z, The single-probe: a miniaturized multifunctional device for single cell mass spectrometry analysis, Anal. Chem. 86 (19) (2014) 9376–9380. [DOI] [PubMed] [Google Scholar]
- [30].Liu R, Pan N, Zhu Y, Yang Z, T-probe: an integrated microscale device for online in situ single cell analysis and metabolic profiling using mass spectrometry, Anal. Chem. 90 (18) (2018) 11078–11085. [DOI] [PMC free article] [PubMed] [Google Scholar]
- [31].Stopka SA, Khattar R, Agtuca BJ, Anderton CR, Paša-Tolić L, Stacey G, Vertes A, Metabolic noise and distinct subpopulations observed by single cell LAESI mass spectrometry of plant cells in situ, Front. Plant Sci. 9 (2018) 1646. [DOI] [PMC free article] [PubMed] [Google Scholar]
- [32].Bergman H-M, Lanekoff I, Profiling and quantifying endogenous molecules in single cells using nano-DESI MS, Analyst 142 (19) (2017) 3639–3647. [DOI] [PubMed] [Google Scholar]
- [33].Herzog R, Viehböck F, Ion source for mass spectrography, Phys. Rev. 76 (6) (1949) 855. [Google Scholar]
- [34].Porta Siegel T, Hamm G, Bunch J, Cappell J, Fletcher JS, Schwamborn K, Mass spectrometry imaging and integration with other imaging modalities for greater molecular understanding of biological tissues, Mol. Imag. Biol. 20 (2018) 888–901. [DOI] [PMC free article] [PubMed] [Google Scholar]
- [35].Lanni EJ, Rubakhin SS, Sweedler JV, Mass spectrometry imaging and profiling of single cells, J. Proteonomics 75 (16) (2012) 5036–5051. [DOI] [PMC free article] [PubMed] [Google Scholar]
- [36].Liebl H, Ion microprobe mass analyzer, J. Appl. Phys. 38 (13) (1967) 5277–5283. [Google Scholar]
- [37].Nuñez J, Renslow R, CliffIII JB, Anderton CR, NanoSIMS for biological applications: current practices and analyses, Biointerphases 13 (3) (2018) 03B301. [DOI] [PubMed] [Google Scholar]
- [38].Zhang W, Xia X, Zhang Y, Peng T, Yang Q, A novel sample preparation method for ultra-high vacuum (UHV) secondary ion mass spectrometry (SIMS) analysis, J. Anal. Atomic Spectrom. 33 (9) (2018) 1559–1563. [Google Scholar]
- [39].Vickerman JC, Briggs D, ToF-SIMS: Surface Analysis by Mass Spectrometry, IM, 2001. [Google Scholar]
- [40].Tian H, Sparvero LJ, Blenkinsopp P, Amoscato AA, Watkins SC, Bayir H, Kagan VE, Winograd N, Secondary-ion mass spectrometry images Cardiolipins and phosphatidylethanolamines at the subcellular level, Angew. Chem. Int. Ed. 58 (10) (2019) 3156–3161. [DOI] [PMC free article] [PubMed] [Google Scholar]
- [41].Van der Heide P, Secondary Ion Mass Spectrometry: an Introduction to Principles and Practices, John Wiley & Sons, 2014. [Google Scholar]
- [42].Winograd N, Gas cluster ion beams for secondary ion mass spectrometry, Annu. Rev. Anal. Chem. 11 (2018) 29–48. [DOI] [PubMed] [Google Scholar]
- [43].Robinson MA, Graham DJ, Castner DG, ToF-SIMS depth profiling of cells: z-correction, 3D imaging, and sputter rate of individual NIH/3T3 fibroblasts, Anal. Chem. 84 (11) (2012) 4880–4885. [DOI] [PMC free article] [PubMed] [Google Scholar]
- [44].Sheng L, Cai L, Wang J, Li Z, Mo Y, Zhang S, Xu J-J, Zhang X, Chen H-Y, Simultaneous imaging of newly synthesized proteins and lipids in single cell by TOF-SIMS, Int. J. Mass Spectrom. 421 (2017) 238–244. [Google Scholar]
- [45].Passarelli MK, Winograd N, Lipid imaging with time-of-flight secondary ion mass spectrometry (ToF-SIMS), Biochim. Biophys. Acta Mol. Cell Biol. Lipids 1811 (11) (2011) 976–990. [DOI] [PMC free article] [PubMed] [Google Scholar]
- [46].Vanbellingen QP, Castellanos A, Rodriguez-Silva M, Paudel I, Chambers JW, Fernandez-Lima FA, Analysis of chemotherapeutic drug delivery at the single cell level using 3D-MSI-TOF-SIMS, J. Am. Soc. Mass Spectrom. 27 (12) (2016) 2033–2040. [DOI] [PMC free article] [PubMed] [Google Scholar]
- [47].Behrens S, Kappler A, Obst M, Linking environmental processes to the in situ functioning of microorganisms by high-resolution secondary ion mass spectrometry (NanoSIMS) and scanning transmission X-ray microscopy (STXM), Environ. Microbiol. 14 (11) (2012) 2851–2869. [DOI] [PubMed] [Google Scholar]
- [48].Kopp C, Wisztorski M, Revel J, Mehiri M, Dani V, Capron L, Carette D, Fournier I, Massi L, Mouajjah D, MALDI-MS and NanoSIMS imaging techniques to study cnidarian–dinoflagellate symbioses, Zoology 118 (2) (2015) 125–131. [DOI] [PubMed] [Google Scholar]
- [49].Lodding A, Odelius H, Applications of SIMS in interdisciplinary materials characterization, Progress in Materials Analysis 1 (1983) 21–49. Springer. [Google Scholar]
- [50].Angerer TB, Blenkinsopp P, Fletcher JS, High energy gas cluster ions for organic and biological analysis by time-of-flight secondary ion mass spectrometry, Int. J. Mass Spectrom. 377 (2015) 591–598. [Google Scholar]
- [51].Cillero-Pastor B, Eijkel G, Kiss A, Blanco FJ, Heeren RM, Time-of-flight secondary ion mass spectrometry-based molecular distribution distinguishing healthy and osteoarthritic human cartilage, Anal. Chem. 84 (21) (2012) 8909–8916. [DOI] [PubMed] [Google Scholar]
- [52].Walther F, Koerver R, Fuchs T, Ohno S, Sann J, Rohnke M, Zeier WG, Janek J.r., Visualization of the interfacial decomposition of composite cathodes in argyrodite-based all-solid-state batteries using time-of-flight secondary-ion mass spectrometry, Chem. Mater. 31 (10) (2019) 3745–3755. [Google Scholar]
- [53].Haase A, Arlinghaus HF, Tentschert J, Jungnickel H, Graf P, Mantion A, Draude F, Galla S, Plendl J, Goetz ME, Application of laser postionization secondary neutral mass spectrometry/time-of-flight secondary ion mass spectrometry in nanotoxicology: visualization of nanosilver in human macrophages and cellular responses, ACS Nano 5 (4) (2011) 3059–3068. [DOI] [PubMed] [Google Scholar]
- [54].Brunelle A, Touboul D, Laprévote O, Biological tissue imaging with time-of-flight secondary ion mass spectrometry and cluster ion sources, J. Mass Spectrom. 40 (8) (2005) 985–999. [DOI] [PubMed] [Google Scholar]
- [55].Mayerhofer KE, Heier J, Maniglio Y, Keller BA, Three dimensional analysis of self-structuring organic thin films using time-of-flight secondary ion mass spectrometry, Thin Solid Films 519 (18) (2011) 6183–6189. [Google Scholar]
- [56].Veith L, Böttner J, Vennemann A, Breitenstein D, Engelhard C, Meijer J, Estrela-Lopis I, Wiemann M, Hagenhoff B, Detection of ZrO2 nanoparticles in lung tissue sections by time-of-flight secondary ion mass spectrometry and ion beam microscopy, Nanomaterials 8 (1) (2018) 44. [DOI] [PMC free article] [PubMed] [Google Scholar]
- [57].Gulin A, Nadtochenko V, Solodina A, Pogorelova M, Panait A, Pogorelov A, A novel approach for 3D reconstruction of mice full-grown oocytes by time-of-flight secondary ion mass spectrometry, Anal. Bioanal. Chem. 412 (2) (2020) 311–319. [DOI] [PubMed] [Google Scholar]
- [58].Passarelli MK, Newman CF, Marshall PS, West A, Gilmore IS, Bunch J, Alexander MR, Dollery CT, Single-cell analysis: visualizing pharmaceutical and metabolite uptake in cells with label-free 3D mass spectrometry imaging, Anal. Chem. 87 (13) (2015) 6696–6702. [DOI] [PubMed] [Google Scholar]
- [59].Vaidyanathan S, Fletcher JS, Goodacre R, Lockyer NP, Micklefield J, Vickerman JC, Subsurface biomolecular imaging of streptomyces coelicolor using secondary ion mass spectrometry, Anal. Chem. 80 (6) (2008) 1942–1951. [DOI] [PubMed] [Google Scholar]
- [60].Fletcher JS, Lockyer NP, Vickerman JC, Developments in molecular SIMS depth profiling and 3D imaging of biological systems using polyatomic primary ions, Mass Spectrom. Rev. 30 (1) (2011) 142–174. [DOI] [PubMed] [Google Scholar]
- [61].Mao D, Wucher A, Brenes DA, Lu C, Winograd N, Cluster secondary ion mass spectrometry and the temperature dependence of molecular depth profiles, Anal. Chem. 84 (9) (2012) 3981–3989. [DOI] [PMC free article] [PubMed] [Google Scholar]
- [62].Seah MP, Havelund R, Gilmore IS, SIMS of delta layers in organic materials: amount of substance, secondary ion species, matrix effects, and anomalous structures in argon gas cluster depth profiles, J. Phys. Chem. C 120 (46) (2016) 26328–26335. [Google Scholar]
- [63].Breuer L, Popczun NJ, Wucher A, Winograd N, Reducing the matrix effect in molecular secondary ion mass spectrometry by laser post-ionization, J. Phys. Chem. C 121 (36) (2017) 19705–19715. [Google Scholar]
- [64].Anderton CR, Gamble LJ, Secondary ion mass spectrometry imaging of tissues, cells, and microbial systems, Microscopy today 24 (2) (2016) 24–31. [DOI] [PMC free article] [PubMed] [Google Scholar]
- [65].Oehler DZ, Cady SL, Biogenicity and syngeneity of organic matter in ancient sedimentary rocks: recent advances in the search for evidence of past life, Challenges 5 (2) (2014) 260–283. [Google Scholar]
- [66].Levenson RM, Borowsky AD, Angelo M, Immunohistochemistry and mass spectrometry for highly multiplexed cellular molecular imaging, Lab. Invest. 95 (4) (2015) 397–405. [DOI] [PMC free article] [PubMed] [Google Scholar]
- [67].Fong LG, Young SG, Beigneux AP, Bensadoun A, Oberer M, Jiang H, Ploug M, GPIHBP1 and plasma triglyceride metabolism, Trends Endocrinol. Metabol. 27 (7) (2016) 455–469. [DOI] [PMC free article] [PubMed] [Google Scholar]
- [68].Marchant HK, Mohr W, Kuypers MM, Recent advances in marine N-cycle studies using 15N labeling methods, Curr. Opin. Biotechnol. 41 (2016) 53–59. [DOI] [PubMed] [Google Scholar]
- [69].Meyer NR, Fortney JL, Dekas AE, NanoSIMS sample preparation decreases isotope enrichment: magnitude, variability and implications for single-cell rates of microbial activity, Environ. Microbiol. 23 (1) (2021) 81–98. [DOI] [PubMed] [Google Scholar]
- [70].Arandia-Gorostidi N, Parada A, Dekas A, Single-cell view of deep-sea microbial activity and intracommunity heterogeneity, ISME J. 17 (1) (2023) 59–69. [DOI] [PMC free article] [PubMed] [Google Scholar]
- [71].Thomen A, Najafinobar N, Penen F, Kay E, Upadhyay PP, Li X, Phan NTN, Malmberg P, Klarqvist M, Andersson S, et al. , Subcellular mass spectrometry imaging and absolute quantitative analysis across organelles, ACS Nano 14 (4) (2020) 4316–4325. [DOI] [PMC free article] [PubMed] [Google Scholar]
- [72].Lovrić J, Dunevall J, Larsson A, Ren L, Andersson S, Meibom A, Malmberg P, Kurczy ME, Ewing AG, Nano secondary ion mass spectrometry imaging of dopamine distribution across nanometer vesicles, ACS Nano 11 (4) (2017) 3446–3455. [DOI] [PubMed] [Google Scholar]
- [73].Jiang H, Passarelli MK, Munro PMG, Kilburn MR, West A, Dollery CT, Gilmore IS, Rakowska PD, High-resolution sub-cellular imaging by correlative NanoSIMS and electron microscopy of amiodarone internalisation by lung macrophages as evidence for drug-induced phospholipidosis, Chem. Commun. 53 (9) (2017) 1506–1509. [DOI] [PubMed] [Google Scholar]
- [74].Legin AA, Schintlmeister A, Jakupec MA, Galanski MS, Lichtscheidl I, Wagner M, Keppler BK, NanoSIMS combined with fluorescence microscopy as a tool for subcellular imaging of isotopically labeled platinum-based anticancer drugs, Chem. Sci. 5 (8) (2014) 3135–3143. [DOI] [PMC free article] [PubMed] [Google Scholar]
- [75].Li Q, Chen P, Fan Y, Wang X, Xu K, Li L, Tang B, Multicolor fluorescence detection-based microfluidic device for single-cell metabolomics: simultaneous quantitation of multiple small molecules in primary liver cells, Anal. Chem. 88 (17) (2016) 8610–8616. [DOI] [PubMed] [Google Scholar]
- [76].Honig R, Woolston J, Laser-induced emission of electrons, ions, and neutral atoms from solid surfaces, Appl. Phys. Lett. 2 (7) (1963) 138–139. [Google Scholar]
- [77].Karas M, Hillenkamp F, Laser desorption ionization of proteins with molecular masses exceeding 10,000 daltons, Anal. Chem. 60 (20) (1988) 2299–2301. [DOI] [PubMed] [Google Scholar]
- [78].Tanaka K, Waki H, Ido Y, Akita S, Yoshida Y, Yoshida T, Matsuo T, Protein and polymer analyses up to m/z 100 000 by laser ionization time-of-flight mass spectrometry, Rapid Commun. Mass Spectrom. 2 (8) (1988) 151–153. [Google Scholar]
- [79].Darie-Ion L, Whitham D, Jayathirtha M, Rai Y, Neagu A-N, Darie CC, Petre BA, Applications of MALDI-MS/MS-based proteomics in biomedical research, Molecules 27 (19) (2022) 6196. [DOI] [PMC free article] [PubMed] [Google Scholar]
- [80].Jiménez CR, Burlingame AL, Ultramicroanalysis of peptide profiles in biological samples using MALDI mass spectrometry, Nephron Exp. Nephrol. 6 (5) (1998) 421–428. [DOI] [PubMed] [Google Scholar]
- [81].Li L, Garden RW, Romanova EV, Sweedler JV, In situ sequencing of peptides from biological tissues and single cells using MALDI–PSD/CID analysis, Anal. Chem. 71 (24) (1999) 5451–5458. [DOI] [PubMed] [Google Scholar]
- [82].Garden RW, Moroz LL, Moroz TP, Shippy SA, Sweedler JV, Excess salt removal with matrix rinsing: direct peptide profiling of neurons from marine invertebrates using matrix-assisted laser desorption/ionization time-of-flight mass spectrometry, J. Mass Spectrom. 31 (10) (1996) 1126–1130. [DOI] [PubMed] [Google Scholar]
- [83].Peterson DS, Matrix-free methods for laser desorption/ionization mass spectrometry, Mass Spectrom. Rev. 26 (1) (2007) 19–34. [DOI] [PubMed] [Google Scholar]
- [84].Keller C, Maeda J, Jayaraman D, Chakraborty S, Sussman MR, Harris JM, Ané J-M, Li L, Comparison of vacuum MALDI and AP-MALDI platforms for the mass spectrometry imaging of metabolites involved in salt stress in Medicago truncatula, Front. Plant Sci. 9 (2018) 1238. [DOI] [PMC free article] [PubMed] [Google Scholar]
- [85].Mandal A, Singha M, Addy PS, Basak A, Laser desorption ionization mass spectrometry: recent progress in matrix-free and label-assisted techniques, Mass Spectrom. Rev. 38 (1) (2019) 3–21. [DOI] [PubMed] [Google Scholar]
- [86].Doroshenko VM, Laiko VV, Taranenko NI, Berkout VD, Lee HS, Recent developments in atmospheric pressure MALDI mass spectrometry, Int. J. Mass Spectrom. 221 (1) (2002) 39–58. [Google Scholar]
- [87].Karas M, Bachmann D, Hillenkamp F, Influence of the wavelength in high-irradiance ultraviolet laser desorption mass spectrometry of organic molecules, Anal. Chem. 57 (14) (1985) 2935–2939. [Google Scholar]
- [88].Ellis S, Soltwisch J, Paine M, Dreisewerd K, Heeren R, Laser post-ionisation combined with a high resolving power orbitrap mass spectrometer for enhanced MALDI-MS imaging of lipids, Chem. Commun. 53 (53) (2017) 7246–7249. [DOI] [PubMed] [Google Scholar]
- [89].Neumann EK, Comi TJ, Rubakhin SS, Sweedler JV, Lipid heterogeneity between astrocytes and neurons revealed by single-cell MALDI-MS combined with immunocytochemical classification, Angew. Chem. 131 (18) (2019) 5971–5975. [DOI] [PMC free article] [PubMed] [Google Scholar]
- [90].Heaton C, Bury CS, Patel E, Bradshaw R, Wulfert F, Heeren RM, Cole L, Marchant L, Denison N, McColm R, Investigating sex determination through MALDI MS analysis of peptides and proteins in natural fingermarks through comprehensive statistical modelling, Forensic Chemistry 20 (2020) 100271. [Google Scholar]
- [91].Xu H, Liu M, Huang X, Min Q, Zhu J-J, Multiplexed quantitative MALDI MS approach for assessing activity and inhibition of protein kinases based on postenrichment dephosphorylation of phosphopeptides by metal–organic framework-templated porous CeO2, Anal. Chem. 90 (16) (2018) 9859–9867. [DOI] [PubMed] [Google Scholar]
- [92].Drzeżdżon J, Jacewicz D, Sielicka A, Chmurzyński L, MALDI-MS for polymer characterization–recent developments and future prospects, TrAC, Trends Anal. Chem. 115 (2019) 121–128. [Google Scholar]
- [93].Dreisewerd K, The desorption process in MALDI, Chem. Rev. 103 (2) (2003) 395–426. [DOI] [PubMed] [Google Scholar]
- [94].Chu KY, Lee S, Tsai M-T, Lu I-C, Dyakov YA, Lai YH, Lee Y-T, Ni C-K, Thermal proton transfer reactions in ultraviolet matrix-assisted laser desorption/ionization, J. Am. Soc. Mass Spectrom. 25 (3) (2014) 310–318. [DOI] [PubMed] [Google Scholar]
- [95].Niehaus M, Soltwisch J, Belov M, Dreisewerd K, Transmission-mode MALDI-2 mass spectrometry imaging of cells and tissues at subcellular resolution, Nat. Methods 16 (9) (2019) 925–931. [DOI] [PubMed] [Google Scholar]
- [96].Han SY, Lee TG, Moon DW, Mass Spectrometric Method for Matrix-free Laser Desorption/ionization of Self-Assembled Monolayers, Google Patents, 2011. [Google Scholar]
- [97].Wei J, Buriak JM, Siuzdak G, Desorption–ionization mass spectrometry on porous silicon, Nature 399 (6733) (1999) 243–246. [DOI] [PubMed] [Google Scholar]
- [98].König S, Target coatings and desorption surfaces in biomolecular MALDI-MS, Proteomics 8 (4) (2008) 706–714. [DOI] [PubMed] [Google Scholar]
- [99].Lin Y-S, Chen Y-C, Laser desorption/ionization time-of-flight mass spectrometry on sol− gel-derived 2, 5-dihydroxybenzoic acid film, Anal. Chem. 74 (22) (2002) 5793–5798. [DOI] [PubMed] [Google Scholar]
- [100].Castro DC, Xie YR, Rubakhin SS, Romanova EV, Sweedler JV, Image-guided MALDI mass spectrometry for high-throughput single-organelle characterization, Nat. Methods 18 (10) (2021) 1233–1238. [DOI] [PMC free article] [PubMed] [Google Scholar]
- [101].Piret G, Drobecq H, Coffinier Y, Melnyk O, Boukherroub R, Matrix-free laser desorption/ionization mass spectrometry on silicon nanowire arrays prepared by chemical etching of crystalline silicon, Langmuir 26 (2) (2010) 1354–1361. [DOI] [PubMed] [Google Scholar]
- [102].Seino T, Sato H, Yamamoto A, Nemoto A, Torimura M, Tao H, Matrix-free laser desorption/ionization-mass spectrometry using self-assembled germanium nanodots, Anal. Chem. 79 (13) (2007) 4827–4832. [DOI] [PubMed] [Google Scholar]
- [103].Addy PS, Bhattacharya A, Mandal SM, Basak A, Label-assisted laser desorption/ionization mass spectrometry (LA-LDI-MS): an emerging technique for rapid detection of ubiquitous cis-1, 2-diol functionality, RSC Adv. 4 (87) (2014) 46555–46560. [Google Scholar]
- [104].Mandal A, Das AK, Basak A, Label-assisted laser desorption/ionization mass spectrometry (LA-LDI-MS): use of pyrene aldehyde for detection of biogenic amines, amino acids and peptides, RSC Adv. 5 (129) (2015) 106912–106917. [Google Scholar]
- [105].Hölscher D, Shroff R, Knop K, Gottschaldt M, Crecelius A, Schneider B, Heckel DG, Schubert US, Svatoš A, Matrix-free UV-laser desorption/ionization (LDI) mass spectrometric imaging at the single-cell level: distribution of secondary metabolites of Arabidopsis thaliana and Hypericum species, Plant J. 60 (5) (2009) 907–918. [DOI] [PubMed] [Google Scholar]
- [106].Le Pogam P, Schinkovitz A, Legouin B, Le Lamer A-C, Boustie J, Richomme P, Matrix-free UV-laser desorption ionization mass spectrometry as a versatile approach for accelerating dereplication studies on lichens, Anal. Chem. 87 (20) (2015) 10421–10428. [DOI] [PubMed] [Google Scholar]
- [107].Baumeister TU, Vallet M, Kaftan F, Svatoš A, Pohnert G, Live single-cell metabolomics with matrix-free laser/desorption ionization mass spectrometry to address microalgal physiology 10 (2019) 172. [DOI] [PMC free article] [PubMed] [Google Scholar]
- [108].Masujima T, Visualized single cell dynamics and analysis of molecular tricks, Anal. Chim. Acta 400 (1–3) (1999) 33–43. [Google Scholar]
- [109].Mizuno H, Tsuyama N, Harada T, Masujima T, Live single-cell video-mass spectrometry for cellular and subcellular molecular detection and cell classification, J. Mass Spectrom. 43 (12) (2008) 1692–1700. [DOI] [PubMed] [Google Scholar]
- [110].Lorenzo Tejedor M, Mizuno H, Tsuyama N, Harada T, Masujima T, Direct single-cell molecular analysis of plant tissues by video mass spectrometry, Anal. Sci. 25 (9) (2009) 1053–1055. [DOI] [PubMed] [Google Scholar]
- [111].Masujima T, Live single-cell mass spectrometry, Anal. Sci. 25 (8) (2009) 953–960. [DOI] [PubMed] [Google Scholar]
- [112].Ali A, Abouleila Y, Amer S, Furushima R, Emara S, Equis S, Cotte Y, Masujima T, Quantitative live single-cell mass spectrometry with spatial evaluation by three-dimensional holographic and tomographic laser microscopy, Anal. Sci. 32 (2) (2016) 125–127. [DOI] [PubMed] [Google Scholar]
- [113].Esaki T, Masujima T, Fluorescence probing live single-cell mass spectrometry for direct analysis of organelle metabolism, Anal. Sci. 31 (12) (2015) 1211–1213. [DOI] [PubMed] [Google Scholar]
- [114].Fujita H, Esaki T, Masujima T, Hotta A, Kim SH, Noji H, Watanabe TM, Comprehensive chemical secretory measurement of single cells trapped in a micro-droplet array with mass spectrometry, RSC Adv. 5 (22) (2015) 16968–16971. [Google Scholar]
- [115].Zhang L, Foreman DP, Grant PA, Shrestha B, Moody SA, Villiers F, Kwak JM, Vertes A, In Situ metabolic analysis of single plant cells by capillary microsampling and electrospray ionization mass spectrometry with ion mobility separation, Analyst 139 (20) (2014) 5079–5085. [DOI] [PubMed] [Google Scholar]
- [116].Zhang L, Vertes A, Energy charge, redox state, and metabolite turnover in single human hepatocytes revealed by capillary microsampling mass spectrometry, Anal. Chem. 87 (20) (2015) 10397–10405. [DOI] [PubMed] [Google Scholar]
- [117].Zhang L, Khattar N, Kemenes I, Kemenes G, Zrinyi Z, Pirger Z, Vertes A, Subcellular peptide localization in single identified neurons by capillary microsampling mass spectrometry, Sci. Rep. 8 (1) (2018) 1–10. [DOI] [PMC free article] [PubMed] [Google Scholar]
- [118].Gholipour Y, Nonami H, Erra-Balsells R, Application of pressure probe and UV-MALDI-TOF MS for direct analysis of plant underivatized carbohydrates in subpicoliter single-cell cytoplasm extract, J. Am. Soc. Mass Spectrom. 19 (12) (2008) 1841–1848. [DOI] [PubMed] [Google Scholar]
- [119].Gholipour Y, Erra-Balsells R, Nonami H, In situ pressure probe sampling and UV-MALDI MS for profiling metabolites in living single cells, Mass Spectrom. 1 (1) (2012). A0003–A0003. [DOI] [PMC free article] [PubMed] [Google Scholar]
- [120].Gholipour Y, Erra-Balsells R, Hiraoka K, Nonami H, Living cell manipulation, manageable sampling, and shotgun picoliter electrospray mass spectrometry for profiling metabolites, Anal. Biochem. 433 (1) (2013) 70–78. [DOI] [PubMed] [Google Scholar]
- [121].Nonami H, Boyer JS, Wall extensibility and cell hydraulic conductivity decrease in enlarging stem tissues at low water potentials, Plant Physiol. 93 (4) (1990) 1610–1619. [DOI] [PMC free article] [PubMed] [Google Scholar]
- [122].Kajiyama S.i., Harada K, Fukusaki E, Kobayashi A, Single cell-based analysis of torenia petal pigments by a combination of ArF excimer laser micro sampling and nano-high performance liquid chromatography (HPLC)–mass spectrometry, J. Biosci. Bioeng. 102 (6) (2006) 575–578. [DOI] [PubMed] [Google Scholar]
- [123].Izumi Y, Kajiyama S.i., Nakamura R, Ishihara A, Okazawa A, Fukusaki E, Kanematsu Y, Kobayashi A, High-resolution spatial and temporal analysis of phytoalexin production in oats, Planta 229 (2009) 931–943. [DOI] [PubMed] [Google Scholar]
- [124].Yin R, Prabhakaran V, Laskin J, Quantitative extraction and mass spectrometry analysis at a single-cell level, Anal. Chem. 90 (13) (2018) 7937–7945. [DOI] [PubMed] [Google Scholar]
- [125].Zhu Y, Wang W, Yang Z, Combining mass spectrometry with paternò–büchi reaction to determine double-bond positions in lipids at the single-cell level, Anal. Chem. 92 (16) (2020) 11380–11387. [DOI] [PMC free article] [PubMed] [Google Scholar]
- [126].Zhu Y, Liu R, Yang Z, Redesigning the T-probe for mass spectrometry analysis of online lysis of non-adherent single cells, Anal. Chim. Acta 1084 (2019) 53–59. [DOI] [PMC free article] [PubMed] [Google Scholar]
- [127].Reyes-Garces N, Gionfriddo E, Gómez-Ríos GA, Alam MN, Boyaci E, Bojko B, Singh V, Grandy J, Pawliszyn J, Advances in solid phase microextraction and perspective on future directions, Anal. Chem. 90 (1) (2017) 302–360. [DOI] [PubMed] [Google Scholar]
- [128].Prosen H, Zupančič-Kralj L, Solid-phase microextraction, TrAC, Trends Anal. Chem. 18 (4) (1999) 272–282. [Google Scholar]
- [129].Sarafraz-Yazdi A, Amiri A, Liquid-phase microextraction, TrAC, Trends Anal. Chem. 29 (1) (2010) 1–14. [Google Scholar]
- [130].Liu Y, Shang Y, Ma Q, Microextraction for ambient ionization mass spectrometry analysis, Advances in Sample Preparation 3 (2022) 100029. [Google Scholar]
- [131].Deng J, Yang Y, Xu M, Wang X, Lin L, Yao Z-P, Luan T, Surface-coated probe nanoelectrospray ionization mass spectrometry for analysis of target compounds in individual small organisms, Anal. Chem. 87 (19) (2015) 9923–9930. [DOI] [PubMed] [Google Scholar]
- [132].Deng J, Li W, Yang Q, Liu Y, Fang L, Guo Y, Guo P, Lin L, Yang Y, Luan T, Biocompatible surface-coated probe for in vivo, in situ, and microscale lipidomics of small biological organisms and cells using mass spectrometry, Anal. Chem. 90 (11) (2018) 6936–6944. [DOI] [PubMed] [Google Scholar]
- [133].Deng J, Yang Y, Liu Y, Fang L, Lin L, Luan T, Coupling paternò-büchi reaction with surface-coated probe nanoelectrospray ionization mass spectrometry for in vivo and microscale profiling of lipid C= C location isomers in complex biological tissues, Anal. Chem. 91 (7) (2019) 4592–4599. [DOI] [PubMed] [Google Scholar]
- [134].Hiraoka K, Nishidate K, Mori K, Asakawa D, Suzuki S, Development of probe electrospray using a solid needle, Rapid Commun. Mass Spectrom.: An International Journal Devoted to the Rapid Dissemination of Up-to-the-Minute Research in Mass Spectrometry 21 (18) (2007) 3139–3144. [DOI] [PubMed] [Google Scholar]
- [135].Gong X, Zhao Y, Cai S, Fu S, Yang C, Zhang S, Zhang X, Single cell analysis with probe ESI-mass spectrometry: detection of metabolites at cellular and subcellular levels, Anal. Chem. 86 (8) (2014) 3809–3816. [DOI] [PubMed] [Google Scholar]
- [136].Yu Z, Chen LC, Ninomiya S, Mandal MK, Hiraoka K, Nonami H, Piezoelectric inkjet assisted rapid electrospray ionization mass spectrometric analysis of metabolites in plant single cells via a direct sampling probe, Analyst 139 (22) (2014) 5734–5739. [DOI] [PubMed] [Google Scholar]
- [137].Laskin J, Heath BS, Roach PJ, Cazares L, Semmes OJ, Tissue imaging using nanospray desorption electrospray ionization mass spectrometry, Anal. Chem. 84 (1) (2012) 141–148. [DOI] [PMC free article] [PubMed] [Google Scholar]
- [138].Nguyen TD, Lan Y, Kane SS, Haffner JJ, Liu R, McCall L-I, Yang Z, Single-cell mass spectrometry enables insight into heterogeneity in infectious disease, Anal. Chem. 94 (30) (2022) 10567–10572. [DOI] [PMC free article] [PubMed] [Google Scholar]
- [139].Bensen RC, Standke SJ, Colby DH, Kothapalli NR, Le-McClain AT, Patten MA, Tripathi A, Heinlen JE, Yang Z, Burgett AWG, Single cell mass spectrometry quantification of anticancer drugs: proof of concept in cancer patients, ACS Pharmacol. Transl. Sci. 4 (1) (2021) 96–100. [DOI] [PMC free article] [PubMed] [Google Scholar]
- [140].Liu R, Li J, Lan Y, Nguyen TD, Chen YA, Yang Z, Quantifying cell heterogeneity and subpopulations using single cell metabolomics, Anal. Chem. 95 (2023) 7127–7133. [DOI] [PMC free article] [PubMed] [Google Scholar]
- [141].Sun M, Yang Z, Metabolomic studies of live single cancer stem cells using mass spectrometry, Anal. Chem. 91 (3) (2018) 2384–2391. [DOI] [PMC free article] [PubMed] [Google Scholar]
- [142].Standke SJ, Colby DH, Bensen RC, Burgett AW, Yang Z, Mass spectrometry measurement of single suspended cells using a combined cell manipulation system and a single-probe device, Anal. Chem. 91 (3) (2019) 1738–1742. [DOI] [PMC free article] [PubMed] [Google Scholar]
- [143].Standke SJ, Colby DH, Bensen RC, Burgett AW, Yang Z, Integrated cell manipulation platform coupled with the single-probe for mass spectrometry analysis of drugs and metabolites in single suspension cells, JoVE (148) (2019) e59875. [DOI] [PMC free article] [PubMed] [Google Scholar]
- [144].Cui H, Wu Q, Zhao Z, Wang Y, Lu H, Selective capture-based single-cell mass spectrometry for enhancing sphingolipid profiling of neurons with differentiation of cell body from synapse, Anal. Chem. 94 (2022) 15729–15737. [DOI] [PubMed] [Google Scholar]
- [145].Luo S, Zhao Z, Wu Q, Wang Y, Lu H, Porous graphitic carbon-based imprint mass spectrometry imaging with an ambient liquid extraction technique for enhancing coverage of glycerolipids and sphingolipids in brain tissue, Anal. Chem. 94 (40) (2022) 13753–13761. [DOI] [PubMed] [Google Scholar]
- [146].Zhang X-C, Wei Z-W, Gong X-Y, Si X-Y, Zhao Y-Y, Yang C-D, Zhang S-C, Zhang X-R, Integrated droplet-based microextraction with ESI-MS for removal of matrix interference in single-cell analysis, Sci. Rep. 6 (1) (2016) 1–9. [DOI] [PMC free article] [PubMed] [Google Scholar]
- [147].Zhang X-C, Zang Q, Zhao H, Ma X, Pan X, Feng J, Zhang S, Zhang R, Abliz Z, Zhang X, Combination of droplet extraction and Pico-ESI-MS allows the identification of metabolites from single cancer cells, Anal. Chem. 90 (16) (2018) 9897–9903. [DOI] [PubMed] [Google Scholar]
- [148].Phelps M, Hamilton J, Verbeck GF, Nanomanipulation-coupled nanospray mass spectrometry as an approach for single cell analysis, Rev. Sci. Instrum. 85 (12) (2014) 124101. [DOI] [PubMed] [Google Scholar]
- [149].Takats Z, Wiseman JM, Gologan B, Cooks RG, Mass spectrometry sampling under ambient conditions with desorption electrospray ionization, Science 306 (5695) (2004) 471–473. [DOI] [PubMed] [Google Scholar]
- [150].Porcari AM, Zhang J, Garza KY, Rodrigues-Peres RM, Lin JQ, Young JH, Tibshirani R, Nagi C, Paiva GR, Carter SA, Multicenter study using desorption-electrospray-ionization-mass-spectrometry imaging for breast-cancer diagnosis, Anal. Chem. 90 (19) (2018) 11324–11332. [DOI] [PMC free article] [PubMed] [Google Scholar]
- [151].Garza KY, Feider CL, Klein DR, Rosenberg JA, Brodbelt JS, Eberlin LS, Desorption electrospray ionization mass spectrometry imaging of proteins directly from biological tissue sections, Anal. Chem. 90 (13) (2018) 7785–7789. [DOI] [PMC free article] [PubMed] [Google Scholar]
- [152].Wiseman JM, Ifa DR, Venter A, Cooks RG, Ambient molecular imaging by desorption electrospray ionization mass spectrometry, Nat. Protoc. 3 (3) (2008) 517–524. [DOI] [PubMed] [Google Scholar]
- [153].Ferreira C, Eberlin L, Hallett J, Cooks R, Single oocyte and single embryo lipid analysis by desorption electrospray ionization mass spectrometry, J. Mass Spectrom. 47 (1) (2012) 29–33. [DOI] [PubMed] [Google Scholar]
- [154].Nemes P, Vertes A, Laser ablation electrospray ionization for atmospheric pressure, in vivo, and imaging mass spectrometry, Anal. Chem. 79 (21) (2007) 8098–8106. [DOI] [PubMed] [Google Scholar]
- [155].Shrestha B, Vertes A, In situ metabolic profiling of single cells by laser ablation electrospray ionization mass spectrometry, Anal. Chem. 81 (20) (2009) 8265–8271. [DOI] [PubMed] [Google Scholar]
- [156].Lee JK, Jansson ET, Nam HG, Zare RN, High-resolution live-cell imaging and analysis by laser desorption/ionization droplet delivery mass spectrometry, Anal. Chem. 88 (10) (2016) 5453–5461. [DOI] [PMC free article] [PubMed] [Google Scholar]
- [157].Schober Y, Guenther S, Spengler B, Römpp A, Single cell matrix-assisted laser desorption/ionization mass spectrometry imaging, Anal. Chem. 84 (15) (2012) 6293–6297. [DOI] [PubMed] [Google Scholar]
- [158].Chan-Andersen PC, Romanova EV, Rubakhin SS, Sweedler JV, Profiling 26,000 Aplysia californica neurons by single cell mass spectrometry reveals neuronal populations with distinct neuropeptide profiles, J. Biol. Chem. 298 (8) (2022) 102254. [DOI] [PMC free article] [PubMed] [Google Scholar]
- [159].Xie YR, Chari VK, Castro DC, Grant R, Rubakhin SS, Sweedler JV, Data-driven and machine learning-based framework for image-guided single-cell mass spectrometry, J. Proteome Res. 22 (2) (2023) 491–500. [DOI] [PMC free article] [PubMed] [Google Scholar]
- [160].Mueller L, Traub H, Jakubowski N, Drescher D, Baranov VI, Kneipp J, Trends in single-cell analysis by use of ICP-MS, Anal. Bioanal. Chem. 406 (27) (2014) 6963–6977. [DOI] [PubMed] [Google Scholar]
- [161].Wei X, Zheng D-H, Cai Y, Jiang R, Chen M-L, Yang T, Xu Z-R, Yu Y-L, Wang J-H, High-throughput/high-precision sampling of single cells into ICP-MS for elucidating cellular nanoparticles, Anal. Chem. 90 (24) (2018) 14543–14550. [DOI] [PubMed] [Google Scholar]
- [162].Meng Y, Gao C, Lu Q, Ma S, Hang W, Single-cell mass spectrometry imaging of multiple drugs and nanomaterials at organelle level, ACS Nano 15 (8) (2021) 13220–13229. [DOI] [PubMed] [Google Scholar]
- [163].Zhang X, Wei X, Men X, Jiang Z, Ye W-Q, Chen M-L, Yang T, Xu Z-R, Wang J-H, Inertial-force-assisted, high-throughput, droplet-free, single-cell sampling coupled with ICP-MS for real-time cell analysis, Anal. Chem. 92 (9) (2020) 6604–6612. [DOI] [PubMed] [Google Scholar]
- [164].Xu S, Liu M, Bai Y, Liu H, Multi-dimensional organic mass cytometry: simultaneous analysis of proteins and metabolites on single cells, Angew. Chem. Int. Ed. 60 (4) (2021) 1806–1812. [DOI] [PubMed] [Google Scholar]
- [165].Cahill JF, Riba J, Rapid Kertesz V, Untargeted chemical profiling of single cells in their native environment, Anal. Chem. 91 (9) (2019) 6118–6126. [DOI] [PubMed] [Google Scholar]
- [166].Shao Y, Zhou Y, Liu Y, Zhang W, Zhu G, Zhao Y, Zhang Q, Yao H, Zhao H, Guo G, Intact living-cell electrolaunching ionization mass spectrometry for single-cell metabolomics, Chem. Sci. 13 (27) (2022) 8065–8073. [DOI] [PMC free article] [PubMed] [Google Scholar]
- [167].Lohani V, A.R A, Kundu S, Akhter MDQ, Bag S, Single-cell proteomics with spatial attributes: tools and techniques, ACS Omega 8 (20) (2023) 17499–17510. [DOI] [PMC free article] [PubMed] [Google Scholar]
- [168].Bennett HM, Stephenson W, Rose CM, Darmanis S, Single-cell proteomics enabled by next-generation sequencing or mass spectrometry, Nat. Methods 20 (3) (2023) 363–374. [DOI] [PubMed] [Google Scholar]
- [169].Sun M, Yang Z, Wawrik B, Metabolomic fingerprints of individual algal cells using the single-probe mass spectrometry technique, Front. Plant Sci. 9 (2018). [DOI] [PMC free article] [PubMed] [Google Scholar]
- [170].Li Z, Wang Z, Pan J, Ma X, Zhang W, Ouyang Z, Single-cell mass spectrometry analysis of metabolites facilitated by cell electro-migration and electroporation, Anal. Chem. 92 (14) (2020) 10138–10144. [DOI] [PubMed] [Google Scholar]
- [171].Sun M, Chen X, Yang Z, Single cell mass spectrometry studies reveal metabolomic features and potential mechanisms of drug-resistant cancer cell lines, Anal. Chim. Acta 1206 (2022) 339761. [DOI] [PMC free article] [PubMed] [Google Scholar]
- [172].Chen X, Sun M, Yang Z, Single cell mass spectrometry analysis of drug-resistant cancer cells: metabolomics studies of synergetic effect of combinational treatment, Anal. Chim. Acta 1201 (2022) 339621. [DOI] [PMC free article] [PubMed] [Google Scholar]
- [173].Liu R, Sun M, Zhang G, Lan Y, Yang Z, Towards early monitoring of chemotherapy-induced drug resistance based on single cell metabolomics: combining single-probe mass spectrometry with machine learning, Anal. Chim. Acta 1092 (2019) 42–48. [DOI] [PMC free article] [PubMed] [Google Scholar]
- [174].Zhang H, Liu Y, Fields L, Shi X, Huang P, Lu H, Schneider AJ, Tang X, Puglielli L, Welham NV, et al. , Single-cell lipidomics enabled by dual-polarity ionization and ion mobility-mass spectrometry imaging, Nat. Commun. 14 (1) (2023) 5185. [DOI] [PMC free article] [PubMed] [Google Scholar]
- [175].Zhang W, Xu F, Yao J, Mao C, Zhu M, Qian M, Hu J, Zhong H, Zhou J, Shi X, et al. , Single-cell metabolic fingerprints discover a cluster of circulating tumor cells with distinct metastatic potential, Nat. Commun. 14 (1) (2023) 2485. [DOI] [PMC free article] [PubMed] [Google Scholar]
- [176].Rubakhin SS, Sweedler JV, Quantitative measurements of cell–cell signaling peptides with single-cell MALDI MS, Anal. Chem. 80 (18) (2008) 7128–7136. [DOI] [PMC free article] [PubMed] [Google Scholar]
- [177].Nakashima T, Wada H, Morita S, Erra-Balsells R, Hiraoka K, Nonami H, Single-cell metabolite profiling of stalk and glandular cells of intact trichomes with internal electrode capillary pressure probe electrospray ionization mass spectrometry, Anal. Chem. 88 (6) (2016) 3049–3057. [DOI] [PubMed] [Google Scholar]
- [178].Deininger SO, Cornett DS, Paape R, Becker M, Pineau C, Rauser S, Walch A, Wolski E, Normalization in MALDI-TOF imaging datasets of proteins: practical considerations, Anal. Bioanal. Chem. 401 (1) (2011) 167–181. [DOI] [PMC free article] [PubMed] [Google Scholar]
- [179].Wei Z, Xiong X, Guo C, Si X, Zhao Y, He M, Yang C, Xu W, Tang F, Fang X, Pulsed direct current electrospray: enabling systematic analysis of small volume sample by boosting sample economy, Anal. Chem. 87 (22) (2015) 11242–11248. [DOI] [PubMed] [Google Scholar]
- [180].Abouleila Y, Onidani K, Ali A, Shoji H, Kawai T, Lim CT, Kumar V, Okaya S, Kato K, Hiyama E, et al. , Live single cell mass spectrometry reveals cancer-specific metabolic profiles of circulating tumor cells, Cancer Sci. 110 (2) (2019) 697–706. [DOI] [PMC free article] [PubMed] [Google Scholar]
- [181].Ovchinnikova OS, Bhandari D, Lorenz M, Van Berkel GJ, Transmission geometry laser ablation into a non-contact liquid vortex capture probe for mass spectrometry imaging, Rapid Commun. Mass Spectrom. 28 (15) (2014) 1665–1673. [DOI] [PubMed] [Google Scholar]
- [182].Cahill JF, Kertesz V, Quantitation of amiodarone and N-desethylamiodarone in single HepG2 cells by single-cell printing-liquid vortex capture-mass spectrometry, Anal. Bioanal. Chem. 413 (28) (2021) 6917–6927. [DOI] [PubMed] [Google Scholar]
- [183].Pedro L, Rudewicz PJ, Analysis of live single cells by confocal microscopy and high-resolution mass spectrometry to study drug uptake, metabolism, and drug-induced phospholipidosis, Anal. Chem. 92 (24) (2020) 16005–16015. [DOI] [PubMed] [Google Scholar]
- [184].Pan N, Standke SJ, Kothapalli NR, Sun M, Bensen RC, Burgett AW, Yang Z, Quantification of drug molecules in live single cells using the single-probe mass spectrometry technique, Anal. Chem. 91 (14) (2019) 9018–9024. [DOI] [PMC free article] [PubMed] [Google Scholar]
- [185].Duncan MW, Roder H, Hunsucker SW, Quantitative matrix-assisted laser desorption/ionization mass spectrometry, Briefings Funct. Genomics Proteomics 7 (5) (2008) 355–370. [DOI] [PMC free article] [PubMed] [Google Scholar]
- [186].Lu H, Zhang H, Li L, Chemical tagging mass spectrometry: an approach for single-cell omics, Anal. Bioanal. Chem. 415 (28) (2023) 6901–6913. [DOI] [PMC free article] [PubMed] [Google Scholar]
- [187].Li Z, Cheng S, Lin Q, Cao W, Yang J, Zhang M, Shen A, Zhang W, Xia Y, Ma X, et al. , Single-cell lipidomics with high structural specificity by mass spectrometry, Nat. Commun. 12 (1) (2021) 2869. [DOI] [PMC free article] [PubMed] [Google Scholar]
- [188].Zhuang M, Hou Z, Chen P, Liang G, Huang G, Introducing charge tag via click reaction in living cells for single cell mass spectrometry, Chem. Sci. 11 (28) (2020) 7308–7312. [DOI] [PMC free article] [PubMed] [Google Scholar]
- [189].Lan Y, Chen X, Yang Z, Quantification of nitric oxide in single cells using the single-probe mass spectrometry technique, Anal. Chem. 95 (2023) 18871–18879. [DOI] [PubMed] [Google Scholar]
- [190].Liu R, Zhang G, Sun M, Pan X, Yang Z, Integrating a generalized data analysis workflow with the Single-probe mass spectrometry experiment for single cell metabolomics, Anal. Chim. Acta 1064 (2019) 71–79. [DOI] [PMC free article] [PubMed] [Google Scholar]
- [191].Liebal UW, Phan ANT, Sudhakar M, Raman K, Blank LM, Machine learning applications for mass spectrometry-based metabolomics, Metabolites 10 (6) (2020). [DOI] [PMC free article] [PubMed] [Google Scholar]
- [192].Xie YR, Castro DC, Bell SE, Rubakhin SS, Sweedler JV, Single-cell classification using mass spectrometry through interpretable machine learning, Anal. Chem. 92 (13) (2020) 9338–9347. [DOI] [PMC free article] [PubMed] [Google Scholar]
- [193].Liu Q, Martínez-Jarquín S, Zenobi R, Recent advances in single-cell metabolomics based on mass spectrometry, CCS Chem. 5 (2) (2023) 310–324. [Google Scholar]
- [194].Budnik B, Levy E, Harmange G, Slavov N SCoPE-MS, Mass spectrometry of single mammalian cells quantifies proteome heterogeneity during cell differentiation, Genome Biol. 19 (1) (2018) 1–12. [DOI] [PMC free article] [PubMed] [Google Scholar]
- [195].Specht H, Emmott E, Petelski AA, Huffman RG, Perlman DH, Serra M, Kharchenko P, Koller A, Slavov N, Single-cell proteomic and transcriptomic analysis of macrophage heterogeneity using SCoPE2, Genome Biol. 22 (1) (2021) 1–27. [DOI] [PMC free article] [PubMed] [Google Scholar]
Associated Data
This section collects any data citations, data availability statements, or supplementary materials included in this article.
Data Availability Statement
No data was used for the research described in the article.