

Abstract
Background
Numerous studies have investigated links between body mass index (BMI) trajectories and cardiovascular risk, yet discrepancies in BMI measurement duration and timing of the cardiovascular-related outcome evaluation have led to inconsistent findings.
Methods
We included participants from the Swedish birth cohort (BAMSE) and applied latent class mixture modeling to identify BMI trajectories using data of multiple BMI measures (≥ 4 times) from birth until 24-year follow-up (n = 3204). Subsequently, we analyzed the associations of BMI trajectories with lipids (n = 1974), blood pressure (n = 2022), HbA1c (n = 941), and blood leukocytes (n = 1973) using linear regression. We also investigated the circulating levels of 92 inflammation-related proteins (n = 1866) across BMI trajectories.
Results
Six distinct BMI groups were identified, denoted as increasing—persistent high (n = 74; 2.3%), high—accelerated increasing (n = 209; 6.5%), increasing—accelerated resolving (n = 142; 4.4%), normal—above normal (n = 721; 22.5%), stable normal (n = 1608; 50.2%), and decreasing—persistent low (n = 450; 14.1%) BMI groups. The increasing—persistent high and high—accelerated increasing BMI groups had higher levels of total cholesterol [mean difference (95% confidence intervals): 0.30 (0.04–0.56) and 0.16 (0.02–0.31) mmol/L], triglyceride, low-density lipoprotein, hemoglobin A1C [3.61 (2.17–5.54) and 1.18 (0.40–1.98) mmol/mol], and low-density lipoprotein/high-density lipoprotein ratios, but a lower level of high-density lipoprotein than the stable normal BMI group. These two groups also had higher leukocyte cell counts and higher circulating levels of 28 inflammation-related proteins. No increased cardiometabolic markers were observed in the increasing—accelerated resolving BMI group.
Conclusions
Participants with persistently high or accelerated increasing BMI trajectories from birth to young adulthood have elevated levels of cardiometabolic risk markers at young adulthood than those with stable normal BMI. However, a raised BMI in childhood may not be inherently harmful to cardiometabolic health, provided it does not persist into adulthood.
Supplementary Information
The online version contains supplementary material available at 10.1186/s12916-024-03741-0.
Keywords: Bioimpedance, Childhood, Inflammation, Lipid, HbA1c
Background
Obesity has become more prevalent in the past decades [1] and is a strong risk factor for cardiovascular diseases (CVD) [2]. Obesity is considered a state of low-grade chronic inflammation [3] and is associated with insulin resistance [2]. Indeed, obesity may accelerate the atherosclerotic process, that is generally initiated in early life, through these mechanisms [2]. Moreover, excess adiposity can activate the renin–angiotensin–aldosterone and sympathetic nervous systems, contributing to high blood pressure and dyslipidemia [2, 4] Obesity can also result in myocardial fat accumulation and fibrosis, in turn leading to left ventricular remodeling and subsequent left ventricular dysfunction, atrial fibrillation, and heart failure [2].
Body mass index (BMI) is a commonly used measurement to assess adiposity in routine clinical practice and research. Longitudinal information on BMI can capture dynamic shifts over time, such as the age of obesity onset and its progression. Numerous studies have found that certain BMI trajectories are associated with CVD and cardiovascular risk factors [5–8]. Particularly, some cohort studies have focused on BMI trajectories starting from childhood and the association with cardiometabolic risk in later life [9–16].
However, birth weight and BMI development in early life are associated with subsequent CVD [15]. Thus, BMI trajectories from birth are presumably sensitive to identifying individuals with a high risk of CVD in later life. Although several previous studies have attempted to assess BMI trajectories from birth [9–13], outcomes were typically assessed in early adolescence when cardiometabolic profiles often have not yet exhibited significant differences. In addition, most prior studies had limited sample sizes, which were not powered enough to identify specific BMI trajectories and their associations with subsequent outcomes. Therefore, there is a clear need for studying BMI trajectories from birth throughout childhood and their association with cardiovascular risk in a large longitudinal cohort with available information throughout childhood, starting from birth.
To this end, we conducted a longitudinal cohort with multiple BMI measurements from birth and a range of cardiometabolic profiles assessed at early adulthood to investigate BMI trajectories from birth and the association with cardiometabolic risk. In addition, we performed a comprehensive literature review on published studies to date that applied latent class group modeling or equivalents to identify BMI trajectories and assessed associations with cardiovascular risk in early or middle adulthood.
Methods
Study population
The Swedish population-based birth BAMSE (Swedish abbreviation for Child [Barn], Allergy, Milieu, Stockholm, Epidemiological) cohort recruited 4089 infants from inner-city, urban, and suburban districts of Stockholm, Sweden, between February 1994 and November 1996 and followed them from birth until 26 years (with questionnaires and/or clinical visit follow-up at 1, 2, 4, 8, 12, 16, 24, and 26 years) [17]. The study was approved by the Regional Ethical Review Board in Stockholm (Ref 2016/1380–31/2). The parents and participants signed their informed consent, under the Helsinki Declaration.
Assessment of body mass index
We retrieved information on birth weight and length from the Swedish Medical Birth Register and collected weight and height from school and healthcare records at ages around 6 (± 2 weeks), 12, and 18 months (± 4 weeks), as well as 2, 3, 4, 5 (± 6 months), 7, 10, and 12 years (− 6 to + 11 months) [18]. Moreover, clinical assessments, including BMI, were carried out at around age 4, 8, 16, and 24 years following standardized protocols at each visit by trained nurses during the follow-up. Furthermore, self-reported weight and height data were also collected at recruitment and ages 12, 16, and 24 years. The hierarchy for utilizing height and weight information prioritized data from clinical investigations and the Swedish Medical Birth Register, followed by school and healthcare records, with self-reported data being considered last (Additional file 1: Table S1).
BMI was calculated as weight in kilograms divided by the square of height in meters (kg/m2). Subsequently, it was standardized into z-scores employing the World Health Organization child growth standards for ages 0–5 years [19] and growth reference data for those aged 5–19 years [20]. At the age of 24 years, BMI was transformed into sex-specific BMI z-scores based on the observed values within our cohort. We only included participants with at least four BMI measurements in this analysis, leading to a total of 3204 participants (Additional file 2: Fig. S1) with a mean of 10.5 BMI measurements (interquartile range: 8–13). Besides, we conducted a sensitivity analysis to compare BMI differences between participants with and without BMI data at 24 years of age. Additionally, bioimpedance measurements were conducted using the Tanita MC 780 body composition monitor (Tanita Corp., Tokyo, Japan) at the clinical follow-up of age 24 and 26 years, following the manufacturer’s guidelines (n = 1958 and n = 931, respectively). We derived fat mass index (FMI) and fat-free mass index (FFMI), calculated as masses in kilograms divided by the square of height in meters (kg/m2).
Assessment of cardiometabolic profiles
Resting systolic and diastolic blood pressure was measured at 24 years of age (n = 2022) by trained nurses using standardized protocols and an automatic blood pressure meter (Omron HBP–1300, Omron Electronics, Kyoto, Japan). Blood pressure was assessed three times for each participant, with a 1-min pause between measurements. The analysis incorporated the mean blood pressure derived from all three measurements for each participant.
Blood samples collected at the clinical follow-up at age 24 years were used to quantify blood lipid levels by Karolinska University Laboratory (Stockholm, Sweden), including triglyceride (TG), total cholesterol, low-density lipoprotein (LDL), and high-density lipoprotein (HDL) (n = 1974). The levels of 92 inflammation-related proteins (Additional file 1: Table S2) were analyzed in ethylenediaminetetraacetic acid (EDTA) plasma samples from 1866 participants included in the current study (Inflammation Panel version 95,302, Olink Proteomics, Uppsala, Sweden). Details of the protein measurement have been described previously [17]. Additionally, we also assessed hemoglobin A1C (HbA1c) levels in blood among 941 participants at the clinical follow-up of age 26 years at Karolinska University Laboratory (Stockholm, Sweden). In addition, clinical-related thresholds were utilized to delineate heightened cardiometabolic risks (details in Additional file 3) [21–23].
Statistical analyses
Latent BMI trajectories identification
Latent class mixture modeling (LCMM) was employed to investigate the longitudinal progression of BMI z-scores from birth to age 24 years. Several criteria, such as the mean absolute error loss, the Bayesian Information Criterion (BIC), log-likelihood, and the values of mean posterior class membership probabilities, and clinical plausibility were used to select the BMI trajectories. Additional file 3 offers full details regarding the methodologies employed for model construction and the determination of the optimal number of trajectories [24, 25].
Associations of BMI z-scores trajectories with cardiometabolic profiles
Covariates were compared between different BMI z-scores trajectories using t-test/ANOVA, Kruskal–Wallis rank sum test, chi-squared tests, and Fisher’s exact test as appropriate. We examined the associations of BMI trajectories with blood pressure, blood lipid, leukocytes, and HbA1c using multivariable linear regression models (details in Additional file 3) [26]. Besides, logistic regression was used to examine the association of BMI trajectories with any cardiometabolic risk. In addition, we performed a stratified analysis by sex to assess the differences in the associations between males and females. Sensitivity analyses were conducted for cardiometabolic profiles in early adulthood, incorporating BMI z-scores at birth, BMI z-scores at the 24 years, or the fat mass index into the regression models, respectively.
Protein concentrations were normalized based on inverse normal transformation [27]. We first compared plasma inflammation-related protein levels across BMI trajectories using ANOVA. We then employed multivariable linear regression to analyze the associations of BMI trajectories with proteins with significant associations with BMI trajectories (p < 0.05) (Additional file 1: Table S3). Multiple comparisons were corrected by applying Benjamini-Hochberg’s method [28]. We examined the protein associated with cardiometabolic profiles for their expression patterns in tissues and cells [29] by using the Human Protein Atlas (https://www.proteinatlas.org).
All the analyses were performed using R 4.2.2.
Results
BMI trajectories from birth to young adulthood
Participants included in the BMI trajectory analysis showed, compared to those excluded, higher parental education levels, less maternal smoking during pregnancy, older maternal delivery age, lower parity before the index person was born, and more exclusive breast feeding (Additional file 1: Table S4). To explore potential BMI trajectories in BAMSE, we initially compared models with various terms using mean absolute error loss from cross-validation. We found that LCMM models with quadratic terms showed greater predictive accuracy compared to linear ones, functioning similarly to those with cubic terms (Additional file 1: Table S5). Subsequently, we identified distinct BMI trajectories based on criteria such as BIC, log-likelihood, mean posterior class membership probabilities > 0.7, and clinical plausibility (Additional file 1: Table S6). Consequently, our analysis revealed six trajectories, which included (1) the increasing—persistent high BMI group (n = 74 [2.3%])—BMI z-score was normal in early life, increased during childhood, and kept high in adolescence; (2) the high—accelerated increasing BMI group (n = 209 [6.5%])—BMI z-score was high at early life, kept high during childhood, and increased during adolescence; (3) the increasing—accelerated resolving BMI group (n = 142 [4.4%])—BMI z-score was low at early life, increased sharply during childhood, but decreased in adolescence; (4) the normal—above normal BMI group (n = 721 [22.5%])—BMI was normal at the early life and increased above the average level but within the normal range throughout childhood and adolescence; (5) the stable normal BMI group (n = 1608 [50.2%])—BMI z-score was consistently normal from birth until young adulthood; and (6) the decreasing—persistent low BMI group (n = 450 [14.1%])—BMI z-score was normal at the early life and decreasing to lower than average and keep low in adolescence (Fig. 1 for BMI z-scores, Additional file 2: Fig. S2 for raw BMI values, and Additional file 1: Table S7 for statistics). In the sensitivity analysis, participants with BMI data at 24 years showed lower BMI z-scores at specific time points compared to those without BMI data at 24 years. These differences were observed at 12 and 16 years in the increasing—persistent high BMI group; at 6 months, 1 year, 12 years, and 16 years in the high—accelerated increasing BMI group; and at 6 months, 1 year, and 16 years in the normal—above normal BMI group (Additional file 2: Fig. S3). Similar patterns of such differences were observed among BMI values (Additional file 2: Fig. S4).
Fig. 1.

Body mass index trajectories from birth to young adulthood in the BAMSE cohort. Body mass index trajectories were identified through latent class mixture models using z-score of body mass index. The dots show the mean values for body mass index z-scores around each follow-up point. The lines show the loess-smoothed body mass index trajectories for the six identified trajectory groups. The statistics (mean and standard deviation of BMI in each group) of this figure are presented in Table S7. BMI, body mass index
Associations of BMI trajectories with cardiometabolic profiles in young adulthood
Higher proportion of males was observed in the increasing—accelerated resolving BMI group and the normal—above normal BMI group than in the stable normal BMI group. Participants in the increasing—persistent high, increasing—accelerated resolving, and normal—above normal BMI groups were more likely to be born prematurely, by cesarean section, and to mothers with hypertension during pregnancy than those in the stable normal BMI group. Participants in the decreasing—persistent low BMI group were more likely to be born to mothers with low BMI at early pregnancy than those in the stable normal BMI group, whereas the other groups had mothers with higher BMI at early pregnancy. Additionally, participants in the high—accelerated increasing, increasing—accelerated resolving, and normal—above normal BMI groups were more likely to be born to mothers who smoked during early pregnancy (Table 1). Similar patterns of such differences between BMI subgroups were observed among males and females (Additional file 1: Tables S8 and S9). Participants in the increasing—persistent high, high—accelerated increasing, and increasing—accelerated resolving BMI group had higher FMI and FFMI in young adulthood than those in the stable normal group (Additional file 1: Table S8). In contrast, participants in the decreasing—persistent low BMI group had lower levels of these indicators than the stable normal BMI group. Similar patterns were observed when males and females were analyzed separately (Additional file 1: Table S10).
Table 1.
Characteristics of study participants according to body mass index trajectories
| Characteristics | Increasing—persistent high (n = 74) | High—accelerated increasing (n = 209) | Increasing—accelerated resolving (n = 142) | Normal—above normal (n = 721) | Stable normal (n = 1608) | Decreasing—persistent low (n = 450) | p |
|---|---|---|---|---|---|---|---|
| Sex | * | *** | *** | < 0.001 | |||
| Male | 45 (60.8%) | 95 (45.5%) | 92 (64.8%) | 407 (56.4%) | 764 (47.5%) | 202 (44.9%) | |
| Female | 29 (39.2%) | 114 (54.5%) | 50 (35.2%) | 314 (43.6%) | 844 (52.5%) | 248 (55.1%) | |
| Preterm birth | 10 (13.5%)** | 7 (3.3%) | 26 (18.3%)*** | 48 (6.7%) | 80 (5.0%) | 11 (2.4%)* | < 0.001 |
| Birth weight | |||||||
| Kilogram | 3.33 ± 0.63** | 3.70 ± 0.46*** | 3.10 ± 0.76*** | 3.50 ± 0.56 | 3.53 ± 0.54 | 3.68 ± 0.51*** | < 0.001 |
| Z-scores | − 0.03 ± 1.40*** | 0.80 ± 0.91*** | − 0.58 ± 1.73*** | 0.37 ± 1.17 | 0.46 ± 1.13 | 0.78 ± 1.00*** | < 0.001 |
| Cesarean section | 15 (20.3%)* | 29 (13.9%) | 31 (21.8%)*** | 108 (15.0%)** | 174 (10.8%) | 52 (11.6%) | < 0.001 |
| Exclusive breast feeding ≥ 4 months | 59 (81.9%) | 161 (78.9%) | 103 (74.6%) | 561 (79.6%) | 1288 (81.5%) | 375 (84.5%) | 0.115 |
| Current smoking at, yes | |||||||
| 24 years of age | 11 (15.5%) | 47 (24.5%) | 20 (20.4%) | 116 (19.4%) | 276 (20.5%) | 63 (16.9%) | 0.319 |
| 26 years of age | 1 (6.2%) | 8 (14.8%) | 2 (7.4%) | 21 (10.1%) | 68 (13.8%) | 12 (7.9%) | 0.327# |
| Parental education | *** | 0.013 | |||||
| Primary school/high school | 35 (47.3%) | 121 (57.9%) | 65 (45.8%) | 327 (45.4%) | 707 (44.0%) | 202 (44.9%) | |
| University | 39 (52.7%) | 88 (42.1%) | 77 (54.2%) | 393 (54.6%) | 899 (56.0%) | 248 (55.1%) | |
| Maternal characters during pregnancy | |||||||
| Smoking during pregnancy | 10 (13.7%) | 40 (19.1%)*** | 22 (15.5%) | 100 (13.9%)* | 172 (10.7%) | 45 (10.0%) | 0.003 |
| Age at delivery | 30.83 ± 5.68 | 29.72 ± 4.67* | 31.07 ± 4.70 | 30.67 ± 4.65 | 30.45 ± 4.39 | 30.47 ± 4.29 | 0.078 |
| BMI at early pregnancy | 26.51 ± 4.65*** | 25.10 ± 4.26*** | 24.32 ± 3.87*** | 23.42 ± 3.09*** | 22.41 ± 2.80 | 21.75 ± 2.73*** | < 0.001 |
| Diabetes mellitus | 2 (2.8%) | 0 (0.0%) | 4 (2.9%) | 13 (1.8%) | 14 (0.9%) | 7 (1.6%) | 0.029# |
| Hypertension | 5 (6.9%)* | 6 (2.9%) | 10 (7.2%)** | 25 (3.5%) | 42 (2.7%) | 5 (1.1%) | 0.002 |
| Parity before the index person was born | * | 0.011 | |||||
| One | 17 (23.6%) | 64 (31.1%) | 40 (29.0%) | 195 (27.5%) | 479 (30.4%) | 165 (37.3%) | |
| Two or more | 11 (15.3%) | 25 (12.1%) | 8 (5.8%) | 72 (10.2%) | 134 (8.5%) | 35 (7.9%) | |
BMI Body mass index. The results were illustrated with mean ± standard deviation or numbers (proportions), respectively
* p < 0.05
** p < 0.01
*** p < 0.001 for comparisons between each trajectory group and the stable normal group
#Based on Fisher’s exact test
Participants in the increasing—persistent high or high—accelerated increasing BMI groups had higher levels of total cholesterol [mean difference (MD) (95% confidence intervals (CI)): 0.30 (0.04–0.56) and 0.16 (0.02–0.31) mmol/L], TG [0.48 (0.25–0.76) and 0.32 (0.21–0.45) mmol/L], LDL [0.29 (0.05–0.53) and 0.31 (0.18–0.45) mmol/L], LDL/HDL ratio [0.48 (0.23–0.74) and 0.61 (0.46–0.75)], TG/HDL ratio [0.51 (0.30–0.79) and 0.42 (0.31–0.56)], and HbA1c [3.61 (2.17–5.54) and 1.18 (0.40–1.98) mmol/mol] but a lower level of HDL [− 0.30 (− 0.39 to − 0.21) and − 0.31 (− 0.37 to − 0.26) mmol/L] than those in the stable normal BMI group (Fig. 2 and Additional file 1: Table S11). Besides, there is decreased TG [− 0.14 (− 0.22, − 0.03) mmol/L] in the participants with increasing—accelerated resolving BMI group. There was no significant difference in these clinical chemistry measurements comparing the normal—above normal and the decreasing—persistent low BMI groups with the stable normal BMI group. Compared to the stable normal BMI group, the increasing—persistent high BMI group had higher diastolic blood pressure [4.42 (1.80–6.98) mmHg] and the high—accelerated increasing BMI group had higher systolic blood pressure [2.51 (0.37–4.84) mmHg]. In contrast, the decreasing—persistent low BMI group had lower systolic blood pressure. The results remained similar in males and females (Additional file 1: Tables S12 and S13). There was no substantial change in the associations observed for HDL and HbA1c in the increasing—persistent high BMI group and TG in the increasing—accelerated resolving BMI group, as well as for total cholesterol, HDL, LDL/HDL ratio, and TG/HDL ratio in the high—accelerated increasing BMI group, after accounting for the FMI in young adulthood, while most other associations shifted towards the null (Additional file 2: Fig. S5). Besides, similar trend changes were observed in models that accounted for BMI z-scores at 24 years (Additional file 1: Table S14), while additionally adjusting for BMI z-scores at birth did not change the associations (Additional file 1: Table S15). Furthermore, the increasing—persistent high and high—accelerated increasing groups also exhibited heightened clinical-related cardiometabolic risks (odds ratio = 4.45 (2.17–9.14) and 3.42 (2.18–5.38), respectively, Additional file 2: Fig. S6).
Fig. 2.

Association of BMI trajectories with blood pressure, blood lipids, and HbA1c at young adulthood determined by linear regression. The stable normal BMI group was the reference group. The y-axis displays the β coefficients along with their corresponding 95% confidence intervals. The models were adjusted for age, sex, smoking status, parental education, maternal smoking during pregnancy, maternal body mass index at early pregnancy, maternal hypertension, parity before the index person was born, and cesarean section. The statistics of this figure are presented in Table S11. HDL, high-density lipoprotein; LDL, low-density lipoprotein; HbA1c, hemoglobin A1C; TG, triglycerides. *: Significant difference between stable normal and other groups (p < 0.05)
Participants in the increasing—persistent high and high—accelerated increasing BMI groups had a higher leukocyte cell count in young adulthood than those in the stable normal BMI group (Additional file 1: Table S16). These two groups also had higher levels of 28 inflammation-related proteins than the stable normal BMI group (Fig. 3 and Additional file 1: Table S17). Besides, several of these proteins exhibited high or moderate expression levels in the heart muscle, smooth muscle, and adipose tissue (Additional file 2: Fig. S7).
Fig. 3.
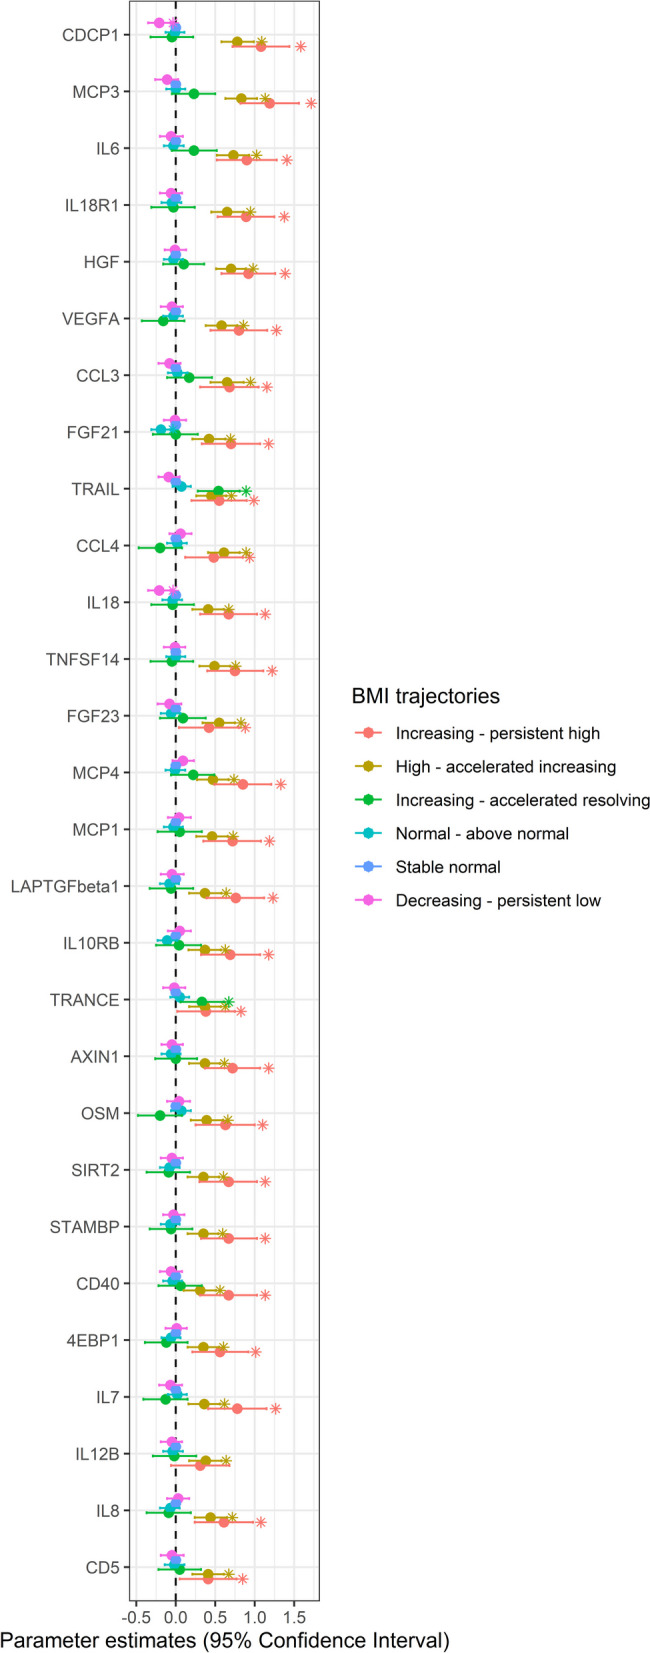
Association of BMI trajectories with circulating inflammatory proteins determined by linear regression. The stable normal BMI group was the reference group. The x-axis displays the β coefficients along with their corresponding 95% confidence intervals. The models were adjusted for sex, smoking status, parental education, maternal smoking during pregnancy, maternal BMI at early pregnancy, maternal hypertension, parity before the index person was born, and cesarean section. The statistics of this figure are presented in Table S17. *: Significant difference between stable normal and other groups (p < 0.05)
Discussion
In our longitudinal birth cohort study, we identified six distinct BMI trajectories from birth until young adulthood, namely the increasing—persistent high, high—accelerated increasing, increasing—accelerated resolving, normal—above normal, stable normal, and decreasing—persistent low BMI group. We found that the increasing—persistent high and the high—accelerated increasing BMI groups had markedly higher levels of several blood lipids (total cholesterol, TG, LDL, LDL/HDL ratio, TG/HDL ratio) and HbA1c but a lower level of HDL than the stable normal BMI group. The associations for HDL, TG/HDL ratio, and HbA1c were still observed after adjusting for FMI in young adulthood. Both the increasing—persistent high and high—accelerated increasing BMI groups had higher leukocyte cell count and higher levels of a range of inflammation-related proteins. There was no significant difference in the clinical cardiometabolic profiles in young adulthood between the increasing—accelerated resolving group and the stable normal BMI group.
Comparison with previous studies
Previous studies showed diverse BMI trajectories from birth or young age until later life. In our literature review (Table 2 and Additional file 1: Table S18), we included studies that (1) applied latent class group modeling or equivalents to identify BMI trajectories from childhood, (2) classified study individuals by BMI trajectories, and analyzed the associations with cardiovascular risk in later life, and (3) outcomes were measured no later than middle age (40–50 years), leading to a total of 31 eligible studies.
Table 2.
Summary of previous studies on the association of BMI trajectories in childhood with cardiovascular risk in young adulthood
| Study; country | Sample size | BMI assessment points | Measurement time: outcomes | Summary of the results | |
|---|---|---|---|---|---|
| BMI trajectories | Conclusions | ||||
| Birth cohort | |||||
| [10] South Korea | 249 | Seven times: at birth, 3, 5, 7, 8, 9, 10, 11, 12 years | Age 13–15 years: hs-CRP, IL-6, and CMR score | Three trajectories: low-stable, moderate-stable, and high-stable increasing BMI | • Compared to the group with low-stable increasing BMI, the other two groups had higher levels of hs-CRP, IL-6, and CMR score |
| [30] USA | 322 | Six times: at birth, 2, 3, 4.5, 6, and 7.5 years | Age 7.5 years: waist circumference, SBP, DBP, HbA1c, HDL, and TC | Three trajectories: low-stable, high-stable, and increasing BMI |
• Compared to the group with low-stable BMI, those with high-stable or increasing BMI had higher SBP and waist circumference but lower levels of HDL • No difference was observed for other outcomes |
| [31] Spain | 489 | Seven times: at birth, 0.5, 1, 2, 4, 7, and 9 years | Age 11 years: SBP, DBP, PWV, and microvascular function (central retinal arteriolar/venular equivalent) | Five trajectories: high birth size and accelerated gain, high birth size and slow gain, low birth size and accelerated gain, average birth size and slow gain, and low birth size and slow gain | • Compared to children with average birth size and slow BMI gain, those with low birth size and accelerated BMI gain had higher SBP, DBP, and PWV, and those with high birth size and accelerated BMI gain had higher SBP |
| [12] Guatemala | 856 | 3–22 times from age 1 month to 42 years | Age 37–54 years: elevated triglycerides (≥ 150 mg/dL), low HDL (< 50 mg/dL for women and < 40 mg/dL for men), diabetes (plasma glucose ≥ 126 mg/dL, post-challenge glucose ≥ 200 mg/dL, or use of diabetes medication), hypertension, and metabolic syndromea |
For men, two trajectories: low and medium/high BMI For women, two trajectories: low and high BMI |
• In men, the trajectory of medium/high BMI had higher odds of elevated triglycerides and low HDL than the trajectory of low BMI. No observation was observed for other outcomes • In women, no difference in the studied outcomes was observed between the trajectories of high and low BMI |
| [32] Australia | 1288 | Six times: every 2 years from age 0–1 to 11–12 years | Age 11–12 years: retinal vascular caliber | Five trajectories: low, average, always high, always very high, and low to high BMI |
• Compared to the trajectory of average BMI, the trajectory of always very high BMI had narrower retinal vascular caliber • No difference was found for other trajectories compared to the trajectory of average BMI |
| [33] Australia | 190 | Multiple times from birth to 14 years | Age 14 years: waist circumference, TC, HDLC, LDL, triglycerides, apolipoprotein A1, apolipoprotein B, Apo A1/B, SBP, DBP, cIMT, and PWV | Three trajectories: normal, early-rising, and late-rising BMI | • Compared to the trajectory of normal BMI, both trajectories of early-rising and late-rising BMI had higher levels of Apo B, Apo A1/B, and SBP and a lower level of Apo A1 while the level of HDL was higher in late-rising and lower in early-rising BMI trajectory |
| [34] Australia | 1197 | Eight times: at birth, 1, 2, 3, 5, 8, 10, and 14 years | Age 14 years: insulin and homeostasis model assessment of insulin resistance | Seven trajectories: very low stable, moderately low stable, optimal normal growth, rising to moderate, falling to moderate, rising to high, and stable high BMI |
• In boys, compared to the trajectory of optimal normal growth, the trajectories of stable high, rising to high, and rising to moderate BMI had higher levels of insulin and insulin resistance, while the trajectory of very low stable BMI had lower levels of insulin and insulin resistance • In girls, compared to the trajectory of optimal normal growth, the trajectories of stable high and rising to high BMI had higher levels of insulin and insulin resistance |
| [35] Canada | 1166 | At least one time: up to twice a year from 0 to 2 years and every year until age 5 years | Age 3–5 years: cardiometabolic riskb | Four trajectories: catch-up, stable high, stable low, and rapid accelerating BMI | • Compared to children with stable low BMI, those with the trajectories of catch-up, stable high, and rapid accelerating BMI had a higher cardiometabolic risk score |
| [36] Ethiopia | 453 | Median nine times: at birth, 1.5, 2.5, 3.5, 4.5, 6, and 12 months, 1.5, 2, 3, 4, and 5 years | Age 5 years: glucose, HbA1c, insulin, C-peptide, HOMA-IR, TC, LDL, HDL, triglyceride, SBP, DBP, waist circumference, fat mass, and fat-free mass | Four trajectories: stable low, normal, rapid catch-up to high, and slow catch-up to high BMI |
• Children with stable low BMI had lower LDL, HDL, waist circumference, fat mass, and fat-free mass than those with normal BMI • Children with rapid catch-up to high BMI had higher C-peptide, triglyceride, waist circumference, fat mass, and fat-free mass than those with normal BMI • Children with slow catch-up to high BMI had higher fat mass than those with normal BMI |
| [11] Singapore | 1170 | Eight times: at birth, 3, 6, 9, 12, 15 and 18 months, and 2 years | Age 5 years: waist-to-height ratio, the sum of skinfolds, fat-mass index, lean-mass index, SBP, and DBP | Four trajectories: stable low, normal, and stable high BMI, and rapid BMI gain after 3 months |
• Children with stable low BMI had lower waist-to-height ratio, sum of skinfolds, fat-mass index, lean-mass index, SBP, and DBP than those with normal BMI • Children with stable high BMI had higher waist-to-height ratio, sum of skinfolds, and lean-mass index than those with normal BMI • Children with rapid BMI gain after 3 months had higher waist-to-height ratio, sum of skinfolds, and fat-mass index than those with normal BMI |
| [9]; Australia | 187 | 11–16 times: at birth, 2 weeks, 2, 4, 8, 12, 18, and 24 months, 6 times between 4 and 6.5 years, as well as 10 and 14 years | Age 14 years: SBP, DBP, augmentation index, PWV, carotid intima-media thickness, and retinal arteriole-to-venule ratio | Three trajectories: consistently overweight, high normal, and low normal BMI |
• Children with consistently overweight had higher augmentation index than those with low normal BMI in early childhood • No associations were observed for any other outcomes |
| Others | |||||
| [37] USA | 338 | Six times during ages 2–11 years | Age 7–11 years: CRP, leptin, adiponectin, SBP, DBP, HbA1C, TC, HDL, LDL, triglycerides, triglyceride/HDL ratio, fasting glucose, fasting insulin, oxLDL, PWV, CMR scores | Two trajectories: moderate-decrease and marked-increase BMI | • Compared to children with moderate-decrease BMI, those with marked-increase BMI had higher levels of CRP, leptin, triglycerides, triglyceride/HDL ratio, HbA1C, fasting glucose and insulin, SBP, DBP, and overall CMR score, as well as lower levels of adiponectin and HDL |
| [17] China | 2167 | At least three times during age 6–48 years | Age 36–48 years: PWV and cIMT | Three trajectories: low-, moderate-, and high-increasing BMI | • Compared to the trajectory of low-increasing BMI, both trajectories of moderate- and high-increasing BMI had higher levels of PWV and cIMT |
| [15] Denmark | 13,438 | At two times during ages 6–15 years | Age 30–70 years: type 2 diabetes and coronary heart disease | Five parallel trajectories with consistently increasing BMI |
• Individuals with trajectories of higher BMI had a higher risk of type 2 diabetes than those with the trajectory of the lowest BMI during childhood • The association was not observed for coronary heart disease |
| [38] China | 24,426 | At least four times during age 6–17 years | Age 12–17 years: hypertension | Four trajectories: low-, medium-, high-, and highest-increasing BMI | • Compared to the trajectory of medium-increasing BMI, the trajectory of low-increasing BMI had a lower odd of hypertension while the trajectories of high- and highest-increasing BMI had a higher odd of hypertension |
| [8] China | 1825 | At least three times during age 6–48 years | Age 36–48 years: albuminuria (urinary albumin-to-creatinine ratio ≥ 30 mg/g) | Three trajectories: low-, moderate-, and high-increasing BMI | • The trajectory of high- but not moderate-increasing BMI had a higher odd of albuminuria than the low-increasing BMI trajectory |
| [39] China | 17,816 | At least eight times during age 7–18 years | Age 16–18 years: elevated blood pressure (SBP ≥ 130 mmHg or DBP ≥ 80 mmHg) | Four trajectories: constant low, high-decreasing, low-rising, and constant high BMI | • Compared to the trajectory of constant low BMI, a higher risk of elevated blood pressure was observed in the other trajectories among either boys or girls |
| [40] Australia | 1312 | Four times: at ages 14, 17, 20, and 22 years | Age 14, 17, 20, and 22 years: CRP | Four trajectories: low, medium, medium-increasing, and high-increasing BMI | • Individuals in the high-increasing BMI trajectory were more likely to be in the group of stable-high CRP than other BMI trajectories |
| [41] China | 1907 | Three to six times from age 5–19 years | Age 14–22 years: hypertension | Three trajectories: normal increasing, resolving, and high increasing BMI |
• The trajectory of high increasing BMI had a higher risk of hypertension than that of normal increasing BMI • No difference was observed between trajectories of normal increasing and resolving BMI |
| [42] UK | 3549 | Ten times at ages 7, 8, 9, 10, 11, 12, 13, 15, 17, and 24 years | Age 24 years: SBP, DBP, TC, HDL, LDL, triglycerides, insulin, glucose, CRP, cIMT, PWV, fat mass, trunk fat mass, lean fat, trunk lean fat, peripheral lean fat, relative wall thickness, left ventricular mass indexed to height in m3, peak mitral annular velocity in systole, early/late mitral inflow velocity (E/A ratio), and early mitral inflow velocity/mitral annular early diastolic velocity (E/e′ ratio) | Six trajectories: normal weight (nonlinear), normal weight (linear), normal weight increasing to overweight, normal weight or overweight, normal weight increasing to obesity, and overweight or obesity |
• Compared to the trajectory of normal-weight (nonlinear), the trajectory of normal-weight (linear) had more trunk fat, higher blood pressures, higher left ventricular mass indexed to height in m3, and insulin. The differences were more pronounced for the trajectories of normal-weight-or-overweight and normal-weight-increasing-to-overweight • Compared to the trajectory of normal-weight (nonlinear), the trajectories of overweight-or-obesity and normal-weight-increasing-to-obesity had worse levels of almost all outcomes |
| [43] China | 1872 | At least two times during age 6–18 years | Age 18–37 years: hypertension | Five trajectories: low slow-increasing, low moderate-increasing, low rapid-increasing, moderate-increasing, and elevated-decreasing BMI | • Compared with the trajectory of low slow-increasing BMI, the groups with low moderate-increasing, low rapid-increasing, and moderate-increasing BMI had a higher risk of hypertension |
| [44] Taiwan | 1387 | At least two times during the age 13–18 years | Early adulthood (mean 33 years): diabetes | Five trajectories: stable weight, rapid decrease then stable, persistent decrease, slow decrease, and increased then stable | • No significant difference in the risk of diabetes was observed across the five BMI trajectories |
| [14] Denmark | 2466 | At least 3 times during age 6–14 years | Mean age 40 years: waist circumference, SBP, DBP, triglycerides, HDL, LDL, total cholesterol, remnant cholesterol, lipoprotein(a), apolipoprotein B, HbA1c, and self-reported diabetes | Five parallel trajectories with consistently increasing BMI during childhood | • Compared to the trajectory with the lowest BMI throughout childhood, the risks of waist circumference and self-reported diabetes were higher in the top three trajectories with higher BMI but were not different from that in the trajectory with the second lowest BMI. Such a pattern was not observed in other cardiovascular risk factors |
| [45] Australia | 1811 | Five times: every 2 years between ages 2 to 3 and 10 to 11 years | Age 11 to 12 years: CMR scores, carotid-femoral pulse wave velocity, and carotid intima-media thickness | Five trajectories: low, healthy, low to high, high, and always very high BMI | • Compared to the trajectory of low BMI, the trajectories of low to high, high, and always very high BMI had higher levels of CMR scores, carotid-femoral pulse wave velocity, and carotid intima-media thickness |
| [46] China | 9286 | At least eight times during age 8–18 years | Age 16–18 years: hypertension | Four trajectories: low, middle, high, and very high increasing BMI | • Compared to children with middle increasing BMI, those with low increasing BMI had a lower risk of hypertension, whereas those with high or very high increasing BMI had a higher risk of hypertension |
| [47] China | 2839 | At 3 times during ages 6–48 years | Age 18–48 years: type 2 diabetes, hypertension, high-risk lipid levels, high-risk cIMT, high-risk baPWV, and left ventricular hypertrophy | Three trajectories: low-, moderate-, and high-increasing BMI (trajectories of low- and moderate-increasing BMI were parallel) | • Both moderate- and high-increasing groups had a higher risk of hypertension, type 2 diabetes, high-risk total cholesterol, and high-risk HDL |
| [48] Germany | 689 | At least three times during age 4–18 years | Age 18–39 years: SBP, DBP, triglyceride, HDL, FPG, CRP, IL‐6, IL‐18, adiponectin, chemerin, and leptin |
For girls, three trajectories: low-, middle-, and high-normal weight For boys, four trajectories: low-, middle-, and high-normal weight, and overweight |
• BMI trajectories were associated with HDL and IL-18 in males and with DBP and IL-6 in females |
| [16] Finland | 2631 | Mean five times during age 6–49 years | Age 34–49 years: type 2 diabetes, high-risk lipid levels, hypertension, and high cIMT | Six trajectories: stable normal, resolving, progressively overweight, progressively obese, rapidly overweight/obese, and persistent increasing overweight/obese | • The trajectories with worsening or persisting obesity had a higher risk of type 2 diabetes, hypertension, high-risk lipid, and high cIMT in adulthood compared to the trajectory with consistently normal BMI |
| [49] USA | 626 | 3–12 times during age 5–18 years | Mean age 24 years: intima-media thickness and left ventricular mass index | Three trajectories: normal, moderate-increasing, and high-increasing BMI | • Compared to the group of normal BMI trajectory, those with moderate- and high-increasing BMI had higher intima-media thickness and left ventricular mass index |
| [50] Portugal | 1763 | Three times: age 13, 17, and 21 years | Age 21 years: SBP, DBP, insulin resistance, triglycerides, HDL, and LDL | Three trajectories: normal, high-declining, and high-increasing BMI |
• Compared to the trajectory of normal BMI, the trajectory of high-increasing BMI had higher levels of SBP, DBP, insulin resistance, triglycerides, and LDL but a lower level of HDL • The trajectory of high-declining BMI had a lower level of HDL than the trajectory of normal BMI |
| [51] South Africa | 1824 | At least two times during age 5–18 years | Age 17–18 years: SBP, DBP, MAP, and elevated blood pressure (for those under 18 years old: SBP or DBP equal or over 90th percentile of the study individuals; for those at or over 18 years old: prehypertension [SBP ≥ 120 mmHg or DBP ≥ 80 mmHg] or hypertension) |
For girls, four trajectories: normal weight, late onset overweight, early onset obese to overweight, and early onset obese to morbidity obese For boys, three trajectories: normal weight, early onset overweight to normal weight, and early onset overweight to obese |
• In girls, compared to the trajectory of normal weight, the trajectories of early onset obese to overweight and early onset obese to morbidity obese had higher levels of SBP, DBP, and MAP, as well as a higher odd of elevated blood pressure • In boys, compared to the trajectory of normal weight, the trajectory of early onset overweight to obese had higher levels of SBP, DBP, and MAP |
baPWV brachial-ankle pulse wave velocity, BMI Body mass index, cIMT carotid intima-media thickness, CMR metabolic syndrome risk, DBP Diastolic blood pressure, FPG Fasting plasma glucose, HbA1c Hemoglobin A1c, HDL High-density lipoprotein, HOMA-IR Homeostasis model assessment of insulin resistance, insulin (μU/mL) × glucose (mmol/L)/22.5, hs-CRP High-sensitivity C-reactive protein, LDL Low-density lipoprotein, MAP Mean arterial pressure, oxLDL oxidized low-density lipoprotein, PWV Pulse wave velocity, SBP Systolic blood pressure, TC Total cholesterol
aHypertension was defined as systolic blood pressure ≥ 130 mmHg and/or diastolic blood pressure ≥ 80 mmHg and/or anti-hypertensive medication use. Metabolic syndrome was defined if people had at least three following conditions: (1) abdominal obesity (waist circumference > 88 cm for women; > 102 cm for men); (2) fasting glucose ≥ 100 mg/dL or diabetes medication use; (3) triglycerides ≥ 150 mg/dL or statin use; (4) high density lipoprotein < 40 mg/dL in men or < 50 mg/dL in women; and (5) systolic blood pressure ≥ 130 mmHg, diastolic blood pressure ≥ 85 mmHg, and/or hypertension medication use
bCardiometabolic risk was defined as the sum of age- and sex-standardized waist circumference, systolic blood pressure, blood tests for glucose, log-triglycerides, and the negative of high-density lipoprotein, divided by the square root of 5
Three trajectories, i.e., groups of stable BMI within the normal range, persistently high BMI, and persistently low BMI over time, are generally observed. It is suggested by some [13, 15, 16, 39], though not all [9, 14], of them that compared to the group of stable BMI within the normal range over time, the persistently high BMI group had higher risks of hypertension and diabetes, higher levels of systolic blood pressure (SBP), diastolic blood pressure (DBP), HbA1c, glucose, insulin, insulin resistance, total cholesterol, TG, LDL, and ApoB, as well as a lower level of HDL. In contrast, the persistently low BMI group had a lower risk of hypertension and lower levels of SBP, DBP, LDL, and insulin [11, 13]. These findings are predominantly observed in studies with follow-up from early adulthood up to middle age, while studies with follow-up limited to adolescence, particularly those birth cohort studies included in our literature review, struggle to replicate those findings. Cardiometabolic risks induced by overweight/obesity may be established at an early age, but they are generally unlikely to be detected before adulthood. The present study, with follow-up extending until young adulthood, yielded findings consistent with prior studies focusing on BMI trajectories from early to middle adulthood. Additionally, we found that the high—accelerated increasing BMI group had higher levels of total cholesterol, triglycerides, LDL, HDL/LDL ratio, HbA1c, and TG/HDL ratio, and a lower level of HDL than the stable normal BMI group.
The role of long-term high BMI may present differently in glucose and lipid mechanisms. We observed that differences in TG/HDL ratio, a surrogate marker of insulin resistance [52], comparing the increasing—persistent high BMI group and the high—accelerated increasing BMI group to the stable normal BMI group remained unchanged after adjusting for FMI measured at young adulthood. However, no increased cardiometabolic markers were observed in the increasing—accelerated resolving BMI group. Similarly, Buscot and colleagues reported that individuals who became overweight/obese during young adulthood but later resolved their BMI had a lower risk of diabetes than those who remained consistently obese/overweight [16]. This suggests that adverse changes in glucose metabolisms may commence with the onset of overweight or obesity and are likely to be mitigated by the normalization of high BMI at an earlier age. In contrast, lipids are likely to reflect current body fat status. We found that the elevated blood lipid levels in the increasing—persistent high and high—accelerated increasing BMI groups compared to the stable normal BMI group diminished after adjusting for the FMI in young adulthood. A previous study reported similar patterns in men specifically that the associations of BMI trajectories with TG and HDL approached the null after adjustment for body adiposity at the time of outcome evaluation [12]. However, current BMI is to a large extent dependent on earlier BMI. Thus, obesity prevention targeting children may have substantial significance in reducing cardiometabolic risk in later life.
Excess fat mass is likely to induce systemic inflammation [3, 53]. Our previous work suggested that a high percentage of body fat was associated with increased levels of inflammation-related plasma proteins [54]. The present study corroborates our earlier findings. Notably, similar findings regarding increased protein levels were reported in the UK Biobank [55]. Furthermore, a higher level of leukocytes was observed in the two groups in comparison to the stable normal BMI group. Although only a few studies of BMI trajectories have focused on inflammatory biomarkers, their findings are largely similar. Both Kim et al. and Oluwagbemigun et al. reported that individuals with high BMI had a higher level of IL-6 than those with low BMI [10, 48]. Similar associations were observed for CRP in two prior studies [10, 37].
This study had several strengths. First, our population-based longitudinal cohort study design and large sample size make our findings important from a public health point of view. Second, the analysis of cardiometabolic profiles concerning BMI trajectories is particularly advantageous in young adulthood when it is not too early to distinguish the risk across BMI trajectories and not too late to be able to reduce cardiometabolic risk induced by modifiable factors [56]. Several limitations, however, should be noted in this study. First, not all participants in BAMSE were included in the analysis due to the lack of information on BMI and outcomes. The participants included in the BMI trajectory analysis had higher socioeconomic status and lower smoking exposure compared to those excluded, which may introduce potential selection bias. Second, the generalizability of our findings may be limited to the context of a similar welfare system and lifestyle as in Sweden. Third, only a subset of participants had body fat mass index data at age 24. Therefore, our findings on the potential influence of current body fat status on the associations between BMI trajectories and cardiometabolic profiles require further replication.
Conclusions
Participants with normal birth weight, increasing rapidly during childhood and remaining high in adolescence, or with high birth weight and increasing over time have higher risks of adverse cardiometabolic profiles (i.e., lipids, glucose metabolism, and inflammation) than those with stable normal BMI. However, a raised BMI in childhood may not be inherently harmful to cardiometabolic health, provided it does not persist into adulthood. Obesity prevention targeting children may reduce the risk of adverse cardiometabolic profiles and subsequently lower the risk of cardiometabolic diseases in later life.
Supplementary Information
Additional file 1: Tables S1–S18. Table S1 The data source of body mass index used in the current study. Table S2 Full names of the 92 proteins included in the Proseek Multiplex Inflammation I panel. Table S3 Inflammation-related protein levels at 24 years according to body mass index trajectories. Table S4 Characteristics of the included and excluded participants. Table S5 The absolute error loss across latent class mixture models incorporating linear, quadratic, and cubic terms. Table S6 The results of latent class mixture models incorporating quadratic terms. Table S7 The mean and standard deviation of BMI and BMI z-scores for all the follow-up points for the BMI groups. Table S8 Characteristics of males in each body mass index trajectory. Table S9 Characteristics of females according to body mass index trajectories. Table S10 Bioimpedance at 24 years and 26 years according to body mass index trajectories. Table S11 Mean differences and 95% confidence intervals for the associations of body mass index trajectories with cardiometabolic profile at late adolescence and young adulthood by linear regression. Table S12 Mean differences and 95% confidence intervals for the associations of body mass index trajectories with cardiometabolic profile at late adolescence and young adulthood by linear regression in males. Table S13 Mean differences and 95% confidence intervals for the associations of body mass index trajectories with cardiometabolic profile at late adolescence and young adulthood by linear regression in females. Table S14 Mean differences and 95% confidence intervals of the sensitivity analysis which additionally included the BMI z-scores at 24 years. Table S15 Mean differences and 95% confidence intervals of the sensitivity analysis which additionally included the BMI z-scores at birth. Table S16 Blood cell counts at 24 years according to body mass index trajectories. Table S17 Mean differences and 95% confidence intervals for the associations of body mass index trajectories with inflammation-related proteins in young adulthood by linear regression. Table S18 The list of studies included in the literature review.
Additional file 2: Figures S1–S7. Fig. S1 Flow chart of study participants in the BAMSE cohort. Fig. S2 Body mass index trajectories from birth to young adulthood in the BAMSE cohort. Fig. S3 Body mass index z-scores for participants with or without BMI data at 24 years of age in six BMI groups. Fig. S4 Body mass index values for participants with or without BMI data at 24 years of age in six BMI groups. Fig. S5 Association of body mass index trajectories with blood pressure, blood lipid, and HbA1c in young adulthood after additionally adjusting for fat mass index determined by linear regression. Fig. S6 Association of BMI trajectories with any heightened cardiometabolic risk at young adulthood determined by logistic regression. Fig. S7 Protein expression levels in the heart muscle, smooth muscle, and adipose tissue.
Acknowledgements
The authors thank all participants, study nurses, data managers, and researchers of the BAMSE cohort.
Abbreviations
- BAMSE
Child [Barn], Allergy, Milieu, Stockholm, Epidemiological
- BMI
Body mass index
- BIC
The Bayesian Information Criterion
- CI
Confidence intervals
- CVD
Cardiovascular diseases
- DBP
Diastolic blood pressure
- EDTA
Ethylenediaminetetraacetic acid
- FFMI
Fat-free mass index
- FMI
Fat mass index
- HbA1c
Hemoglobin A1C
- HDL
High-density lipoprotein
- LCMM
Latent class mixture modeling
- LDL
Low-density lipoprotein
- MD
Mean difference
- SBP
Systolic blood pressure
- TG
Triglyceride
Authors’ contributions
G.W., D.W., A.B., and E.M. designed the study and outlined the contents of the manuscript. G.W. and D.W. were responsible for the practical conduct of the study, including the planning, coordination, and analysis of the data, and the writing of the manuscript under the supervision of E.M. S.K.M. contributed to trajectories and the cross-validation analysis. S.E., S.K., N.H.P., S.B., P.L., J.M.S. and I.K. revised the work critically for the content. All authors contributed to the interpretation of the data, read and approved the final manuscript.
Authors’ Twitter handles
Twitter handles: @ErikMelen (Erik Melén).
Funding
Open access funding provided by Karolinska Institute. This study was supported by grants from the European Research Council (TRIBAL, grant agreement 757919), the Swedish Research Council (2018–02524), the Swedish Research Council for Health, Working Life and Welfare (FORTE 2017–01146), Formas (2016–01646), the Swedish Heart–Lung Foundation, Strategic Research Area (SFO) Epidemiology, Karolinska Institutet, Region Stockholm (ALF project, and for cohort and database maintenance), and the Swedish Asthma and Allergy Association’s Research Foundation. Gang Wang was supported by the Office of China Postdoctoral Council (No. 56 Document of OCPC, 2022).
Data availability
The data that support the findings of this study are available on reasonable request from the principal investigators of the BAMSE cohort (I.K., A.B., and E.M.). The data are not publicly available due to the privacy and confidentiality of the research participants.
Declarations
Ethics approval and consent to participate
The study was approved by the Regional Ethical Review Board in Stockholm (Ref 2016/1380–31/2). The parents and participants signed their informed consent, under the Helsinki Declaration.
Consent for publication
All authors agreed and approved the publication of the current manuscript.
Competing interests
The authors declare no competing interests.
Footnotes
Publisher’s Note
Springer Nature remains neutral with regard to jurisdictional claims in published maps and institutional affiliations.
Gang Wang and Dang Wei are equal contributors of first authors.
Anna Bergström and Erik Melén are equal contributors of last authors.
References
- 1.Kelly T, Yang W, Chen CS, Reynolds K, He J. Global burden of obesity in 2005 and projections to 2030. Int J Obes (Lond). 2008;32(9):1431–7. [DOI] [PubMed] [Google Scholar]
- 2.Powell-Wiley TM, Poirier P, Burke LE, Després JP, Gordon-Larsen P, Lavie CJ, et al. Obesity and cardiovascular disease: a scientific statement from the American Heart Association. Circulation. 2021;143(21):e984–1010. [DOI] [PMC free article] [PubMed] [Google Scholar]
- 3.Hildebrandt X, Ibrahim M, Peltzer N. Cell death and inflammation during obesity: “Know my methods, WAT(son).” Cell Death Differ. 2023;30(2):279–92. [DOI] [PMC free article] [PubMed] [Google Scholar]
- 4.Van Gaal LF, Mertens IL, De Block CE. Mechanisms linking obesity with cardiovascular disease. Nature. 2006;444(7121):875–80. [DOI] [PubMed] [Google Scholar]
- 5.Kan Y, Liu L, Li X, Pang J, Bi Y, Zhang L, et al. Association between distinct body mass index trajectories according to the group-based trajectory modeling and the risk of incident diabetes: a systematic review. Obes Rev. 2022;23(12):e13508. [DOI] [PubMed] [Google Scholar]
- 6.Sun J, Xi B, Yang L, Zhao M, Juonala M, Magnussen CG. Weight change from childhood to adulthood and cardiovascular risk factors and outcomes in adulthood: a systematic review of the literature. Obes Rev. 2021;22(3):e13138. [DOI] [PubMed] [Google Scholar]
- 7.Tan L, Long LZ, Ma XC, Yang WW, Liao FF, Peng YX, et al. Association of body mass index trajectory and hypertension risk: a systematic review of cohort studies and network meta-analysis of 89,094 participants. Front Cardiovasc Med. 2022;9:941341. [DOI] [PMC free article] [PubMed] [Google Scholar]
- 8.Wang Y, Wan EYF, Mak IL, Ho MK, Chin WY, Yu EYT, et al. The association between trajectories of risk factors and risk of cardiovascular disease or mortality among patients with diabetes or hypertension: a systematic review. PLoS One. 2022;17(1):e0262885. [DOI] [PMC free article] [PubMed] [Google Scholar]
- 9.Hanvey AN, Mensah FK, Clifford SA, Wake M. Adolescent cardiovascular functional and structural outcomes of growth trajectories from infancy: prospective community-based study. Child Obes. 2017;13(2):154–63. [DOI] [PubMed] [Google Scholar]
- 10.Kim UJ, Choi EJ, Park H, Lee HA, Park B, Min J, et al. BMI trajectory and inflammatory effects on metabolic syndrome in adolescents. Pediatr Res. 2023;94(1):153–60. [DOI] [PubMed] [Google Scholar]
- 11.Aris IM, Chen LW, Tint MT, Pang WW, Soh SE, Saw SM, et al. Body mass index trajectories in the first two years and subsequent childhood cardio-metabolic outcomes: a prospective multi-ethnic Asian cohort study. Sci Rep. 2017;7(1):8424. [DOI] [PMC free article] [PubMed] [Google Scholar]
- 12.Ford ND, Martorell R, Mehta NK, Perrine CG, Ramirez-Zea M, Stein AD. Lifecourse body mass index trajectories and cardio-metabolic disease risk in Guatemalan adults. PLoS One. 2020;15(10):e0240904. [DOI] [PMC free article] [PubMed] [Google Scholar]
- 13.Huang RC, de Klerk NH, Smith A, Kendall GE, Landau LI, Mori TA, et al. Lifecourse childhood adiposity trajectories associated with adolescent insulin resistance. Diabetes Care. 2011;34(4):1019–25. [DOI] [PMC free article] [PubMed] [Google Scholar]
- 14.Blond K, Aarestrup J, Vistisen D, Bjerregaard LG, Jensen GB, Petersen J, et al. Associations between body mass index trajectories in childhood and cardiovascular risk factors in adulthood. Atherosclerosis. 2020;314:10–7. [DOI] [PubMed] [Google Scholar]
- 15.Blond K, Vistisen D, Aarestrup J, Bjerregaard LG, Hudda MT, Tjønneland A, et al. Body mass index trajectories in childhood and incidence rates of type 2 diabetes and coronary heart disease in adulthood: a cohort study. Diabetes Res Clin Pract. 2022;191:110055. [DOI] [PubMed] [Google Scholar]
- 16.Buscot MJ, Thomson RJ, Juonala M, Sabin MA, Burgner DP, Lehtimaki T, et al. Distinct child-to-adult body mass index trajectories are associated with different levels of adult cardiometabolic risk. Eur Heart J. 2018;39(24):2263–70. [DOI] [PubMed] [Google Scholar]
- 17.Wang G, Hallberg J, Faner R, Koefoed HJ, Kebede Merid S, Klevebro S, et al. Plasticity of individual lung function states from childhood to adulthood. Am J Respir Crit Care Med. 2023;207(4):406–15. [DOI] [PMC free article] [PubMed] [Google Scholar]
- 18.Ekstrom S, Magnusson J, Kull I, Andersson N, Bottai M, Besharat Pour M, et al. Body mass index development and asthma throughout childhood. Am J Epidemiol. 2017;186(2):255–63. [DOI] [PMC free article] [PubMed] [Google Scholar]
- 19.Group WHOMGRS. WHO Child Growth Standards based on length/height, weight and age. Acta Paediatr Suppl. 2006;450:76–85. [DOI] [PubMed] [Google Scholar]
- 20.de Onis M, Onyango AW, Borghi E, Siyam A, Nishida C, Siekmann J. Development of a WHO growth reference for school-aged children and adolescents. Bull World Health Organ. 2007;85(9):660–7. [DOI] [PMC free article] [PubMed] [Google Scholar]
- 21.Cnattingius S, Kallen K, Sandstrom A, Rydberg H, Mansson H, Stephansson O, et al. The Swedish medical birth register during five decades: documentation of the content and quality of the register. Eur J Epidemiol. 2023;38(1):109–20. [DOI] [PMC free article] [PubMed] [Google Scholar]
- 22.Juonala M, Magnussen CG, Berenson GS, Venn A, Burns TL, Sabin MA, et al. Childhood adiposity, adult adiposity, and cardiovascular risk factors. N Engl J Med. 2011;365(20):1876–85. [DOI] [PubMed] [Google Scholar]
- 23.Sherwani SI, Khan HA, Ekhzaimy A, Masood A, Sakharkar MK. Significance of HbA1c test in diagnosis and prognosis of diabetic patients. Biomark Insights. 2016;11:11. [DOI] [PMC free article] [PubMed] [Google Scholar]
- 24.Vehtari A, Gelman A, Gabry J. Practical Bayesian model evaluation using leave-one-out cross-validation and WAIC. Stat Comput. 2017;27:1413–32. [Google Scholar]
- 25.Proust-Lima C, Philipps V, Liquet B. Estimation of extended mixed models using latent classes and latent processes: the R package lcmm. J Stat Softw. 2015;78(2):1–56.
- 26.Peterson RA. Finding optimal normalizing transformations via bestNormalize. R J. 2021;13(1):310–29. [Google Scholar]
- 27.McCaw ZR, Lane JM, Saxena R, Redline S, Lin X. Operating characteristics of the rank-based inverse normal transformation for quantitative trait analysis in genome-wide association studies. Biometrics. 2020;76(4):1262–72. [DOI] [PMC free article] [PubMed] [Google Scholar]
- 28.Benjamini Y, Hochberg Y. Controlling the false discovery rate: a practical and powerful approach to multiple testing. J Roy Stat Soc: Ser B (Methodol). 1995;57(1):289–300. [Google Scholar]
- 29.Carrasco-Zanini J, Wheeler E, Uluvar B, Kerrison N, Koprulu M, Wareham NJ, et al. Mapping biological influences on the human plasma proteome beyond the genome. Nat Metab. 2024;6:2010–23. [DOI] [PMC free article] [PubMed] [Google Scholar]
- 30.Perez M, Winstone LK, Hernández JC, Curci SG, McNeish D, Luecken LJ. Association of BMI trajectories with cardiometabolic risk among low-income Mexican American children. Pediatr Res. 2023;93(5):1233–38. 10.1038/s41390-022-02250-1. [DOI] [PMC free article] [PubMed]
- 31.Montazeri P, Fossati S, Clemente DBP, Cirugeda L, Elosua R, Fernández-Barrés S, Fochs S, Garcia-Esteban R, Marquez S, Pey N, Nawrot TS, Vrijheid M. Early-childhood BMI trajectories in relation to preclinical cardiovascular measurements in adolescence. J Dev Orig Health Dis. 2022;13(3):322–9. 10.1017/S2040174421000441. [DOI] [PubMed]
- 32.Liu M, Lycett K, Wong TY, Kerr JA, He M, Juonala M, Olds T, Dwyer T, Burgner D, Wake M. Do body mass index and waist-to-height ratio over the preceding decade predict retinal microvasculature in 11-12 year olds and midlife adults? Int J Obes (Lond). 2020;44(8):1712-22. 10.1038/s41366-020-0584-9. [DOI] [PubMed]
- 33.Barraclough JY, Garden FL, Toelle BG, Marks GB, Baur LA, Ayer JG, Celermajer DS. Weight Gain Trajectories from Birth to Adolescence and Cardiometabolic Status in Adolescence. J Pediatr. 2019;208:89–95.e4. 10.1016/j.jpeds.2018.12.034. [DOI] [PubMed]
- 34.Huang RC, de Klerk NH, Smith A, Kendall GE, Landau LI, Mori TA, Newnham JP, Stanley FJ, Oddy WH, Hands B, Beilin LJ. Lifecourse childhood adiposity trajectories associated with adolescent insulin resistance. Diabetes Care. 2011;34(4):1019–25. 10.2337/dc10-1809. [DOI] [PMC free article] [PubMed]
- 35.Li X, Keown-Stoneman CDG, Lebovic G, Omand JA, Adeli K, Hamilton JK, Hanley AJ, Mamdani M, McCrindle BW, Sievenpiper JL, Tremblay MS, Maguire JL, Parkin PC, Birken CS; TARGet Kids! Collaboration. The association between body mass index trajectories and cardiometabolic risk in young children. Pediatr Obes. 2020;15(8):e12633. 10.1111/ijpo.12633. [DOI] [PubMed]
- 36.Wibaek R, Vistisen D, Girma T, Admassu B, Abera M, Abdissa A, Mudie K, Kæstel P, Jørgensen ME, Wells JCK, Michaelsen KF, Friis H, Andersen GS. Body mass index trajectories in early childhood in relation to cardiometabolic risk profile and body composition at 5 years of age. Am J Clin Nutr. 2019;110(5):1175–85. 10.1093/ajcn/nqz170. [DOI] [PubMed]
- 37.de Brito JN, Pereira MA, Kelly AS, Erickson DJ, Sherwood NE, Mason SM, et al. Body Mass Index Trajectories and Biomarkers of Cardiometabolic Risk in Children from Low-Income and Racially and Ethnically Diverse Households. Child Obes. 2024;20(4):243–53. [DOI] [PMC free article] [PubMed]
- 38.Ge WX, Han D, Ding ZY, Yi LP, Yang ZQ, Wang XN, Xiao Y, Liang F, Hai B, Lv HL, Shen H, Yang HB, Yin JY, Hu J. Pediatric body mass index trajectories and the risk of hypertension among adolescents in China: a retrospective cohort study. World J Pediatr. 2023;19(1):76–86. 10.1007/s12519-022-00626-1. [DOI] [PubMed]
- 39.Wang X, Hu J, Huang S, Yang Z, Dong Y, Dong B, et al. Exploring overweight risk trajectories during childhood and their associations with elevated blood pressure at late adolescence: a retrospective cohort study. Hypertension. 2022;79(8):1605–13. [DOI] [PubMed] [Google Scholar]
- 40.Beales D, Beynon A, Jacques A, Smith A, Cicuttini F, Straker L. Insight into the longitudinal relationship between chronic subclinical inflammation and obesity from adolescence to early adulthood: a dual trajectory analysis. Inflamm Res. 2021;70(7):799–809. 10.1007/s00011-021-01474-x. [DOI] [PubMed]
- 41.Ji Y, Zhao X, Feng Y, Qu Y, Liu Y, Wu S, Wu Y, Xue F, Liu Y. Body mass index trajectory from childhood to puberty and high blood pressure: the China Health and Nutrition Survey. BMJ Open. 2021;11(11):e055099. 10.1136/bmjopen-2021-055099. [DOI] [PMC free article] [PubMed]
- 42.Norris T, Mansukoski L, Gilthorpe MS, Hamer M, Hardy R, Howe LD, Hughes AD, Li L, O'Donnell E, Ong KK, Ploubidis GB, Silverwood RJ, Viner RM, Johnson W. Distinct Body Mass Index Trajectories to Young-Adulthood Obesity and Their Different Cardiometabolic Consequences. Arterioscler Thromb Vasc Biol. 2021;41(4):1580–93. 10.1161/ATVBAHA.120.315782. [DOI] [PMC free article] [PubMed]
- 43.Teng H, Hu J, Ge W, Dai Q, Liu J, Xiao C, Yin J, Zhu X. Body Mass Index Trajectories during 6-18 Years Old and the Risk of Hypertension in Young Adult: A Longitudinal Study in Chinese Population. Int J Hypertens. 2021;2021:6646868. 10.1155/2021/6646868. [DOI] [PMC free article] [PubMed]
- 44.Wu YF, Fan HY, Chen YC, Kuo KL, Chien KL. Adolescent Tri-ponderal Mass Index Growth Trajectories and Incident Diabetes Mellitus in Early Adulthood. J Clin Endocrinol Metab. 2021;106(8):e2919–27. 10.1210/clinem/dgab235. [DOI] [PubMed]
- 45.Lycett K, Juonala M, Magnussen CG, Norrish D, Mensah FK, Liu R, Clifford SA, Carlin JB, Olds T, Saffery R, Kerr JA, Ranganathan S, Baur LA, Sabin MA, Cheung M, Dwyer T, Liu M, Burgner D, Wake M. Body Mass Index From Early to Late Childhood and Cardiometabolic Measurements at 11 to 12 Years. Pediatrics. 2020;146(2):e20193666. 10.1542/peds.2019-3666. [DOI] [PubMed]
- 46.Wang X, Dong B, Huang S, Ma Y, Zou Z, Ma J, Yang Z, Wang Z. Body Mass Index Trajectory and Incident Hypertension: Results From a Longitudinal Cohort of Chinese Children and Adolescents, 2006-2016. Am J Public Health. 2020;110(11):1689–95. 10.2105/AJPH.2020.305873. [DOI] [PMC free article] [PubMed]
- 47.Yuan Y, Chu C, Zheng WL, Ma Q, Hu JW, Wang Y, Yan Y, Liao YY, Mu JJ. Body Mass Index Trajectories in Early Life Is Predictive of Cardiometabolic Risk. J Pediatr. 2020;219:31-37.e6. 10.1016/j.jpeds.2019.12.060. [DOI] [PubMed]
- 48.Oluwagbemigun K, Buyken AE, Alexy U, Schmid M, Herder C, Nöthlings U. Developmental trajectories of body mass index from childhood into late adolescence and subsequent late adolescence-young adulthood cardiometabolic risk markers. Cardiovasc Diabetol. 2019;18(1):9. [DOI] [PMC free article] [PubMed] [Google Scholar]
- 49.Hao G, Wang X, Treiber FA, Harshfield G, Kapuku G, Su S. Body mass index trajectories in childhood is predictive of cardiovascular risk: results from the 23-year longitudinal Georgia Stress and Heart study. Int J Obes (Lond). 2018;42(4):923–5. 10.1038/ijo.2017.244. [DOI] [PMC free article] [PubMed]
- 50.Araújo J, Barros H, Ramos E, Li L. Trajectories of total and central adiposity throughout adolescence and cardiometabolic factors in early adulthood. Int J Obes (Lond). 2016;40(12):1899–905. 10.1038/ijo.2016.170. [DOI] [PubMed]
- 51.Munthali RJ, Kagura J, Lombard Z, Norris SA. Childhood adiposity trajectories are associated with late adolescent blood pressure: birth to twenty cohort. BMC Public Health. 2016;16:665. 10.1186/s12889-016-3337-x. [DOI] [PMC free article] [PubMed]
- 52.Young KA, Maturu A, Lorenzo C, Langefeld CD, Wagenknecht LE, Chen YI, et al. The triglyceride to high-density lipoprotein cholesterol (TG/HDL-C) ratio as a predictor of insulin resistance, β-cell function, and diabetes in Hispanics and African Americans. J Diabetes Complications. 2019;33(2):118–22. [DOI] [PMC free article] [PubMed] [Google Scholar]
- 53.Valenzuela PL, Carrera-Bastos P, Castillo-García A, Lieberman DE, Santos-Lozano A, Lucia A. Obesity and the risk of cardiometabolic diseases. Nat Rev Cardiol. 2023;20(7):475–94. [DOI] [PubMed] [Google Scholar]
- 54.Klevebro S, Björkander S, Ekström S, Merid SK, Gruzieva O, Mälarstig A, et al. Inflammation-related plasma protein levels and association with adiposity measurements in young adults. Sci Rep. 2021;11(1):11391. [DOI] [PMC free article] [PubMed] [Google Scholar]
- 55.Sun BB, Chiou J, Traylor M, Benner C, Hsu YH, Richardson TG, et al. Plasma proteomic associations with genetics and health in the UK Biobank. Nature. 2023;622(7982):329–38. [DOI] [PMC free article] [PubMed] [Google Scholar]
- 56.Magnussen CG, Smith KJ, Juonala M. When to prevent cardiovascular disease? As early as possible: lessons from prospective cohorts beginning in childhood. Curr Opin Cardiol. 2013;28(5):561–8. [DOI] [PubMed] [Google Scholar]
Associated Data
This section collects any data citations, data availability statements, or supplementary materials included in this article.
Supplementary Materials
Additional file 1: Tables S1–S18. Table S1 The data source of body mass index used in the current study. Table S2 Full names of the 92 proteins included in the Proseek Multiplex Inflammation I panel. Table S3 Inflammation-related protein levels at 24 years according to body mass index trajectories. Table S4 Characteristics of the included and excluded participants. Table S5 The absolute error loss across latent class mixture models incorporating linear, quadratic, and cubic terms. Table S6 The results of latent class mixture models incorporating quadratic terms. Table S7 The mean and standard deviation of BMI and BMI z-scores for all the follow-up points for the BMI groups. Table S8 Characteristics of males in each body mass index trajectory. Table S9 Characteristics of females according to body mass index trajectories. Table S10 Bioimpedance at 24 years and 26 years according to body mass index trajectories. Table S11 Mean differences and 95% confidence intervals for the associations of body mass index trajectories with cardiometabolic profile at late adolescence and young adulthood by linear regression. Table S12 Mean differences and 95% confidence intervals for the associations of body mass index trajectories with cardiometabolic profile at late adolescence and young adulthood by linear regression in males. Table S13 Mean differences and 95% confidence intervals for the associations of body mass index trajectories with cardiometabolic profile at late adolescence and young adulthood by linear regression in females. Table S14 Mean differences and 95% confidence intervals of the sensitivity analysis which additionally included the BMI z-scores at 24 years. Table S15 Mean differences and 95% confidence intervals of the sensitivity analysis which additionally included the BMI z-scores at birth. Table S16 Blood cell counts at 24 years according to body mass index trajectories. Table S17 Mean differences and 95% confidence intervals for the associations of body mass index trajectories with inflammation-related proteins in young adulthood by linear regression. Table S18 The list of studies included in the literature review.
Additional file 2: Figures S1–S7. Fig. S1 Flow chart of study participants in the BAMSE cohort. Fig. S2 Body mass index trajectories from birth to young adulthood in the BAMSE cohort. Fig. S3 Body mass index z-scores for participants with or without BMI data at 24 years of age in six BMI groups. Fig. S4 Body mass index values for participants with or without BMI data at 24 years of age in six BMI groups. Fig. S5 Association of body mass index trajectories with blood pressure, blood lipid, and HbA1c in young adulthood after additionally adjusting for fat mass index determined by linear regression. Fig. S6 Association of BMI trajectories with any heightened cardiometabolic risk at young adulthood determined by logistic regression. Fig. S7 Protein expression levels in the heart muscle, smooth muscle, and adipose tissue.
Data Availability Statement
The data that support the findings of this study are available on reasonable request from the principal investigators of the BAMSE cohort (I.K., A.B., and E.M.). The data are not publicly available due to the privacy and confidentiality of the research participants.