

Abstract
In this study, peripheral whole blood samples from 22 hospitalized patients and 10 healthy individuals were analyzed using a combination of Data Independent Acquisition (DIA) and Enzyme-Linked Immunosorbent Assay (ELISA) techniques to identify differentially expressed proteins (DEPs) in sepsis patients’ plasma. The aim was to provide accurate and detailed biomarkers, such as SPP1, for determining the pathological stages of sepsis. SPP1, known as osteopontin1 is a pleiotropic protein with a wide distribution and multifunctional effects. Its protein expression is associated with inflammatory changes, including variations in expression levels in infectious diseases, allergic diseases, and situations involving tissue damage. The registration number was ChiCTR1900021261.The full date of first registration year is 2018. In the affiliated hospital of southwest medical university, 22 sepsis patients were hospitalized from January 2019 to September 2020 and 10 normal healthy individuals were selected for DIA-based quantitative proteomics analysis. In addition to gene ontology analysis and Kyoto Encyclopedia of genes and genomes analysis, enrichment analysis of data was performed and target protein network was screened through joint protein–protein interaction and visualization techniques. The selected protein targets were then validated by Elisa kit. The software was used to analyze the differences comparing the control group to the sepsis group and the sepsis group, as well as between sepsis survivals and non-survivals, and a ROC curve was drawn to evaluate the diagnostic value and prognostic effect of the method of the corresponding target proteins. A total of 174 DEPs were screened by bioinformatics analysis. An analysis of go pathway enrichment revealed the following: These proteins were mainly involved in biological processes among them are the inflammation response, the metabolism of extracellular matrix, the secretion of cell secretions, the activation of cells, and the immune response. According to the Kegg pathway analysis, they were mainly involved in complement cascade polymerization, extracellular protease and glycosylase activation, protein synthesis process, biotin metabolism, leukocyte transmembrane migration, bacterial infection and phagosome formation. SPP1 was identified as a possible plasma biomarker and was therefore further validated using Elisa. As a result of experiments, it has been demonstrated that level in sepsis patients is significantly compared to the normal control group and the level is also higher in non-survivals of sepsis. The ROC curve can be used to see that it can diagnose sepsis more accurately and improve prognostic ability prediction. Cell experiments confirm that SPP1 is highly expressed in sepsis. There is a significant difference in the levels of SPP1 protein between the normal group and the sepsis group; it not only has good diagnostic significance for sepsis, but also provides corresponding reference value for patient prognosis; Therefore, it is more likely to become a biological marker of sepsis over time.
Keywords: SPP1, Sepsis, DIA, ELISA
Subject terms: Immunology, Biomarkers, Diseases
Introduction
The characteristics of sepsis are the host’s dysregulated inflammatory response to external pathogen infections, which may lead to the failure of the body’s support systems1. Although there have been advances in the treatment of sepsis, including early target identification and guided therapy, as well as the selection of personalized treatment guidelines, sepsis still has a high incidence and mortality rate2. There has been a finding in epidemiological investigations that there are approximately 48 million cases of sepsis worldwide3, with about 8 million patients dying from sepsis, and the mortality rate in 2021 remains at 25%-30%4,5. The combination of mechanical ventilation and continuous renal replacement therapy (CRRT) is one of the important treatment strategies for sepsis6, but there is still a lack of effective drugs for sepsis treatment. Therefore, in order to find the information that you need, it is extremely important to search effective drugs that can prevent and block sepsis occurs when the body is attacked by bacteria and causes the formation of blood clots. Sepsis currently has no specific treatment. Currently, there is no specific treatment for sepsis. Current clinical treatment methods mainly focus on anti-infection, correction of acidosis, fluid support, blood perfusion therapy, and mechanical ventilation measures. Now, we have reached a new window of opportunity for treatment. Although patients may still experience an “inflammatory storm” after intervention with a series of early treatment measures, the body’s accumulation of inflammatory factors still poses a threat to the health and life of the patient. Since the implementation of the new sepsis diagnostic criteria in 2016, many biomarkers have been used to predict sepsis diagnosis and prognosis, but their specific roles are still debatable. Therefore, for clinicians to assess patients more accurately, biomarkers derived from bioinformatics screening are urgently needed conditions and understand the development of prognosis. The DIA quantitative proteomics technology is a new technology that is characterized by being able to achieve precise, targeted measurements, experimentally validated consistency and accuracy from large-scale proteomics studies7,8.
Recently, as an advanced computational technology, DIA has shown superior performance in proteomics9. Through the application of DIA technology, we are able to more widely screen for differentially expressed proteins (DEPs) in the blood of sepsis patients and healthy individuals, and through a series of analytical methods, identify the significant role that different proteins play in the treatment and even the prediction of prognosis for sepsis.
Proteomics can be used to study the dynamic changes in protein composition, expression, and modification, thus providing a comprehensive characterization of biological systems10. Proteomics has been widely applied in various fields, including food, pharmaceuticals, biotechnology, and more. By combining proteomics with other omics technologies (such as transcriptomics and metabolomics) for multi-omics analysis, we can gain a deep understanding of the changes in blood protein levels in septic patients during the physiological changes, providing a diagnostic basis for the treatment and prediction of sepsis in the future.
Since the 1960s, enzyme-linked immunosorbent assays (ELISAs) have become increasingly popular its invention in 1971 to replace the cumbersome and somewhat dangerous radioimmunoassay method. It consists of an antigen (target), antigen-capturing antibody, in addition to detection antibodies and has become a measurement tool widely used in parasitology11,12, microbiology13, and oncology14–20.
Identify new biomarkers with diagnostic value and prognostic significance through the screening of DEPs using DIA data processing and Elisa experimental methods, and analyze the clinical information data of patients. This will provide new diagnostic tools for clinical practitioners.
In our study, a novel diagnostic marker, SPP1, was identified and validated through a series of methodologies, confirming its capability in diagnosing sepsis and predicting its prognosis.
Materials and methods
Subject recruitment and blood collection
This study recruited 22 sepsis patients and 10 normal volunteers from the emergency intensive care unit of southwest medical university affiliated hospital between 2019 and 2020. Inclusion criteria are as follows: 1. Meeting the definition of sepsis 3.0 and the diagnostic criteria issued by SCCM and ESICM are the societies for critical care medicine and intensive care medicine, respectively; 2. Individuals aged between 16 and 70, with age distribution among the two groups being consistent; 3. A signed informed consent form must be signed by participants or their legal representatives. Patients under 16 years old with urgent complications that develop late in the game or those who participate in an ongoing clinical trial were excluded. A written informed consent was obtained from the participant all study participants or their legally designated individuals.
Proteomics quantitative analysis by DIA
10 blood samples were selected from the normal group and 22 from the sepsis group for DIA proteomic analysis. (I) Sample Preparation Sample preparation is a critical step in proteomics sequencing. Firstly, proteins need to be extracted from biological samples, commonly using methods such as cell lysis, tissue sectioning, and serum protein separation. Secondly, protein concentration determination and sample purification are conducted on the extracted proteins to remove interferences and enhance detection sensitivity. Finally, depending on the experimental objectives, further preprocessing can be performed on the samples, such as protein degradation, reduction-sulfhydryl modifications, and glycosylation modifications (Among them, the enzyme used for protein digestion is selected as trypsin) ; (II) Protein Separation and Enrichment Protein separation and enrichment are important steps in proteomics sequencing, aimed at reducing sample complexity and increasing protein detection sensitivity. Common methods include gel electrophoresis, liquid chromatography, and affinity chromatography. Gel electrophoresis is primarily used for separating proteins of different molecular weights in protein samples, liquid chromatography separates proteins based on their chemical properties and affinity, while affinity chromatography enriches target proteins using specific affinity agents21; (III) Protein Identification Protein identification is a core step in proteomics sequencing, commonly employing mass spectrometry. Initially, protein samples are enzymatically digested to produce peptides. Then, peptides are separated and detected through a mass spectrometer, yielding mass spectrometry profiles. Finally, by comparing experimental data with known protein databases, the proteins present in the sample are identified; (iv) Protein Quantification Protein quantification is the process of determining the relative or absolute abundance of different proteins in a sample. Common methods include quantitative mass spectrometry and metabolic labeling. Quantitative mass spectrometry infers the relative abundance of proteins by comparing the signal intensities of specific peptides in different samples. Metabolic labeling rules involve introducing isotopic label reagents into samples to infer the relative or absolute abundance of proteins based on the proportion of isotopic labels; (V) Data Analysis Data analysis is the final step in the proteomics sequencing workflow, aimed at interpreting and resolving proteomics data. Through bioinformatics tools and statistical analysis methods, the results of protein identification and quantification are mined and functionally annotated. Data analysis can include protein interaction network analysis, differential expression analysis, and functional enrichment analysis, to obtain more comprehensive biological information and insights22,23. The specific analysis steps are as follows: (1) the isolated and purified protein extract is digested into small molecule peptides by multiple enzyme digestion reactions, (2) the peptides are separated by high performance liquid chromatography, (3) the isolated peptides are detected by mass spectrometry in SWATH mode, (4) the mass spectrometry data is deeply analyzed by combining relevant software and bioinformatics analysis methods, and the mass spectrometry data is converted into the biological data we need, so as to realize the quantitative identification of proteins. The parameter setting is to use the information obtained by chromatography-mass spectrometry in three dimensions, such as retention time, mass-to-charge ratio, ionic strength, etc., to assist in the qualitative and quantitative completion of substances. Using a Q-EXACTIVE HF (Thermo-Fisher Science, San Jose, CA) instrument in DIA mode, we obtained accurate and highly reproducible quantitative mass spectral data for a large number of proteins. Combined with the DIA database and the use of MSSTATS-software for DIA raw data analysis, the qualitative and quantitative information analysis of peptides and proteins obtained by mass spectrometry analysis was carried out, and a large number of reliable quantitative results were obtained. Relevant proteomic analysis data to upload to China National GENEBANK DATEBASE.
Identifying target genes
All data underwent logarithmic transformation. Consistency of samples and discriminative ability between groups were assessed using box plots and principal component analysis. DEPs between normal individuals and sepsis patients were filtered using the online tool iDEP0.93 (http://bioinformatics.) with criteria of log2fc ≥ 1 and false discovery rate < 0.05. These DEPs were then submitted to the online platform https://string-db.org/ for the establishment of partnership networks. Based on the differential proteins located at the center of the protein network constructed between the normal group and the sepsis group, the PubMed database was searched for potential serum biomarkers.
An analysis of the GO and KEGG genes
To further understand the functional expression of DEPs in sepsis, Analyses of enrichment by GO and KEGG were conducted that using Shiny GO 0.77 (http://149.165.154.220/go/). Analyzing functional enrichment through functional enrichment analysis, we can preliminarily demonstrate the biological processes or signaling pathways that DEPS may be involved in.
ELISA validation
This study used a sandwich ELISA method to detect the level of SPP1 in the specimen. The detection index SPP1 was found through previous research in related literature by our research group. It has been verified through the website BIDOS (www.swmubidos.com) and single-cell sequencing (https://cloud.oebiotech.com/) to show significant differences in expression between sepsis and normal groups. This gene was also analyzed across various plasma sample groups from proteomics experiments. After a series of proteomics-related analyses, we found that SPP1 had a higher likelihood of being a core target gene compared to other functional proteins. Consequently, we proceeded to validate it through ELISA experiments. Our test samples were derived from previously collected clinical whole blood samples. A total of 32 standard blood collection tubes were used for statistical analysis, with the specific procedures as follows: The specimen was added to a microplate coated with SPP1 antibody, an antibody-antigen-enzyme-labeled antibody complex is formed by the combination of an antigen antibody and a detection antibody that has been labeled with horseradish peroxidase. As a final step in the color development process, TMB color reagent was added after thorough washing. The TMB-ELISA substrate system turns blue under the catalysis of HRP enzyme and turns yellow under the action of acid. The color depth is positively correlated with the SPP1 content in the sample. A wavelength of 450 nm was used for measuring the absorbance using an enzyme immunoassay analyzer, and the SPP1 content in the sample was calculated based on the standard curve. The color intensity is positively correlated with the SPP1 in the sample.
An analysis of the receiver operating characteristic (ROC) curve
ROC curves were plotted using MEDCALC 15.2 software to evaluate the diagnostic and prognostic ability of SPP1, and AUC (area under the curve) was calculated. The AUC of the ROC curves between the normal group and sepsis group, as well as the survival group and death group, were all greater than 0.8. Based on this, it can be concluded that SPP1 has a diagnostic effect on sepsis and improves prognostic ability.
Cell experiment
Used to identify the expression of target genes in sepsis, RAW264.7 cells are selected. These cells are cultured in complete medium containing 10% fetal bovine serum (FBS) and are incubated at 37℃ with a 5% CO2 concentration. After 3 days of cultivation, when the area occupied by adherent cells in the culture dish or bottle reaches 60%-70%, the supernatant is discarded, and the cells are washed with PBS in a 6-well plate three times. Then, the cells are cultured with 2 ml of medium containing 10% FBS and no penicillin–streptomycin solution for 24 h before adding lipopolysaccharide (LPS) (100 ng/ml) to induce sepsis in the cells for 6 h. The culture medium for the control cells is replaced at the same time without any other treatments. Subsequently, cell RT-qPCR experiments were conducted. The gene involved is SPP1, and the primer design and synthesis were both conducted by Beijing QINGKE Biotechnology Co., Ltd. (Chengdu Branch). The specific primer sequences are as follows: forward GCCGAGGTGATAGCTTGGCT, reverse GCTGCCCTTTCCGTTGTTGT. RNA extraction was performed using a kit (ORISCIENCE, China) to assist in extracting total RNA from cells, and its concentration and purity were measured using a spectrophotometer. Use RT reagent kit (Seq-Hunt, China, CA01) to synthesize complementary DNA (cDNA) from RNA. Then, utilize SYBR Green reagent kit (Seq-Hunt, China, AF01-5) for RT-qPCR and generate melting curves. Analyze the results using 2^-∆∆Ct method.
The statistical analysis of data
An analysis of the data was conducted using the following statistical methods: GraphPad Prism 9.0 software to analyze the data obtained from enzyme-linked immunosorbent assay and clinical data of patients. As a continuous variable, the mean was rounded to standard deviation (SD) or the median was rounded to the interquartile range (IQR). Differences between continuous variables Using non-parametric Mann–Whitney U tests and unpaired Student’s t tests, the data was analyzed. Comparing the two groups was done using Fisher’s exact test the number of cases between two groups. It was set at a cutoff value of P < 0.05.
Result
RT-qPCR was used to detect the expression of SPP1 in RAW264.7 cells in vitro. According to the independent samples t-test, SPP1 (0.9964 [− 2.758– −1.906]; t = 23.55, p < 0.001) was up-regulated in a negative direction compared to normal cells. As indicated in Fig. 1, SPP1 exhibits high expression in sepsis and low expression in the control group, with statistically significant differences between the two groups (p < 0.05).
Fig. 1.

RT-qPCR. RT-qPCR detection of the expression of core genes in the sepsis cell model. Blue represents normal, and red represents sepsis. *, p < 0.05; **, p < 0.01; ***, p < 0.001.
A description of the demographics and clinical characteristics of the patients
Table 1 Shows the clinical data of the patients included in this study.
Table 1.
Recruited patients’ baseline characteristics.
| Clinical variable | Normal control | Sepsis | Sepsis-survivor | Sepsis non-survivor |
|---|---|---|---|---|
| Male | 5(50%) | 14 (63.6%) | 7 (63%) | 7 (63%) |
| Female | 5(50%) | 8 (26.4%) | 4 (37%) | 4 (37%) |
| Age (years) | 53.5 ± 1.75 | 57.5 ± 9.753 | 50.83 ± 5.34 | 63.09 ± 19.175 |
| WBC (10^9/l) | 6.877 ± 4.05 | 13.25 ± 8.684 | 13.73 ± 4.078 | 12.77 ± 2.160 |
| NEU (10^9/l) | 4.128(2.78 5.84 | 14.04 (2.16 26.94)(*)a | 12.31 (2.16 26.94) | 15.78 (5.2 15.26) |
| ALT (u/l) | 20.94(10.3 27.1) | 87.95 (11.2 843)(*)a | 137.6(18.6 843) | 38.26 (11.2 119.5) |
| AST (u/l) | 22.18(15.2 30.1) | 145.3 (16.0 1244.2 | 199.6 (16.0 1244.2) | 80.06 (17.8 309.9) |
| Cre (umol/l) | 63.75(52.3 74.6) | 124.3 (22.5 449.9) | 66.89 (22.5 114.2) | 181.6 (37.1 449.9) (*)b |
| Total bilirubin(umol/l) | 16.79(10.1 29.6) | 32.31 (4.7 177.9) | 31.35 (4.7 88.1) | 33.28 (11.1 177.9) |
| UA (umol/l) | 5.046(3.03 7.74) | 13.17 (1.94 58.18) | 7.687 (4.34 10.06) | 18.65 (1.94 58.18) |
aMeans compared with the normal group, (*) p < 0.05; bMeans compared with the sepsis survivors, (*) p < 0.05. The error in the parameters within the table represents the standard deviation of the mean. The percentages in the table represent the proportion of the total number of people and represent the corresponding numerical ranges. Use Supplementary Table 1 to represent the meanings of abbreviations and Clinical information regarding all researchers has been presented in Supplementary materials 2.
Table 2 Demonstrating the characteristics of the patient’s illness.
Table 2.
Patient recruitment for disease characteristics statistics.
| Disease classification | Causes of Illness | ||||
|---|---|---|---|---|---|
| Lung infection | Abdominal infection | Gallbladder infection | Mods | Others | |
| Sepsis | 40.91% | 13.63% | 13.63% | 9.09% | 22.73% |
| SURVIVORS-sepsis | 18.18% | 18.19% | 18.18% | 0 | 45.45% |
| NS-sepsis | 63.64% | 9.09% | 9.09% | 0 | 18.18% |
A total of 10 healthy individuals and 22 sepsis patients were enrolled in this study. Among the sepsis patients, the causes of sepsis were lung infection (9, 40.91%), abdominal infection (3, 13.63%), gallbladder infection (3, 13.63%), MODS (2, 9.09%), and others (5, 22.73%) (Fig. 2A). During the median follow-up period of 28 days, there were 11 survivors and 11 non-survivors in the sepsis group, and the reasons for survival and non-survival are shown in Figs. 2B,C. A significant difference was not found in gender and age between the sepsis and healthy groups, and differences between the two groups were not observed survivors and non-survivors in terms of these factors. The counts of white blood cells (WBCs) and alanine aminotransferase were significantly different (ALT) levels between the normal control group and sepsis patients (P < 0.05), however, there was no significant difference between the groups in other parameters between survivors and non-survivors except for creatinine levels. In addition, no significant differences were observed in total bilirubin or white blood cell counts between survivors and non-survivors.
Fig. 2.
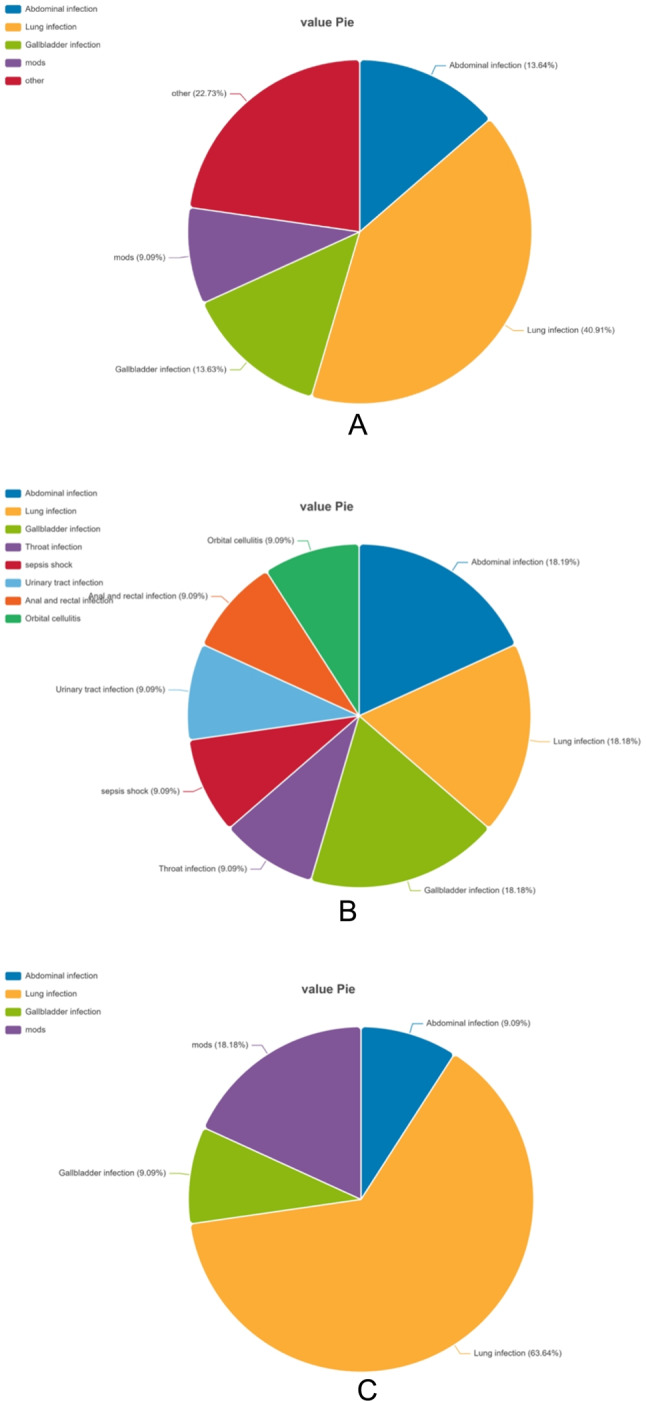
Main sources of recruited sepsis patients: Sepsis patients (A), survivors (B), non-survivors (C).
Identification of DEPs in normal controls and sepsis patients
Through box plots and principal component analysis, it was found that the homogeneity and distinctiveness of normal and sepsis samples were good in the protein analysis based on DIA (Fig. 3A,B), and no outliers were found (Among the sepsis group, 4 samples were identified as outliers with significant differences, which would have a substantial impact on subsequent data analysis. Therefore, these samples were excluded from further analysis.) The total number of proteins identified and quantified is 959 (Supplementary materials 1). The protein data was analyzed using the Idep0.93 online software. A total of 174 DEPs were screened from the serum of normal individuals and sepsis patients (Fig. 3C). Sepsis patients had 43 proteins that were downregulated compared with those in the normal group and 131 up-regulated proteins (Fig. 3D).
Fig. 3.

Box plot (A), principal component analysis (B), volcano map (C), heat map (D) of sepsis samples. The criteria for selection of differentially expressed proteins was set as fold-change ≥ 1, a false discovery rate of < 0.05 is considered to be a false discovery. (Note: 1. Different colors signify distinct meanings. On the left side of the heatmap, the blue bar represents the number of downregulated proteins, while the yellow band indicates the number of upregulated proteins. Within the heatmap, the green band range signifies low expression levels within the group, whereas the red band range indicates high expression levels within the group. 2. The detailed information on the up-regulated and down-regulated proteins has been uploaded to Supplementary material 4.)
Protein network and hub protein analysis
Submit the DEPs to the string (https://stringdb.org) online platform to construct a PPI network (Fig. 4A). It has been observed that the majority of proteins are concentrated in the central regions of the PPI networks, closely interconnected with each other. The network relationships between proteins are represented. In the PPI network graph, we found that proteins such as SPP1, CST3, COL3A1, TIMP1, MMP14, CD44, CSF1, and MMP15 are located in the central part of the network module, and differences in expression that are significant between the normal group and the sepsis group can be observed (P < 0.05) (Fig. 4B). Based on a PubMed search, the following results that we have not yet found any relevant studies on the serum levels of SPP1 in sepsis patients; therefore, its specific function in the sepsis process further experimental verification is needed.
Fig. 4.

(A): Network of protein–protein interactions between differentially expressed proteins; (B): Heat map of proteins indicted that were at the central of this network. (Note: 1. Group1 represents the control group; Group2 represents the sepsis group. 2. Different color scale bands represent different meanings; a larger red scale indicates higher expression levels, while a larger blue band signifies lower expression levels.)
GO classification and KEGG pathway enrichment analysis of DEPs
The analysis of functional enrichment for DEPs suggests that these proteins primarily participate in biological processes related to immune inflammation response, cell metabolism, cell secretion, and cell activation (Fig. 5A–C). The Kegg pathway analysis shows that these DEPs are mainly related to signaling pathways, such as inflammation complement cascade aggregation, the processes of protein metabolism and synthesis, the metabolism of biotin, and the migration of leukocytes across cell membranes and bacterial infection formation (Fig. 5D).
Fig. 5.

The results of Gene Ontology analysis: including BP, CC, MF (A–C) and KEGG pathway analysis (D). (Note: BP: Biological Process; CC: Cell Component; MF: Molecular Function).
SPP1 enzyme-linked immunosorbent assay verification
As depicted in Fig. 6A,B, the expression level of SPP1 in the serum of sepsis patients was 761.2 ± 191.13 ng/mL, higher than the normal control group (315.3 ± 540.74 ng/mL) (P < 0.0001) (Fig. 6A); The expression level of SPP1 in non-survivors of sepsis (845.1 ± 160.58 ng/mL) was higher than that in survivors (692.5 ± 72.19 ng/mL) (P = 0.0486) (Fig. 6B). Therefore, the expression level of SPP1 increases with the progression of sepsis.
Fig. 6.

The Elisa results of SPP1 expression between healthy normal and sepsis groups (A), survivals and non-survivals (B); Normal control was 315.3 ± 540.74ng/mL, sepsis group 761.2 ± 191.13ng/mL, survivals692.5 ± 72.19 ng/mL and non-survivals 845.1 ± 160.58ng/Ml.
Analysis of the receiver operating characteristic (ROC) curve
Based on the results of the enzyme-linked immunosorbent assay, the ROC curve was formed. The results showed that SPP1 has a relatively good diagnostic significance for sepsis, with an area under the ROC curve of 0.878, sensitivity of 100%, and specificity of 65% (Fig. 7A). The area under the ROC curve for survivors and non-survivors was 0.778 (Fig. 7B), indicating that SPP1 has a good predictive ability for the prognosis of sepsis patients.
Fig. 7.

ROC curve of SPP1 for the comparison between normal people vs sepsis patients (A); ROC curve analysis of SPP1 for the comparison of the survivals vs non-survivals (B).
Discussion
ICU admissions frequently result in death, with sepsis being a significant contributing factor.
The individual became infected with the illness. Patients will gradually develop symptoms such as fever, loss of appetite, and abnormal cardiac and pulmonary function during the course of the illness. Subsequently, if effective treatment is not received, symptoms of shock or systemic multiple organ dysfunction will occur in the later stages of development, and the patient’s condition will worsen until death. Therefore, prompt recognition of the potential hazards for high-risk mortality patients and the risk of death can be reduced through the implementation of efficient treatment measures. The researchers integrated bioinformatics techniques with DIA analysis to conduct this study. The potential of SPP1 as a serum biomarker for sepsis was discovered. Furthermore, the protein was determined by examining the outcomes of the enzyme-linked immunosorbent assay. SPP1 gradually increased with the progression of the disease. The ROC curve showed that SPP1 has good diagnostic value for sepsis, and by comparing the changes in content amongst the living and those who have passed away. We still found its prognostic value for sepsis.
In this article, SPP1, identified through proteomic analysis and verified by ELISA experiments, is proposed as a potential biomarker for the diagnosis and prognosis of sepsis. Differential expression of SPP1 between the surviving and deceased septic patients, as well as between septic patients and healthy controls, suggests its potential as a diagnostic and prognostic marker. The ROC analysis demonstrates its high diagnostic sensitivity and specificity, making it a valuable addition to the clinical diagnostic panel for sepsis.
Analysis based on existing clinical data reveals that the sequential organ failure assessment scores obtained (not shown in the text) indicate: an average score of 2 for the blood system; an average score of 2 for the liver; an average score of 3 for the nervous system; an average score of 2 for the kidneys, with an overall average score of 9. This indicates that patients upon admission are at a high risk with a significant mortality rate, necessitating prompt and effective inferences about the disease state and diagnosis. Therefore, there is a need for a new biomarker capable of rapidly identifying the disease state and responding swiftly. SPP1, as one of the novel biomarkers for diagnosing sepsis, can fulfill this role to a certain extent.
Osteopontin1 or bone is another name for SPP1. The gene encoding SPP1 on the abbreviated limb of human chromosome 424. The SPP1 gene encodes a versatile protein called Osteopontin1 which is widely present in cells and tissues and has multiple functions25–27. Research has found that upregulation of SPP1 gene expression is associated with inflammation, including infectious factors28–33, allergic reactions34–36,
autoimmune factors37–40, and tissue damage41. It participates in the regulation of bone growth, immune response, the process of sticking together and movement of cells and regulates signaling pathways and transcriptional responses42. It can inhibit hepatic lipid toxicity, cellular apoptosis, and the progression of fibrosis43. The expression of this protein is related regarding the role of the immune system, but its specific role and signal transduction mechanism in host defense and immune response are still unclear.
Currently, research on SPP1 mainly focuses on the following aspects: 1. SPP1 is related to the inhibition of T cell activation44. The unclear nature of SPP1-cd44’s role in patients’ clinical outcomes and anti-tumor immunity remains uncertain and clinical outcomes of patients is not clear, and it has been found that SPP1-cd44 interacts with T cells to form a low-efficiency functional TME; SPP1 expressed in the kidney synthesizes bone bridge proteins with strong calcium binding ability and cell adhesion, which is a necessary basic element for human calcification45. Metabolic disorders of the SPP1 gene are positively correlated with kidney stone disease45–47. 2. In the field of tumors, SPP1 is involved in the regulation of many biological processes associated with tumors, such as the growth and movement of cells, as well as the development and advancement of tumors. Its high expression level in tumor tissues is linked to unfavorable outcome48,49, so it can be used as a potential prognostic biomarker for various human cancers50.
At the cellular expression level, SPP1 only exists in a few cell types, such as osteoblasts, macrophages, dendritic cells, lymphocytes, and monocytes in the immune system51–53. Research has indicated that OPN1 is increased in autoimmune conditions like systemic lupus erythematosus (SLE), rheumatoid arthritis (RA), and multiple sclerosis (MS). Because it is frequently highly expressed and easily detectable in many pathological conditions, both OPN1 and its transcript (SPP1) are generally considered pathogenic molecules54. Experimental evidence has shown that overexpression of the SPP1 has the ability to safeguard retinal ganglion cells (RGCs) and contribute to the restoration of visual function55. The expression of SPP1 in osteoblasts can be regulated by vitamin A and vitamin C, which are necessary for retinal pigment cells56–59.
Bioinformatics analysis of DEPs (GO, KEGG, and protein–protein interaction analysis).
GO enrichment analysis was performed to identify functional changes associated with DEPs. The analysis includes three main ontologies: biological process (BP), molecular function (MF), and cellular component (CC). Figures A and C in Fig. 4 represent the most enriched terms in each group. In the sepsis and normal groups, the most enriched terms in BP are related to cellular immune response processes, multicellular organism processes, etc.; the highest enriched term in cc is binding of extracellular response; and the most enriched terms in MF are protein binding functions, structural molecular activity, etc.
Enriched genes are mainly concentrated in the extracellular space where they act as protein bridges and are able to transmit signals.
The KEGG pathway database is a comprehensive database, manually drawn and providing insights into molecular interactions. The KEGG pathways show that about 11% of the genes are involved in the regulation of the complement system, followed by approximately 6% related to protein synthesis, signaling pathway transduction, etc. Approximately 2% are involved in polysaccharide or protein degradation processes. Enriched genes act on protein synthesis, lipid metabolism, and other transduction pathways through the complement system. In conclusion, these results indicate that signaling and metabolic pathways play a crucial role in the development and progression of sepsis in patients. Protein–protein interactions were predicted using the STRING database (Mering et al., 2005). Figure 3A shows interactions between core proteins, including both direct and indirect functional associations. The central network consists of proteins associated with timp1, SPP1, and mmp14.The heatmap in Fig. 3B reveals that core genes are primarily upregulated in sepsis, indicating the potential importance of these foundational proteins in the pathogenesis of sepsis.
Among them, SPP1 occupies a prominent position in the PPI network, providing a direction for further in-depth research. We noticed that 5% of gene expression is concentrated in the process of Staphylococcus aureus infection. It is well known that during the development of sepsis, the “inflammatory storm” caused by bacterial infection is the main reason. Therefore, controlling gene expression levels may become a way to control infection factors.
Nevertheless, it is important to acknowledge certain restrictions. Firstly, our study was based on sepsis patients to determine whether SPP1 could be an effective biomarker for sepsis, and ultimately, changes in the serum of sepsis patients without this condition should be excluded. Secondly, the study has a relatively small overall sample size, so we will expand the sample size and integrate with relevant multi-center research methods in the later stage, which will become the direction of our further research. Finally, the specific mechanism of action of SPP1 the elucidation of sepsis remains unclear and further experimental verification is needed to confirm these findings.
Conclusion
The above research indicates that SPP1 exhibits high expression in the sepsis mortality group and low expression in the survival group. Additionally, SPP1 demonstrates high diagnostic sensitivity for sepsis, suggesting its potential as a biomarker for both diagnosis and prognosis of sepsis.
Supplementary Information
Acknowledgements
We thank BGI for instructing Protein-sequencing.
Author contributions
SYZ, XW, HYC, ZW designed the study. XW performed the bioinformatics analysis and interpretation of the data. SYZ wrote the manuscript. HYC and ZW revised the manuscript and gave final approval of the version to be published. All authors read and approved the final manuscript. All authors have accepted responsibility for the entire content of this manuscript and approved its submission.
Funding
1. This study was funded by Sichuan Provincial Key clinical Specialty Construction Project. 2. [Luzhou Municipal People’s Government—Southwest Medical University Science and Technology Strategic Cooperation Applied Basic Research (NO.2021LZXNYD-J13)].
Data availability
We intend to share individual deidentified participant data. Peripheral blood RNA sequencing data from 19 patients with sepsis and10 Healthy people are available in the China National GeneBank DataBase (CNGBdb) and can be found below: http://db.cngb.org/, under the accession: CNP0002611, you can access it now and it’s valid forever.
Declarations
Competing interests
The authors declare no competing interests.
Ethics approval and consent to participate
The study was conducted in strict accordance with the rules of the Declaration of Helsinki. The study protocol has been approved by the ethics committee of the Affiliated Hospital of Southwest Medical University (Ethical Approval No. ky2018029). The Registration Number was ChiCTR1900021261.
Consent for publication
Not applicable.
Footnotes
Publisher’s note
Springer Nature remains neutral with regard to jurisdictional claims in published maps and institutional affiliations.
Contributor Information
Ying Chun Hu, Email: huyingchun913@swmu.edu.cn.
Wu Zhong, Email: zhongwu2876@sina.com.
Supplementary Information
The online version contains supplementary material available at 10.1038/s41598-024-78420-4.
References
- 1.Cecconi, M. et al. Sepsis and septic shock. Lancet392(10141), 75–87. 10.1016/S0140-6736(18)30696-2 (2018). [DOI] [PubMed] [Google Scholar]
- 2.Luhr, R. et al. Trends in sepsis mortality over time in randomised sepsis trials: A systematic literature review and meta-analysis of mortality in the control arm, 2002–2016. Crit. Care23(1), 241. 10.1186/s13054-019-2528-0 (2019). [DOI] [PMC free article] [PubMed] [Google Scholar]
- 3.Gomanova, L. & Brazhnikov, A. Sepsis in the XXI century: Etiology risk factors, epidemiological features, complications, prevention. Epidemiol. Vakcinoprofil.20(3), 107–117. 10.31631/2073-3046-2021-20-3-107-117 (2021). [Google Scholar]
- 4.Fleischmann, C. et al. Assessment of global incidence and mortality of hospital-treated sepsis. Current estimates and limitations. Am. J. Resp. Crit. Care.193(3), 259–272. 10.1164/rccm.201504-0781OC (2016). [DOI] [PubMed] [Google Scholar]
- 5.Wong, A. et al. External validation of a widely implemented proprietary sepsis prediction model in hospitalized patients. Jama Intern. Med.181(8), 1065–1070. 10.1001/jamainternmed.2021.2626 (2021). [DOI] [PMC free article] [PubMed] [Google Scholar]
- 6.Romagnoli, S., Ricci, Z. & Ronco, C. CRRT for sepsis-induced acute kidney injury. Curr. Opin. Crit. Care.24(6), 483–492. 10.1097/MCC.0000000000000544 (2018). [DOI] [PubMed] [Google Scholar]
- 7.Lourbopoulos, A. I. et al. Effects of thyroid hormone on tissue hypoxia: relevance to sepsis therapy. J. Clin. Med.10.3390/jcm10245855 (2021). [DOI] [PMC free article] [PubMed] [Google Scholar]
- 8.Ludwig, C. et al. Data-independent acquisition-based SWATH-MS for quantitative proteomics: A tutorial. Mol. Syst. Biol.14(8), e8126. 10.15252/msb.20178126 (2018). [DOI] [PMC free article] [PubMed] [Google Scholar]
- 9.Yang, Y., Lin, L. & Qiao, L. Deep learning approaches for data-independent acquisition proteomics. Expert Rev. Proteomic.18(12), 1031–1043. 10.1080/14789450.2021.2020654 (2021). [DOI] [PubMed] [Google Scholar]
- 10.Aslam, B. et al. Proteomics: Technologies and their applications. J. Chromatogr. SCI.55(2), 182–196. 10.1093/chromsci/bmw167 (2016). [DOI] [PubMed] [Google Scholar]
- 11.Ljungström, I., Engvall, E. & Ruitenberg, E. J. PROCeedings: ELISA, enzyme linked immunosorbent assay - a new technique for sero-DIAgnosis of trichinosis. Parasitology69(2), xxiv (1974) (PMID: 4419374). [PubMed] [Google Scholar]
- 12.Voller, A. et al. New serological test for malaria antibodies. Br. Med. J.1(5959), 659–661. 10.1136/bmj.1.5959.659 (1975). [DOI] [PMC free article] [PubMed] [Google Scholar]
- 13.Engvall, E. Quantitative enzyme immunoassay (ELISA) in microbiology. Med. Biol.55(4), 193–200 (1977) (PMID: 335174). [PubMed] [Google Scholar]
- 14.Sipponen, P. et al. CEA and CEA-like activity in gastric cancer. Acta Hepatogastroenterol (Stuttg).23(4), 276–279 (1976) (PMID: 61690). [PubMed] [Google Scholar]
- 15.Seppälä, M. et al. Detection of trophoblastic tumour activity by pregnancy-specific beta-1-glycoprotein. Int. J. Cancer.21(3), 265–267. 10.1002/ijc.2910210303 (1978). [DOI] [PubMed] [Google Scholar]
- 16.Uotila, M., Ruoslahti, E. & Engvall, E. Two-site sandwich enzyme immunoassay with monoclonal antibodies to human alpha-fetoprotein. J. Immunol. Methods42(1), 11–15. 10.1016/0022-1759(81)90219-2 (1981). [DOI] [PubMed] [Google Scholar]
- 17.Meenakshi, A., Kumar, R. S. & Kumar, N. S. ELISA for quantitation of serum C-erbB-2 oncoprotein in breast cancer patients. J. Immunoass Immunoch.23(3), 293–305. 10.1081/IAS-120013028 (2002). [DOI] [PubMed] [Google Scholar]
- 18.Lim, M. J. et al. An ELISA-based high throughput protein truncation test for inherited breast cancer. Breast Cancer Res.12(5), R78. 10.1186/bcr2722 (2010). [DOI] [PMC free article] [PubMed] [Google Scholar]
- 19.Jiang, P. & Liu, X. S. Big data mining yields novel insights on cancer. Nat. Genet.47(2), 103–104. 10.1038/ng.3205 (2015). [DOI] [PubMed] [Google Scholar]
- 20.Lu, X. & Zhang, X. The effect of GeneChip gene definitions on the microarray study of cancers. Bioessays.28(7), 739–746. 10.1002/bies.20433 (2006). [DOI] [PubMed] [Google Scholar]
- 21.Tabb, D. L. et al. Repeatability and reproducibility in proteomic identifications by liquid chromatography-tandem mass spectrometry. J. Proteome Res.9(2), 761–776. 10.1021/pr9006365 (2010). [DOI] [PMC free article] [PubMed] [Google Scholar]
- 22.Tsou, C. C. et al. DIA-Umpire: Comprehensive computational framework for data-independent acquisition proteomics. Nat. Methods12(3), 258–264. 10.1038/nmeth.3255 (2015). [DOI] [PMC free article] [PubMed] [Google Scholar]
- 23.Demichev, V., Messner, C. B., Vernardis, S. I., Lilley, K. S. & Ralser, M. DIA-NN: Neural networks and interference correction enable deep proteome coverage in high throughput. Nat. Methods.17(1), 41–44. 10.1038/s41592-019-0638-x (2020). [DOI] [PMC free article] [PubMed] [Google Scholar]
- 24.Song, G. et al. Publisher correction: Single-cell transcriptomic analysis suggests two molecularly distinct subtypes of intrahepatic cholangiocarcinoma. Nat. Commun.13(1), 2848. 10.1038/s41467-022-30599-8 (2022). [DOI] [PMC free article] [PubMed] [Google Scholar]
- 25.Fisher, L. W. & Fedarko, N. S. Six genes expressed in bones and teeth encode the current members of the SIBLING family of proteins. Connect Tissue Res.44(Suppl 1), 33–40 (2003) (PMID: 12952171). [PubMed] [Google Scholar]
- 26.Bellahcène, A. et al. Small integrin-binding ligand N-linked glycoproteins (SIBLINGs): Multifunctional proteins in cancer. Nat. Rev. Cancer8(3), 212–226. 10.1038/nrc2345 (2008). [DOI] [PMC free article] [PubMed] [Google Scholar]
- 27.Platzer, G. et al. The metastasis-associated extracellular matrix protein osteopontin forms transient structure in ligand interaction sites. Biochemistry-US50(27), 6113–6124. 10.1021/bi200291e (2011). [DOI] [PubMed] [Google Scholar]
- 28.Wang, J. et al. Osteopontin aggravates acute lung injury in influenza virus infection by promoting macrophages necroptosis. Cell Death Discov.8(1), 97. 10.1038/s41420-022-00904-x (2022). [DOI] [PMC free article] [PubMed] [Google Scholar]
- 29.Sampayo-Escobar, V. et al. Osteopontin plays a pivotal role in increasing severity of respiratory syncytial virus infection. PLoS One13(4), e0192709. 10.1371/journal.pone.0192709 (2018). [DOI] [PMC free article] [PubMed] [Google Scholar]
- 30.van der Windt, G. J. et al. Osteopontin impairs host defense during pneumococcal pneumonia. J. Infect. Dis.203(12), 1850–1858. 10.1093/infdis/jir185 (2011). [DOI] [PubMed] [Google Scholar]
- 31.Koguchi, Y. et al. High plasma osteopontin level and its relationship with interleukin-12-meDIAted type 1 T helper cell response in tuberculosis. Am. J. Resp. Crit. Care167(10), 1355–1359. 10.1164/rccm.200209-1113OC (2003). [DOI] [PubMed] [Google Scholar]
- 32.Rittling, S. R. et al. Protective role of osteopontin in endodontic infection. Immunology.129(1), 105–114. 10.1111/j.1365-2567.2009.03159.x (2009). [DOI] [PMC free article] [PubMed] [Google Scholar]
- 33.Shinohara, M. L. et al. Osteopontin expression is essential for interferon-alpha production by plasmacytoid dendritic cells. Nat. Immunol.7(5), 498–506. 10.1038/ni1327 (2006). [DOI] [PMC free article] [PubMed] [Google Scholar]
- 34.Kasetty, G. et al. Osteopontin protects against pneumococcal infection in a murine model of allergic airway inflammation. Allergy74(4), 663–674. 10.1111/all.13646 (2018). [DOI] [PubMed] [Google Scholar]
- 35.Trinh, H. K. T. et al. Osteopontin contributes to late-onset asthma phenotypes in adult asthma patients. Exp. Mol. Med.52(2), 253–265. 10.1038/s12276-020-0376-2 (2020). [DOI] [PMC free article] [PubMed] [Google Scholar]
- 36.Samitas, K. et al. Osteopontin expression and relation to disease severity in human asthma. Eur. Respir. J.37(2), 331–341. 10.1183/09031936.00017810 (2010). [DOI] [PubMed] [Google Scholar]
- 37.Ohshima, S. et al. Enhanced local production of osteopontin in rheumatoid joints. J. Rheumatol.29(10), 2061–2067 (2002) (PMID: 12375312). [PubMed] [Google Scholar]
- 38.Shinohara, M. L. et al. Engagement of the type I interferon receptor on dendritic cells inhibits T helper 17 cell development: Role of intracellular osteopontin. Immunity29(1), 68–78. 10.1016/j.immuni.2008.05.008 (2008). [DOI] [PMC free article] [PubMed] [Google Scholar]
- 39.Miyazaki, T. et al. Implication of allelic polymorphism of osteopontin in the development of lupus nephritis in MRL/lpr mice. Eur. J. Immunol.35(5), 1510–1520. 10.1002/eji.200425672 (2005). [DOI] [PubMed] [Google Scholar]
- 40.Weber, G. F. & Cantor, H. Differential roles of osteopontin/Eta-1 in early and late lpr disease. Clin. Exp. Immunol.126(3), 578–583. 10.1046/j.1365-2249.2001.01702.x (2001). [DOI] [PMC free article] [PubMed] [Google Scholar]
- 41.Cui, G. et al. Thrombin cleavage of osteopontin controls activation of hepatic stellate cells and is essential for liver fibrogenesis. J. Cell Physiol.234(6), 8988–8997. 10.1002/jcp.27571 (2018). [DOI] [PMC free article] [PubMed] [Google Scholar]
- 42.Briones-Orta, M. A. et al. Osteopontin splice variants and polymorphisms in cancer progression and prognosis. BBA-Rev Cancer1868(1), 93-108.A. 10.1016/j.bbcan.2017.02.005 (2017). [DOI] [PubMed] [Google Scholar]
- 43.Nardo, A. D. et al. Impact of osteopontin on the development of non-alcoholic liver disease and related hepatocellular carcinoma. Liver Int.40(7), 1620–1633. 10.1111/liv.14464 (2020). [DOI] [PMC free article] [PubMed] [Google Scholar]
- 44.Klement, J. D. et al. An osteopontin/CD44 immune checkpoint controls CD8+ T cell activation and tumor immune evasion. J. Clin. Invest.128(12), 5549–5560. 10.1172/JCI123360 (2018). [DOI] [PMC free article] [PubMed] [Google Scholar]
- 45.Yamate, T. et al. Analysis of osteopontin DNA in patients with urolithiasis. Urol. Res.28(3), 159–166. 10.1007/s002400000112 (2000). [DOI] [PubMed] [Google Scholar]
- 46.Gao, B. et al. A polymorphism of the osteopontin gene is related to urinary calcium stones. J. Urol.174(4 Pt 1), 1472–1476. 10.1097/01.ju.0000173012.28341.c3 (2005). [DOI] [PubMed] [Google Scholar]
- 47.Liu, C. C. et al. The impact of osteopontin promoter polymorphisms on the risk of calcium urolithiasis. Clin. Chim. Acta411(9–10), 739–743. 10.1016/j.cca.2010.02.007 (2010). [DOI] [PubMed] [Google Scholar]
- 48.Tang, H. et al. Upregulation of SPP1 Is a marker for poor lung cancer prognosis and contributes to cancer progression and cisplatin resistance. Front. Cell Dev. Biol.9, 646390. 10.3389/fcell.2021.646390 (2021). [DOI] [PMC free article] [PubMed] [Google Scholar]
- 49.Wang, Y. et al. Bioinformatics analysis identifies COL1A1, THBS2 and SPP1 as potential predictors of patient prognosis and immunotherapy response in gastric cancer. Biosci. Rep. 10.1042/BSR20202564 (2021). [DOI] [PMC free article] [PubMed]
- 50.Zeng, P. et al. Secreted phosphoprotein 1 as a potential prognostic and immunotherapy biomarker in multiple human cancers. Bioengineered13(2), 3221–3239. 10.1080/21655979.2021.2020391 (2022). [DOI] [PMC free article] [PubMed] [Google Scholar]
- 51.Lamort, A. S. et al. Osteopontin as a link between inflammation and cancer: The thorax in the spotlight. Cells.10.3390/cells8080815 (2019). [DOI] [PMC free article] [PubMed] [Google Scholar]
- 52.Icer, M. A. & Gezmen-Karadag, M. The multiple functions and mechanisms of osteopontin. Clin. Biochem.59, 17–24. 10.1016/j.clinbiochem.2018.07.003 (2018). [DOI] [PubMed] [Google Scholar]
- 53.Inoue, M. & Shinohara, M. L. Intracellular osteopontin (iOPN) and immunity. Immunol. Res.49(1–3), 160–172. 10.1007/s12026-010-8179-5 (2011). [DOI] [PMC free article] [PubMed] [Google Scholar]
- 54.Lin, E. Y. et al. Osteopontin (OPN)/SPP1: From its biochemistry to biological functions in the innate immune system and the central nervous system (CNS). Int. Immunol.35(4), 171–180. 10.1093/intimm/dxac060 (2023). [DOI] [PMC free article] [PubMed] [Google Scholar]
- 55.Li, S. & Jakobs, T. C. Vitamin C protects retinal ganglion cells via SPP1 in glaucoma and after optic nerve damage. Life Sci. Alliance10.26508/lsa.202301976 (2023). [DOI] [PMC free article] [PubMed] [Google Scholar]
- 56.Harada, H. et al. Gene expression of retinoic acid receptors, retinoid-X receptors, and cellular retinol-binding protein I in bone and its regulation by vitamin A. Endocrinology.136(12), 5329–5335. 10.1210/endo.136.12.7588278 (1995). [DOI] [PubMed] [Google Scholar]
- 57.Hadzir, S. N. et al. Ascorbic acid induces osteoblast differentiation of human suspension mononuclear cells. Cytotherapy16(5), 674–682. 10.1016/j.jcyt.2013.07.013 (2013). [DOI] [PubMed] [Google Scholar]
- 58.Jeradi, S. & Hammerschmidt, M. Retinoic acid-induced premature osteoblast-to-preosteocyte transitioning has multiple effects on calvarial development. Development143(7), 1205–1216. 10.1242/dev.129189 (2016). [DOI] [PMC free article] [PubMed] [Google Scholar]
- 59.Nam, S. M. et al. Effects of ascorbic acid on osteopontin expression and axonal myelination in the developing cerebellum of lead-exposed rat pups. Int. J. Environ. Res. Public Health10.3390/ijerph16060983 (2019). [DOI] [PMC free article] [PubMed] [Google Scholar]
Associated Data
This section collects any data citations, data availability statements, or supplementary materials included in this article.
Data Citations
- Wang, Y. et al. Bioinformatics analysis identifies COL1A1, THBS2 and SPP1 as potential predictors of patient prognosis and immunotherapy response in gastric cancer. Biosci. Rep. 10.1042/BSR20202564 (2021). [DOI] [PMC free article] [PubMed]
Supplementary Materials
Data Availability Statement
We intend to share individual deidentified participant data. Peripheral blood RNA sequencing data from 19 patients with sepsis and10 Healthy people are available in the China National GeneBank DataBase (CNGBdb) and can be found below: http://db.cngb.org/, under the accession: CNP0002611, you can access it now and it’s valid forever.