

Abstract
Introduction
Ensitrelvir, a novel oral inhibitor of the 3C-like protease of severe acute respiratory syndrome coronavirus 2 (SARS-CoV-2), has shown efficacy and safety in participants with mild to moderate coronavirus disease 2019 (COVID-19) with once-daily multiple doses of 375 mg on day 1 followed by 125 mg on days 2–5. The aims of this study were to characterize the pharmacokinetics of ensitrelvir and to explore its exposure–response relationships on the dose regimen.
Methods
Pharmacokinetic data, including 8034 plasma concentration datasets from 2060 participants, from two phase I and one phase II/III study in healthy participants and participants infected with SARS-CoV-2 were used to develop a population pharmacokinetic model. The correlation between exposure and drug response was evaluated using observed plasma concentrations and estimated pharmacokinetic parameters as pharmacokinetic indexes and viral RNA as drug response.
Results
A two-compartment model with a first-order absorption model effectively described plasma ensitrelvir concentrations. The effects of body weight on clearance and volume of distribution and of food conditions and formulation on the absorption rate constant were selected as significant covariates. The efficacy indexes changed in the active group, but the responses were similar across the exposure range in the phase II/III study (SCORPIO-SR) regardless of the effects of the pharmacokinetic covariates.
Conclusion
Population pharmacokinetics revealed that body weight is the most important covariate in the pharmacokinetics of ensitrelvir. The antiviral effect, independent of ensitrelvir exposure, was demonstrated on the current dose regimen for treatment of SARS-CoV-2 infection.
Supplementary Information
The online version contains supplementary material available at 10.1007/s40262-024-01446-4.
Key Points
| This is the first study to construct a population pharmacokinetic analysis model of ensitrelvir for treating SARS-CoV-2 infection. Body weight was an important factor affecting the pharmacokinetics of ensitrelvir. The ensitrelvir exposure–viral response was demonstrated. |
Introduction
Ensitrelvir is a novel oral inhibitor of the 3C-like protease of severe acute respiratory syndrome coronavirus 2 (SARS-CoV-2). This protease is essential for viral replication [1]. Ensitrelvir was approved in Japan on November 22, 2022, under the Emergency Regulatory Approval System [2] and on March 5, 2024, for participants aged > 12 years with mild to moderate SARS-CoV-2 infection, regardless of risk factors or vaccination status. The dose regimen for the treatment of coronavirus disease 2019 (COVID-19) is 5-day oral administration of a loading dose of 375 mg on day 1 followed by a maintenance dose of 125 mg from days 2–5 (375/125 mg) [3].
After a single oral administration of ensitrelvir, the maximum plasma concentration (Cmax) and area under the concentration–time curve extrapolated to infinity (AUC0–inf) increased in an almost dose-proportional manner across the dose ranges from 20 to 2000 mg in the fasted state [4]. Ensitrelvir reached maximum plasma concentration at around 2.50 h and declined with a terminal elimination half-life (t½,z) of 42.2 to 48.1 h after a single administration [4]. Ensitrelvir was eliminated via the urine to some extent, with 12.9–21.8% being recovered in the urine as unchanged ensitrelvir across dose groups ranging from 20 to 1000 mg [4]. The pharmacokinetic profiles of ensitrelvir were not meaningfully different among various populations, including healthy white participants, and were not substantially affected by food intake [5]. When evaluating drug interactions, ensitrelvir inhibits cytochrome P450 3A, P-glycoprotein, and breast cancer resistance protein [6, 7]. Based on pharmacokinetic characteristics from a clinical study [4] and a nonclinical study of antiviral effects in mice [8], 375/125 mg and a loading dose of 750 mg on day 1 followed by a maintenance dose of 250 mg from days 2–5 (750/250 mg) were selected as the test dose regimen for treatment of SARS-CoV-2 infection in a clinical phase II/III study (SCORPIO-SR) [9, 10]. The changes from baseline of SARS-CoV-2 titer on day 4 in both 125-mg and 250-mg groups were significantly greater than in the placebo group in phase IIb of SCORPIO-SR. The time to five COVID-19 symptoms was significantly shorter in the 125-mg group (167.9 h) than in the placebo group (192.2 h) in phase III of SCORPIO-SR. This study showed that ensitrelvir demonstrated a favorable antiviral efficacy and potential clinical benefit with an acceptable safety profile for both dosage regimens.
The results of the population pharmacokinetic analysis and exposure–response analysis of ensitrelvir should provide useful information for clinical use. Ensitrelvir is expected to be administered to participants with SARS-CoV-2 infection from a wide range of demographic backgrounds since it can be used regardless of risk factors or vaccination status. To understand ensitrelvir pharmacokinetics better over a wide range of patient populations, the aims of this study were to characterize ensitrelvir pharmacokinetics and explore its exposure–response relationships on the dose regimen.
Methods
Study Data
Pharmacokinetic data and demographic characteristics from two phase I studies (including effect of food and drug–drug interactions) in healthy participants and one phase II/III study (SCORPIO-SR) with participants infected with SARS-CoV-2 were used to develop a population pharmacokinetic model (Table 1). A total of 8034 plasma ensitrelvir concentration datasets from 2060 participants (4341 datasets from 175 healthy adult participants and 3693 datasets from 1885 participants infected with SARS-CoV-2) were used. In the phase I studies, ensitrelvir was administered as a single dose (20, 70, 250, 500, 1000, or 2000 mg) or as multiple doses (375 mg on day 1 and 125 mg once daily on days 2–5, or 750 mg on day 1 and 250 mg once daily on days 2–5). The effect of food was assessed in a two-way crossover design in fasted and fed states at a single dose of 375 mg. In the drug–drug interaction study, ensitrelvir was coadministered at a single dose of 500 mg in the fasted state with P-glycoprotein substrate (digoxin), breast cancer resistance protein, OATP1B1/1B3 substrate (rosuvastatin), and MATE1 and OCT1 substrate (metformin). In SCORPIO-SR, ensitrelvir was administered at 375 mg on day 1 and 125 mg once daily on days 2–5 or at 750 mg on day 1 and 250 mg once daily on days 2–5. All clinical studies were conducted with the protocol approved by the ethics committee at each site and in compliance with the Declaration of Helsinki and good clinical practice.
Table 1.
Summary of clinical studies used for population pharmacokinetic analysis
| Study | Dose and population | Dose (mg)a | N |
|---|---|---|---|
| Phase I adult study | Single dose in the fasted state for healthy male Japanese participants | 20, 70, 500, 1000, 2000 (suspension) | 30 |
| Effect of food for healthy male Japanese participants | 250 (suspension) | 8 | |
| Multiple doses in the fasted state once daily for healthy male Japanese and white participants | 375/125 (suspension) | 16 | |
| Multiple doses in the fasted state once daily for healthy male Japanese participants (DDI with midazolam on day 6) | 750/250 (suspension) | 8 | |
| Multiple doses in the fasted state once daily for healthy female Japanese participants | 375/125 (tablet) | 8 | |
| 750/250 (tablet) | 8 | ||
| DDI with dexamethasone or prednisolone | 750/250(tablet) | 28 | |
| Effect of food for healthy male Japanese participants | 125 (tablet) | 14 | |
| Multiple doses in the fasted state once daily for healthy female white participants | 375/125 (tablet) | 8 | |
| 750/250 (tablet) | 8 | ||
| Multiple doses in the fasted state once daily for elderly male Japanese participants | 375/125 (tablet) | 11 | |
| DDI with midazolam | 375/125 (tablet) | 14 | |
| Phase I DDI study | DDI with cocktail (digoxin, rosuvastatin, metformin) | 500 (tablet) | 14 |
| Phase II/III study | Phase IIa | 375/125 or 750/250 (tablet) | 43 |
| Phase IIb | 272 | ||
| Phase III | 1180 | ||
| Phase IIb/III | 390 |
DDI drug–drug interaction
aDoses: 375/125: 375 mg on day 1 and 125 mg on days 2–5. 750/250: 750 mg on day 1 and 250 mg on days 2–5
Population Pharmacokinetic Analysis
Base Model Building
Population pharmacokinetic modeling was performed using nonlinear mixed-effect modeling software, NONMEM version 7.4 (ICON Development Solutions, USA) with a first-order conditional estimation with an interaction [11]. Standard one- and two-compartment models were tested to describe the plasma concentration profiles of ensitrelvir. The one-compartment model included the following parameters: apparent total clearance (CL/F), apparent volume of distribution in central compartments (Vc/F), and first-order rate of absorption (Ka). The two-compartment model included the following parameters: CL/F, Vc/F, apparent volume of distribution in peripheral compartments (Vp/F), apparent inter-compartmental clearance (Q/F), and Ka. The absorption lag time (ALAG) was tested to find an appropriate model. Inclusion of ALAG into the base model was determined with a significance level of 0.01 based on the χ2 test (p < 0.01, a decrease in objective function value [OBJ] > 6.64 for 1 degree of freedom). Moreover, ALAG was excluded from the base model if its 95% confidence interval (CI) included 0.
The interindividual variability (IIV) for certain pharmacokinetic parameters was assumed to follow a log-normal distribution, and an exponential error model was used.
where Pi represents the ith individual value of pharmacokinetic parameters, TVP represents the typical value of population pharmacokinetic parameters, and ηP,i denotes the difference between the ith individual and typical pharmacokinetic parameter. The ηP,i is a random variable of the IIV parameters and is normally distributed with a mean of 0 and a variance of ωP2.
The IIV was considered for CL/F, Vc/F, Q/F, Vp/F, and Ka.
When IIV could not be estimated appropriately, removal of the IIV term was considered.
After model building, the covariance between pairs of IIV parameters was examined graphically by plotting ηP,i for different pharmacokinetic parameters. This was to test the necessity of covariance for IIV in the model and whether covariance should be added to account for the observed correlations. The inclusion of covariance of IIV was decided based on the numerical stability of the resulting model or on the goodness-of-fit (GOF) plots. Shrinkage in each ηP,i (sh_ηP) was computed with NONMEM.
The additive error model, proportional error model, and/or the combination error model (the additive error + the proportional error model) were tested as an intraindividual (residual) variability. The additive error model, the proportional error model, and the combination error model are given by the following equations.
where Yij represents the observed jth plasma ensitrelvir concentration in the ith individual, IPREDij represents the jth plasma ensitrelvir concentration predicted from the ith individual pharmacokinetic parameters, and ε (ε1,ij, ε2,ij) denotes the difference between the jth observed and predicted plasma ensitrelvir concentration in the ith individual. The ε (ε1,ij, ε2,ij) is a random variable of the IIV parameters from population mean and is normally distributed with a mean of 0 and a variance of σ2 (σ1, σ2). Shrinkage in ε (sh_ε) was computed with NONMEM.
The error model for IIV was selected from the diagnostic plots and/or the value of OBJ at the statistical significance level of 0.01 (p < 0.01) based on the χ2 test, that is, ΔOBJ < − 6.64 for 1 degree of freedom represents a statistically significant model improvement. The structure of the base model with error models was expanded as necessary to best reflect the characteristic shape of the observations over time. When IIV could not be estimated appropriately, removal of the IIV term was considered. The structural model (one- or two-compartment models) was selected by visual inspection of plasma concentration profiles and the Akaike information criterion (AIC) and Bayesian information criterion (BIC) to compare structural models.
Covariate Model Building
After building a base model, the influence of background data was assessed to build a covariate model. The following elements were tested as covariates on CL/F: body weight (BW), body mass index (BMI), age, adolescent (12 to < 18 years or ≥ 18 years), sex, race (Asian, white, or other), country (Japan, Korea, or Vietnam), aspartate aminotransferase (AST), alanine aminotransferase (ALT), albumin (ALB), total bilirubin, creatinine clearance (CrCL), serum creatinine, estimated glomerular filtration rate (eGFR), absolute eGFR (eGFRabs), and health status (healthy or infected by SARS-CoV-2). BW, BMI, age, adolescent, sex, race, country, ALB, and health status were tested as covariates on Vc/F. The effects of food and formulation were tested as covariates on Ka. The effects of food, formulation, and health status were tested as covariates on relative bioavailability (F1). Before building covariate models, we generated plots for relationships between covariates and pharmacokinetic parameters for visual inspection of covariates based on the base model.
For continuous covariates, a power model was used as follows:
where COV is the value of a covariate, and θ1 and θ2 are typical values of model parameters to be estimated with the equation.
The categorical covariates were tested by the multiplicative model.
where CAT_i is a series of indicator variables with a value of either 0 or 1 assigned (CAT_1, CAT_2, …, CAT_n representing the n levels of CAT; e.g., CAT_1 = 0 for male and CAT_1 = 1 for female), and θCAT=0 is the typical value of model parameters to be estimated when the individual categorical covariate index variable is equal to 0, and θCAT_i is the ith relative influence of model parameters to be estimated for the categorical covariate index variable when CAT_i is equal to 1.
Inclusion of covariates into the base model was determined with the significance level of 0.01 based on the χ2 test (p < 0.01, a decrease in OBJ > 6.64 for 1 degree of freedom).
Each covariate was individually tested by incorporating it into the base model as a screening. For highly correlated covariates with correlation coefficients of ≥ 0.7, the most influential factor was chosen based on OBJ to avoid confounding in the estimation of covariate effects. The significant covariates that reduced OBJ were included stepwise into the base model to construct a full model. In stepwise backward deletion, deletion of covariates from the full model was determined with the significance level of 0.005 based on the χ2 test (p < 0.005, an increase in OBJ > 7.88 for 1 degree of freedom) to construct the final model. The stepwise covariate model (SCM) building tool in Perl-speaks NONMEM (version 4.9) was used for covariate screening, forward selection, and backward deletion according to the SCM user guide [12]. One model for each relevant parameter-covariate relationship was prepared and tested in a univariate manner with this tool. This tool was used for only automating repeated tasks with procedures that were the same in essence as manual handling. Inferential assessment and stepwise backward deletion were performed to delete insignificant covariates from the full model. In the inferential assessment, ratios of parameters with certain values of covariate relative to the reference value and their 90% CIs were calculated based on the parameter estimates and standard error calculated with NONMEM. The clinical impact of the covariate effect was considered non-significant if the 90% CIs were within the bioequivalent range of 0.80–1.25.
Model Evaluation
The base and final models were evaluated by using point estimates of pharmacokinetic parameters and their respective relative standard error. Also, several GOF plots with reference lines (identity, zero line, etc.) were generated for model diagnostics.
The final model was expected to meet the following criteria:
A “minimization successful” statement is indicated by NONMEM.
A covariance step is completed without warning messages from NONMEM.
The number of significant digits is ≥ 3 for all estimated θ.
Final estimates of θ are not close to boundaries.
GOF plots do not indicate unexplained trends.
The predictive performance of a final model was evaluated using a visual predictive check (VPC) [13]. The VPC stratified by race was also performed to evaluate the predictive performance for each race. In addition to the VPC, the final model was evaluated with a bootstrapping technique [14]. Bootstrap replications are performed, and the associated mean parameter estimates and their corresponding 95% CI are derived from the replicates.
Post Hoc Parameters
The individual systemic exposures of ensitrelvir, such as maximum plasma concentration on day 1 (Cmax_d1), the area under the plasma concentration curve on day 1 (AUC_d1), and plasma concentration of ensitrelvir 24 h postdose on day 1 (C24_d1) following a dose of ensitrelvir 375 mg on day 1 and then 125 mg on days 2–5 or a dose of 750 mg on day 1 and then 250 mg on days 2–5 were calculated by determining empirical Bayesian estimations of pharmacokinetic parameters of the participants in phase III of SCORPIO-SR from the final population pharmacokinetic model.
Forest plots were created for the covariates that were finally selected. In the forest plots, ratios of parameters (Cmax and AUC) with a certain value of covariate relative to a reference value and their 90% CIs were calculated based on the parameter estimate and standard error calculated with NONMEM and compared with an insignificant range (bioequivalent range 0.80–1.25) to evaluate the impact of the covariate effect.
Exposure and Response Analysis
The relationships between pharmacokinetic parameters such as C24 or post hoc pharmacokinetic parameters (Cmax_d1, AUC_d1, and C24_d1) and efficacy endpoints such as change from baseline in SARS-CoV-2 viral RNA on day 4 in phase III of SCORPIO-SR were assessed using data from the ensitrelvir dose groups and the placebo group. The pharmacokinetic parameters in the placebo group were treated as zero (0). The lower limits of quantity (LLOQ) for phase II/III part and phase III part in SCORPIO-SR study were 2.08 and 3.4 µg/mL, respectively. When the value of viral RNA was lower than the LLOQ, the value of LLOQ was used to calculate the change of viral RNA from baseline. Boxplots were presented to explain the exposure-response, and pharmacokinetic parameters (Cmax_d1, AUC_d1, and C24_d1) were categorized into quartiles.
Results
Model Building
A total of 8034 plasma ensitrelvir concentration data from 2060 participants (4341 data from 175 healthy adult participants and 3693 data from 1885 participants infected with SARS-CoV-2) were used in the population pharmacokinetic analyses. The background data are summarized in Table 2.
Table 2.
Summary of background characteristics (N = 2060)
| Background characteristic | Mean ± standard deviation | Median (range) |
|---|---|---|
| Body weight (kg) | 63.8 ± 13.6 | 62.6 (35.0–156.0) |
| BMI (kg/m2) | 23.0 ± 3.8 | 22.5 (7.0–49.8) |
| Age (years) | 36.5 ± 12.8 | 35 (12–76) |
| ALT (U/L) | 26.3 ± 23.4 | 19 (0–349) |
| AST (U/L) | 25.4 ± 13.7 | 22 (10–272) |
| BIL (mg/dL) | 0.5 ± 0.3 | 0.5 (0.1–2.1) |
| ALB (g/dL) | 4.4 ± 0.3 | 4.4 (0.5–5.8) |
| CrCL (mL/min) | 115.3 ± 30.7 | 111.9 (46.0–354.6) |
| Scr (mg/dL) | 0.76 ± 0.17 | 0.76 (0.37–1.43) |
| eGFR (mL/min/1.73 m2) | 88.1 ± 19.8 | 85.9 (36.4–242.9) |
| eGFRabs (mL/min) | 84.3 ± 20.3 | 82.5 (31.5–278.8) |
| Formulation (suspension:tablet)a | 62 (3.0):1998 (97.0) | |
| Sex (male:female)a | 1183 (57.4):877 (42.6) | |
| Adolescent (12 to < 18 years : ≥ 18 years)a | 34 (1.7):2026 (98.4) | |
| Race (Asian:White:others)a | 2030 (98.5):25 (1.2):5 (0.2) | |
| Country (Japan:Korea:Vietnam)a | 1484 (72.0):130 (6.3):446 (21.7) | |
| Health status (healthy:infected with SARS-CoV-2)a | 175 (8.5):1885 (91.5) | |
ALB albumin, ALT alanine aminotransferase, AST aspartate aminotransferase, BIL total bilirubin, BMI body mass index, CrCL creatinine clearance, eGFR estimated glomerular filtration rate, eGFRabs absolute estimated glomerular filtration rate, Scr serum creatinine
aNumber (%) of participants
bSummary of food condition in phase I study and drug–drug interaction study included multiple counts per participant in cohort P because of the crossover design with different food conditions
A two-compartment model was selected as a structural pharmacokinetic model because the ensitrelvir concentration appeared to decline in a biphasic manner in the phase I study and the two-compartment models decreased the AIC and BIC compared with the corresponding one-compartment model. The combination error model was chosen from three error models for IIV (additive, proportional, or combination error model) based on the OBJ. The two-compartment model with a combination error model was selected as the base model (model no. 006).
The effects of intrinsic or extrinsic factors on principal pharmacokinetic parameters, CL/F, Vc/F, Ka, and F1 were investigated with the covariate screening and forward selection procedure. Continuous covariate pairs that had a strong correlation were identified before forward selection. BW and BMI, CrCL, and eGFRabs; eGFR and eGFRabs; and ALT and AST were found with coefficients of correlation of ≥ 0.7. As a result of the screening, BW, CrCL, and ALT were selected as covariates for the forward selection step because their difference in the OBJ (ΔOBJ) were larger than those of BMI, eGFRabs (or eGFR), and AST and were highly correlated with each other. Covariates excluding BMI, eGFRabs, eGFR, and AST were tested in the forward selection. The model building process is shown in Table S1 in the Supplementary Material. Model no. 212 was selected as the last model of the SCM building tool because minimization was terminated due to rounding errors in model no. 213 and model no. 215. The $COV step to estimate the variance–covariance of the population parameters was added automatically (model no. 301). The IIV of the Vp/F was removed from model no. 301 because the parameter estimate was negligible (almost 0) and shrank completely in model no. 301. For the full model (no. 302), the effects included were country, health status, and BW on CL/F, ALB, country, sex, and BW on Vc/F; food and formulation on Ka; and food, formulation, and health status on F1. The backward deletion did not remove any covariates from the full model. However, the effect of health status on CL/F; the effects of ALB, country, and sex on Vc/F; and the effects of food, formulation, and health status on F1 from model no. 302 were removed step by step from the full model because their 90% CIs of parameter estimates fell into the insignificant range (0.80–1.25) based on inferential assessment (Fig. S1). Next, covariance of random IIV parameters between CL/F and Vc/F was incorporated because a correlation was found between them in the plot of η (model no. 509). The IIV of Q/F was removed from model no. 509 because its estimate and shrinkage were relatively large (ω2 = 1.03, shrinkage = 84.3%) (model no. 510). Model no. 511 was built by removing the effect of country on CL/F from model no. 510 because the 90% CIs of the parameter estimates fell into the non-significant range (0.80–1.25) based on inferential assessment (Fig. S2). No other covariate was removed, and the final model was model no. 511. The parameter estimates and the shrinkage of the final model are presented in Table 3 with the bootstrap estimates and CIs. The final model included the effect of BW on CL/F, the effect of BW on Vc/F, and the effects of food and formulation on Ka. The IIV for CL/F, Vc/F, and Ka decreased from the base model to the final model (28.9–21.3% for CL/F, 23.2–14.7% for Vc/F, and 88.1–72.9% for Ka). The model parameters were estimated appropriately based on % relative standard error (%RSE), the shrinkage, and the inferential assessment (Fig. S3).
Table 3.
Population pharmacokinetic parameter estimates for the final model (model no. 511) and bootstrap estimations
| Pharmacokinetic parameter (unit) | Estimate (95% CI) | %RSE | Bootstrap estimate | |
|---|---|---|---|---|
| Median (95% CI) | ||||
| Ka (1/h) | 1.50 (1.25–1.75) | 8.6 | 1.50 (1.23–1.80) | |
| CL/F (L/h) | 0.211 (0.208–0.214) | 0.8 | 0.211 (0.207–0.214) | |
| Vc/F (L) | 14.7 (13.9–15.5) | 2.7 | 14.8 (13.9–15.5) | |
| Q/F (L/h) | 0.539 (0.321–0.757) | 20.6 | 0.534 (0.331–0.823) | |
| Vp/F (L) | 2.50 (1.80–3.20) | 14.3 | 2.49 (1.74–3.26) | |
| Effect of food on Ka | 0.594 (0.398–0.790) | 16.8 | 0.599 (0.447–1.00) | |
| Effect of formulation on Ka | 0.362 (0.262–0.462) | 14.1 | 0.367 (0.280–0.469) | |
| Effect of body weight on CL/F | 0.521 (0.456–0.586) | 6.4 | 0.527 (0.459–0.585) | |
| Effect of body weight on Vc/F | 1.04 (0.960–1.12) | 3.9 | 1.04 (0.959–1.11) | |
| Interindividual variability | ||||
| Ka (%) | 72.9 (64.3–80.6) | 11.3 | 72.1 (64.4–80.4) | |
| CL/F (%) | 21.3 (19.7–22.8) | 7.4 | 21.3 (20.0–23.0) | |
| Covariance between CL/F and Vc/F | 0.0216 (R = 0.691) (0.0173–0.0259) | 10.0 | 0.0217 (0.0179–0.0263) | |
| Vc/F (%) | 14.7 (12.8–16.3) | 12.3 | 14.6 (12.7–16.5) | |
| Intraindividual variability | ||||
| Proportional residual error (%) | 19.9 (18.5–21.3) | 3.6 | 19.8 (18.6–21.2) | |
| Additive residual error (µg/mL) | 0.0317 (0.0224–0.0410) | 14.9 | 0.0331 (0.00945–0.0570) | |
| Shrinkage | ||||
| sh_ηp (Ka) (%) | 68.4 | – | – | |
| sh_ηp (CL/F) (%) | 23.9 | – | – | |
| sh_ηp (Vc/F) (%) | 33.1 | – | – | |
| sh_ε (%) | 10.1 | – | – | |
CI confidence interval, CL/F apparent total clearance, Ka first-order rate of absorption, Q/F apparent inter-compartmental clearance, R coefficient of correlation, sh_ηp shrinkage in the standard deviation of interindividual variability parameters η, sh_ε shrinkage in the standard deviation of intraindividual variability parameters ε, Vc/F apparent volume of distribution in central compartments, Vp/F apparent volume of distribution in peripheral compartments, %RSE relative standard error in percent
Ka = 1.50 × (0.594 for food) × (0.362 for formulation); CL/F = 0.211 × (body weight/62.6)0.521; Vc/F = 14.7 × (body weight/62.6)1.04; Q/F = 0.539; Vp/F = 2.50; Food: 1 = administration within 2 h after a meal, 0 = other; Formulation: 1 = tablet, 0 = suspension
Model Evaluation
GOF plots of the final model are presented in Fig. 1a and b. The final model adequately described the observed ensitrelvir plasma concentrations with absence of bias. The relationships of the empirical Bayesian-estimated ηs of the final model to covariates are presented in Fig 2a–d. The trends of the relationships between ηs and the covariates for the base model disappeared for the final model. The results of the prediction-corrected VPC (pcVPC) of all the data following multiple doses of ensitrelvir in SCORPIO-SR for the final model are presented by race in Fig. 3. The pcVPC indicated that the final model adequately described the observed data. The concentration–time profiles of the observed median, 10th, and 90th percentiles for the ensitrelvir concentrations were adequately captured by each 95% CI. They supported the conclusion that the final model adequately described the observed data. The bootstrap replication for the final model was performed. Of 500 NONMEM runs, 451 runs (90.2%) were completed successfully. The bootstrap parameter estimates (median and 95% CI) are presented in Table 3. The 95% CIs for bootstrap estimates were similar to those calculated from the standard errors.
Fig. 1.
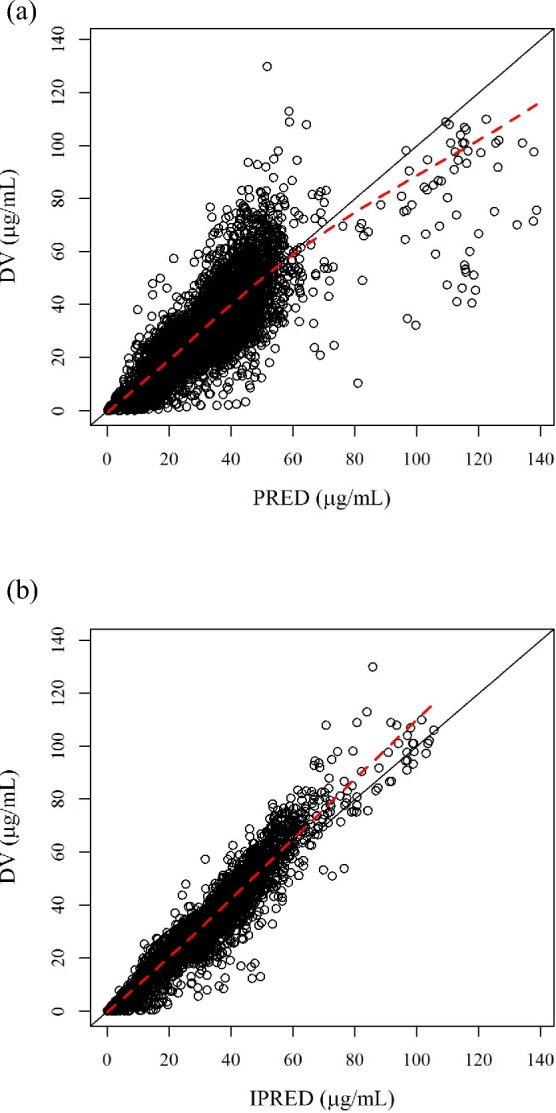
Goodness-of-fit plots for final model (model no. 511). a PRED vs DV, b IPRED vs DV. DV observed values, PRED population predicted values, IPRED individual predicted values. The solid line indicates y = x; the dashed line is the locally weighted scatterplot smoothing line
Fig. 2.

Relationships of empirical Bayesian-estimated ηs of the final model to covariates. Body weight vs a ηs of CL/F and b ηs of Vc/F. c Food condition and d formulation vs ηs of Ka. CL/F apparent total clearance, Ka first-order rate of absorption, Vc/F apparent volume of distribution in central compartments
Fig. 3.

Prediction-corrected visual predictive check of data following multiple doses of S-217622 in phase II/III study for the final model. Circle predicted value corrected observed value, Solid line median of predicted value corrected observed value, dotted line 10th and 90th percentiles of predicted value corrected observed value, dark gray area 95% confidence interval of model predicted median, gray area model predicted 95% confidence intervals 10th and 90th percentile
Post Hoc Parameters
The Cmax_d1, AUC_d1, and C24_d1 calculated by determining empirical Bayesian estimations of pharmacokinetic parameters in SCORPIO-SR for participants with the final population pharmacokinetic model are summarized in Table 4.
Table 4.
Summary of Bayesian-estimated estimates for exposure following multiple dose administration in the phase II/III study
| Dose and parameter | N | Mean | SD | CV(%) | Minimum | Median | Maximum |
|---|---|---|---|---|---|---|---|
| 125 mg group | |||||||
| CL/F (L/h) | 943 | 0.216 | 0.0383 | 17.7 | 0.116 | 0.212 | 0.400 |
| Vc/F (L) | 943 | 15.1 | 3.66 | 24.3 | 7.66 | 14.7 | 34.4 |
| Cmax_d1 (μg/mL) | 943 | 23.4 | 5.00 | 21.3 | 10.3 | 22.9 | 41.0 |
| AUC_d1 (μg*h/mL) | 943 | 437.5 | 96.53 | 22.1 | 127.0 | 432.0 | 784.7 |
| C24_d1 (μg/mL) | 943 | 16.6 | 3.04 | 18.3 | 8.43 | 16.5 | 27.6 |
| Cmax_d5 (μg/mL) | 925 | 26.6 | 4.87 | 18.3 | 14.3 | 26.2 | 46.8 |
| AUC_d5 (μg*h/mL) | 925 | 578.5 | 116.7 | 20.2 | 224.5 | 568.3 | 1156 |
| C24_d5 (μg/mL) | 925 | 19.5 | 3.48 | 17.8 | 10.5 | 19.2 | 35.2 |
| Entire Cmax (μg/mL) | 925 | 26.6 | 4.88 | 18.3 | 14.3 | 26.2 | 46.8 |
| Entire AUC (μg*h/mL) | 925 | 2573 | 463.1 | 18.0 | 1404 | 2531 | 4429 |
| 250 mg group | |||||||
| CL/F (L/h) | 942 | 0.201 | 0.0379 | 18.9 | 0.0963 | 0.198 | 0.353 |
| Vc/F (L) | 942 | 14.5 | 3.40 | 23.5 | 7.31 | 14.1 | 28.1 |
| Cmax_d1 (μg/mL) | 942 | 48.9 | 10.7 | 21.9 | 24.9 | 47.7 | 86.9 |
| AUC_d1 (μg*h/mL) | 942 | 909.5 | 205.1 | 22.6 | 375.0 | 887.3 | 1617 |
| C24_d1 (μg/mL) | 942 | 34.8 | 6.70 | 19.2 | 19.4 | 34.2 | 61.0 |
| Cmax_d5 (μg/mL) | 920 | 56.4 | 11.0 | 19.6 | 31.9 | 55.1 | 104 |
| AUC_d5 (μg*h/mL) | 920 | 1233 | 269.5 | 21.9 | 615.4 | 1205 | 2502 |
| C24_d5 (μg/mL) | 920 | 41.8 | 8.05 | 19.3 | 24.3 | 40.8 | 80.9 |
| Entire Cmax (μg/mL) | 920 | 56.4 | 11.0 | 19.5 | 31.9 | 55.1 | 104 |
| Entire AUC (μg*h/mL) | 920 | 5433 | 1037 | 19.1 | 3090 | 5317 | 9652 |
AUC_d1/d5 area under the concentration–time curve on day 1 or day 5, CL/F apparent total clearance, Cmax_d1/d5 maximum plasma concentration on day 1 or day 5, CV coefficient of variation, C24_d1/d5 plasma concentration of ensitrelvir 24 h postdose on day 1 or day 5, SD standard deviation; Vc/F apparent volume of distribution in central compartments
Doses: 125 mg group: 375 mg on day 1 and 125 mg on days 2–5; 250 mg group: 750 mg on day 1 and 250 mg on days 2–5
Exposure and Response Analysis
To assess the relationship between exposure and virological efficacy, the box plot for the relationships between C24 on day 1 and the change from baseline in the amount of SARS-CoV-2 viral RNA on day 4 are presented in Fig. 4 (Fig. S4 in the Supplementary Material for Cmax and AUC). The change from baseline in the amount of SARS-CoV-2 viral RNA was lower in the ensitrelvir dosing group than in the placebo group, and the virus RNA decreased to a similar extent in all categories within the exposure range evaluated in this study.
Fig. 4.
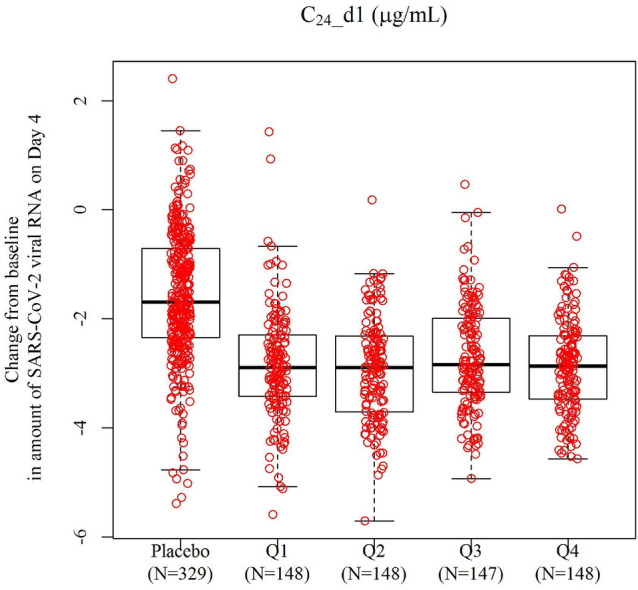
Relationship between change from baseline of SARS-CoV-2 virus RNA on day 4 and plasma concentration of ensitrelvir 24 h postdose (C24) on day 1 in phase III of SCORPIO-SR. Box 25th percentile (lower quartile), 75th percentile (upper quartile) and median; lower bar lower fence (25th percentile − 1.5 × (upper quartile − lower quartile)) or minimum observation when larger than lower fence; upper bar upper fence (75th percentile + 1.5 × (upper quartile − lower quartile)) or maximum observation when smaller than upper fence
Discussion
The population pharmacokinetic model of ensitrelvir, which is an oral inhibitor of the 3C-like protease of SARS-CoV-2, was built using data from two phase I studies, including assessments of the effects of food, race, sex, and drug–drug interaction, and data from one phase II/III study (SCORPIO-SR) of participants infected with SARS-CoV-2. In SCORPIO-SR, the treatment of SARS-CoV-2 infection was investigated with two dose groups of ensitrelvir: 375/125 mg and 750/250 mg. Both dose groups showed rapid clearance of SARS-CoV-2 [15]. The 375/125 mg dose showed a significant difference in the time to resolution of COVID-19 symptoms according to a Peto–Prentice generalized Wilcoxon test [16] and was approved in Japan in 2024.
Since the one-compartment and two-compartment models have four different parameters, including IIV, they cannot be directly compared using OBJ. Thus, the determination was made based on the plasma–concentration profile and AIC and BIC. Through screening, the factors that did not reduce OBJ by more than 6.64 (p < 0.01) were excluded from the covariate model building. The SCM building tool in Perl-speaks NONMEM automatically performs stepwise forward selection and stepwise backward selection according to the specified criteria. If SCM is performed with multiple correlated factors included as covariate candidates, appropriate factor selection is not possible due to multicollinearity. Therefore, the correlation between each covariate candidate was investigated, and if the absolute value of the correlation coefficient was ≥ 0.7, the covariate candidates with a smaller decrease in OBJ were excluded. SCM completed the stepwise forward selection process for all remaining covariate candidates. However, “minimization terminated” occurred because of rounding errors at three steps before the full model. Although we had to check the covariate selection process of SCM to select the final model, 281 runs of 16 steps were automatically executed in stepwise forward selection by SCM. Therefore, SCM can be a powerful tool for covariate exploration of population pharmacokinetic models [17–19]. No covariates were excluded in the backward selection process. However, the covariates (ALB on Vc/F, food on F1, sex on Vc/F, formulation on F1, and health status on CL/F and F1) were excluded from the full model because they were not considered to be meaningful covariates as the variation of pharmacokinetic was within the range of 0.8–1.25 relative to the population mean. The population pharmacokinetic model will be used in drug development strategies to plan clinical trials (e.g., dose, subpopulations) based on meaningful variables affecting the pharmacokinetics, and in clinical situations to predict exposure or to adjust a dose to achieve optimal exposure according to the covariates. Therefore, it is important for the population pharmacokinetic model to be constructed based on meaningful covariates.
The final model included the effect of BW on CL/F, the effect of BW on Vc/F, and the effects of food and formulation on Ka. BW was the most important covariate in the pharmacokinetics of ensitrelvir. However, the minimum and maximum weights of participants in this data were 35.0 and 156.0 kg, respectively, and the ranges of the ratios of the minimum and maximum values to the median of BW for Cmax and AUC were 0.410–1.741 and 0.623–1.353, respectively. As for the effect of food on Ka, the estimate of the final model was 0.594 for fed to fasted. The time to reach Cmax with administration in the fed state with a high-fat/high-calorie meal was delayed from 2.50 to 6.00 h compared with administration in the fasted state, but the phase I study showed that Cmax was not affected. It was considered that the shrinkage for Ka was 68.4% because of the lack of data on the absorption phase in SCORPIO-SR. However, the omega of Ka would be necessary because the large omega of Ka (72.9%) and small %RSE (11.3%) indicated its contribution to describe drug absorption. Suspensions were used in part of the phase I study, but only the tablet form was used in SCORPIO-SR and for clinical use.
The mean C24 on day 1 for the 125-mg group and the 250-mg group in SCORPIO-SR were 16.6 µg/mL and 34.8 µg/mL, respectively, which exceeded the plasma concentrations required to reduce virus titer in lung tissue by 2 log (6.09 µg/mL) [20]. Therefore, both the 125-mg group and the 250-mg group reached sufficient concentrations after the first administration to expect antiviral effects. The relationship between change from baseline SARS-CoV-2 viral RNA load on day 4 and C24 on day 1 was assessed in phase III of SCORPIO-SR. The change from baseline in the SARS-CoV-2 RNA load was lower in the ensitrelvir dosing groups than in the placebo group, and the virus RNA load decreased to a similar extent in all categories within the exposure range evaluated, regardless of the dose group in this study. This tendency was also independent of the SARS-CoV-2 viral RNA load at baseline (Fig. S5). Furthermore, although BW influences exposure, it did not seem to cause a difference in antiviral efficacy among these dosage regimens. Therefore, the antiviral effects did not differ between the 375/125 mg and 750/250 mg doses or between 8.43 μg/mL (minimum on 375/125 mg dose) and 61.0 μg/mL (maximum on 750/250 mg dose) of C24 on day 1.
One major limitation of this study is that 98.5% of participants in this analysis were Asian. BW is the covariate on the pharmacokinetics of ensitrelvir from the results of this population pharmacokinetic analysis. The weight range of Asians in SCORPIO-SR was 35–156 kg, covering most BW distributions in other races. Therefore, in terms of BW, our results could be extrapolated to other races. Furthermore, we consider that the relationship between the pharmacokinetics of ensitrelvir and the antiviral effect is not associated with race because the drug works on the virus. Further investigations are necessary to fully address the effect of race.
Conclusions
The population pharmacokinetic model was developed based on the plasma ensitrelvir concentration data from participants, including those infected with SARS-CoV-2, and BW was the most important covariate for ensitrelvir pharmacokinetics. The expected exposures for an antiviral effect at the 375/125 mg dose were achieved regardless of BW. The population pharmacokinetic model should be useful for understanding the pharmacokinetic characteristics of ensitrelvir.
Supplementary Information
Below is the link to the electronic supplementary material.
Declarations
Funding
This study was funded by Shionogi & Co., Ltd.
Conflicts of Interest
All authors are employees of Shionogi & Co., Ltd.
Ethics approval
The study was approved by Council for International Organizations of Medical Sciences International ethical guidelines and conducted in accordance with the Declaration of Helsinki and International Council for Harmonisation guidelines for good clinical practice. The SCORPIO-SR study (Phase 2/3 study of S-217622) was conducted in Japan with the approval of the ethics committee of a Japanese medical institution. Please see the Japanese registry site below. https://jrct.niph.go.jp/en-latest-detail/jRCT2031210350
Consent to Participate
All participants gave their written informed consent for participation in the study.
Consent for Publication
Not applicable.
Availability of Data and Material
Shionogi & Co, Ltd is committed to disclosing the synopses and results of its clinical trials and sharing the clinical trial data with researchers on reasonable request. For further details, please refer to the websites of Shionogi & Co, Ltd (https://www.shionogi.com/shionogi/global/en/company/policies/shionogi-group-clinical-trialdata-transparency-policy.html) and Vivli (https://vivli.org/).
Code Availability
The code cannot be made public because it is a macro linked to our internal system.
Author Contributions
Conceptualization: TI, RS, RK. Methodology: TI, RS, RK. Formal analysis: TI, RS. Investigation: TI, RS, RK. Interpretation: TI, RS, RK. Writing: TI, RS, RK.
References
- 1.Unoh Y, Uehara S, Nakahara K, Nobori H, Yamatsu Y, Yamamoto S, et al. Discovery of S-217622, a noncovalent oral SARS-CoV-2 3CL protease inhibitor clinical candidate for treating COVID-19. J Med Chem. 2022;65(9):6499–512. [DOI] [PMC free article] [PubMed] [Google Scholar]
- 2.Xocova® (Ensitrelvir Fumaric Acid) tablets 125 mg approved in Japan for the treatment of SARS-CoV-2 infection, under the emergency regulatory approval system. https://www.shionogi.com/global/en/news/2022/11/e20221122.html. Accessed 15 Apr 2024.
- 3.Xocova® (Ensitrelvir Fumaric Acid) Tablets 125mg Approved in Japan for the Treatment of SARS-CoV-2 Infection. https://www.shionogi.com/us/en/news/2024/03/shionogi-announces-xocova-ensitrelvir-fumaric-acid-obtained-standard-approval-in-japan-for-the-treatment-of-sars-cov-2-infection.html. Accessed 15 Apr 2024.
- 4.Shimizu R, Sonoyama T, Fukuhara T, Kuwata A, Matsuo Y, Kubota R. Safety, tolerability, and pharmacokinetics of the novel antiviral agent ensitrelvir fumaric acid, a SARS-CoV-2 3CL protease inhibitor, in healthy adults. Antimicrob Agents Chemother. 2022;66:e00632-e722. 10.1128/aac.00632-22. [DOI] [PMC free article] [PubMed] [Google Scholar]
- 5.Shimizu R, Sonoyama T, Fukuhara T, Kuwata A, Matsuo Y, Kubota R. A phase 1 study of ensitrelvir fumaric acid tablets evaluating the safety, pharmacokinetics and food effect in healthy adult populations. Clin Drug Investig. 2023;43:785–97. 10.1007/s40261-023-01309-z. [DOI] [PMC free article] [PubMed] [Google Scholar]
- 6.Shimizu R, Sonoyama T, Fukuhara T, Kuwata A, Matsuo Y, Kubota R. Evaluation of the drug–drug interaction potential of ensitrelvir fumaric acid with cytochrome P450 3A substrates in healthy Japanese adults. Clin Drug Investig. 2023;43:335–46. 10.1007/s40261-023-01265-8. [DOI] [PMC free article] [PubMed] [Google Scholar]
- 7.Shimizu R, Matsuzaki T, Oka R, Sonoyama T, Fukuhara T, Kuwata A, et al. Evaluation of drug-drug interactions of ensitrelvir, a SARS-CoV-2 3CL protease inhibitor, with transporter substrates based on in vitro and clinical studies. J Clin Pharm. 2023;63(8):918–27. 10.1002/jcph.2247. [DOI] [PubMed] [Google Scholar]
- 8.Nobori H, Fukao K, Kuroda T, Anan N, Tashima R, Nakashima M, et al. Efficacy of ensitrelvir against SARS-CoV-2 in a delayed-treatment mouse model. J Antimicrob Chemother. 2022;77:2984–91. 10.1093/jac/dkac257. [DOI] [PMC free article] [PubMed] [Google Scholar]
- 9.Mukae H, Yotsuyanagi H, Ohmagari N, Doi Y, Sakaguchi H, Sonoyama T, et al. Efficacy and safety of ensitrelvir in patients with mild-to-moderate coronavirus disease 2019: the phase 2b part of a randomized, placebo-controlled, phase 2/3 study. Clin Infect Dis. 2023;76:1403–11. 10.1093/cid/ciac933. [DOI] [PMC free article] [PubMed] [Google Scholar]
- 10.Yotsuyanagi H, Ohmagari N, Doi Y, Imamura T, Sonoyama T, Ichihashi G, et al. A phase 2/3 study of S-217622 in participants with SARS-CoV-2 infection (Phase 3 part). Medicine (Baltimore). 2023;102: e33024. 10.1097/md.0000000000033024. [DOI] [PMC free article] [PubMed] [Google Scholar]
- 11.NONMEM User Guide 7.4 https://nonmem.iconplc.com/nonmem741/nm741.pdf. Accessed 15 Apr 2024.
- 12.SCM user guide of Perl-speaks NONMEM https://github.com/UUPharmacometrics/PsN/releases/download/v5.3.1/scm_userguide.pdf. Accessed 15 Apr 2024.
- 13.Bergstrand M, Hooker AC, Wallin JE, Karlsson MO. Prediction corrected visual predictive checks for diagnosing nonlinear mixed effects models. AAPS J. 2011;13:143–51. 10.1208/s12248-011-9255-z. [DOI] [PMC free article] [PubMed] [Google Scholar]
- 14.Ette EI. Stability and performance of a population pharmacokinetic model. J Clin Pharmacol. 1997;37:486–95. 10.1002/j.1552-4604.1997.tb04326.x. [DOI] [PubMed] [Google Scholar]
- 15.Mukae H, Yotsuyanagi H, Ohmagari N, Doi Y, Imamura T, Sonoyama T, et al. A randomized phase 2/3 study of ensitrelvir, a novel oral SARS-CoV-2 3C-like protease inhibitor, in Japanese patients with mild-to-moderate COVID-19 or asymptomatic SARS-CoV-2 infection: results of the phase 2a part. Antimicrob Agents Chemother. 2022;66:e0069722. 10.1128/aac.00697-22. [DOI] [PMC free article] [PubMed] [Google Scholar]
- 16.Yotsuyanagi H, Ohmagari N, Doi Y, Yamato M, Nguyen HB, Cha BK, et al. Efficacy and safety of 5-day oral ensitrelvir for patients with mild to moderate COVID-19: the SCORPIO-SR randomized clinical trial. JAMA Netw Open. 2024;7:e2354991. 10.1001/jamanetworkopen.2023.54991. [DOI] [PMC free article] [PubMed] [Google Scholar]
- 17.Hoglund RM, Ruengweerayut R, Na-Bangchang K. Population pharmacokinetics of mefloquine given as a 3-day artesunate–mefloquine in patients with acute uncomplicated Plasmodium falciparum malaria in a multidrug-resistant area along the Thai-Myanmar border. Malar J. 2018;17:322. 10.1186/s12936-018-2466-3. [DOI] [PMC free article] [PubMed] [Google Scholar]
- 18.Amann LF, Wicha SG. Operational characteristics of full random effects modelling (‘frem’) compared to stepwise covariate modelling (‘scm’). J Pharmacokinet Pharmacodyn. 2023;50:315–26. 10.1007/s10928-023-09856-w. [DOI] [PMC free article] [PubMed] [Google Scholar]
- 19.Jonsson EN, Karlsson MO. Automated covariate model building within NONMEM. Pharm Res. 1998;15:1463–8. 10.1023/a:1011970125687. [DOI] [PubMed] [Google Scholar]
- 20.Fukao K, Nobori H, Kuroda T, Baba K, Matsumoto K, Tanaka Y, et al. Pharmacokinetic and pharmacodynamic analysis of the 3CL protease inhibitor ensitrelvir in a SARS-CoV-2 infection mouse model. Viruses. 2023;15:2052–65. 10.3390/v15102052. [DOI] [PMC free article] [PubMed] [Google Scholar]
Associated Data
This section collects any data citations, data availability statements, or supplementary materials included in this article.