

Abstract
Background
The Weight-Adjusted Waist Index (WWI) is a novel indicator of obesity that accurately reflects body composition. However, the association between WWI and depression in patients with non-alcoholic fatty liver disease (NAFLD) remains unclear. This study aims to explore this relationship through a nationally representative cross-sectional analysis.
Methods
This study included adult participants diagnosed with NAFLD from NHANES 2017–2020. WWI was calculated as the waist circumference (cm) divided by the square root of body weight (kg). NAFLD diagnosis relied on vibration-controlled transient elastography (VCTE) with a controlled attenuation parameter (CAP) exceeding 248 dB/m to indicate hepatic steatosis. Depression was assessed using the Patient Health Questionnaire-9 (PHQ-9), with scores ≥ 10 indicating the presence of major depression.
Results
After adjusting for all covariates, a significant positive association was found between WWI and depression in NAFLD (OR = 1.725, 95% CI: 1.442–2.063, p < 0.00001), with a dose-response relationship indicated by restricted cubic spline analysis. The association was stronger in men and lean/normal weight NAFLD patients. Adjusting further for BMI did not alter these findings (OR = 1.643, 95% CI: 1.357–1.989, p < 0.00001). BMI’s association with depression was negated after adjusting for WWI.
Conclusions
WWI had a positive association with depression in NAFLD, independent of BMI. This association was more pronounced in men and lean/normal weight NAFLD. These findings suggest that WWI may be a novel indicator of depression in NAFLD and potentially valuable in depression prevention.
Supplementary Information
The online version contains supplementary material available at 10.1186/s12888-024-06308-8.
Keywords: Weight-adjusted Waist Index(WWI), Depression, Non-alcoholic fatty liver Disease(NAFLD), Central obesity, NHANES
Introduction
Depression (also known as depressive disorder) is a common mental disorder that involves prolonged periods of low mood or loss of pleasure or interest in activities, and is one of the most common psychiatric conditions seen in psychiatry in primary care settings [1]. Major depression is a common mental illness that severely limits psychosocial functioning and reduces quality of life and is associated with a significant global burden of disease [2]. The Global Burden of Disease 2019 (GBD 2019) report reveals that in 2019, disability-adjusted life years (DALYs) attributable to depressive disorders were the 13th leading cause of disability across all age groups, and ranked 4th and 6th within the 10–24 and 25–49 age groups, respectively [3]. The GBD 2019 report suggests that in 2019, depressive disorders were the most prevalent mental disorders and accounted for the highest number of DALYs among all mental illnesses [4]. In addition, numerous epidemiological studies have demonstrated that depression is more prevalent in certain populations and associated with various diseases. A meta-analysis that included 55 observational studies showed a global prevalence of depression in the elderly population of 35.1% [5]. Another recently published meta-analysis showed a global prevalence of depression of 34% in adolescents aged 10–19 years [6]. Other populations such as perinatal women, medical students, and resident physicians have also been shown to have very high rates of depression [7–9]. Major depression carries a heavy disease and economic burden in healthcare systems and sufferers globally [10]. Therefore, depression prevention by identifying modifiable risk factors for the development of depressive disorder and through rational programs has important public health relevance.
Depression is the result of a combination of social, psychological, and biological factors and can happen to anyone. It is recognized as having a bidirectional relationship with the development of a variety of clinical disease entities, such as obesity, hypertension, type 2 diabetes (T2D), and cardiovascular disease (CVD) [11–14]. Non-alcoholic fatty liver disease (NAFLD) is the most common chronic liver disease worldwide and is recognized to have a strong bidirectional association with depression [15, 16]. Compared to the non-NAFLD population, the risk of developing depression is 13% higher in individuals with NAFLD, and the risk of NAFLD is significantly increased by 46% in people with depression [16]. NAFLD and depression share some common risk factors such as obesity, metabolic syndrome, and T2D [17]. Adiposity and dysregulation of adipose tissue lipid metabolism in NAFLD are thought to be involved in the pathogenesis of depression, suggesting an important role for obesity and adipose tissue function in the liver-brain axis in NAFLD [18, 19].
Depression and NAFLD co-morbidity were significantly associated with an increased prevalence of CVD and risk of mortality compared to individuals with NAFLD not experiencing depression [20]. Therefore, identifying modifiable risk factors for depression in NAFLD patients is clinically crucial. Recently, the Weight-Adjusted Waist Index (WWI) was proposed as a novel measure of body composition, calculated by dividing waist circumference by the square root of body weight [21]. Unlike the traditional body mass index (BMI), WWI is suggested to more accurately reflect central obesity by capturing adipose tissue distribution. This characteristic makes WWI potentially more sensitive in assessing obesity-related health risks, such as those associated with depression in individuals with NAFLD [22–24]. Observational studies have shown that WWI is positively associated with the development of depression in the general population [25, 26]. However, to date, no studies have investigated the association between WWI and the prevalence of depression specifically in NAFLD, nor have they explored whether this association is independent of BMI.
In this study, we leveraged the National Health and Nutrition Examination Survey (NHANES), a nationally representative cross-sectional dataset, to explore this relationship.These findings may reveal the potential clinical value of WWI as an emerging indicator of obesity in the development of depression in NAFLD.
Methods
Study design and population
NHANES is a major national health survey program under the auspices of the National Center for Health Statistics (NCHS). Since its inception in 1960, NHANES has become an important basis for U.S. public health policymaking and decision-making and is one of the most authoritative and complete population health and nutrition survey databases in the world. The goal of NHANES is to understand and monitor the health status, nutritional status, and health behaviors of the ambulatory population in the U.S. Since 1999, NHANES has been conducted on a 2-year cycle. NHANES is an ongoing, multi-stage, complex-design, probability-sampled, nationally representative cross-sectional survey.
The study population selection flowchart was presented in Fig. 1. Adult participants were selected from the NHANES datasets spanning 2017–2020, including pre-epidemic periods of 2017–2018 and March 2019–2020. Exclusion criteria were absence of vibration-controlled transient elastography (VCTE), incomplete VCTE data, a controlled attenuation parameter (CAP)<248 dB/m, pregnancy, excessive alcohol consumption, and viral hepatitis. Additionally, participants lacking essential diagnostic information such as Patient Health Questionnaire-9 (PHQ-9), WWI, or other covariates were also excluded. Following these criteria, 4524 participants with NAFLD determined by VCTE were included for further analysis.
Fig. 1.

Flowchart of inclusion and exclusion of study population, NHANES 2017–2020
Calculation of WWI
WWI is calculated by integrating waist circumference (WC) and body weight, defined as WWI = WC (cm) divided by the square root of weight (kg) [21]. WC and body weight information were derived from the NHANES anthropometric profile, measured by trained operators using standardized procedures.
Definition of NAFLD
NAFLD was diagnosed based on the presence of hepatic steatosis and exclusion of secondary liver injury factors such as excessive alcohol consumption (> 3 drinks/d for men and > 2 drinks/d for women) and viral hepatitis [27]. In 2017–2020, NHANES assessed participants for hepatic steatosis using VCTE, which was detected with a FibroScan model 502 V2 Touch medium (M) or extra-large (XL) probe at the Mobile Examination Center (MEC) [28]. Specialized operators obtained at least 10 controlled attenuation parameter (CAP) measurements from each participant and yielded median CAP values. VCTE has been demonstrated to be an accurate noninvasive NAFLD assessment. We used a CAP value of ≥ 248 dB/m to diagnose hepatic steatosis, which was shown to be the optimal steatosis ≥ S1 diagnostic cutoff in a previous large individual patient data meta-analysis with the largest Youden index and an AUC = 0.823 [29]. In addition, in the sensitivity analysis, we used a CAP ≥ 285 dB/m as the NAFLD diagnostic cutoff value, which had the largest Youden index in a previous prospective study [30].
Depression evaluation
NHANES assessed participants’ depressive symptoms using the standardized PHQ-9 two weeks prior to the examination. The PHQ-9 contains nine entries, each of which is assigned a score from 0 to 3 based on responses, for a total score of 27 points. Nine items were rated: (1). diminished interest, (2). depressed mood, (3). sleep disturbances, (4). fatigue, (5). eating disorders, (6). feelings of low self-esteem, (7). difficulties in attentional concentration, (8). psychomotor retardation, and (9). suicidal feelings, and scores were assigned based on frequency from (0). never, (1). a few days), (2). more than half of the days, and (3). almost every day [31]. PHQ-9 ≥ 10 indicates the presence of major depression [32]. The screening and diagnosis of depression using the PHQ-9 has favorable accuracy, with a sensitivity and specificity of 88% [31], and has been shown to be reliable and valid in extensive clinical studies, including NHANES [33, 34].
Covariates
Several important covariates including age, gender, race/ethnicity, education level, income-poverty ratio (PIR), marital status, smoking, physical activity, diabetes, hypertension, and CVD were included. Participants were categorized as never smokers (< 100 lifetime cigarettes), former smokers (≥ 100 lifetime cigarettes but not smoking at all now), and current smokers based on their smoking history and current smoking or not. Physical activity was categorized as light, moderate, and heavy according to participants’ self-reports in the Global Physical Activity Questionnaire. Diabetes mellitus was diagnosed by one of the following: self-reported history of diabetes mellitus, fasting blood glucose values ≥ 7 mmol/l, random blood glucose ≥ 11.1 mmol/l, and taking anti-diabetic related medications. Hypertension was determined by self-reported history of hypertension, abnormal blood pressure tests, or use of anti-hypertensive medications. CVD history was obtained by self-report.
Statistical analysis
Data were processed and analyzed using R version 4.2.3 with appropriate weighting to account for the complex design of NHANES [35]. Statistical significance was defined as a two-sided P value < 0.05. In the baseline analysis, we grouped the included population according to the quartiles of the WWI or depressive symptom status in NAFLD populations. Continuous variables were expressed as mean ± standard error and differences between groups were analyzed by analysis of variance (ANOVA) or Student’s t-test, while categorical variables were tested by chi-square analysis and reported as number (percentage). To explore whether the association between WWI and depression in NAFLD is independent of other confounders, we performed multivariate logistic regression analyses and constructed several models with varying degrees of adjustment. Model 1 was a crude model that did not adjust for any covariates; Model 2 was a partially adjusted model that adjusted for age, sex, race, PIR, education level, and marital status; and Model 3 adjusted for all confounders, additionally adjusting for smoking, physical activity, diabetes, hypertension, and CVD on top of Model 2. To explore whether there is a nonlinear association between WWI and the prevalence of depression in NAFLD, we interpreted the association using restricted cubic spline (RCS) analyses with smooth curve fitting. To explore whether the association between WWI and depression in NAFLD was consistent across subgroups, we conducted stratified analyses. We performed subgroup analyses based on included covariates and identified potential effect modifiers using interaction terms in our multivariate logistic regression models. The statistical significance of these interaction terms (p < 0.05) indicated the presence of effect modification. Finally, we performed multiple sensitivity analyses. We additionally adjusted for BMI to reveal whether the association between WWI and depressive symptoms was independent of BMI based on model 3. We explored the association between WWI and depression in NAFLD across different BMI strata. In addition, we explored whether BMI was associated with depression in NAFLD and revealed whether it was independent of WWI. Finally, we used another CAP cutoff value of 285 dB/m to diagnose NAFLD for sensitivity analyses.
Results
Baseline characteristics
Four thousand five hundred twenty-four participants with VCTE-identified NAFLD were included, with a mean age of 52.855 years and 52.093% male. Depressive symptoms were present in 366 NAFLD with a prevalence of 7.769%. In baseline analyses based on WWI quartiles (Q1 < 10.880, Q2 10.880–11.370, Q3 11.370–11.875, and Q4 > 11.875), we found that as WWI quartiles increased, NAFLD participants were older, had lower PIR, and were more likely to be female, non-Hispanic white, single, ≤high school education level, smokers, and not being vigorously physically active. The prevalence of diabetes, hypertension, CVD, and depression was significantly higher among NAFLD patients with higher WWI (Table 1). Similarly, baseline analyses based on depressive status in NAFLD showed significantly higher WWI among depressed individuals (p < 0.0001) (Table S1).
Table 1.
Baseline analysis in the NAFLD population according to WWI quartiles
| Variables | Total | Q1 | Q2 | Q3 | Q4 | p-value |
|---|---|---|---|---|---|---|
| Age, year | 52.855 ± 0.475 | 45.166 ± 0.782 | 51.829 ± 0.822 | 55.920 ± 0.610 | 59.916 ± 0.819 | < 0.0001 |
| PIR | 3.224 ± 0.045 | 3.425 ± 0.068 | 3.322 ± 0.089 | 3.137 ± 0.072 | 2.968 ± 0.092 | < 0.001 |
| Sex | < 0.0001 | |||||
| Male | 2314(52.093) | 743(66.890) | 663(63.116) | 564(51.684) | 344(23.429) | |
| Female | 2210(47.907) | 389(33.110) | 468(36.884) | 567(48.316) | 786(76.571) | |
| Race | < 0.0001 | |||||
| Mexican American | 554(8.149) | 110(7.857) | 138(8.608) | 163(9.740) | 143(6.450) | |
| Non Hispanic Black | 1005(9.445) | 288(10.793) | 280(9.824) | 231(9.851) | 206(7.082) | |
| Non Hispanic White | 1697(65.685) | 355(61.351) | 360(62.531) | 432(64.871) | 550(74.906) | |
| Other Hispanic | 423(6.015) | 94(5.714) | 111(7.161) | 121(6.509) | 97(4.650) | |
| Other Race | 845(10.706) | 285(14.285) | 242(11.876) | 184(9.029) | 134(6.913) | |
| Marital Status | 0.007 | |||||
| Non-single | 2881(69.709) | 750(72.310) | 760(72.266) | 722(69.315) | 649(64.314) | |
| Single | 1643(30.291) | 382(27.690) | 371(27.734) | 409(30.685) | 481(35.686) | |
| Education | < 0.0001 | |||||
| < High school | 317(3.059) | 41(1.617) | 66(2.864) | 105(3.908) | 105(4.121) | |
| High school | 1508(33.856) | 307(25.302) | 350(31.537) | 415(37.879) | 436(42.386) | |
| > High school | 2699(63.085) | 784(73.081) | 715(65.599) | 611(58.213) | 589(53.493) | |
| Smoking | 0.04 | |||||
| Never | 2730(59.898) | 745(64.888) | 658(58.475) | 658(56.506) | 669(58.929) | |
| Former | 1272(29.629) | 239(23.274) | 337(31.749) | 356(34.849) | 340(29.661) | |
| Now | 522(10.473) | 148(11.838) | 136(9.776) | 117(8.645) | 121(11.410) | |
| Diabetes | < 0.0001 | |||||
| No | 3173(75.336) | 949(89.859) | 834(76.571) | 770(74.089) | 620(58.361) | |
| Yes | 1351(24.664) | 183(10.141) | 297(23.429) | 361(25.911) | 510(41.639) | |
| Hypertension | < 0.0001 | |||||
| No | 2276(54.107) | 735(69.110) | 623(59.200) | 521(46.272) | 397(38.794) | |
| Yes | 2248(45.893) | 397(30.890) | 508(40.800) | 610(53.728) | 733(61.206) | |
| CVD | < 0.0001 | |||||
| No | 3939(89.130) | 1053(94.304) | 1017(92.347) | 983(89.260) | 886(79.530) | |
| Yes | 585(10.870) | 79(5.696) | 114(7.653) | 148(10.740) | 244(20.470) | |
| Physical activity | < 0.0001 | |||||
| No | 2361(47.262) | 531(40.975) | 592(49.778) | 620(52.181) | 618(47.079) | |
| Moderate | 1108(28.031) | 280(27.747) | 246(21.104) | 272(28.953) | 310(34.941) | |
| Vigorous | 1055(24.707) | 321(31.278) | 293(29.118) | 239(18.866) | 202(17.980) | |
| Depressive symptoms | < 0.001 | |||||
| No | 4158(92.231) | 1085(94.986) | 1056(93.609) | 1028(90.854) | 989(88.881) | |
| Yes | 366(7.769) | 47(5.014) | 75(6.391) | 103(9.146) | 141(11.119) |
Continuous variables were expressed as mean ± standard error and differences between groups were analyzed by analysis of variance (ANOVA), while categorical variables were tested by chi-square analysis and reported as number (percentage). NAFLD, non-alcoholic fatty liver disease; WWI, weight-adjusted waist index; PIR, income-poverty ratio; CVD, cardiovascular disease
Association between WWI and depression in NAFLD
In both Model 1 and Model 2, WWI was significantly associated with depression in NAFLD (p < 0.00001). After adjusting for all confounders (Model 3), WWI remained significantly and positively associated with the prevalence of depression in NAFLD (OR = 1.725, 95% CI: 1.442–2.063, p < 0.00001). Higher WWI was associated with significantly increased prevalence of depression in AFLD (p for trend < 0.00001). When WWI was treated as a categorical variable, being in Q2, Q3 and Q4 were all associated with significantly increased odds of depression compared to Q1 (Q2: OR = 1.657, p = 0.01026; Q3: OR = 2.160, p = 0.00007; Q4: OR = 2.711, p < 0.00001) (Table 2).
Table 2.
Association of WWI with depression in NAFLD identified by VCTE, NHANES 2017–2020
| Model 1 | Model 2 | Model 3 | |
|---|---|---|---|
| WWI | 1.891 (1.630, 2.194) < 0.00001 | 1.893 (1.592, 2.250) < 0.00001 | 1.725 (1.442, 2.063) < 0.00001 |
| WWI quartile | |||
| Q1 | Reference | Reference | Reference |
| Q2 | 1.637 (1.126, 2.380) 0.00990 | 1.718 (1.173, 2.517) 0.00545 | 1.657 (1.127, 2.436) 0.01026 |
| Q3 | 2.309 (1.618, 3.294) < 0.00001 | 2.271 (1.563, 3.300) 0.00002 | 2.160 (1.480, 3.152) 0.00007 |
| Q4 | 3.279 (2.331, 4.611) < 0.00001 | 3.209 (2.196, 4.690) < 0.00001 | 2.711 (1.839, 3.997) < 0.00001 |
| P for trend | < 0.00001 | < 0.00001 | < 0.00001 |
Model 1 was a crude model that did not adjust for any covariates; Model 2 was a partially adjusted model that adjusted for age, sex, race, PIR, education level, and marital status; and Model 3 adjusted for all confounders. NAFLD, non-alcoholic fatty liver disease; WWI, weight-adjusted waist index
RCS analysis
RCS analysis showed a significant linear association between WWI and the prevalence of depression in NAFLD (p for nonlinear = 0.842), i.e., WWI was associated with the odds of depression in NAFLD in a dose-response manner (Fig. 2).
Fig. 2.

RCS analysis of the association between WWI and depression among adult NAFLD individuals in the U.S
Stratified analysis
Stratified analyses indicated that the association between WWI and depression in NAFLD remained largely significant across all subgroup strata. However, we found gender to be a significant effect modifier, with the association of WWI with depression significantly pronounced in men with NAFLD (men: OR = 2.315, p < 0.0001; women: OR = 1,502, p = 0.0001) (Fig. 3).
Fig. 3.

Stratified analysis based on included covariates, NHANES 2017–2020
Sensitivity analysis
First, we additionally adjusted for BMI to explore whether the association of WWI with depression in NAFLD was independent of BMI based on model 3. Consistently, WWI remained significantly positively associated with the prevalence of depression in Model 4 (OR = 1.643, 95% CI: 1.357–1.989, p < 0.00001). Higher WWI was significantly associated with increased odds of depression, independent of BMI (p for trend = 0.00002) (Table 3). Stratified analyses based on BMI showed that BMI significantly influenced the association between WWI and depression among NAFLD patients. Specifically, the association between WWI and depression was stronger in individuals with lower BMI and weakened as BMI increased (BMI < 25 kg/m²: OR = 2.552, p = 0.0027; BMI 25–30 kg/m²: OR = 2.143, p < 0.0001; BMI ≥ 30 kg/m²: OR = 1.412, p = 0.002)(Fig. 4). Although the confidence intervals (CIs) for different BMI strata overlapped, interaction analysis indicated a statistically significant effect modification by BMI (p for interaction < 0.05). This finding suggests that the association between WWI and depression differs by BMI category, supporting the observed trend despite overlapping CIs.We then explored the association of BMI with depression in NAFLD and whether it was independent of WWI. In Model 1–3, BMI was all significantly and positively associated with the prevalence of depression in NAFLD. However, after additional adjustment for WWI in model 4, the association between BMI and depression disappeared (OR = 1.013, 95%CI:0.995–1.030) p = 0.15626) (Table S2). Finally, similar findings were obtained for the diagnosis of NAFLD when using a CAP > 285 dB/m, indicating the stability of the findings (Table S3).
Table 3.
Association of WWI with depression in NAFLD, with additional adjustment for BMI based on model 3
| Model 4 OR (95% CI) | P-value | |
|---|---|---|
| WWI | 1.643 (1.357, 1.989) | < 0.00001 |
| WWI quartile | ||
| Q1 | Reference | |
| Q2 | 1.581 (1.072, 2.334) | 0.02098 |
| Q3 | 1.982 (1.340, 2.930) | 0.00061 |
| Q4 | 2.416 (1.604, 3.640) | 0.00002 |
| P for trend | 0.00002 | |
Model 4 adjusted for age, sex, race, PIR, education level, marital status, smoking, physical activity, diabetes, hypertension, CVD, and BMI. NAFLD, non-alcoholic fatty liver disease; WWI, weight-adjusted waist index
Fig. 4.
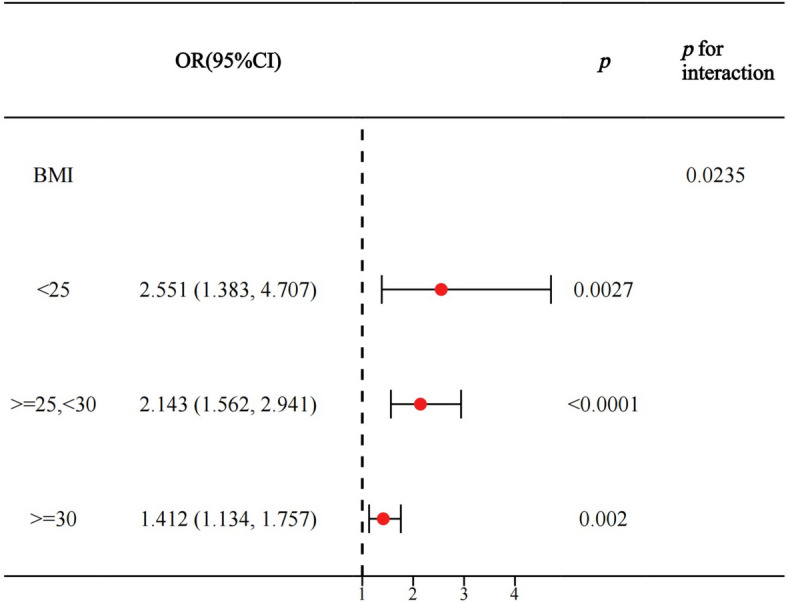
Stratified analysis based on BMI, NHANES 2017–2020
Discussions
In a nationally representative population-based cross-sectional study, we showed for the first time that a novel anthropometric indicator of obesity, WWI, was significantly and positively associated with the prevalence of major depression in NAFLD. Each unit increase in WWI was associated with a 72.5% increased odds ratio among NAFLD participants, with a significant dose-response association. Gender was identified as a significant effect modifier, where the association between WWI and depression in NAFLD was greater in men. Importantly, our findings suggest that the association of WWI with depression in NAFLD is independent of BMI, whereas the association of BMI with depression disappears after additional adjustment for WWI. Interestingly, BMI was identified as another effect modifier, with the association between WWI and depression attenuating as BMI increased. These results highlight that WWI may be a novel indicator of depression in NAFLD independent of BMI, whereas the traditional association of BMI with depression is dependent on WWI. Central obesity as reflected by the WWI has an important role in the development of depression in NAFLD, and it may be used for risk stratification and related prevention of depression in adult individuals with NAFLD.
Additionally, it is worth noting the recent renaming of NAFLD to “Metabolic Dysfunction-Associated Steatotic Liver Disease (MASLD)” by global liver disease societies, including the AASLD and EASL [36, 37]. This change underscores the central role of metabolic dysfunction in steatotic liver disease, suggesting that indicators like WWI, which reflect central obesity and metabolic health, may provide insights into depression risk within this population. In our study, we retain the term “NAFLD” to align with the NHANES diagnostic criteria used for participant selection, which were originally based on this terminology.
WWI, as a novel indicator of obesity, has been shown to be strongly associated with cardiometabolic comorbidities and mortality [21]. Previous studies have highlighted WWI’s unique role in accurately reflecting central obesity and abdominal adiposity, distinguishing it from traditional indicators like BMI [22–24]. A recent study found that WWI, compared to BMI, waist circumference (WC), and waist-to-height ratio, had the highest area under the curve (AUC) for predicting sarcopenic obesity in men (AUC = 0.781) [38]. This further supports the utility of WWI in identifying complex obesity-related conditions. Consistent with our results, large-sample observational studies have linked WWI to various clinical conditions, including NAFLD. For instance, a cross-sectional analysis of NHANES 2017–2020 data found an independent association between WWI and hepatic steatosis, even after adjusting for BMI [39]. Another study using the same dataset reported that WWI was significantly associated with both NAFLD and liver fibrosis [40].
Several cross-sectional analyses using NHANES have shown that WWI is positively associated with the prevalence of depression in the general population. Li et al. [25] included 34,528 participants from NHANES 2005–2018, in which the prevalence of depression was 7.61%, comparable to our study. WWI was positively associated with the prevalence of depression (OR = 1.21, p < 0.0001) and showed a non-linear association [25]. Our findings, on the other hand, suggest that WWI exhibits a linear association with depression in NAFLD as determined by VCTE, with a significant dose-response association. However, this study did not additionally adjust for BMI, and our study suggested that the association of WWI with depression in NAFLD was independent of BMI and attenuated with increasing BMI. Liu et al. [26] similarly used NHANES 2005–2018 and showed that WWI was significantly associated with depression in the general population (OR = 1.18) and similarly exhibited a nonlinear association. Furthermore, although this study did not additionally adjust for BMI, it indicated that the OR for the association of WWI with depression was higher than for BMI and WC. Shen et al. [41] similarly employed NHANES 2005–2018 to show that WWI was positively associated with the odds of depression in the general population and had a stronger association compared to BMI and WC. Interestingly, this study similarly showed that the association of WWI with depression was influenced by gender and BMI. However, this study indicated that this association was more pronounced in women and strengthened with increasing BMI, contrary to our findings. These findings may indicate an inconsistent pattern of association between WWI and depression in NAFLD compared to the general population.
NAFLD has been recognized as a sexually dimorphic disease. Overall, men have a higher prevalence of NAFLD compared to premenopausal women, which may be attributed to the protective effect of estrogen on liver metabolism [42, 43]. Female individuals with NAFLD may have a higher risk of developing depression than males, although inconsistencies remain [16]. Compared to premenopausal women, men have more abdominal fat accumulation (Android pattern), whereas women tend to have more subcutaneous fat (Gynoid pattern), although fat distribution in postmenopausal women is similar to that of men [44]. Thus, while the mechanisms of how gender affects this relationship remain unclear, gender variability in NAFLD, depression, and adiposity distribution may be underlying factors, suggesting that an emphasis needs to be placed on the association of WWI with depression in men with NAFLD.
Another important finding was that the association between WWI and depression in NAFLD was independent of BMI, whereas the association between BMI and depression disappeared after adjusting for WWI, suggesting that WWI may better reflect the association between obesity and depression than BMI. However, BMI was also identified as an effect modifier, and the association of WWI with depression was attenuated at higher BMI and was more pronounced in those with normal BMI. A prospective cohort study conducted from the China Health and Retirement Longitudinal Study demonstrated that the cumulative burden of WWI was positively associated with the risk of developing depression and was independent of BMI [45]. Research indicates that sarcopenic obesity, a condition characterized by the co-existence of low muscle mass and high fat distribution, is linked to increased inflammatory responses and insulin resistance, which may drive depression risk [23, 46, 47]. This suggests that WWI, as an indicator of central obesity, could also indirectly reflect aspects of metabolic sarcopenia, thereby acting as a more specific indicator of depression risk in NAFLD compared to BMI. Sarcopenic obesity has been shown to be more strongly associated with depressive symptoms than general obesity, further underscoring the importance of body composition in understanding depression risk in NAFLD [48]. In addition, BMI-defined lean/normal weight NAFLD represents a distinct subpopulation [49]. BMI-defined obesity may lead to misclassification of obesity phenotypes and may ignore the adverse effects of abnormal body composition, i.e., the “obesity paradox” [50]. We speculate that elevated WWI in patients with normal BMI may indicate lower muscle mass and therefore WWI is more pronounced in association with depression, whereas in those with overweight or obesity, BMI may override the effect of WWI. Thus, our findings emphasize that elevated WWI in NAFLD populations with normal BMI is associated with more significant odds of depression and that screening and prevention strategies need to be developed based on WWI.
Obesity-related hypothalamic-pituitary-adrenocortical axis dysfunction, chronic systemic inflammation and insulin resistance are thought to be involved in the pathogenesis of depression [11, 51]. Chronic systemic inflammation and the release of inflammatory cytokines may cause depressive-like behavior by triggering neuroinflammation and affecting neuroendocrine pathways [52]. Metabolic dysregulation and immune-inflammatory activation associated with sarcopenic obesity may be potential mechanisms for the development of depression [47]. In addition, multiple lifestyle and behavioral patterns associated with obesity may also be common risk factors for the development of depression, such as sedentary lifestyle, unhealthy diet, short sleep duration, and life stress [53]. Gut microbiome dysbiosis in obesity may also be an important contributor to depressive symptoms [54]. Given that the mechanisms linking obesity, especially central/sarcopenic obesity, to depression remain understudied, further exploration is needed in the future. Additionally, compared to BMI, which reflects general obesity, WWI provides a more precise measure of central obesity and abdominal fat distribution—factors closely linked to metabolic health. This focus suggests that WWI may be a more effective indicator of depression risk in NAFLD due to its association with metabolic abnormalities potentially linked to depressive symptoms [11, 51, 52].
Our study has some important strengths. First, this is a nationally representative large population-based study with good generalizability and replicability. The diagnosis of NAFLD is based on the well-established VCTE with excellent diagnostic accuracy. In addition, the PHQ-9 has good consistency as a widely validated depression screening tool. We fully considered the effect of confounders, including BMI. However, our study has limitations. It was a cross-sectional study, and therefore causality could not be derived and could be influenced by residual confounders. In addition, NHANES lacks external validation of other tools for diagnosing depression. More well-designed cohort studies are needed in the future to confirm our findings.
Conclusions
This study revealed that the WWI was significantly and positively associated with the prevalence of depression in individuals diagnosed with NAFLD through VCTE, demonstrating a dose-response relationship. Sex and BMI significantly influenced this association, with the association being more pronounced in men and lean/normal weight NAFLD. The association of WWI with depression in NAFLD was independent of BMI, whereas the association of BMI with depression was dependent on WWI. These findings emphasize the important role of central obesity in the development of depression in NAFLD and suggest that WWI may serve as an independent indicator of depression in NAFLD.
Supplementary Information
Acknowledgements
Not applicable.
Abbreviations
- WWI
Weight-Adjusted Waist Index
- NAFLD
Non-Alcoholic Fatty Liver Disease
- NHANES
National Health and Nutrition Examination Survey
- VCTE
Vibration-Controlled Transient Elastography
- CAP
Controlled Attenuation Parameter
- PHQ-9
Patient Health Questionnaire-9
- RCS
Restricted Cubic Spline
- CVD
Cardiovascular Disease
- PIR
Income-Poverty Ratio
- GBD
Global Burden of Disease
- DALYs
Disability-Adjusted Life Years
- T2D
Type 2 Diabetes
- BMI
Body Mass Index
- MEC
Mobile Examination Center
- AUC
Area Under the Curve
- NCHS
National Center for Health Statistics
Authors’ contributions
ZJW and WY contributed equally to this work.Conception and design: ZJW, WY. Development of methodology: KSK, XTY and WCH. Analysis and interpretation of data: LLJ, FXY. Writing of the manuscript: ZJW, WY. Study supervision: WY, HX.
Funding
This work was supported by the National Natural Science Foundation of China (No. 82371527) and the Key Special Project on Prevention and Control of Common and Multiple Diseases of the Ministry of Science and Technology (No. 2023YFC2506205).
Data availability
This study analyzed publicly available datasets and can be found at https://www.cdc.gov/nchs/nhanes/.
Declarations
Ethics approval and consent to participate
Not applicable.
Consent for publication
Not applicable.
Competing interests
The authors declare no competing interests.
Footnotes
Publisher’s Note
Springer Nature remains neutral with regard to jurisdictional claims in published maps and institutional affiliations.
Jingwen Zhang and Yan Wang contributed equally to this work.
Contributor Information
Yan Wang, Email: rock969853915@163.com.
Xiao Huang, Email: huang.xiao@zs-hospital.sh.cn.
References
- 1.McCarron RM, Shapiro B, Rawles J, Luo J. Depression. Ann Intern Med. 2021;174(5):Itc65-itc80. 10.7326/aitc202105180. [DOI] [PubMed] [Google Scholar]
- 2.Malhi GS, Mann JJ. Depression. Lancet. 2018;392(10161):2299 − 312. 10.1016/s0140-6736(18)31948-2. [DOI] [PubMed] [Google Scholar]
- 3.Global burden of 369 diseases and injuries in 204 countries and territories, 1990–2019: a systematic analysis for the Global Burden of Disease Study 2019. Lancet. 2020;396(10258):1204-22. 10.1016/s0140-6736(20)30925-9. [DOI] [PMC free article] [PubMed]
- 4.Global, regional, and national burden of 12 mental disorders in 204 countries and territories, 1990–2019: a systematic analysis for the Global Burden of Disease Study 2019. Lancet Psychiatry. 2022;9(2):137–50. 10.1016/s2215-0366(21)00395-3. [DOI] [PMC free article] [PubMed]
- 5.Cai H, Jin Y, Liu R, Zhang Q, Su Z, Ungvari GS, et al. Global prevalence of depression in older adults: a systematic review and meta-analysis of epidemiological surveys. Asian J Psychiatr. 2023;80:103417. 10.1016/j.ajp.2022.103417. [DOI] [PubMed] [Google Scholar]
- 6.Shorey S, Ng ED, Wong CHJ. Global prevalence of depression and elevated depressive symptoms among adolescents: a systematic review and meta-analysis. Br J Clin Psychol. 2022;61(2):287–305. 10.1111/bjc.12333. [DOI] [PubMed] [Google Scholar]
- 7.Roddy Mitchell A, Gordon H, Lindquist A, Walker SP, Homer CSE, Middleton A, et al. Prevalence of perinatal depression in low- and middle-income countries: a systematic review and meta-analysis. JAMA Psychiatry. 2023;80(5):425–31. 10.1001/jamapsychiatry.2023.0069. [DOI] [PMC free article] [PubMed] [Google Scholar]
- 8.Rotenstein LS, Ramos MA, Torre M, Segal JB, Peluso MJ, Guille C, et al. Prevalence of depression, depressive symptoms, and suicidal ideation among medical students: a systematic review and meta-analysis. JAMA. 2016;316(21):2214–36. 10.1001/jama.2016.17324. [DOI] [PMC free article] [PubMed] [Google Scholar]
- 9.Mata DA, Ramos MA, Bansal N, Khan R, Guille C, Di Angelantonio E, et al. Prevalence of Depression and depressive symptoms among Resident Physicians: a systematic review and Meta-analysis. JAMA. 2015;314(22):2373–83. 10.1001/jama.2015.15845. [DOI] [PMC free article] [PubMed] [Google Scholar]
- 10.Ménard C, Hodes GE, Russo SJ. Pathogenesis of depression:insights from human and rodent studies. Neuroscience. 2016;321:138–62. 10.1016/j.neuroscience.2015.05.053. [DOI] [PMC free article] [PubMed] [Google Scholar]
- 11.Milaneschi Y, Simmons WK, van Rossum EFC, Penninx BW. Depression and obesity: evidence of shared biological mechanisms. Mol Psychiatry. 2019;24(1):18–33. 10.1038/s41380-018-0017-5. [DOI] [PubMed] [Google Scholar]
- 12.Fugger G, Dold M, Bartova L, Kautzky A, Souery D, Mendlewicz J, et al. Comorbid hypertension in patients with major depressive disorder - results from a European multicenter study. Eur Neuropsychopharmacol. 2019;29(6):777–85. 10.1016/j.euroneuro.2019.03.005. [DOI] [PubMed] [Google Scholar]
- 13.Mukherjee N, Chaturvedi SK. Depressive symptoms and disorders in type 2 diabetes mellitus. Curr Opin Psychiatry. 2019;32(5):416–21. 10.1097/yco.0000000000000528. [DOI] [PubMed] [Google Scholar]
- 14.Hare DL, Toukhsati SR, Johansson P, Jaarsma T. Depression and cardiovascular disease: a clinical review. Eur Heart J. 2014;35(21):1365–72. 10.1093/eurheartj/eht462. [DOI] [PubMed] [Google Scholar]
- 15.Yi M, Peng W, Feng X, Teng F, Tang Y, Kong Q, et al. Extrahepatic morbidities and mortality of NAFLD: an umbrella review of meta-analyses. Aliment Pharmacol Ther. 2022;56(7):1119–30. 10.1111/apt.17165. [DOI] [PubMed] [Google Scholar]
- 16.Gu Y, Zhang W, Hu Y, Chen Y, Shi J. Association between nonalcoholic fatty liver disease and depression: a systematic review and meta-analysis of observational studies. J Affect Disord. 2022;301:8–13. 10.1016/j.jad.2021.12.128. [DOI] [PubMed] [Google Scholar]
- 17.Ntona S, Papaefthymiou A, Kountouras J, Gialamprinou D, Kotronis G, Boziki M, et al. Impact of nonalcoholic fatty liver disease-related metabolic state on depression. Neurochem Int. 2023;163:105484. 10.1016/j.neuint.2023.105484. [DOI] [PubMed] [Google Scholar]
- 18.Yu H, Qin X, Yu Z, Chen Y, Tang L, Shan W. Effects of high-fat diet on the formation of depressive-like behavior in mice. Food Funct. 2021;12(14):6416–31. 10.1039/d1fo00044f. [DOI] [PubMed] [Google Scholar]
- 19.Gawlik-Kotelnicka O, Strzelecki D. Adiposity in Depression or Depression in Adiposity? The Role of Immune-Inflammatory-Microbial Overlap. Life (Basel). 2021;11(2):117. 10.3390/life11020117. [DOI] [PMC free article] [PubMed] [Google Scholar]
- 20.Ng CH, Xiao J, Chew NWS, Chin YH, Chan KE, Quek J, et al. Depression in non-alcoholic fatty liver disease is associated with an increased risk of complications and mortality. Front Med (Lausanne). 2022;9:985803. 10.3389/fmed.2022.985803. [DOI] [PMC free article] [PubMed] [Google Scholar]
- 21.Park Y, Kim NH, Kwon TY, Kim SG. A novel adiposity index as an integrated predictor of cardiometabolic disease morbidity and mortality. Sci Rep. 2018;8(1):16753. 10.1038/s41598-018-35073-4. [DOI] [PMC free article] [PubMed] [Google Scholar]
- 22.Kim NH, Park Y, Kim NH, Kim SG. Weight-adjusted waist index reflects fat and muscle mass in the opposite direction in older adults. Age Ageing. 2021;50(3):780–6. 10.1093/ageing/afaa208. [DOI] [PubMed] [Google Scholar]
- 23.Kim KJ, Son S, Kim KJ, Kim SG, Kim NH. Weight-adjusted waist as an integrated index for fat, muscle and bone health in adults. J Cachexia Sarcopenia Muscle. 2023;14(5):2196–203. 10.1002/jcsm.13302. [DOI] [PMC free article] [PubMed] [Google Scholar]
- 24.Kim JY, Choi J, Vella CA, Criqui MH, Allison MA, Kim NH. Associations between weight-adjusted waist index and abdominal fat and muscle mass: multi-ethnic study of atherosclerosis. Diabetes Metab J. 2022;46(5):747–55. 10.4093/dmj.2021.0294. [DOI] [PMC free article] [PubMed] [Google Scholar]
- 25.Li M, Yu X, Zhang W, Yin J, Zhang L, Luo G, et al. The association between weight-adjusted-waist index and depression: results from NHANES 2005–2018. J Affect Disord. 2024;347:299–305. 10.1016/j.jad.2023.11.073. [DOI] [PubMed] [Google Scholar]
- 26.Liu H, Zhi J, Zhang C, Huang S, Ma Y, Luo D, et al. Association between weight-adjusted waist index and depressive symptoms: a nationally representative cross-sectional study from NHANES 2005 to 2018. J Affect Disord. 2024;350:49–57. 10.1016/j.jad.2024.01.104. [DOI] [PubMed] [Google Scholar]
- 27.Chalasani N, Younossi Z, Lavine JE, Diehl AM, Brunt EM, Cusi K, et al. The diagnosis and management of non-alcoholic fatty liver disease: practice guideline by the American Gastroenterological Association, American Association for the Study of Liver Diseases, and American College of Gastroenterology. Gastroenterology. 2012;142(7):1592–609. 10.1053/j.gastro.2012.04.001. [DOI] [PubMed] [Google Scholar]
- 28.Liu CF, Chien LW. Predictive role of Neutrophil-percentage-to-albumin ratio (NPAR) in nonalcoholic fatty liver disease and advanced liver fibrosis in nondiabetic US adults: evidence from NHANES 2017–2018. Nutrients. 2023;15(8):1892. 10.3390/nu15081892. [DOI] [PMC free article] [PubMed] [Google Scholar]
- 29.Karlas T, Petroff D, Sasso M, Fan JG, Mi YQ, de Lédinghen V, et al. Individual patient data meta-analysis of controlled attenuation parameter (CAP) technology for assessing steatosis. J Hepatol. 2017;66(5):1022–30. 10.1016/j.jhep.2016.12.022. [DOI] [PubMed] [Google Scholar]
- 30.Siddiqui MS, Vuppalanchi R, Van Natta ML, Hallinan E, Kowdley KV, Abdelmalek M, et al. Vibration-controlled transient elastography to assess fibrosis and steatosis in patients with nonalcoholic fatty liver disease. Clin Gastroenterol Hepatol. 2019;17(1):156-e63. 10.1016/j.cgh.2018.04.043. [DOI] [PMC free article] [PubMed] [Google Scholar]
- 31.Kroenke K, Spitzer RL, Williams JB. The PHQ-9: validity of a brief depression severity measure. J Gen Intern Med. 2001;16(9):606–13. 10.1046/j.1525-1497.2001.016009606.x. [DOI] [PMC free article] [PubMed] [Google Scholar]
- 32.Iranpour S, Sabour S. Inverse association between caffeine intake and depressive symptoms in US adults: data from National Health and Nutrition Examination Survey (NHANES) 2005–2006. Psychiatry Res. 2019;271:732–9. 10.1016/j.psychres.2018.11.004. [DOI] [PubMed] [Google Scholar]
- 33.Negeri ZF, Levis B, Sun Y, He C, Krishnan A, Wu Y, et al. Accuracy of the patient health questionnaire-9 for screening to detect major depression: updated systematic review and individual participant data meta-analysis. BMJ. 2021;375:n2183. 10.1136/bmj.n2183. [DOI] [PMC free article] [PubMed] [Google Scholar]
- 34.Patel JS, Oh Y, Rand KL, Wu W, Cyders MA, Kroenke K, et al. Measurement invariance of the patient health questionnaire-9 (PHQ-9) depression screener in U.S. adults across sex, race/ethnicity, and education level: NHANES 2005–2016. Depress Anxiety. 2019;36(9):813–23. 10.1002/da.22940. [DOI] [PMC free article] [PubMed] [Google Scholar]
- 35.Johnson CL, Paulose-Ram R, Ogden CL, Carroll MD, Kruszon-Moran D, Dohrmann SM, et al. National health and nutrition examination survey: analytic guidelines, 1999–2010. Vital Health Stat. 2013;2(161):1–24. [PubMed] [Google Scholar]
- 36.Díaz LA, et al. Disparities in steatosis prevalence in the United States by race or ethnicity according to the 2023 criteria. Commun Med. 2024;4(1):219. 10.1038/s43856-024-00649-x. [DOI] [PMC free article] [PubMed] [Google Scholar]
- 37.Huang JF, et al. Clinical care guidance in patients with diabetes and metabolic dysfunction-associated steatotic liver disease: a joint consensus. Hepatol Commun. 2024;8(11):e0571. 10.1097/HC9.0000000000000571. [DOI] [PMC free article] [PubMed] [Google Scholar]
- 38.Kim JE, Choi J, Kim M, Won CW. Assessment of existing anthropometric indices for screening sarcopenic obesity in older adults. Br J Nutr. 2023;129(5):875–87. 10.1017/s0007114522001817. [DOI] [PMC free article] [PubMed] [Google Scholar]
- 39.Shen Y, Wu Y, Fu M, Zhu K, Wang J. Association between weight-adjusted-waist index with hepatic steatosis and liver fibrosis: a nationally representative cross-sectional study from NHANES 2017 to 2020. Front Endocrinol (Lausanne). 2023;14:1159055. 10.3389/fendo.2023.1159055. [DOI] [PMC free article] [PubMed] [Google Scholar]
- 40.Hu Q, Han K, Shen J, Sun W, Gao L, Gao Y. Association of weight-adjusted-waist index with non-alcoholic fatty liver disease and liver fibrosis: a cross-sectional study based on NHANES. Eur J Med Res. 2023;28(1):263. 10.1186/s40001-023-01205-4. [DOI] [PMC free article] [PubMed] [Google Scholar]
- 41.Shen Y, Wu Y, Luo P, Fu M, Zhu K, Wang J. Association between weight-adjusted-waist index and depression in US adults: a cross-sectional study. J Affect Disord. 2024. 10.1016/j.jad.2024.03.143. [DOI] [PubMed] [Google Scholar]
- 42.Ballestri S, Nascimbeni F, Baldelli E, Marrazzo A, Romagnoli D, Lonardo A. NAFLD as a sexual dimorphic disease: role of gender and reproductive status in the development and progression of nonalcoholic fatty liver disease and inherent cardiovascular risk. Adv Ther. 2017;34(6):1291–326. 10.1007/s12325-017-0556-1. [DOI] [PMC free article] [PubMed] [Google Scholar]
- 43.Skubic C, Drakulić Ž, Rozman D. Personalized therapy when tackling nonalcoholic fatty liver disease: a focus on sex, genes, and drugs. Expert Opin Drug Metab Toxicol. 2018;14(8):831–41. 10.1080/17425255.2018.1492552. [DOI] [PubMed] [Google Scholar]
- 44.Wells JC. Sexual dimorphism of body composition. Best Pract Res Clin Endocrinol Metab. 2007;21(3):415–30. 10.1016/j.beem.2007.04.007. [DOI] [PubMed] [Google Scholar]
- 45.Qian S, Huang T. Letter to the editor-the association between weight-adjusted-waist index and depression: results from NHANES 2005–2018. J Affect Disord. 2024;353:99–100. 10.1016/j.jad.2024.03.007. [DOI] [PubMed] [Google Scholar]
- 46.Khatoon BS, Saravanan D, Ganamurali N, Sabarathinam S. A narrative review on the impact of sarcopenic obesity and its psychological consequence in quality of life. Diabetes Metab Syndr. 2023;17(9):102846. 10.1016/j.dsx.2023.102846. [DOI] [PubMed] [Google Scholar]
- 47.Ishii S, Chang C, Tanaka T, Kuroda A, Tsuji T, Akishita M, et al. The association between sarcopenic obesity and depressive symptoms in older Japanese adults. PLoS ONE. 2016;11(9):e0162898. 10.1371/journal.pone.0162898. [DOI] [PMC free article] [PubMed] [Google Scholar]
- 48.Lv Z, Zhao Y, Cui J, Zhang J. Genetically proxied sarcopenia-related muscle traits and depression: evidence from the FinnGen cohort. Am J Geriatr Psychiatry. 2024;32(1):32–41. 10.1016/j.jagp.2023.08.001. [DOI] [PubMed] [Google Scholar]
- 49.Long MT, Noureddin M, Lim JK. AGA clinical practice update: diagnosis and management of nonalcoholic fatty liver disease in lean individuals. Expert Rev Gastroenterol. 2022;163(3):764. 10.1053/j.gastro.2022.06.023. [DOI] [PMC free article] [PubMed] [Google Scholar]
- 50.Liu C, Wong PY, Chung YL, Chow SK, Cheung WH, Law SW, et al. Deciphering the obesity paradox in the elderly: a systematic review and meta-analysis of sarcopenic obesity. Obes Rev. 2023;24(2):e13534. 10.1111/obr.13534. [DOI] [PubMed] [Google Scholar]
- 51.Fulton S, Décarie-Spain L, Fioramonti X, Guiard B, Nakajima S. The menace of obesity to depression and anxiety prevalence. Trends Endocrinol Metab. 2022;33(1):18–35. 10.1016/j.tem.2021.10.005. [DOI] [PubMed] [Google Scholar]
- 52.Ouakinin SRS, Barreira DP, Gois CJ. Depression and obesity: integrating the role of stress, neuroendocrine dysfunction and inflammatory pathways. Front Endocrinol (Lausanne). 2018;9:431. 10.3389/fendo.2018.00431. [DOI] [PMC free article] [PubMed] [Google Scholar]
- 53.Bremner JD, Moazzami K, Wittbrodt MT, Nye JA, Lima BB, Gillespie CF, et al. Diet, Stress and Mental Health. Nutrients. 2020;12(8):2428. 10.3390/nu12082428. [DOI] [PMC free article] [PubMed] [Google Scholar]
- 54.Ly M, Yu GZ, Mian A, Cramer A, Meysami S, Merrill DA, et al. Neuroinflammation: a modifiable pathway linking obesity, Alzheimer’s disease, and depression. Am J Geriatr Psychiatry. 2023;31(10):853–66. 10.1016/j.jagp.2023.06.001. [DOI] [PMC free article] [PubMed] [Google Scholar]
Associated Data
This section collects any data citations, data availability statements, or supplementary materials included in this article.
Supplementary Materials
Data Availability Statement
This study analyzed publicly available datasets and can be found at https://www.cdc.gov/nchs/nhanes/.