

Abstract
Objective.
Social determinants of health (SDOH) impact cancer outcomes. The CDC Social Vulnerability Index (SVI) integrates scores for four neighborhood-based SDOH domains (socioeconomic status, household characteristics, minority status, and housing type/transportation) to assess neighborhood social vulnerability (NSV). While NSV has been associated with overall cancer mortality and lung, breast, colon, and endometrial cancer-specific mortality, the relationship between NSV as defined by the SVI and ovarian cancer outcomes remains unknown.
Methods.
We used data from 177 patients enrolled in an observational ovarian cancer cohort study from October 2012 through September 2022. All patients underwent debulking surgery and completed an entire course of standard-of-care platinum-based chemotherapy. Follow-up was completed through May 2024. SVI was calculated using census tract at diagnosis. High NSV was defined as SVI in the top quartile of the cohort. Cox proportional hazard models assessed the association between NSV and progression-free (PFS) and overall (OS) survival.
Results.
After accounting for demographic and clinical factors, high NSV was associated with significantly worse PFS (HR:2.31 [95% CI:1.48–3.61]; P < 0.001) and OS (HR:1.79 [95% CI:1.10–2.92]; P = 0.02), with neighborhood socioeconomic status associated with significantly worse PFS (HR:2.29 [95% CI:1.47–3.56]; P < 0.001) and OS (HR:1.71 [95% CI:1.04–2.80]; P = 0.03). Neighborhood housing type/transportation was also associated with significantly worse PFS (HR:1.65 [95% CI:1.07–2.55]; P = 0.02) and trended towards worse OS (HR:1.43 [95% CI:0.80–2.33]).
Conclusion and relevance.
Higher neighborhood social vulnerability is associated with worse outcomes among ovarian cancer patients. Validating these results in a population-based cohort and assessing programs to reduce neighborhood social vulnerability to improve ovarian cancer outcomes is warranted.
Keywords: Ovarian Cancer, Social determinants of health, Neighborhood social vulnerability, Social vulnerability index, Outcomes, Survival
1. Introduction
Social determinants of health (SDOH) are context-based measures defined as the “conditions in the environments where people are born, live, work, play, worship, and age that affect a wide range of health, functioning, and quality-of-life outcomes and risks,” and can be divided into five domains: economic stability, educational access and quality, health care access and quality, neighborhood and built environment, and social and neighborhood context [1]. Healthy People 2030’s overarching focus on SDOH underscores the importance of these factors in health [1]. A meta-analysis of over 50 studies suggested that up to one-third of deaths in the United States (US) each year can be attributed to social factors, including the physical living environment [2]. Within cancer care, neighborhood-based SDOH are recognized as significant contributors to outcomes in general [3,4] and cancer health disparities, which may not be eliminated by equivalent medical care [5,6].
Valid measures of SDOH can help identify populations at risk for poorer outcomes. One widely accepted tool for assessing SODH in a neighborhood is the Center for Disease Control and Prevention (CDC) Social Vulnerability Index (SVI) [7,8]. The SVI uses 16 US census variables from the American Community Survey (ACS) grouped into four SDOH domains to measure a neighborhood’s social vulnerability at the census tract level. While initially designed to identify vulnerable neighborhoods at increased risk of poor outcomes from disasters, the SVI has emerged as a tool for capturing the multidimensional nature of SDOH and their relationship to health [9]. Within the cancer domain, the SVI has been used to demonstrate significant disparities in cancer treatment and outcomes [10], including increased mortality among patients with breast [11], endometrial [12], and lung [13] cancers. Living in areas with higher SVI has also been associated with a lesser likelihood of being treated at a high-volume hospital [14,15] and achieving expected outcomes [16] as well as a greater likelihood of postoperative complications [17–19] and receipt of suboptimal postoperative care [20,21].
Epithelial ovarian cancer (EOC) is the most lethal gynecologic malignancy, with a 5-year survival of about 50% [22]. Factors such as age, race, disease stage, EOC histology, residual disease, and receiving platinum-based therapy all influence disease progression and, ultimately, overall survival. However, even when controlling for these factors, individual outcomes are highly variable: some patients suffer disease progression on or shortly after therapy, while others remain stable for years. There is also large variability in overall survival. Understanding factors associated with these survival disparities can help identify ways to mitigate them.
No studies have used the SVI to examine the relationship between neighborhood social vulnerability (NSV) and EOC outcomes. We used data from a cohort of EOC patients treated at a single institution to test the hypothesis that living in neighborhoods with higher social vulnerability as measured by the SVI is associated with worse progression-free and overall survival.
2. Methods
2.1. Study sample
This analysis included patients who provided written informed consent to enroll in a study of prognostic markers of EOC (ProMark; UPCI 07–058) and had multiple biospecimens available for a substudy of molecular prognostic markers (n = 201). Briefly, ProMark enrolled consented patients with suspected ovarian cancer seen at the University of Pittsburgh Medical Center (UPMC) Hillman National Cancer Institute-designated Comprehensive Cancer Center (HCC) between October 2012 and September 2022. Inclusion criteria into the biomarker substudy consisted of newly diagnosed, pathologically confirmed EOC, 18 years or older, ability to provide informed consent, willingness to provide access to medical records, undergoing interval or primary debulking surgery at HCC, completing an entire course (six cycles) of platinum-based chemotherapy at HCC, and willingness to provide biospecimens for research purposes. Patients with non-epithelial histology, a prior history of any cancer, and those who had initiated any chemotherapy before enrollment were excluded from the substudy. For the current analysis, we excluded an additional N = 24 patients with missing or invalid addresses (needed to link to SVI data; N = 17) or residing outside Pennsylvania (N = 7), leaving 177 patients.
This study was approved by the University of Pittsburgh Institutional Review Board (IRB 20120024) and followed the Strengthening the Reporting of Observational Studies in Epidemiology (STROBE) reporting guidelines in the design, analysis, and interpretation of study results.
2.2. Study measures
2.2.1. Neighborhood social vulnerability as measured by the social vulnerability index
To classify neighborhood social vulnerability, we used the CDC/Agency for Toxic Substances and Disease Registry (ATSDR) SVI 2022 database (svi.cdc.gov), the latest version available that overlapped with the diagnosis timeframe of the study cohort, to compute the SVI and SVI domain scores for each patient. Scores for 16 SDOH indicators classified into four domains were used to calculate the overall SVI and domain-specific scores. The SVI incorporates the latest information on SDOH using the 2018 to 2022 ACS [23]. The 16 SDOH indicators used in overall SVI calculations by domains include (Table 1): Domain 1: Socioeconomic Status, which incorporates measures of persons below 150% poverty line, civilians (age 16+) unemployed, housing cost-burdened (occupied housing units with annual income less than $75,000; 30% + of income spent on housing costs), persons age 25+ with no high school diploma, and persons uninsured in the total civilian noninstitutionalized population estimate; Domain 2: Household Characteristics, which incorporates measures of household members aged 65 or older, household members aged 17 or younger, civilian noninstitutionalized population with a disability, and single parent households with children under age 18; Domain 3: Racial and Ethnic Minority Status, which incorporates measures of persons self-identifying as Hispanic or Latino of any race and persons self-identifying as a racialized minority; and Domain 4: Housing Type/Transportation, which incorporates measures of housing in structures with 10 or more units, mobile homes estimate, occupied housing units with more people than rooms, households with no vehicle available, and persons in group quarters.
Table 1.
Social Vulnerability Index (SVI) indicator scores by SVI domains among epithelial ovarian cancer cases.
| All Cases N = 177 | ||||
|---|---|---|---|---|
| Census Tract Percent | Pennsylvania State Percentile Ranking | |||
| SVI Domainsb and SVI Indicatorsc | Median | IQRa | Median | IQRa |
| Neighborhood Socioeconomic Status | N/A | 0.38 | 0.17–0.G0 | |
| Below 150% Poverty | 16.2 | 8.6–22.8 | 0.48 | 0.22–0.68 |
| Unemployed | 4.7 | 2.9–6.G | 0.51 | 0.26–0.69 |
| Housing Cost Burden | 19.7 | 15.5–24.4 | 0.33 | 0.15–0.53 |
| No High School Diploma | 5.8 | 3.3–8.9 | 0.37 | 0.17–0.59 |
| No Health Insurance | 3.2 | 1.8–5.1 | 0.35 | 0.15–0.58 |
| Neighborhood Household Characteristics | N/A | 0.44 | 0.24–0.66 | |
| Aged 65 & Older | 21.7 | 18.0–26.0 | 0.70 | 0.48–0.87 |
| Aged 17 & Younger | 18.7 | 16.3–21.7 | 0.39 | 0.21 −0.61 |
| Civilian with a Disability | 15.1 | 12.0–18.8 | 0.57 | 0.36–0.78 |
| Single-Parent Households | 3.8 | 2.4–6.1 | 0.41 | 0.23–0.62 |
| Limited English Language Proficiency | 0.1 | 0.0–0.6 | 0.30 | 0.00–0.52 |
| Neighborhood Racial & Ethnic Minority Composition | 6.2 | 3.4–14.3 | 0.27 | 0.13–0.51 |
| Neighborhood Housing Type & Transportation | N/A | 0.47 | 0.24–0.71 | |
| Multi-Unit Structures | 2.4 | 0.0–9.5 | 0.45 | 0.00–0.71 |
| Mobile Homes | 1 | 0.0–8.2 | 0.59 | 0.00–0.83 |
| Crowding | 0 | 0.3–11.3 | 0.38 | 0.00–0.57 |
| No Vehicle | 6.5 | 3.3–11.3 | 0.49 | 0.28–0.68 |
| Group Quarters | 0.4 | 0.0–1.8 | 0.54 | 0.00–0.74 |
| Overall SVI | N/A | 0.38 | 0.18–0.61 | |
IQR: interquartile range.
SVI Domains reflect four Health People 2030 Social Determinants of Health (SDOH) Domains.
SVI Indicators reflect 16 US census variables from the American Community Survey.
Using these data, the SVI ranks each census tract within each state, enabling analysis of relative neighborhood social vulnerability in individual states. Percentile ranking values range from 0 to 1, with higher values indicating greater social vulnerability. For each census tract, the SVI computes its percentile ranking among all tracts within the state for (1) each of the 16 indicator variables, (2) each of the four SDOH domains, and (3) the tract SVI position overall. Each domain ranking was calculated by summing the percentiles of the indicator variables comprising that domain and ordering the summed percentiles. The overall tract SVI percentile was calculated by summing the sums of each domain and ordering the tracts.
We used geocod.io (www.geocod.io) to map the address at diagnosis to the census tract for each patient in the study cohort. Scores for all four domains and overall SVI based on census tract level Pennsylvania statewide comparisons were obtained using the database and instructions available from the CDC website (atsdr.cdc.gov/placeandhealth/svi). Based on the overall SVI percentile rankings for our cohort (Table 1), we computed SVI quartiles and then characterized NSV as low (SVI quartiles 1–3) or high (SVI quartile 4). We further calculated quartiles of each domain-specific score, which were then dichotomized as low neighborhood domain social vulnerability (defined as a domain percentile ranking in quartiles 1–3) or high neighborhood domain social vulnerability (defined as a percentile ranking in quartile 4).
2.2.2. Clinical and treatment characteristics
Clinical characteristics were extracted from the electronic medical record (EMR) as part of the original cohort study by staff trained in medical records abstraction (LB) and verified by comparison to the HCC cancer registry database, which is accredited by the American College of Surgeons Commission on Cancer (ACoS-CoC). Differences between the two data sources were discussed by the study team with a review of the EMR, and the final classification was determined by the study gynecologic oncologist (ST) or pathologist (EE), as appropriate. A single pathologist (EE) reviewed all patient primary diagnosis slides to confirm histology. Differences between the original pathologist classification and pathology review were resolved by the original pathologist and study pathologist (EE) together.
Extracted data included date of birth, date of diagnosis, address at diagnosis, date of last chemo infusion, date of death or date last known to be alive; self-identified race; histotype (carcinosarcoma, clear cell, endometrioid, low-grade serous, high-grade serous, mucinous); FIGO stage (I, II, III, IV); and optimally-debulked (residual disease <1 cm). Patients were also classified as receiving neoadjuvant or adjuvant-only therapy and whether or not their cancer was platinum-sensitive according to RECIST1.1/GCIG criteria [24], with platinum-sensitive cancer defined as no disease progression during treatment or within six months of the last chemotherapy infusion.
2.3. Outcomes
2.3.1. Primary outcomes
The primary outcomes were progression-free survival (PFS) and overall survival (OS). PFS was defined as the time (in months) between diagnosis and date of first progression (for patients who progressed) or date last known to be alive (for patients who did not progress). OS was defined as the time (in years) between diagnosis and date of death (for patients who died) or date last known to be alive (for patients assumed to be alive).
2.4. Statistical analysis
Overall and stratified patient characteristics were summarized using descriptive statistics, including median and interquartile range (IQR) for continuous variables and frequencies and proportions for categorical variables. Differences between patients with low versus high SVI were compared using the Wilcoxon rank-sum test for continuous variables and X2 or Fisher exact test for categorical variables, as appropriate.
Crude and full-adjusted Cox proportional hazard models with robust variance and Breslow method for ties were used to test the association of overall NSV and the four NSV domains with OS/PFS. The proportional hazard assumption for individual covariates and globally was assessed by testing for deviation from a nonzero slope in a generalized linear regression of the scaled Schoenfeld residuals on time [25]. Covariates in the adjusted models included demographic (age as a continuous variable) and clinical (histotype [HGSOC or carcinosarcoma y/n], stage [I/II, III/IV], optimally debulked [y/n], chemotherapy regimen [adjuvant/neoadjuvant]) characteristics associated with OS/PFS.
All analyses were performed using STATA/SE 17.0 software (STATA Corp) between May 2024 and September 2024, and a two-sided P value of less than 0.05 was considered statistically significant.
3. Results
3.1. Description of the study population
3.1.1. SVI SDOH indicators, SVI SDOH domains, and overall SVI rankings
Table 1 details the distribution of the study cohort’s census tract percentages and percentile rankings within Pennsylvania for the 16 SDOH indicators used to construct the four SDOH domains incorporated into the SVI, the percentile rankings for the four SDOHI domains included in the SVI, and the overall SVI score. In general, the median SDOH indicator, SDOH domain, and overall SVI percentile rankings of this study population were below the PA state medians, with the exceptions of households with residents aged 65 years and older, civilians with disabilities, housing in mobile homes, and living in group quarters (median percentile rankings 0.70, 0.57, 0.59, and 0.54, respectively). The median percentile ranking for SVI overall was 0.38 (IQR:0.18–0.61).
3.1.2. Demographic and clinical characteristics (Table 2)
Table 2.
Demographic and Clinical characteristics of epithelial ovarian cancer cases by low versus high neighborhood social vulnerabilitya.
| All Cases N = 177 N (%) |
Low Neighborhood Social Vulnerability N = 133 N (%) |
High Neighborhood Social Vulnerability N = 44 N (%) |
P valueb | |
|---|---|---|---|---|
| Age, median years (IQR) | 65.1 (58.7–70.8) | 65.1 (59.0–71.2) | 63.7 (55.6–70.5) | 0.46 |
| Age (years) | ||||
| ≤50 | 15 (8.47) | 10 (7.52) | 5 (11.36) | 0.87 |
| 50–54 | 19 (10.73) | 14 (10.53) | 5 (11.36) | |
| 55–59 | 20 (11.30) | 15 (11.28) | 5 (11.36) | |
| 60–64 | 34 (19.21) | 26 (19.55) | 8 (18.18) | |
| 65–69 | 37 (20.90) | 29 (21.80) | 8 (18.18) | |
| 70–74 | 24 (13.56) | 16 (12.03) | 8 (18.18) | |
| 75 and older | 28 (15.82) | 23 (17.29) | 5 (11.36) | |
| Histotype | ||||
| Carcinosarcoma | 13 (7.34) | 8 (6.02) | 5 (11.36) | 0.55 |
| Clear Cell Carcinoma | 12 (6.78) | 11 (8.27) | 1 (2.27) | |
| Endometrioid Carcinoma | 18 (10.17) | 15 (11.28) | 3 (6.82) | |
| High-grade Serous | 116 (65.54) | 85 (63.91) | 31 (70.45) | |
| Low-grade Serous | 10 (5.65) | 8 (6.02) | 2 (4.55) | |
| Mucinous | 8 (4.52) | 6 (4.51) | 2 (4.55) | |
| FIGO Stage | ||||
| I | 33 (18.64) | 27 (20.30) | 6 (13.94) | 0.06 |
| II | 20 (11.30) | 11 (8.27) | 9 (20.45) | |
| III | 105 (59.32) | 78 (58.65) | 27 (61.36) | |
| IV | 19 (10.73) | 17 (12.78) | 2 (4.55) | |
| Optimally Debulked | ||||
| Yes | 155 (87.57) | 116 (76.27) | 39 (88.64) | 0.81 |
| No | 22 (12.43) | 17 (12.78) | 5 (11.36) | |
| Chemotherapy Regimen | ||||
| Adjuvant | 135 (76.27) | 101 (75.94) | 34 (77.27) | 0.86 |
| Neo-Adjuvant | 42 (23.73) | 32 (24.06) | 10 (22.73) | |
| Platinum Sensitive | ||||
| Yes | 129 (72.88) | 100 (75.19) | 29 (65.91) | 0.23 |
| No | 48 (27.12) | 33 (24.81) | 15 (34.09) | |
| Progressed | 100 (56.50) | 69 (51.88) | 31 (70.45) | 0.03 |
| Died | 78 (44.07) | 53 (39.85) | 25 (56.82) | 0.05 |
Low Neighborhood Social Vulnerability: quartiles 1–3 of the Social Vulnerability Index (SVI). High Neighborhood Social Vulnerability: quartile 4 of the SVI.
P values from X2 or Fisher exact tests for the association between low versus high neighborhood social vulnerability and categorical characteristics and Wilcoxon rank sum tests for continuous characteristics.
Patients’ median (IQR) age was 65.1 (58.7–70.8) years. All patients self-identified as White. Patients in this cohort were more likely to be diagnosed with high-grade serous ovarian cancer (HGSOC), have higher-stage disease, be optimally debulked, receive adjuvant chemotherapy, and have platinum-sensitive disease.
Compared to patients in the low NSV group, patients in the high NSV group were slightly younger (median age 63.7 vs 65.1, P = 0.46). Patients with higher NSV were more likely to be diagnosed with HGSOC, have earlier-stage disease, have been optimally debulked, have received adjuvant chemotherapy, and have non-platinum sensitive disease; however, none of these differences were statistically significant.
3.2. Overall NSV, neighborhood SDOH domains, and survival
Among the 177 patients in this study, 100 progressed, 69 (51.88% of n = 133) in the low NSV group and 31 (70.45% of n = 44) in the high NSV group. A total of 78 deaths also occurred: 53 (39.85% of n = 133) in the low NSV group and 25 (56.82% of n = 44) in the high NSV group (Table 2).
After adjusting for demographic and clinical factors associated with outcomes, high NSV was significantly associated with earlier disease progression compared to low NSV (adjusted hazard ratio [aHR]:2.31 [95% CI, 1.48–3.61]; P < 0.001; Table 3 and Fig. 1). High neighborhood socioeconomic status and high neighborhood housing type/transportation domain score were associated with worse PFS (aHR:2.29 [95% CI:1.47–3.56]; P < 0.001 and aHR:1.65 [95% CI:1.07–2.55]; PI = 0.02, respectively), while neighborhood racial and minority status score trended towards poorer survival (aHR:1.41 [95% CI:0.90–2.20; P = 0.13]). Neighborhood household characteristics were not associated with PFS (aHR:1.19 [95% CI: 0.75–1.88]).
Table 3.
Association between neighborhood social vulnerability at time of diagnosis, neighborhood social vulnerability domains, and progression-free survival among epithelial ovarian cancer cases.
| Number of Cases | Number of Progressions | Crude HR | 95% CI | adjusted HRa | 95% CI | P-value | |
|---|---|---|---|---|---|---|---|
| Overall Neighborhood Social Vulnerability | |||||||
| Low | 133 | 69 | referent | referent | |||
| High | 44 | 31 | 1.65 | 1.08–2.53 | 2.31 | 1.48–3.61 | <0.001 |
| Neighborhood Social Vulnerability by SVI Domains b | |||||||
| Neighborhood Socioeconomic Status | |||||||
| Low | 133 | 69 | referent | referent | |||
| High | 44 | 31 | 1.60 | 1.04–2.44 | 2.29 | 1.47–3.56 | <0.001 |
| Neighborhood Household Characteristics | |||||||
| Low | 133 | 73 | referent | referent | |||
| High | 44 | 27 | 1.15 | 0.74–1.79 | 1.19 | 0.75–1.88 | 0.45 |
| Neighborhood Racial & Ethnic Minority Composition | |||||||
| Low | 133 | 71 | referent | referent | |||
| High | 44 | 29 | 1.29 | 0.84–1.99 | 1.41 | 0.90–2.20 | 0.13 |
| Neighborhood Housing Type & Transportation | |||||||
| Low | 133 | 69 | referent | referent | |||
| High | 44 | 31 | 1.52 | 0.99–2.32 | 1.65 | 1.07–2.55 | 0.02 |
SVI: Social Vulnerability Index.
Cox proportional hazard models adjusted for age (continuous), histotype (HGSO or carcinosarcoma [yes/no]), stage (I/II vs III/IV), optimally debulked (yes/no), and chemotherapy regimen (adjuvant vs neoadjuvant).
SVI Domains reflect Health People 2030 Social Determinants of Health (SDOH) Domains. For each domain, Low is defined as being in quartiles 1–3 of that domain for the cohort; High is defined as being quartile 4 of that domain for the cohort.
Fig. 1.
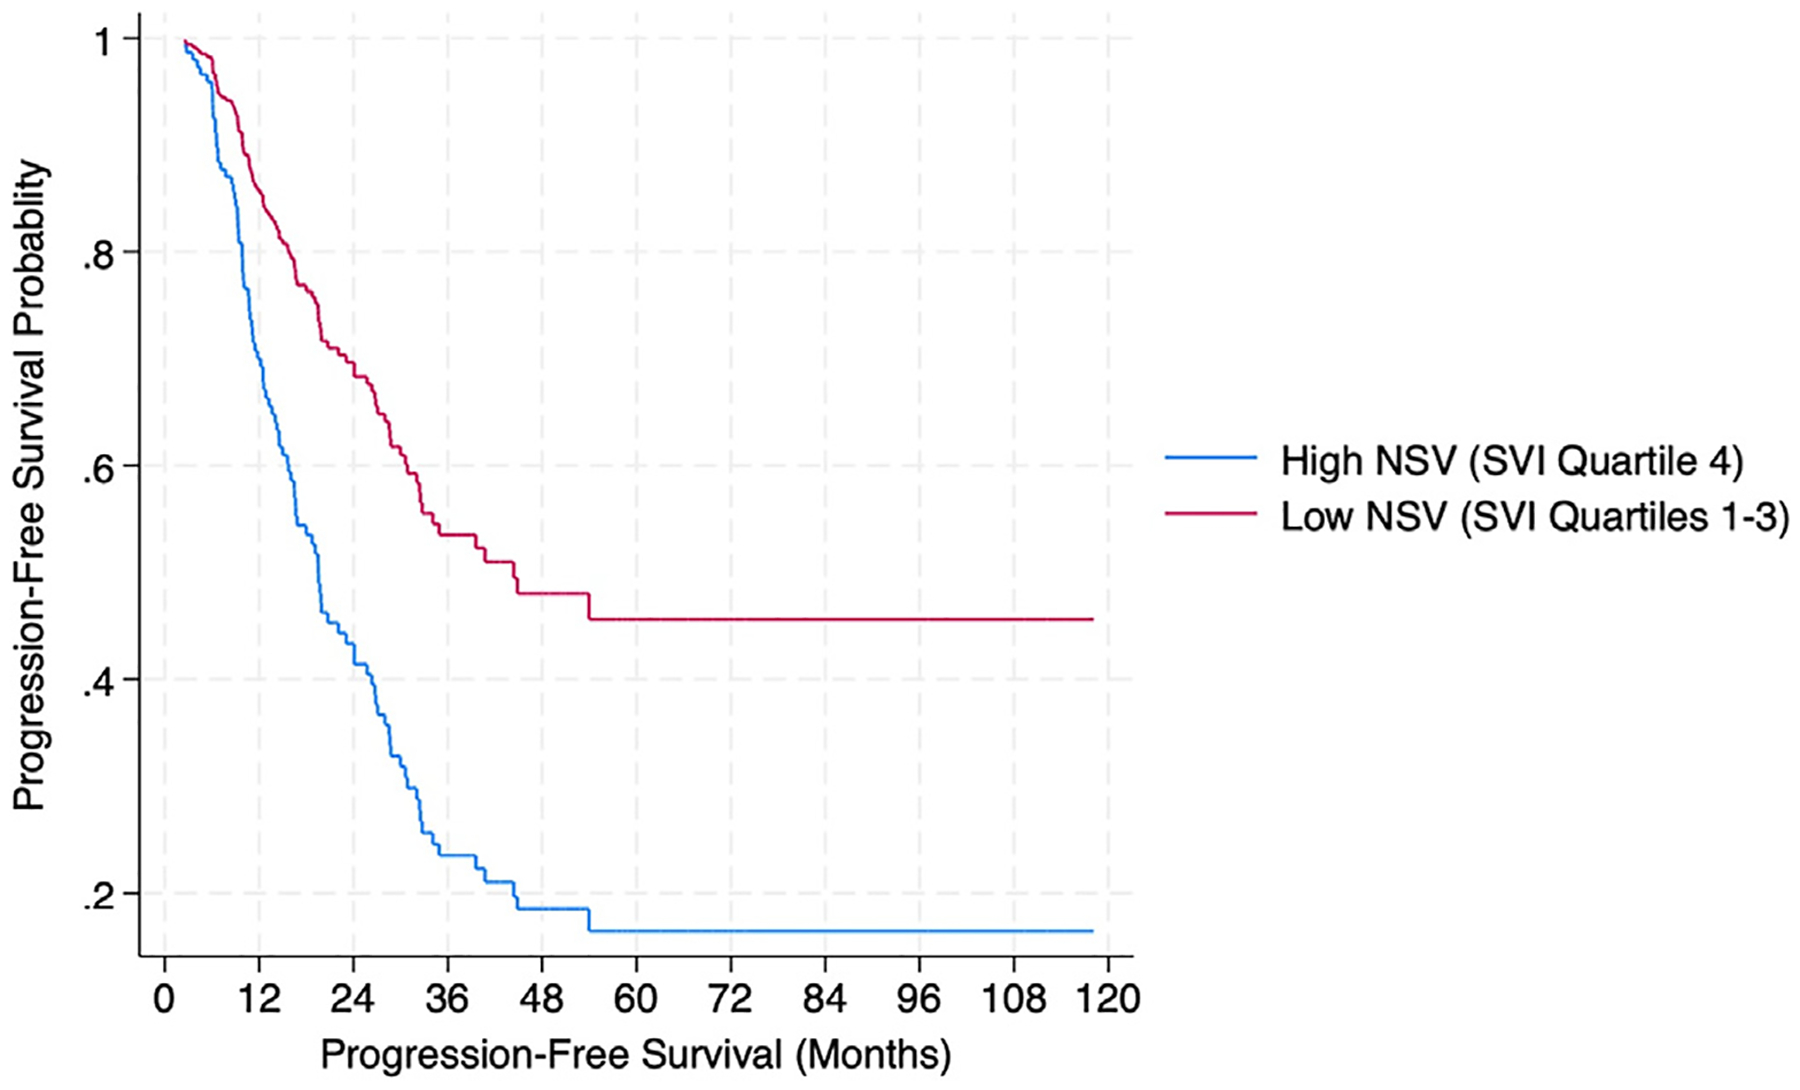
Progression-free survival according to neighborhood social vulnerability (NSV) among 177 newly diagnosed epithelial ovarian cancer cases. Survival functions from Cox Proportional hazard models adjusted for age, EOC histology, stage, optimally debulked status, and chemotherapy regimen. SVI: Social Vulnerability Index.
High NSV was also associated with worse OS (aHR:1.79 [95% CI:1.10–2.92]; P = 0.02; Table 4 and Fig. 2), as was high neighborhood socioeconomic status (aHR:1.71 [95% CI:1.04–2.80]; P = 0.03). While high neighborhood housing type/transportation score trended towards worse OS (aHR:1.43 [95% CI: 0.80–2.33]), there was no association between OS and the neighborhood racial and minority status (aHR:0.97; [95% CI:0.58–1.64]) or neighborhood household characteristics (aHR:1.13 [95% CI:0.67–1.91]).
Table 4.
Association between neighborhood social vulnerability at time of diagnosis, neighborhood social vulnerability domains, and overall survival among epithelial ovarian cancer cases.
| Number of Cases | Number of Deaths | Crude HR | 95% CI | adjusted HRa | 95% CI | P-value | |
|---|---|---|---|---|---|---|---|
| Overall Neighborhood Social Vulnerability | |||||||
| Low | 133 | 53 | referent | referent | |||
| High | 44 | 25 | 1.49 | 0.93–2.41 | 1.79 | 1.10–2.92 | 0.02 |
| Neighborhood Social Vulnerability by SVI Domains b | |||||||
| Neighborhood Socioeconomic Status | |||||||
| Low | 133 | 54 | referent | referent | |||
| High | 44 | 24 | 1.31 | 0.81–2.12 | 1.71 | 1.04–2.80 | 0.03 |
| Neighborhood Household Characteristics | |||||||
| Low | 133 | 58 | referent | referent | |||
| High | 44 | 20 | 1.02 | 0.61–1.70 | 1.13 | 0.67–1.91 | 0.65 |
| Neighborhood Racial & Ethnic Minority Composition | |||||||
| Low | 133 | 58 | referent | referent | |||
| High | 44 | 20 | 0.92 | 0.55–1.53 | 0.97 | 0.58–1.64 | 0.92 |
| Neighborhood Housing Type & Transportation | |||||||
| Low | 133 | 54 | referent | referent | |||
| High | 44 | 24 | 1.37 | 0.85–2.22 | 1.43 | 0.80–2.33 | 0.15 |
SVI: Social Vulnerability Index.
Cox proportional hazard models adjusted for age (continuous), histotype (HGSO or carcinosarcoma [yes/no]), stage (I/II vs III/IV), optimally debulked (yes/no), and chemotherapy regimen (adjuvant vs neoadjuvant).
SVI Domains reflect Health People 2030 Social Determinants of Health (SDOH) Domains. For each domain, Low is defined as being in quartiles 1–3 of that domain for the cohort; High is defined as being quartile 4 of that domain for the cohort.
Fig. 2.

Overall survival according to neighborhood social vulnerability (NSV) among 177 newly diagnosed epithelial ovarian cancer cases. Survival functions from Cox Proportional hazard models adjusted for age, EOC histology, stage, optimally debulked status, and chemotherapy regimen. SVI: Social Vulnerability Index.
4. Discussion
In this cross-sectional study, living in a neighborhood with higher social vulnerability was associated with a greater hazard of earlier EOC progression and death. To our knowledge, this is the first study to use the SVI to examine the associations of neighborhood social vulnerability with EOC outcomes.
Single neighborhood SODH, such as neighborhood racial/ethnic composition and neighborhood income levels, have been shown to impact EOC survival [26–31]. Given the complex nature of SDOH and the interrelationship among components of the different SDOH domains, single SDOH indicators may not sufficiently capture the impact of SDOH on health and, in particular, EOC outcomes. Only one prior study [32] evaluated a composite neighborhood-based measure of SDOH by quantifying neighborhood disadvantage based on Browning and Cagney’s “concentrated disadvantage” factor [33], which incorporates seven indicators of area socioeconomics and diversity at the census tract level: percent of residents below the poverty line, percent unemployed, percent receiving public assistance, percent under age 18, percent female-headed households, and percent Black residents. Among 581 ovarian cancer cases diagnosed between 1994 and 1998, in a univariate model, greater disadvantage was negatively associated with ovarian cancer-specific survival (−0.645, P = 0.008) [32], which our neighborhood composite socioeconomic status analyses affirmed.
By using SVI to capture neighborhood social vulnerability, we included a broader and more diverse group of neighborhood SDOH indicators, including neighborhood housing types, transportation, and educational attainment. These factors likely impact EOC outcomes and are essential to consider when developing strategies and policies to improve individual and population-based outcomes. Moreover, as a composite index constructed from multiple neighborhood-based SDOH domains associated with health outcomes, SVI provides a more holistic insight into how neighborhood social vulnerability impacts EOC survival.
Over the last decade, much effort has been devoted to identifying and collecting neighborhood-based data to measure social variables that impact health. Examples include the Area Deprivation Index [34], the Neighborhood Need Index [35], the Index of Concentration at the Extremes [36,37], the Neighborhood Deprivation Index [38], the Yang Index [39], and the Yost Index [40]. We chose the SVI because it integrates 16 indicators across four SDOH domains recognized as key to individual and neighborhood health [1], which makes SVI more comprehensive in its coverage than other indices and also allows both composite and domain-specific SDOH analyses. Moreover, SVI enables state-specific evaluations at the census tract level. The US Census Bureau defines census tracts as “small, relatively permanent statistical subdivisions of a county” that typically cover a contiguous area whose boundaries follow “visible and identifiable features.” [41] Because they are designed to be fairly homogeneous sociodemographic entities with a population size between 1200 and 8000 people [41], census tracts provide greater neighborhood SDOH granularity and homogeneity than county or zip code divisions typically used by other metrics. Using SVI relative to the state ranking offers greater insight into smaller differences in SDOH measures than national rankings, as national data have a much wider geographical variance than state data, and there are well-known geographical variations in EOC treatment, which can impact survival [42–44].
There are several potential ways that individual health can be impacted by the context of the neighborhood in which one lives. Higher neighborhood SES has been previously reported to be associated with greater individual social support [45], higher self-rated health [46], overall healthier environments [47], and greater access to care [48], all factors positively impacting EOC survival [48–51]. In contrast, lower neighborhood SES and greater disadvantage have been previously reported to negatively impact individual health by creating conditions not conducive to health-promoting behaviors [52], such as creating delays in seeking care and increasing social isolation [53], which negatively impact EOC survival [49,54]. We found that a higher neighborhood social vulnerability, particularly higher neighborhood SES vulnerability (i.e., neighborhoods with lower SES), was significantly associated with worse PFS and OS. The SVI neighborhood SES domain includes poverty, unemployment, and educational attainment measures. Neighborhoods with greater poverty, higher unemployment, and lower educational attainment create environments where personal safety and seeking/maintaining employment take priority over caring for one’s health [52]. The result can be delayed diagnosis, delayed or incomplete treatment, and reduced follow-up care, all of which significantly impact EOC outcomes [49,54]. In addition, factors such as crime and neighborhood decay, more commonly found in neighborhoods with lower SES, increase an individual’s stress level [55], which can negatively impact antitumor immunity [56,57] and lead to poorer EOC outcomes [58]. Thus, living in neighborhoods of high social vulnerability creates additional health challenges above one’s circumstances that could lead to worse EOC outcomes.
Our study has several limitations. First, our study is not population-based. Specifically, our population included only individuals who consented to a blood-based biomarker study, provided a blood sample, underwent surgery, and completed an entire course of chemotherapy at our institution. As such, it does not represent all patients with newly diagnosed EOC seen at HCC nor within HCC’s catchment area. It is possible that patients not part of the cohort differed systematically from those included, which would introduce bias into our sample. For example, patients with fewer resources or from areas with limited transportation may have been unable to complete the recommended treatment plan or return for follow-up care. However, the similarity between the clinical characteristics of our cohort and the cases from our previous population-based case-control study conducted in the HCC catchment area [59] suggests that such bias, if present, is unlikely to have impacted our results. Additionally, our cohort was drawn predominantly from western Pennsylvania (the HCC catchment area) and may not generalize to other regions, especially given the geographical differences in EOC treatment [42–44].
Second, our population was exclusively White patients, which reflects the self-identified racial composition of our catchment area (median census tract percentile ranking for racial and ethnic minority status in our population:0.27; 75th percentile:0.51; Table 1). Our findings cannot be generalized to persons not identifying as White and cannot provide insight into the well-known racial disparities in EOC outcomes [22]. Moreover, the median census tract percentile ranking of the percent of population age 65+ in our population (0.70) was substantially greater than the PA state median, reflecting the general makeup of western PA, which has a greater aging population than the rest of the state. Notably, the composite neighborhood household characteristics domain was not associated with PFS or OS, suggesting that the general age and household makeup of the population in a neighborhood may not impact outcome. In addition, all patients were treated at a single NCI Comprehensive Cancer Center, which may bias our population towards individuals with the knowledge and resources to seek specialty care and, thus, may not represent the general population of EOC patients. Notably, the median values for almost all the SDOH indicators incorporated in the SVI for our population were below the PA state median (Table 1), suggesting that our population was drawn from more privileged neighborhoods. In addition, while we used the census tract level SVI data, other metrics to quantify SDOH, such as the Yost Index [40], have used data from census blocks, which are subdivisions of census tracts created to facilitate census canvassing. The census block’s finer granularity may provide even greater insight into neighborhood characteristics influencing health outcomes, especially in urban areas. Also, like other neighborhood metrics, SVI cannot provide insight into individual factors, such as social support [60], that may mitigate the impact of neighborhood context on cancer outcomes. Finally, while our results suggest a relationship between neighborhood social vulnerability and EOC outcomes, they do not provide insight into the interaction between neighborhood context and EOC biology, which likely jointly impact survival.
Despite these limitations, our study has several strengths, including the systematic extraction of data by a single, trained individual with comparison of data values to an ACoS-CoC accredited cancer registry; the further validation of clinical data by a board-certified gynecologic oncologist and pathologist, including central pathologic review of all patient tumor slides; and the treatment of all patients at a high-volume NCI Comprehensive Cancer Center, which ensures adherence to guideline-concordant care and consistency of treatment across patients.
5. Conclusions
In this cross-sectional study of patients with EOC, residing in a neighborhood with higher social vulnerability as assessed by the SVI was associated with worse progression-free and overall survival. These data suggest that improving neighborhood social vulnerability could help reduce the negative individual and societal impacts of this highly fatal disease. Validating our study results in a larger, population-based cohort, assessing the effects on EOC outcomes of programs to reduce neighborhood social vulnerability, and determining the relationship between neighborhood context and EOC biology are important future research directions.
HIGHLIGHTS.
Social determinants of health (SDOH) can impact cancer treatment outcomes.
The Social Vulnerability Index uses four neighborhood SDOH domains to quantify neighborhood social vulnerability (NSV).
Greater overall NSV was associated with worse progression-free (PFS) and overall survival (OS) in ovarian cancer patients.
Greater neighborhood socioeconomic and housing/transportation vulnerability were also associated with worse PFS and OS.
Research on the effects of programs to improve NSV on ovarian cancer survival is warranted.
Funding
Funding for this work was provided by the Congressionally Directed Medical Research Program (W81XWH2110338), the National Institutes of Health (R21CA267050), and the Janet Burroughs Ovarian Cancer Foundation.
Footnotes
CRediT authorship contribution statement
Lauren Borho: Writing – review & editing, Writing – original draft, Data curation, Conceptualization. Esther Elishaev: Writing – review & editing, Data curation. Riyue Bao: Writing – review & editing, Formal analysis. Emily O’Brien: Data curation, Writing – review & editing. Kaitlyn Dinkins: Writing – review & editing. Jessica Berger: Writing – review & editing. Michelle Boisen: Writing – review & editing. John Comerci: Writing – review & editing. Madeleine Courtney-Brooks: Writing – review & editing. Robert P. Edwards: Writing – review & editing. Alison Aunkst Garrett: Writing – review & editing. Joseph L. Kelley: Writing – review & editing. Jamie Lesnock: Writing – review & editing. Haider S. Mahdi: Writing – review & editing. Alexander Olawaiye: Writing – review & editing. Shannon Rush: Writing – review & editing. Paniti Sukumvanich: Writing – review & editing. Sarah Taylor: Writing – review & editing. Ritu Aneja: Writing – review & editing, Conceptualization. Lyse Norian: Writing – review & editing, Conceptualization. Rebecca C. Arend: Writing – review & editing, Conceptualization. Francesmary Modugno: Writing – review & editing, Writing – original draft, Visualization, Supervision, Resources, Funding acquisition, Formal analysis, Data curation, Conceptualization.
Declaration of competing interest
Arend: Consultant for Tempus; Advisory Board, Immunogen; Steering Committee, Merck; Advisory Board, Seagen; Advisory Board, Sutro; Advisory Board, GSK; Consultant, Mersana. Bao: PCT/US15/612657 (Cancer Immunotherapy), PCT/US18/36052 (Microbiome Bio-markers for Anti-PD-1/PD-L1 Responsiveness: Diagnostic, Prognostic and Therapeutic Uses Thereof), PCT/US63/055227 (Methods and Compositions for Treating Autoimmune and Allergic Disorders). Berger: Advisory Board, GSK. All other authors declare no conflicts of interest.
Data sharing statement
Data requests should be directed to the corresponding author, who will facilitate data access through the ProMark Oversight Committee and the University of Pittsburgh Office of Responsible Research Practices. To gain access to the data, requesters will need to have an approved ProMark proposal and sign a data access agreement with the University of Pittsburgh.
References
- [1].Social Determinants of Health, Social Determinants of Health - Healthy People 2030, Accessed June 18, 2024 https://health.gov/healthypeople/priority-areas/social-determinants-health 2024.
- [2].Galea S, Tracy M, Hoggatt KJ, Dimaggio C, Karpati A, Estimated deaths attributable to social factors in the United States, Am. J. Public Health 101 (8) (2011) 1456–1465, 10.2105/AJPH.2010.300086. [DOI] [PMC free article] [PubMed] [Google Scholar]
- [3].Tucker-Seeley R, Abu-Khalaf M, Bona K, et al. , Social determinants of health and cancer care: an ASCO policy statement, JCO Oncol. Pract 20 (5) (2024) 621–630, 10.1200/OP.23.00810. [DOI] [PubMed] [Google Scholar]
- [4].Gomez SL, Shariff-Marco S, DeRouen M, et al. , The impact of neighborhood social and built environment factors across the cancer continuum: current research, methodological considerations, and future directions, Cancer 121 (14) (2015) 2314–2330, 10.1002/cncr.29345. [DOI] [PMC free article] [PubMed] [Google Scholar]
- [5].Ellis L, Canchola AJ, Spiegel D, Ladabaum U, Haile R, Gomez SL, Racial and ethnic disparities in cancer survival: the contribution of tumor, sociodemographic, institutional, and neighborhood characteristics, J. Clin. Oncol 36 (1) (2018) 25–33, 10.1200/JCO.2017.74.2049. [DOI] [PMC free article] [PubMed] [Google Scholar]
- [6].Tucker-Seeley RD, Social determinants of health and disparities in Cancer Care for Black People in the United States, JCO Oncol. Pract 17 (5) (2021) 261–263, 10.1200/OP.21.00229. [DOI] [PubMed] [Google Scholar]
- [7].Flanagan BE, Gregory EW, Hallisey EJ, Heitgerd JL, Lewis B, A social vulnerability index for disaster management, J. Homeland Secur. Emerg. Manage 8 (1) (2011) 10.2202/1547-7355.1792. [DOI] [Google Scholar]
- [8].Centers for Disease Control and Prevention, CDC/ATSDR Social Vulnerability Index (CDC/ATSDR SVI), Accessed June 18, 2024 https://www.atsdr.cdc.gov/placeandhealth/svi/index.html 2024.
- [9].CDC/ATSDR SVI Utilization and Implementation Tool (SUIT), Accessed October, 2024 https://www.atsdr.cdc.gov/placeandhealth/svi/publications/publications_materials.html 2024.
- [10].Tran T, Rousseau MA, Farris DP, Bauer C, Nelson KC, Doan HQ, The social vulnerability index as a risk stratification tool for health disparity research in cancer patients: a scoping review, Cancer Causes Control 34 (5) (2023) 407–420, 10.1007/s10552-023-01683-1. [DOI] [PMC free article] [PubMed] [Google Scholar]
- [11].Mehta A, Jeon WJJ, Hino C, Lau E, Mirshahidi HR, Nagaraj G, Association of US county social vulnerability with cancer mortality, J. Clin. Oncol 40 (16_suppl) (2022) 6534, 10.1200/JCO.2022.40.16_suppl.6534. [DOI] [Google Scholar]
- [12].Miller AK, Gordon JC, Curtis JW, Ajayakumar J, Schumacher FR, Avril S, The geographic context of racial disparities in aggressive endometrial cancer sub-types: integrating social and environmental aspects to discern biological outcomes, Int. J. Environ. Res. Public Health 19 (14) (2022) 10.3390/ijerph19148613. [DOI] [PMC free article] [PubMed] [Google Scholar]
- [13].Ibrahim R, Sakr L, Lewis JA, Kim RY, Benn BS, Low SW, Social vulnerability and lung malignancy mortality, J. Cancer Policy 38 (2023), 100453 10.1016/j.jcpo.2023.100453. [DOI] [PMC free article] [PubMed] [Google Scholar]
- [14].Diaz A, Chavarin D, Paredes AZ, Tsilimigras DI, Pawlik TM, Association of neighborhood characteristics with utilization of high-volume hospitals among patients undergoing high-risk Cancer surgery, Ann. Surg. Oncol 28 (2) (2021) 617–631, 10.1245/s10434-020-08860-5. [DOI] [PubMed] [Google Scholar]
- [15].Diaz A, Hyer JM, Azap R, Tsilimigras D, Pawlik TM, Association of social vulnerability with the use of high-volume and magnet recognition hospitals for hepatopancreatic cancer surgery, Surgery 170 (2) (2021) 571–578, 10.1016/j.surg.2021.02.038. [DOI] [PubMed] [Google Scholar]
- [16].Hyer JM, Tsilimigras DI, Diaz A, et al. , High social vulnerability and “textbook outcomes” after cancer operation, J. Am. Coll. Surg 232 (4) (2021) 351–359, 10.1016/j.jamcollsurg.2020.11.024. [DOI] [PubMed] [Google Scholar]
- [17].Diaz A, Barmash E, Azap R, Paredes AZ, Hyer JM, Pawlik TM, Association of county-level social vulnerability with elective versus non-elective colorectal surgery, J. Gastrointest. Surg 25 (3) (2021) 786–794, 10.1007/s11605-020-04768-3. [DOI] [PubMed] [Google Scholar]
- [18].Diaz A, Dalmacy D, Hyer JM, Tsilimigras D, Pawlik TM, Intersection of social vulnerability and residential diversity: postoperative outcomes following resection of lung and colon cancer, J. Surg. Oncol 124 (5) (2021) 886–893, 10.1002/jso.26588. [DOI] [PubMed] [Google Scholar]
- [19].Carmichael H, Dyas AR, Bronsert MR, et al. , Social vulnerability is associated with increased morbidity following colorectal surgery, Am. J. Surg 224 (1 Pt A) (2022) 100–105, 10.1016/j.amjsurg.2022.03.010. [DOI] [PubMed] [Google Scholar]
- [20].Dalmacy DM, Tsilimigras DI, Hyer JM, Paro A, Diaz A, Pawlik TM, Social vulnerability and fragmentation of postoperative surgical care among patients undergoing hepatopancreatic surgery, Surgery 171 (4) (2022) 1043–1050, 10.1016/j.surg.2021.08.030. [DOI] [PubMed] [Google Scholar]
- [21].Azap RA, Paredes AZ, Diaz A, Hyer JM, Pawlik TM, The association of neighborhood social vulnerability with surgical textbook outcomes among patients undergoing hepatopancreatic surgery, Surgery 168 (5) (2020) 868–875, 10.1016/j.surg.2020.06.032. [DOI] [PubMed] [Google Scholar]
- [22].Siegel RL, Giaquinto AN, Jemal A, Cancer statistics, 2024, CA Cancer J. Clin 74 (1) (2024) 12–49, 10.3322/caac.21820. [DOI] [PubMed] [Google Scholar]
- [23].U.S. Census Bureau, Understanding and Using American Community Survey Data: What all Data Users Need to Know, U.S, Government Publishing Office, Washington, DC, 2020. [Google Scholar]
- [24].Rustin GJ, Vergote I, Eisenhauer E, et al. , Definitions for response and progression in ovarian cancer clinical trials incorporating RECIST 1.1 and CA 125 agreed by the gynecological Cancer intergroup (GCIG), Int. J. Gynecol. Cancer 21 (2) (2011) 419–423, 10.1097/IGC.0b013e3182070f17. [DOI] [PubMed] [Google Scholar]
- [25].Grambsch PM, Therneau TM, Proportional hazards tests and diagnostics based on weighted residuals, Biometrika 81 (3) (1994) 515–526, 10.1093/biomet/81.3.515. [DOI] [Google Scholar]
- [26].Bristow RE, Powell MA, Al-Hammadi N, et al. , Disparities in ovarian cancer care quality and survival according to race and socioeconomic status, J. Natl. Cancer Inst 105 (11) (2013) 823–832, 10.1093/jnci/djt065. [DOI] [PMC free article] [PubMed] [Google Scholar]
- [27].Karanth S, Fowler ME, Mao X, et al. , Race, socioeconomic status, and health-care access disparities in ovarian cancer treatment and mortality: systematic review and Meta-analysis, JNCI Cancer Spectr. 3 (4) (2019), pkz084 10.1093/jncics/pkz084. [DOI] [PMC free article] [PubMed] [Google Scholar]
- [28].Bristow RE, Chang J, Ziogas A, Campos B, Chavez LR, Anton-Culver H, Sociodemographic disparities in advanced ovarian cancer survival and adherence to treatment guidelines, Obstet. Gynecol 125 (4) (2015) 833–842, 10.1097/AOG.0000000000000643. [DOI] [PMC free article] [PubMed] [Google Scholar]
- [29].Bristow RE, Chang J, Ziogas A, Anton-Culver H, Vieira VM, Spatial analysis of adherence to treatment guidelines for advanced-stage ovarian cancer and the impact of race and socioeconomic status, Gynecol. Oncol 134 (1) (2014) 60–67, 10.1016/j.ygyno.2014.03.561. [DOI] [PMC free article] [PubMed] [Google Scholar]
- [30].Parham G, Phillips JL, Hicks ML, et al. , The national cancer data base report on malignant epithelial ovarian carcinoma in African-American women, Cancer 80 (4) (1997) 816–826. [PubMed] [Google Scholar]
- [31].Mei S, Chelmow D, Gecsi K, et al. , Health disparities in ovarian cancer: report from the ovarian cancer evidence review conference, Obstet. Gynecol 142 (1) (2023) 196–210, 10.1097/AOG.0000000000005210. [DOI] [PMC free article] [PubMed] [Google Scholar]
- [32].Peterson CE, Rauscher GH, Johnson TP, et al. , The effect of neighborhood disadvantage on the racial disparity in ovarian cancer-specific survival in a large hospital-based study in cook county, Illinois, Front. Public Health 3 (2015) 8, 10.3389/fpubh.2015.00008. [DOI] [PMC free article] [PubMed] [Google Scholar]
- [33].Browning CR, Cagney KA, Neighborhood structural disadvantage, collective efficacy, and self-rated physical health in an urban setting, J. Health Soc. Behav 43 (4) (2002) 383–399. [PubMed] [Google Scholar]
- [34].Kind AJH, Buckingham WR, Making neighborhood-disadvantage metrics accessible - the neighborhood Atlas, N. Engl. J. Med 378 (26) (2018) 2456–2458, 10.1056/NEJMp1802313. [DOI] [PMC free article] [PubMed] [Google Scholar]
- [35].Huang DD, Shehada MZ, Chapple KM, et al. , Community need index (CNI): a simple tool to predict emergency department utilization after hospital discharge from the trauma service, Trauma Surg. Acute Care Open 4 (1) (2019), e000239 10.1136/tsaco-2018-000239. [DOI] [PMC free article] [PubMed] [Google Scholar]
- [36].Ds M, The Prodigal Paradigm Returns: Ecology Comes Back to Sciology. Does It Take A Village, Psychology Press, 2001. [Google Scholar]
- [37].Krieger N, Waterman PD, Spasojevic J, Li W, Maduro G, Van Wye G, Public health monitoring of privilege and deprivation with the index of concentration at the extremes, Am. J. Public Health 106 (2) (2016) 256–263, 10.2105/AJPH.2015.302955. [DOI] [PMC free article] [PubMed] [Google Scholar]
- [38].Messer LC, Laraia BA, Kaufman JS, et al. , The development of a standardized neighborhood deprivation index, J. Urban Health 83 (6) (2006) 1041–1062, 10.1007/s11524-006-9094-x. [DOI] [PMC free article] [PubMed] [Google Scholar]
- [39].Yang JSC, Harrati A, Clarke C, Keegan THM, Gomez SL, Data from: Developing an Area-Based Socioeconomic Measure from American Community Survey Data, Freemont, California, 2014.
- [40].Yost K, Perkins C, Cohen R, Morris C, Wright W, Socioeconomic status and breast cancer incidence in California for different race/ethnic groups, Cancer Causes Control 12 (8) (2001) 703–711, 10.1023/a:1011240019516. [DOI] [PubMed] [Google Scholar]
- [41].United States Census Bureau Surveys and Programs, Accessed June 19, 2024 https://www.census.gov/programs-surveys/geography/about/glossary.html.
- [42].Polsky D, Armstrong KA, Randall TC, et al. , Variation in chemotherapy utilization in ovarian cancer: the relative contribution of geography, Health Serv. Res 41 (6) (2006) 2201–2218, 10.1111/j.1475-6773.2006.00596.x. [DOI] [PMC free article] [PubMed] [Google Scholar]
- [43].Thrall MM, Gray HJ, Symons RG, Weiss NS, Flum DR, Goff BA, Trends in treatment of advanced epithelial ovarian cancer in the medicare population, Gynecol. Oncol 122 (1) (2011) 100–106, 10.1016/j.ygyno.2011.03.022. [DOI] [PMC free article] [PubMed] [Google Scholar]
- [44].Dehaeck U, McGahan CE, Santos JL, Carey MS, Swenerton KD, Kwon JS, The impact of geographic variations in treatment on outcomes in ovarian cancer, Int. J. Gynecol. Cancer 23 (2) (2013) 282–287, 10.1097/IGC.0b013e31827b87b1. [DOI] [PubMed] [Google Scholar]
- [45].Wen M, Browning CR, Cagney KA, Poverty, affluence, and income inequality: neighborhood economic structure and its implications for health, Soc. Sci. Med 57 (5) (2003) 843–860, 10.1016/s0277-9536(02)00457-4. [DOI] [PubMed] [Google Scholar]
- [46].Diez Roux AV, Mair C, Neighborhoods and health, Ann. N. Y. Acad. Sci 1186 (2010) 125–145, 10.1111/j.1749-6632.2009.05333.x. [DOI] [PubMed] [Google Scholar]
- [47].Carroll-Scott A, Gilstad-Hayden K, Rosenthal L, et al. , Disentangling neighborhood contextual associations with child body mass index, diet, and physical activity: the role of built, socioeconomic, and social environments, Soc. Sci. Med 95 (2013) 106–114, 10.1016/j.socscimed.2013.04.003. [DOI] [PMC free article] [PubMed] [Google Scholar]
- [48].Gomez SL, Chirikova E, McGuire V, et al. , Role of neighborhood context in ovarian cancer survival disparities: current research and future directions, Am. J. Obstet. Gynecol 229 (4) (2023) 366–376 e8, 10.1016/j.ajog.2023.04.026. [DOI] [PMC free article] [PubMed] [Google Scholar]
- [49].Lutgendorf SK, De Geest K, Bender D, et al. , Social influences on clinical outcomes of patients with ovarian cancer, J. Clin. Oncol 30 (23) (2012) 2885–2890, 10.1200/JCO.2011.39.4411. [DOI] [PMC free article] [PubMed] [Google Scholar]
- [50].Vieira VM, Villanueva C, Chang J, Ziogas A, Bristow RE, Impact of community disadvantage and air pollution burden on geographic disparities of ovarian cancer survival in California, Environ. Res 156 (2017) 388–393, 10.1016/j.envres.2017.03.057. [DOI] [PMC free article] [PubMed] [Google Scholar]
- [51].Gupta A, Chen Q, Wilson LE, et al. , Factor analysis of health care access with ovarian cancer surgery and gynecologic oncologist consultation, JAMA Netw. Open 6 (2) (2023), e2254595 10.1001/jamanetworkopen.2022.54595. [DOI] [PMC free article] [PubMed] [Google Scholar]
- [52].Sampson RJ, The neighborhood context of well-being, Perspect. Biol. Med. Summer 46 (3 Suppl) (2003) S53–S64. [PubMed] [Google Scholar]
- [53].Kim J, Neighborhood disadvantage and mental health: the role of neighborhood disorder and social relationships, Soc. Sci. Res 39 (2) (2010) 260–271, 10.1016/j.ssresearch.2009.08.007. [DOI] [Google Scholar]
- [54].Zhao J, Chen R, Zhang Y, Wang Y, Zhu H, Impact of treatment delay on the prognosis of patients with ovarian cancer: a population-based study using the surveillance, epidemiology, and end results database, J. Cancer 15 (2) (2024) 473–483, 10.7150/jca.87881. [DOI] [PMC free article] [PubMed] [Google Scholar]
- [55].Schulz AJ, Israel BA, Zenk SN, et al. , Psychosocial stress and social support as mediators of relationships between income, length of residence and depressive symptoms among African American women on Detroit’s eastside, Soc. Sci. Med 62 (2) (2006) 510–522, 10.1016/j.socscimed.2005.06.028. [DOI] [PubMed] [Google Scholar]
- [56].Thaker PH, Han LY, Kamat AA, et al. , Chronic stress promotes tumor growth and angiogenesis in a mouse model of ovarian carcinoma, Nat. Med 12 (8) (2006) 939–944, 10.1038/nm1447. [DOI] [PubMed] [Google Scholar]
- [57].Sood AK, Bhatty R, Kamat AA, et al. , Stress hormone-mediated invasion of ovarian cancer cells, Clin. Cancer Res 12 (2) (2006) 369–375, 10.1158/1078-0432.CCR-05-1698. [DOI] [PMC free article] [PubMed] [Google Scholar]
- [58].Poole EM, Kubzansky LD, Sood AK, Okereke OI, Tworoger SS, A prospective study of phobic anxiety, risk of ovarian cancer, and survival among patients, Cancer Causes Control 27 (5) (2016) 661–668, 10.1007/s10552-016-0739-0. [DOI] [PMC free article] [PubMed] [Google Scholar]
- [59].Kurta ML, Edwards RP, Moysich KB, et al. , Prognosis and conditional disease-free survival among patients with ovarian cancer, J. Clin. Oncol 32 (36) (2014) 4102–4112, 10.1200/JCO.2014.55.1713. [DOI] [PMC free article] [PubMed] [Google Scholar]
- [60].Warner ET, Gomez SL, Impact of neighborhood racial composition and metropolitan residential segregation on disparities in breast cancer stage at diagnosis and survival between black and white women in California, J. Community Health 35 (4) (2010) 398–408, 10.1007/s10900-010-9265-2. [DOI] [PMC free article] [PubMed] [Google Scholar]
Associated Data
This section collects any data citations, data availability statements, or supplementary materials included in this article.
Data Availability Statement
Data requests should be directed to the corresponding author, who will facilitate data access through the ProMark Oversight Committee and the University of Pittsburgh Office of Responsible Research Practices. To gain access to the data, requesters will need to have an approved ProMark proposal and sign a data access agreement with the University of Pittsburgh.