

Abstract

Methylenetetrahydrofolate dehydrogenase/cyclohydrolase 2 (MTHFD2), a pivotal mitochondrial enzyme in one-carbon metabolism, is significantly upregulated in various cancers but minimally expressed in normal proliferating cells. In contrast, MTHFD1, which performs similar functions, is predominantly expressed in normal cells. Therefore, targeting MTHFD2 with selective inhibitors holds promise for a broader therapeutic window with reduced toxicity and fewer side effects. This study identified selective 2,4-diamino-6-oxo-1,6-dihydropyrimidin-5-yl ureido-based derivatives through systematic chemical modifications and SAR studies. Structural biology investigations revealed substitutions in the phenyl ring and tail region modulate potency and selectivity toward MTHFD2. Additionally, a comprehensive cell screening platform revealed acute myeloid leukemia cells with FLT3 internal tandem duplication mutations are particularly sensitive to these inhibitors. Furthermore, synergistic effects were observed when combining potential compounds with Alimta. Compound 16e emerged as a leading candidate, demonstrating superior inhibition and selectivity for MTHFD2, favorable pharmacokinetics, and potent antitumor efficacy in MOLM-14 xenograft models.
Introduction
Methylenetetrahydrofolate dehydrogenase/cyclohydrolase 2 (MTHFD2) is a bifunctional metabolic enzyme found in mitochondria, exhibiting both dehydrogenase and cyclohydrolase catalytic activities.1,2 In one-carbon metabolism, MTHFD2 converts 5, 10-methylene tetrahydrofolate (5,10-CH2-THF) to 10-formyl tetrahydrofolate (10-CHO-THF) in mitochondria (Figure 1A), thereby regulating the production of NADH, purines, and pyrimidines.1,3 MTHFD2 has been discovered as one of the most overexpressed metabolic genes in cancer cells.4 Numerous studies have shown that the knockdown of MTHFD2 impairs tumor growth in various cancers, including colorectal cancer,3,5 ovarian cancer,6−8 breast cancer,4,9−11 nonsmall cell lung cancer (NSCLC),12,13 and acute myeloid leukemia (AML).14,15 These findings suggest that MTHFD2 holds significant potential as a therapeutic target for cancer treatment. By inhibiting MTHFD2, it would be feasible to strategically disrupt the metabolic pathways crucial for sustaining tumor growth and proliferation, offering a promising approach for the development of novel cancer therapies.1,16−19
Figure 1.

(A) Catalytic reaction of MTHFD2. (B) Structures of MTHFD2 inhibitors.
An isozyme, methylenetetrahydrofolate dehydrogenase, cyclohydrolase and formyltetrahydrofolate synthetase 1 (MTHFD1), performs similar catalytic reactions to MTHFD2, albeit localized in the cytoplasm rather than the mitochondrion. Moreover, MTHFD1 possesses additional enzymatic activity as a 10-formyl tetrahydrofolate synthetase, converting 10-CHO-THF to formate.1,20 The key distinction between these two proteins lie in their expression profiles: MTHFD1 is typically expressed in normal cells while MTHFD2 is abundantly expressed in immortal,21 embryonic,22 and cancer cells,4 but absent in adult normal cells.4 Therefore, designing inhibitors specifically against MTHFD2 holds promise for achieving a broader therapeutic window with minimized toxicity and fewer side effects.
Several MTHFD2 inhibitors have been identified (Figure 1B). LY374571, a 2,4-diamino-6-oxo-1,6-dihydropyrimidin-5-yl ureido based derivative, was originally developed by Eli Lilly and its chemical structure was subsequently re-evaluated by Eadsforth et al.23,24 Our study found it concurrently inhibited both the isoforms of MTHFD1 and MTHFD2 with IC50 values of 630 and 80 nM, respectively. TH9619, an analogue of LY374571 reported by Bonagas et al., showed potent inhibition against MTHFD2 with an IC50 value of 47 nM.15 TH9619, administered at 60 mg/kg four times daily, prolonged mouse survival on a low-folate diet with intravenously injected HL-60 xenograft tumors. Raze Therapeutics discovered caffeine (xanthine-based) inhibitors of MTHFD2, exemplified by compound A, which showed selectivity to MTHFD2.25,26 Further structural modification of compound A, as reported by Lee et al., revealed that compound B allosterically binds to MTHFD2 and coexists with the substrate analogue.26 A series of tricyclic coumarin-based derivatives incorporating a sulfonamide group was disclosed by Kawai et al. as MTHFD2 inhibitors. DS18561882, the most promising compound in the coumarin series, was an orally available MTHFD2 inhibitor and demonstrated antitumor effects in an MDA-MB-231 mouse xenograft model.27 Moreover, carolacton, a natural product, exhibited low-nanomolar inhibition against both human MTHFD1 and MTHFD2.28
Several structurally diverse inhibitors of MTHFD2 have been identified; however, only a few crystal structures of MTHFD2 in complex with inhibitors have been reported. The first is that of human MTHFD2 in complex with LY345899, NAD+ and phosphate.29 MTHFD2 forms a homodimer, with LY345899 occupying the substrate binding site. The cofactor NAD+ was bound to the C-lobe, where the phosphate group interacted with the hydroxyl group of NAD+ and formed an extensive network in the dimer interface. Recently, the same group reported structures of inhibitors TH7299, TH9028, and TH9619 bound to MTHFD2.15 Kawai et al. reported structures of the MTHFD2 in complexed with tricyclic coumarin derivatives.27,30 The coumarin derivatives bound within the substrate-binding site, albeit with a binding mode that differed slightly from LY345899. Unlike LY345899, which formed a hydrogen bond network through its pteridine moiety, the interactions between the coumarin scaffold and its terminal moiety with the surrounding residues contributed to the inhibitory effect of these inhibitors. We previously solved the crystal structures of MTHFD2 in complex with the xanthine derivatives.26 Compound B was identified as an allosteric binder to MTHFD2, leading to significant conformational changes in the protein. This binding event also hindered the binding of the cofactors NAD+ and phosphate to MTHFD2.
In this study, we report the synthesis, chemical structural modification and systematical structure–activity relationship (SAR) study that led to the identification of selective 2,4-diamino-6-oxo-1,6-dihydropyrimidin-5-yl ureido based derivatives. To elucidate their binding mechanism and selectivity, we determined the protein structures of MTHFD2 complexed with 2,4-diaminopyrimidine-based derivatives, alongside those of MTHFD1. Comparative analysis revealed that additional substitutions on the phenyl ring of these inhibitors caused the shift in the nicotinamide group of cofactor NADP+ and induced conformational changes in the phenyl ring and γ-carboxylic acid of the inhibitors, thereby disrupting their interactions with MTHFD1. Furthermore, we present the first systematic establishment of a cell screening platform for MTHFD2 inhibitors using a diverse panel of leukemia and solid tumor cell lines. Our findings showed that AML cells with FLT3 internal tandem duplication (ITD) mutations, an alteration in the FLT3 gene encoding a tyrosine kinase involved in cell growth and survival signaling pathways, exhibited the most favorable responses to this series of MTHFD2 inhibitors. Moreover, a promising candidate, 16e, with high potency and selectivity to MTHFD2, demonstrated excellent pharmacokinetics profiles and exhibited in vivo antitumor efficacy. These findings would provide insights and hold promise for advancing cancer research by targeting MTHFD2.
Results and Discussion
Chemistry
The general synthetic routes to the final products 11, 16, 19 and 23 derived from LY374571 can be prepared according to previously described methods15,31 and are shown in Schemes 1 and 2. 2,5,6-Triamino-3H-pyrimidin-4-one sulfate 1, 2,5-diamino-6-hydroxy-3H-pyrimidin-4-one 2, 2,5-diamino-3H-pyrimidin-4-one 3, 5,6-diamino-2-hydroxy-3H-pyrimidin-4-one 4 or 5,6-diamino-3H-pyrimidin-4-one 5 in NaOH solution was reacted with 1-isocyanato-4-nitrobenzene 6, ethyl 4-isocyanatobenzoate 7, 4-isocyanato-3-methylbenzoate 8, 4-isocyanato-3-florobenzoate 9 or methyl 6-isocyanatonicotinate 10 in CH3CN to provide the urea 11 or 12. The hydrolysis of ester group (12) was catalyzed by 1 N NaOH solution to give acid 13. Condensation of acids 13 with l-glutamic acid diethyl ester hydrochloride 14 or 2-amino-4-(1H-tetrazol-5-yl)butyric acid methyl ester 15(32) using coupling reagents EDC HCl (1-ethyl-3-(3-(dimethylamino)propyl)carbodiimide hydrochloride) and HOSu (N-hydroxysuccinimide) followed by hydrolysis of the methyl ester group by NaOH produced target compounds 16 (Scheme 1).
Scheme 1. Reagents and Conditions: (a) 1 N NaOH, CH3CN, 25 °C; (b) 1 N NaOH, H2O, 25 °C for Ester Compounds 12, 14a, 14b and 15a; (c) EDC HCl, HOSu, Dry DMSO, 25 °C.

Scheme 2. Reagents and Conditions: (a) bis(Trichloromethyl)carbonate, CH2Cl2, DIPEA, 15 °C; (b) Compound 1, 1 N NaOH, CH3CN, 25 °C; (c) TFA, 25 °C; (d) SOCl2, Pyridine, CH2Cl2, 55 °C; (e) 1 N NaOH, H2O, 25 °C; (f) l-Glutamic Acid Diethyl Ester Hydrochloride, EDC HCl, HOSu, dry DMSO, 25 °C.
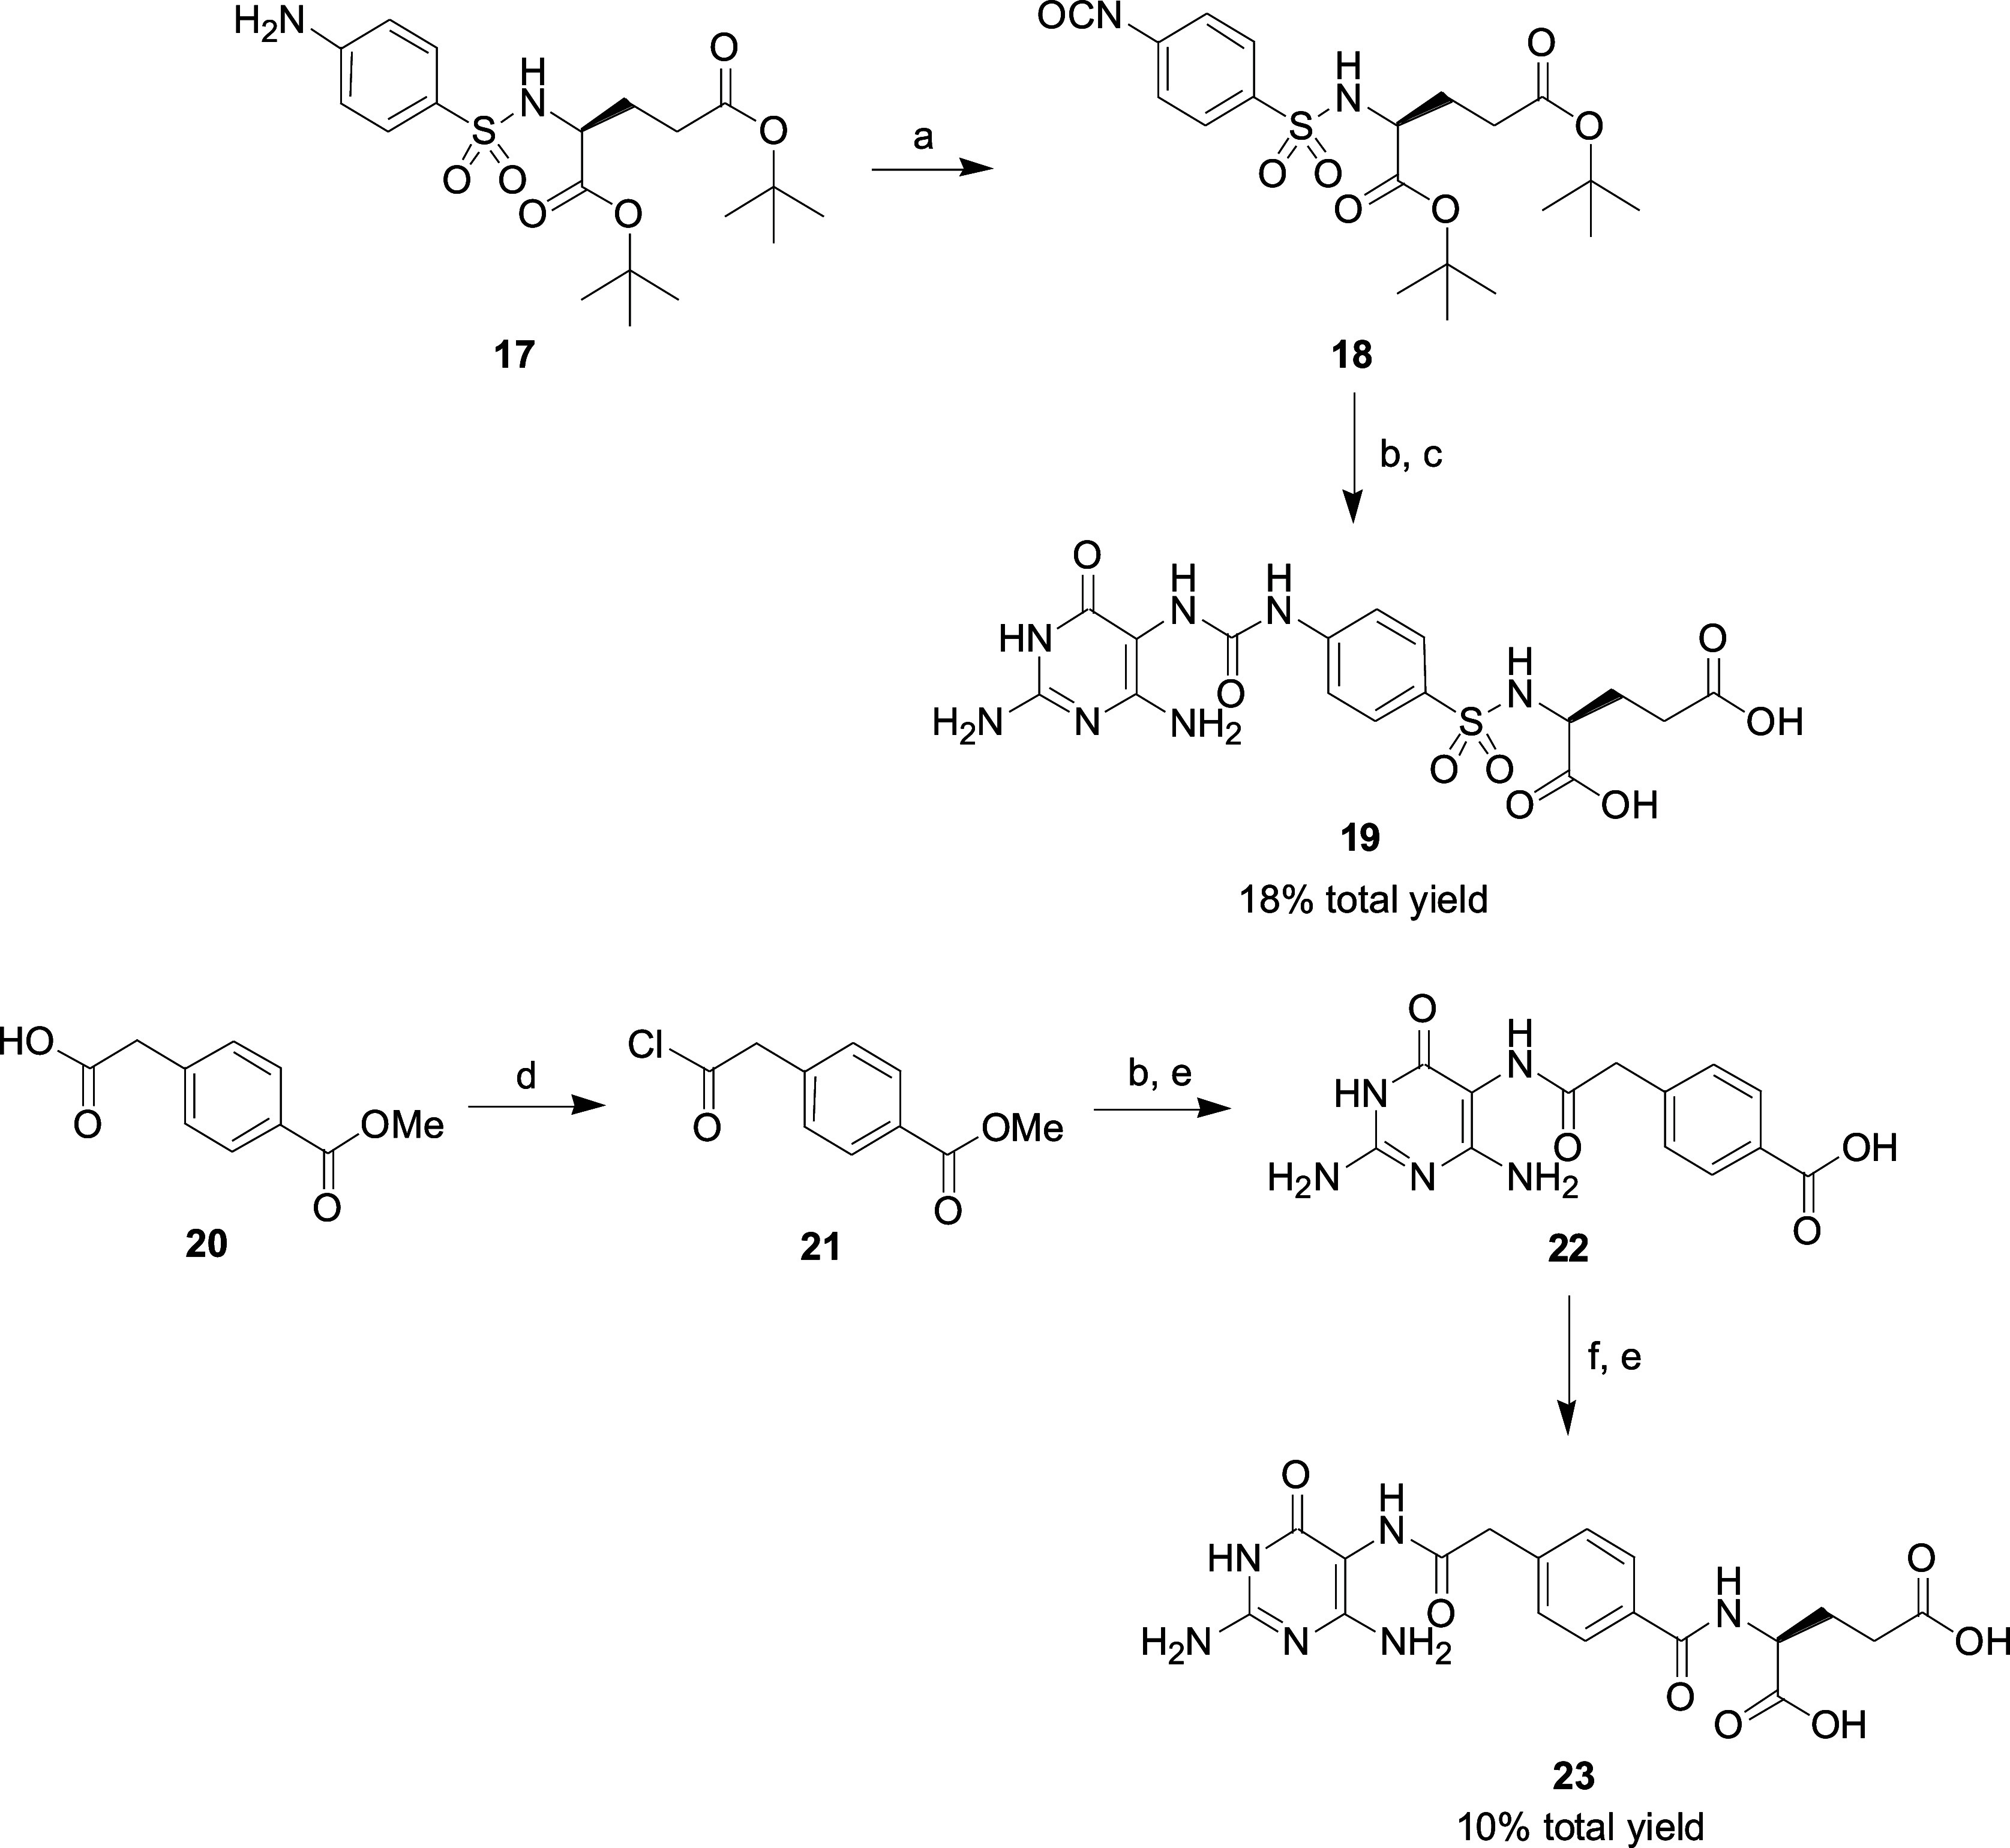
Compound 17 obtained by a known procedure33 was reacted with bis(trichloromethyl)carbonate to form the corresponding isocyanate 18. Compound 1 was coupled with isocyanate 18 and then deprotected the tert-butyl ester group by TFA to yield the desired benzenesulfonylamino 19. The reaction of SOCl2 with 4-carboxymethylbenzoic acid methyl ester 20 in the presence of pyridine gave acyl chloride 21. The synthetic route for the preparation of the final product diacid 23 starting from 21 is like that of 16 (Scheme 2).
SARs of Diaminopyrimidine-Based Derivatives
Compound LY374571, originally discovered by Eli Lilly23 and the chemical structure later correctly determined by Eadsforth et al.,24 has been chosen as the lead compound for the development of selective MTHFD2 inhibitors. LY374571 was a competitive inhibitor of human MTHFD1 (IC50 = 630 nM) and MTHFD2 (IC50 = 80 nM). To enhance its inhibitory potential and selectivity, a systematic structure–activity relationship study was conducted, starting from l-glutamic acid moiety of LY374571 (Table 1). Removal of glutamic acid moiety of LY374571 lost the inhibitory activity against MTHFD1 and MTHFD2 (11, IC50 > 10 μM). Bioisosteric replacement of γ-carboxylic acid of glutamic acid with 1H-tetrazole to give 16a significantly increased the potency against MTHFD1 (IC50 = 120 nM) and MTHFD2 (IC50 = 22 nM). However, the selectivity index (SI), calculated as the ratio of the IC50 of MTHFD1 to the IC50 of MTHFD2, of 16a was slightly decreased (SI = 5.5) compared to LY374571 (SI = 7.9). When α- and γ-carboxylic acid of glutamic acid was replaced with 1H-tetrazole, compound 16b exhibited moderate inhibition against MTHFD2 (IC50 = 150 nM) with low selectivity over MTHFD1 (SI = 2.5). Furthermore, the replacement of the glutamate tail (LY374571) with a glutamine tail (16c) resulted in decreased inhibition against MTHFD2 and reduced selectivity. The replacement of the carboxyl group next to the central phenyl ring in LY374571 with a sulfonyl moiety (19) led to the complete loss of inhibitory activity against MTHFD1 and MTHFD2 (IC50 > 10 μM), even when the glutamate tail was retained. Next, the substituent effects at the third position of phenyl ring were also examined. Methyl substituted 16d, chloro substituted 16e and fluoro substituted 16f had minor effects on the inhibition of MTHFD2 with IC50 values ranging from 66 to 134 nM. However, larger methyl and chloro substituents (16d and 16e) exhibited higher selectivity indices (SI) of 38.5 and 27.1, respectively, compared to the unsubstituted (LY374571, SI = 7.9) and fluoro-substituted (16f, SI = 6.6) analogues. In comparison, 1H-tetrazole 16g with a 3-chloro substituent on the phenyl ring does not improve selectivity (SI = 5.8) when compared with unsubstituted analogue 16a (SI = 5.5). Furthermore, when the central linker of LY374571 was changed from the phenyl ring to the pyridine group, 16h showed decreased inhibition against MTHFD1 (IC50 = 4140 nM) and MTHFD2 (IC50 = 470 nM).
Table 1. Inhibition of MTHFD1 and MTHFD2 with Diaminopyrimidine-Based Derivatives.


SI, the ratio of IC50 for MTHFD1/IC50 for MTHFD2.
In addition to evaluating the effects of the terminal amino acids and substituents at the third position of central phenyl ring, the urea linker and triaminopyrimidine headgroup of LY374571 were also modified. Replacement of the urea moiety with an amide group (23) resulted in complete loss of inhibitory activity. Subsequently, the effects on replacing the headgroup, 2,5,6-triamino-3H-pyrimidin-4-one ring, on LY374571 with alternative pyrimidine groups, such as 2,5-diamino-6-hydroxy-3H-pyrimidin-4-one (16i), 2,5-diamino-3H-pyrimidin-4-one (16j), 5,6-diamino-1H-pyrimidine-2,4-dione (16k) and 5,6-diamino-3H-pyrimidin-4-one (16l), were evaluated. Replacement of NH2 group at the sixth position of 2,5,6-triamino-3H-pyrimidin-4-one (LY374571) with OH group to yield 16i completely lost the activities of MTHFD1 and MTHFD2 (IC50 > 10 μM). Removing the NH2 group at the sixth position of 2,5,6-triamino-3H-pyrimidin-4-one (16j) decreased the inhibition of MTHFD1 and MTHFD2, with IC50 values of 2200 and 530 nM, respectively. Further structural modifications at the second position of headgroup of LY374571 to give 16k (2-one) or 16l (2-H) resulted in a dramatic loss of potency against both MTHFD1 (IC50 > 10 μM) and MTHFD2 (IC50 > 10 μM and IC50 = 8330 nM, respectively).
Structure Biology Studies of Diaminopyrimidine-Based Derivatives
In order to investigate the binding mechanisms of MTHFD2 inhibitors and gain insights into their interactions with MTHFD2, structural biology studies were conducted to determine the structure of human MTHFD2 in complex with 16a, as well as compounds 16d, 16e, 16g, and LY374571. These investigations were conducted under conditions that included the presence of NAD+ and phosphate, and the resulting cocrystal structures were resolved at a resolution ranging from 2.04 to 2.54 Å. Data collection and refinement statistics are summarized in Table 2. The structure of MTHFD2/16a (Figure 2) revealed the headgroup, 2,5,6-triamino-3H-pyrimidin-4-one ring of 16a, establishes a hydrogen bond network with key amino acid residues, including Val131, Leu133, and Asp155. The carbonyl group of the triaminopyrimidine was hydrogen bonded with the main chain of Ala175 and Thr176 through a water molecule. Additionally, hydrophobic interactions occurred between the triaminopyrimidine headgroup and Leu130 and Phe157. The urea moiety of 16a formed hydrogen bonds with the side chain of Lys88 and Gln132. In the middle region of 16a, the phenyl ring formed robust π–π interactions with Tyr84, and hydrophobic interactions with neighboring amino acids such as Tyr84, Ile276, Thr316, and Val317. The amide moiety adjacent to the phenyl ring was hydrogen bonded with Asn87 and participated in hydrophobic interactions with Gly313.
Table 2. X-ray Data and Structure Refinement for MTHFD2 Complex Structures.
| MTHFD2/LY374571 | MTHFDD2/16a | MTHFD2/16d | MTHFD2/16e | MTHFD2/16g | |
|---|---|---|---|---|---|
| resolution | 28.90–2.12 | 27.18–2.54 | 27.26–2.35 | 28.91–2.06 | 28.62–2.04 |
| space group | P65 | P65 | P65 | P65 | P65 |
| unit cell a = b, c (Å)(α = β = 90°, γ = 120°) | 115.61, 113.33 | 115.56, 112.96 | 115.34, 113.36 | 115.62, 113.27 | 114.85, 113.41 |
| unique reflections | 48918 (4856) | 28338 (2823) | 35675 (3516) | 53096 (5290) | 54200 (5369) |
| I/σ | 20.45 (2.18) | 13.9 (2.14) | 16.53 (2.13) | 24.48 (3.21) | 19.63 (2.06) |
| Rmerge (%) | 6.1 (50.9) | 6.5 (37.6) | 7.9 (62.4) | 5.7 (52.4) | 6.2 (47.3) |
| completeness (%) | 99.7 (100.0) | 98.0 (99.8) | 99.8 (99.9) | 99.3 (100.0) | 99.3 (99.8) |
| Rwork/Rfree | 0.2084/0.2414 | 0.1919/0.2397 | 0.2068/0.2488 | 0.2111/0.2392 | 0.1965/0.2237 |
| r.m.s.d (bond) (Å) | 0.007 | 0.008 | 0.008 | 0.008 | 0.007 |
| r.m.s.d (angle) (deg) | 0.931 | 1.037 | 1.024 | 0.942 | 0.917 |
| Ramachandran favored (%) | 98.24 | 97.74 | 98.08 | 98.76 | 98.77 |
Figure 2.

Crystal structure of MTHFD2 (light teal) in complex with 16a (yellow) and NAD+ (omitted for clarity) (PDB: 9ISC). Hydrogen-bond with protein, water -bridged and π–π interactions are shown in red, pale-cyan and green dashed lines, respectively. Water molecules are shown as spheres (cyan). For clarity, the NAD+ is omitted in the figure.
Furthermore, the carboxylic acid moiety of 16a not only formed a hydrogen bond with the main chain of Gly310 but also established a well-organized hydrogen bond network with Gly311, Val312, and Gly313 mediated by a water molecule. Moreover, the 1H-tetrazole moiety formed hydrogen bonds with the side chain of Ser83. Additionally, it may have interacted directly or through a water molecule with Arg278. Additional hydrophobic interactions occurred between the tail region of 16a with Leu289, Pro309, and Pro314 of MTHFD2. It is noteworthy that compound 11, lacking the tail region of 16a, completely lost the inhibitory activity against MTHFD2, emphasizing the important role of the tail group in the compound’s inhibitory activity.
When substituting the 1H-tetrazole moiety in compounds 16a (and 16g) with the γ-carboxylic acid of glutamic acid in LY374571 (and 16e), it was found that 16a and 16g exhibited increased inhibitory potency against MTHFD2 compared to their counterparts with the γ-carboxylic acid substitution, LY374571 and 16e (Table 1). Superimposition of the structures of MTHFD2/16a with MTHFD2/LY374571 revealed that the 1H-tetrazole moiety in 16a exhibits an enhanced tendency for forming hydrogen bonds, either directly or through water bridging, with the side chain of Arg278 and Ser83 (Figure 3A). Moreover, the larger size of 1H-tetrazole moiety was found to form more extensive van der Waals contacts with neighboring residues such as Ile276, Leu289, and Pro309, as compared to its γ-carboxylic acid counterpart (Figure 3B). This observation suggests that the 1H-tetrazole moiety is better accommodated within the cavity, contributing to an enhanced overall structural fit. The collective impact of these interactions contributes to the increased potency of 16a and 16g against MTHFD2.
Figure 3.

Superimposition of the crystal structure of MTHFD2/16a (PDB 9ISC, light teal/yellow) on MTHFD2/LY374571 (PDB 9IS9, gray/pink). For clarity, the NAD+ is omitted in the figure. (A) Interactions of the 1H-tetrazole moiety of 16a with MTHFD2. Hydrogen-bond with protein and water -bridged interactions are shown in yellow and pale-cyan dashed lines, respectively. The water molecule is shown as a sphere (cyan). The hydrogen bond interaction of the γ-carboxylic acid moiety of LY374571 with MTHFD2 is shown in violet. The electron density map for the side chain of R278 is unclear; therefore, the side chain of R278 has been excluded from the MTHFD2/LY374571 structure. (B) The surface view around the tail part of 16a.
In comparison to 16a, compound 16b introduced an additional modification by replacing the carboxylic acid of 16a with a 1H-tetrazole moiety. The considerable bulkiness of the 1H-tetrazole moiety in 16b is likely to hinder the maintenance of an optimal distance required for forming hydrogen bonds with the main chain of Gly310. Moreover, the larger size of the 1H-tetrazole moiety in 16b disrupted the water-mediated hydrogen bond network with residues Gly312, Val313, and Gly314. These structural alterations contribute to the decreased inhibitory activity of 16b compared to 16a against MTHFD2.
As revealed in both the structures of MTHFD2/16a and MTHFD2/LY374571, the amide moiety adjacent to the phenyl ring formed the hydrogen bond with the side chain of Asn87. The spatial configuration of this area is conducive to accommodating a small linker, such as the amide linker. When substituting it with a larger linker, exemplified by the sulfonyl moiety in compound 19, steric hindrance interactions with surrounding residues, particularly Gly313, were introduced (Figure S2). The larger substitution also induced a shift in the α-carboxylic acid group, resulting in the loss of the hydrogen bond with the main chain of G310 and a water-mediated hydrogen bond network with Gly311, Val312, and Gly313 (Figure S2). Consequently, this alteration led to a significant perturbation in the interactions with MTHFD2, ultimately resulting in the complete loss of inhibitory activity against MTHFD2.
The substitution at the third position of phenyl ring exhibited a minor effect on the inhibition of MTHFD2. Comparative structural analysis of MTHFD2 in complex with compounds LY374571, 16d and 16e revealed similar interactions with the protein around this phenyl region, maintaining π–π interactions with Tyr84 and hydrophobic interactions with Tyr84, Ile276, Thr316, and Val317. Moreover, the replacement of the phenyl ring moiety (LY374571) with a pyridine group (16h) resulted in weaker π–π stacking interactions with the side chain of Tyr84, attributed to the perturbation of the π-electron cloud by the nitrogen atom within the pyridine ring. Consequently, this modification led to a reduction in activity against MTHFD2, suggesting the significance of the phenyl ring and its interactions with surrounding residues in modulating inhibitory activity.
As revealed in all cocrystal structures of MTHFD2 in complex with LY374571, 16a, 16d, 16e and 16g, the 2,5,6-triamino-3H-pyrimidin-4-one headgroup of these inhibitors was observed to form an extensive hydrogen bond network with MTHFD2 (Figure 2). The NH2 group at the sixth position of the triaminopyrimidine group was hydrogen bonded with the carboxy group of Leu133’s main chain. Additionally, it participated in a water-bridged hydrogen bond network with the side chains of Ser81 and Gln132, along with the main chain of Leu133. Modification of the NH2 group, either through its removal (16j) or substitution with a hydroxy group (16i), resulted in a significant decrease in inhibitory activity against MTHFD2. These results highlight the significant contribution of the NH2 group and its interaction network with surrounding residues to the compound’s potency.
Furthermore, the NH2 group at the second position of the triaminopyrimidine group formed hydrogen bonds with the main chain carboxyl group of Val131 and the side chain of Asp155. Removal of this NH2 group (16l) led to a drastic reduction in inhibitory activity against MTHFD2 by more than 100-fold. Moreover, introducing oxygen substitution to this NH2 group (16k) resulted in the complete loss of inhibitory activity toward MTHFD2. This substitution disrupted the strong hydrogen bond network formed with Val131 and Asp155, emphasizing the important role of this hydrogen bond network in the compound’s potency. The molecular modifications and structural biology study offer valuable insights into the intricate interplay of specific functional groups and their consequential influence on the interaction with MTHFD2.
Elucidation of the Selectivity of Diaminopyrimidine-Based Derivatives by Structure Biology Studies
The analysis of compounds in Table 1 reveals distinctive selectivity patterns toward MTHFD2 compared to MTHFD1. Notably, among these compounds, 16d and 16e demonstrate higher selectivity with selectivity index (SI) values of 38.5 and 27.1, respectively.
To investigate the molecular basis of the selectivity toward MTHFD2 over MTHFD1, cocrystal structures of human MTHFD1 were determined in complex with 16a, 16d, 16e, 16g, and LY374571 in the presence of NADP+, with resolutions ranging from 1.99 to 2.50 Å (Table 3).
Table 3. X-ray Data and Structure Refinement for MTHFD1 Complex Structures.
| MTHFD1/LY374571 | MTHFD1/16a | MTHFD1/16d | MTHFD1/16e | MTHFD1/16g | |
|---|---|---|---|---|---|
| resolution | 27.48–1.99 | 26.21–2.28 | 29.89–2.09 | 29.69–2.06 | 30.00–2.50 |
| space group | C2221 | C2221 | C2221 | C2221 | C2221 |
| unit cell (α = β = γ = 90°) a (Å) | 64.973 | 65.296 | 64.997 | 65.020 | 65.075 |
| b (Å) | 200.316 | 200.343 | 200.275 | 200.679 | 201.469 |
| c (Å) | 240.327 | 239.744 | 239.040 | 240.140 | 240.021 |
| unique reflections | 107841(10612) | 72711 (7153) | 93029 (9214) | 97306 (9593) | 55064 (5002) |
| I/σ | 16.72 (2.03) | 15.02 (2.02) | 17.35 (2.05) | 19.31 (2.02) | 16.31 (2.22) |
| Rmerge (%) | 6.4 (60.9) | 8.5 (58.4) | 6.3 (61.0) | 5.7 (62.5) | 10.2 (92.6) |
| completeness (%) | 98.9 (99.6) | 99.4 (99.6) | 99.3 (100.0) | 98.9 (100.0) | 96.3 (92.5) |
| Rwork/Rfree | 0.2006/0.2415 | 0.2368/0.2993 | 0.2110/0.2589 | 0.2064/0.2502 | 0.2128/0.2637 |
| rmsd (bond) (Å) | 0.016 | 0.010 | 0.008 | 0.008 | 0.009 |
| rmsd (angle) (deg) | 1.092 | 1.048 | 1.012 | 1.010 | 1.137 |
| Ramachandran favored (%) | 98.23 | 96.57 | 97.45 | 97.35 | 97.17 |
Superimposition of the MTHFD1/16e complex structure with MTHFD1/LY374571 complex structure uncovered several differences between them (Figure 4). First, in the structure of MTHFD1/LY374571, the nicotinamide group of NADP+ was hydrogen bonded with the NH2 moiety of the triaminopyrimidine headgroup of LY374571. However, the addition of a chloride substituent on the phenyl ring in 16e induced a clash with the nicotinamide group of NADP+, leading to the shift of the nicotinamide group of NADP+ away from the triaminopyrimidine headgroup of 16e and the consequent loss of the hydrogen bond between 16e and NADP+ (Figure 4A) Instead, NADP+ in MTHFD1/16e structure was found to be hydrogen bonded with the side chain of Thr279. Second, in comparison with the MTHFD1/LY374571 structure, it was observed that the addition of the chloride atom in 16e led to the rotation of the phenyl ring by approximately 26°, accompanied by the movement of the γ-carboxylic acid away from β strand h1 (Figure 4B). Moreover, the electron density of the γ-carboxylic acid in 16e is weaker than that observed in LY374571. The shift of γ-carboxylic acid in 16e resulted in the loss of the van der Waals interactions with Leu51, Tyr52 and Tyr240. These effects collectively contributed to the weaker inhibitory activity of 16e toward MTHFD1 and consequently improved its selectivity to MTHFD2, as shown by the increase in the selectivity index from 7.9 to 27.1 compared with LY374571. Moreover, 16d, which substituted the same position with a methyl group, similarly induced rotation of the phenyl ring and movement of the γ-carboxylic acid. Furthermore, as revealed in the structure of MTHFD1/16d, the density map of the nicotinamide group of NADP+ and the glutamic acid group appeared more unclear, indicating the flexibility and instability of NADP+ and the glutamic acid moiety of 16d. This instability reflected on the much weaker inhibitory activity of 16d against MTHFD1.
Figure 4.

Superimposition of the crystal structure of MTHFD1/16e/NADP+ (PDB 9ISL, wheat/darksalmon/yellow-orange) on MTHFD1/LY374571/NADP+ (PDB 9ISE, forest/cyan/slate) or MTHFD1/16g/NADP+ (PDB 9ISR, deep purple/magenta). Hydrogen-bonds are shown in red dashed lines. (A) The presence of the chloride atom on the phenyl ring of compound 16e induced the rotation of the nicotinamide group of NADP+. Additionally, the introduction of the chloride atom resulted in rotational adjustments of the phenyl ring and caused the γ-carboxylic acid to move away from β strand h1. (B) The shift of the γ-carboxylic acid in 16e results in the loss or decrease of hydrophobic and van der Waals interactions with Leu51, Tyr52, and Tyr240. (C) The 1H-tetrazole moiety of 16g shifted toward β strand h1 and was hydrogen bonded with Tyr240. For clarity, the NADP+ is omitted in the figure.
In contrast, compound 16a and 16g, featuring 1H-tetrazole moiety substitution at the γ-carboxylic acid of glutamic acid, exhibited potent inhibition against MTHFD1. In comparison with the structure of MTHFD1/16e, the structure of MTHFD1/16g revealed that the 1H-tetrazole moiety shifted toward β strand h1 and was hydrogen bonded with Tyr240 (Figure 4C). Moreover, the larger size of the 1H-tetrazole moiety relative to the carboxylic acid group, in conjunction with its interaction with Tyr240, promoted a movement toward β strand h1 and therefore formed van der Waals interactions with Val252 and Leu51. These structural changes facilitated an interaction network that increased the binding affinity of 16g with MTHFD1. As a result, 16g demonstrated potent inhibitory effects on MTHFD1, hence exhibiting reduced selectivity toward MTHFD2.
The superimposition of MTHFD1/16g and MTHFD2/16g revealed that the triaminopyrimidine headgroup, urea linker, and central phenyl ring of compound 16g aligned well in both structures. The important interactions between the headgroup and urea linker of 16g with residues Val131, Gln132, Leu133, Asp155, and Lys88 in MTHFD2 were retained in MTHFD1, where they corresponded to Val99, Gln100, Leu101, Asp125, and Lys56. Moreover, the π–π interactions between the central phenyl ring of 16g and Tyr84 in MTHFD2 were similarly maintained in MTHFD1 with Tyr52 (Figure 5A). The 1H-tetrazole moiety of 16g was positioned toward β strand h1 in both structures and interacted with the surrounding residues.
Figure 5.

(A,B) Superimposition of the crystal structures of MTHFD2/16g/NAD+ (PDB 9IT6, light blue/light orange) with MTHFD1/16g/NADP+ (PDB 9ISR, deep purple/magenta) (C) Superimposition of the crystal structures of MTHFD2/16e/NAD+ (PDB 9IT3, light pink/orange) with MTHFD1/16e/NADP+ (PDB 9ISL, wheat/darksalmon). NAD+ or NADP+ is omitted for clarity. Hydrogen bonds between compound and MTHFD2 are shown as red dashed lines, while those with MTHFD1 are depicted as deep teal dashed lines. Residues in MTHFD1 are indicated in parentheses.
The differences between these two structures were attributed to the residue substitutions from Ser83 and Asn87 in MTHFD2 to Leu51 and Val55 in MTHFD1. These hydrophobic residue replacements in MTHFD1 prevented the formation of hydrogen bonds with the amide or 1H-tetrazole moiety of 16g. Instead, a hydrogen bond was formed between the 1H-tetrazole moiety and Tyr240 in MTHFD1 (Figure 5B).
In comparison, the superimposition of MTHFD1/16e and MTHFD2/16e revealed notable differences in the tail region of the inhibitor. The γ-carboxylic acid of 16e adopted different conformations in MTHFD1 and MTHFD2. In the MTHFD2/16e structure, the γ-carboxylic acid was positioned toward β strand h1, forming hydrogen bonds with Ser83 and hydrophobic interactions with Tyr84 and Leu289. However, in the MTHFD1/16e structure, the γ-carboxylic acid moiety shifted away, leading to the loss of these interactions (Figure 5C). This shift resulted in a weaker binding affinity of 16e toward MTHFD1 compared to MTHFD2, as reflected by a higher selectivity of 16e for MTHFD2 (SI = 27.1).
Using LY374571 as A Reference Compound to Identify Optimal Cell Models for Evaluating MTHFD2 Inhibitors
Due to promising enzymatic activity demonstrated by diaminopyrimidine-based analogues, further analysis is required to evaluate their potential in inhibiting cancer cell growth. In order to identify the optimal cell model for assessing MTHFD2 inhibitors, LY374571 served as a reference compound to evaluate its inhibitory effect on cell growth across a panel of hematological and solid tumor cells. After 72 h of treatment with 20 μM LY374571, hematological tumor cells demonstrated greater growth inhibition efficacy compared to solid tumor cells (Figure 6A). Subsequently, the four most sensitive cell lines- MOLM-13, MOLM-14, HL-60, and CCRF-CEM cells were selected for investigating the growth inhibitory effect of LY374571. Among them, MOLM-13 and MOLM-14, both acute myeloid leukemia (AML) cells with FLT3 internal tandem duplication (FLT3-ITD) mutations,14,34 exhibited heightened sensitivity to LY374571 compared to HL-60 (an AML cell line with wild type FLT3) and CCRF-CEM (an acute lymphoblastic leukemia cell line) (Figure 6B).
Figure 6.

Using LY374571 as a reference compound to identify optimal cell models for evaluating MTHFD2 inhibitors. (A) The efficacy of LY374571 on cell growth inhibition in multiple hematological tumor cells and solid tumor cells. Cell viability was examined by MTT assay (hematological tumor cells) and methylene blue staining assay (solid tumor cells), respectively, after drug treatment for 72 h. In the experiment, the number of cells in the control group is set to 100%. The number of cells treated with 20 μM LY374571 is expressed as a percentage of cell viability relative to the control group. (B) Comparison of the efficacy of LY374571 on cell growth inhibition with increasing drug concentration for 72 h in MOLM-13 and MOLM-14 cells (upper panel) and HL-60 and CCRF-CEM (lower panel). Data was from three independent experiments and shown as means ± SD.
FLT3, a member of the class III receptor tyrosine kinase family, is abundantly expressed in hematopoietic cells35 and plays a key role in cell survival, proliferation, and differentiation.36 In acute myeloid leukemia (AML) patients, FLT3-ITD mutations result in a gain-of-function of the receptor.37 While the exact mechanism underlying the heightened sensitivity of FLT3-ITD AML cells to MTHFD2 inhibitors remains unclear, one possible explanation is the significantly increased production of reactive oxygen species (ROS) in FLT3-ITD AML cells,38,39 which raises the demand for NAD(P)H to support antioxidant defenses. One-carbon metabolism contributes approximately 40% of NAD(P)H production,40 and MTHFD2 plays a key role in maintaining redox homeostasis.41,42 Furthermore, FLT3-ITD-driven leukemias rely on serine for both proliferation and survival, upregulating serine biosynthesis and one-carbon metabolism enzymes, including MTHFD2.43 This increased need for antioxidant activity and dependence on serine metabolism likely enhances the sensitivity of FLT3-ITD AML cells to MTHFD2 inhibition.
Furthermore, the MOLM-14 cell line showed greater sensitivity to LY374571-mediated growth inhibition than MOLM-13, with respective GI50 values of 630 ± 30 and 830 ± 130 nM. Therefore, MOLM-14 was selected as the optimal model for subsequent investigations based on its pronounced sensitivity to LY374571.
In the study by Pikman et al., an analysis of gene expression databases from AML patients revealed that genes related to the one-carbon pathway were highly expressed, particularly in the AML FLT3-ITD mutation group.14 The authors explored MTHFD2 as a potential therapeutic target for AML using MTHFD2 knockdown approaches; however, they did not validate their findings with small-molecule MTHFD2 inhibitors. Therefore, combining the insights from this previous study14 with the results of our research provides robust information for optimizing the cell screening platform for MTHFD2 inhibitors.
The Degree of Inhibition of MTHFD1 and MTHFD2 Enzymatic Activities by the Compounds Correlates with Their Ability to Inhibit MOLM-14 Cell Growth
The compounds 16a and 16g demonstrate relatively strong inhibition of both MTHFD1 and MTHFD2 (Table 1) and significantly inhibit MOLM-14 cell growth (Table 4). The extent of their inhibition against MTHFD1 and MTHFD2 enzymatic activities correlates with their efficacy in inhibiting MOLM-14 cell growth (Table 4). Both MTHFD1 and MTHFD2 play pivotal roles in one-carbon metabolism, but their distinct expression profiles may lead to significantly different outcomes upon inhibition.1 MTHFD1 functions as a housekeeping gene and is widely expressed across various tissues.1,44 MTHFD1 is a critical enzyme in normal cells for maintaining normal cellular metabolism, supporting functions such as cell division, growth, and repair.21,44 In contrast, MTHFD2 is predominantly expressed in embryonic and transformed cells, with minimal or absent expression in most adult differentiated tissues.4,45
Table 4. Analysis of the Ability of Diaminopyrimidine Derivatives to Inhibit the Growth of MOLM-14 Cells and Comparison with IC50 and Selectivity Index of MTHFD1/2.
| ID | MOLM-14, GI50 (nM) | enzyme-based assay |
||
|---|---|---|---|---|
| MTHFD1 IC50 (nM) | MTHFD2 IC50 (nM) | SI | ||
| LY374571 | 630 ± 30 | 630 ± 60 | 80 ± 10 | 7.9 |
| 16a | 20 ± 10 | 120 ± 0 | 22 ± 4 | 5.5 |
| 16b | 810 ± 110 | 380 ± 10 | 150 ± 20 | 2.5 |
| 16c | 590 ± 110 | 790 ± 60 | 910 ± 110 | 0.87 |
| 16d | 893 ± 8 | 5160 ± 1170 | 134 ± 30 | 38.5 |
| 16e | 720 ± 20 | 1790 ± 100 | 66 ± 13 | 27.1 |
| 16f | 780 ± 210 | 590 ± 30 | 90 ± 5 | 6.6 |
| 16g | 120 ± 60 | 230 ± 0 | 40 ± 10 | 5.8 |
| 16h | 5740 ± 930 | 4140 ± 200 | 470 ± 30 | 8.8 |
| 16j | >20000 | 2200 ± 760 | 530 ± 110 | 4.2 |
| 16l | 5490 ± 770 | >10000 | 8330 ± 2190 | |
The critical role of MTHFD1 in cellular function is evident from studies showing that homozygous knockout mutations in Mthfd1 result in embryonic lethality in mice.46,47 Additionally, several reports link MTHFD1 deficiency to severe combined immunodeficiency (SCID) in patients.48−52 Along with the variable phenotypes of SCID, MTHFD1 deficiency presents a spectrum of clinical conditions, including megaloblastic anemia, atypical hemolytic uremic syndrome, anisocytosis, autoimmune diseases, and microangiopathy. Notably, patients with pathogenic MTHFD1 variants exhibited MTHFD1 protein levels at approximately 5–50% of controls, and the enzyme’s dehydrogenase activity was nearly undetectable.53
Given these findings, compounds targeting MTHFD1 may pose substantial risks for adverse effects. In contrast, compounds with higher specificity for MTHFD2 offer the potential for a broader therapeutic window, minimizing toxicity and reducing the likelihood of side effects. Therefore, compounds with high selectivity for MTHFD2, such as 16d and 16e, emerge as more promising compounds for advancement (Table 1). These compounds demonstrate significant selectivity for MTHFD2 and despite their moderate inhibition of cell growth (Table 4), they show potential as therapeutic agents with potentially reduced side effects. Furthermore, comparing the inhibitory activity of MTHFD2 and cell growth inhibition, 16e is superior to 16d. Compound 16e has a lower IC50 value against MTHFD2 (Table 1) and demonstrated cell growth inhibition in AML MOLM-14 cells (Table 4 and Figure S3), while showing no effect on normal cells (Figure S3), these finding making it a more promising compound for further pharmacokinetic studies and in vivo efficacy assessments.
Compounds 16a and 16e Produce Synergistic Effects in MOLM-14 Cells in Combination with Alimta
Alimta (Pemetrexed) is a clinically used antifolate chemotherapy drug that targets several key enzymes involved in one-carbon metabolism, including thymidylate synthase (TS), dihydrofolate reductase (DHFR), and glycinamide ribonucleotide formyltransferase (GARFT).54 One-carbon metabolism is crucial for the synthesis of purines and thymidine, which are necessary for DNA replication and repair. We hypothesized that a more comprehensive inhibition of one-carbon metabolism could produce a stronger synergistic anticancer effect. Therefore, the combined effects of the newly developed MTHFD2 inhibitors 16a and 16e with Alimta were investigated in combination experiments. Heatmaps illustrate the cell viability percentages of MOLM-14 cells treated with increasing concentrations of Alimta alongside compound 16a (Figure 7A), compound 16e (Figure 7D), or reference compound LY374571 (Figure 7G). All combinations significantly reduced cell viability compared to individual treatments (Figure 7B,E,H). Combination Index (CI) plots further revealed the interaction between Alimta and 16a, 16e, or LY374571. A CI value less than 1 indicates synergistic effect. The CI between Alimta and 16a is 0.77 ± 0.11 (Figure 7C), between Alimta and 16e is 0.80 ± 0.09 (Figure 7F), and between Alimta and LY374571 is 0.84 ± 0.10 (Figure 7I), suggesting a synergistic interaction in all cases.
Figure 7.

Investigation of combination benefits of Alimta with MTHFD2 inhibitors in MOLM-14 cells. MOLM-14 cells were treated with Alimta and MTHFD2 inhibitors (16a, 16e, or LY374571) alone or in combination for 72 h. Cell viability was evaluated by MTT assay and displayed by heatmap (A,D,G). Cell viability is expressed as a percentage relative to the control group, with red indicating higher viability and green indicating lower viability. Bar graphs illustrate cell viability after treatment with Alimta and compound 16a (B), 16e (E), or LY374571 (H). The results are presented as mean ± standard deviation (SD), and statistical significance is indicated by an asterisk (*), p < 0.05. combination index (CI) plot for Alimta with compound 16a (C), 16e (F), or LY374571 (I). The CI values were calculated by CalCusyn software to evaluate the synergistic effect of the two compounds. A CI value less than 1 indicates synergy, a CI value equal to 1 indicates an additive effect, and a CI value greater than 1 indicates antagonism.
Pharmacokinetic Profiles of 16e and LY374571 Following Intravenous Administration in Mice
Due to its potent enzymatic inhibition, high selectivity for MTHFD2, and effective cell growth inhibition, compound 16e emerges as a promising compound for further pharmacokinetic investigation. LY374571 was included in the study for comparative analysis. The pharmacokinetic parameters of LY374571 and 16e were assessed following a single intravenous dose of 2 mg/kg. LY374571 exhibited a half-life (T1/2) of 1.6 h, a clearance (CL) of 70.7 mL/min/kg, a volume of distribution at steady state (Vss) of 14.7 L/kg and the AUC0-inf of 542 ng/mL × h. In comparison, compound 16e demonstrated a longer half-life (T1/2) of 6.5 h, a much lower CL of 12.3 mL/min/kg, and a significantly smaller volume of distribution at steady state (Vss) of 0.6 L/kg. The AUC0-inf was notably higher at 2702 ng/mL × h. These results suggest that 16e has a longer systemic exposure and lower clearance compared to LY374571, indicating its prolonged presence in the body and slower elimination (Table 5). Therefore, compound 16e exhibits a more favorable pharmacokinetic profile.
Table 5. Pharmacokinetic Profiles of LY374571 and 16e.
| compound | IV (dose: 2 mg/kg) |
|||
|---|---|---|---|---|
| T1/2 (hr) | CL (mL/min/kg) | Vss (l/kg) | AUC(0-inf) (ng/mL× h) | |
| LY374571 | 1.6 | 70.7 | 14.7 | 542 |
| 16e | 6.5 | 12.3 | 0.6 | 2702 |
In Vivo Anticancer Efficacy of 16e and LY374571 in MOLM-14 Xenograft Tumor Model
In this study, the effects of LY374571 and 16e on tumor growth and body weight were investigated using the MOLM-14 xenograft model. MOLM14-bearing mice were treated with 10 mg/kg LY374571 and 15 mg/kg 16e, respectively. These doses were selected based on the maximum solubility of each compound in the intravenous (i.v.) vehicle solution. LY374571 exhibited minimal antitumor activity, with a tumor growth inhibition (TGI) of 8.8% on day 12 (Figure 8A). Notably, the anticancer efficacy of 16e was significantly effective from day 7 (TGI 75.7%) to day 14 (TGI 57.4%) (Figure 8C). Day 14 after drug administration, the vehicle-treated group (n = 7) exhibited a mean tumor volume of approximately 1307 mm3, with individual tumor volumes ranging from around 825 to 1550 mm3. In contrast, the group treated with 15 mg/kg of 16e (n = 7) showed a significantly lower mean tumor volume of about 598 mm3, with individual tumor volumes ranging from approximately 245 to 1237 mm3 (Figure 8E). Notably, neither LY374571 nor 16e treatment resulted in significant change in the body weight of the mice throughout the study period (Figure 8B,D). These results highlight the substantial effect of compound 16e in reducing tumor growth, further supporting its potential as a therapeutic agent in cancer treatment.
Figure 8.

In vivo antitumor efficacy of MTHFD2 inhibitors in MOLM-14 xenograft mouse model. MOLM-14 cells were subcutaneously implanted into NOD SCID mice and the tumor-bearing mice were treated with LY374571 (10 mg/kg, intravenously injected, QD, 2 cycles of 5-on/2-off). Tumor volume (A) and body weight (B) were measured twice weekly. MOLM-14 cells were subcutaneously implanted into NOD SCID mice and the tumor-bearing mice were treated with the compound 16e (15 mg/kg, intravenously injected, QD). Tumor volume (C) and body weight (D) were measured twice weekly. (E) Tumor volumes of mice treated with vehicle or compound 16e on day 14 after drug administration. Each point represents the tumor volume of an individual mouse (n = 7 per group). The data are presented as mean ± standard deviation (SD). Statistical significance between the vehicle-treated group and the 16e-treated group is indicated by double asterisks (**), p < 0.01.
Conclusions
In this study, selective 2,4-diamino-6-oxo-1,6-dihydropyrimidin-5-yl ureido based MTHFD2 inhibitors were identified through systematic chemical structural modification and SAR studies. The lead optimization strategy outlined in Table 1 demonstrates several key findings: (1) glutamic acid is preferred as the terminal amino acid moiety, (2) the γ-carboxyl group of glutamic acid could be substituted with an acid bioisostere such as 1H-tetrazole, (3) the amide moiety at the 1-position and the urea linker at the 4-position of the central phenyl ring are important functional groups, and (4) modifications of the diaminopyrimidine headgroup result in a significant loss of potency. Furthermore, structural biology investigations provide detailed insights into the molecular mechanisms governing their specificity toward MTHFD2. Comparative analysis of the structures of MTHFD2 complexed with 2,4-diaminopyrimidine-based derivatives and those of MTHFD1 revealed that additional substituents on the phenyl ring of inhibitors significantly altered binding interactions, including a shift in the nicotinamide group of NADP+ and disruption of important hydrogen bonds with cofactors in MTHFD1. Furthermore, these substituents induced conformational changes in the phenyl ring and γ-carboxylic acid, resulting in weaker inhibitory activity against MTHFD1 and enhanced selectivity for MTHFD2. Conversely, substitutions with larger moieties in the tail group prompted movements toward β strand h1 to form interactions with MTHFD1, leading to increased inhibitory activity against MTHFD1 and reduced selectivity for MTHFD2. In conclusion, our study reveals the important role of substitutions in the phenyl ring and tail group in modulating the potency and selectivity toward MTHFD2 within the diaminopyrimidine series. These findings highlight the potential for achieving enhanced potency and selectivity toward MTHFD2 through chemical modifications in these specific structural moieties.
Moreover, this study pioneered the establishment of a comprehensive cell screening platform for MTHFD2 inhibitors using a diverse panel of leukemia and solid tumor cell lines. Notably, acute myeloid leukemia (AML) cells harboring FLT3-ITD mutations exhibited particularly favorable responses to these inhibitors. Additionally, synergistic effects were observed when potential compounds were combined with Alimta. Through a combination of medicinal chemistry, structural biology, and comprehensive in vitro and in vivo bioactivity assays, compound 16e emerged as a promising candidate, demonstrating superior inhibitory activity and specificity for MTHFD2. Compound 16e also showed favorable pharmacokinetic profiles and exhibited potent antitumor efficacy in MOLM-14 xenograft models. These findings not only contribute to the understanding of MTHFD2-specific inhibition mechanisms but also underscore the potential therapeutic implications for cancers treatment by targeting MTHFD2.
Experiment Section
Chemistry Methods
All commercial chemicals and solvents are reagent grade and were used without further treatment unless otherwise noted. 1H NMR spectra were obtained with a Varian Mercury-300, a Varian Mercury-400 or a Bruker Advance Neo 600 spectrometer. Chemical shifts were recorded in parts per million (ppm, δ) and were reported relative to the solvent peak or TMS. LC/MS data were measured on an Agilent MSD-1100 ESI-MS/MS System. High-resolution mass spectra (HRMS) were measured with a Thermo Finnigan (TSQ Quantum) electrospray ionization (ESI) mass spectrometer. Flash column chromatography was done using silica gel (Merck Kieselgel 60, no. 9385, 230–400 mesh ASTM). Reactions were monitored by TLC using Merck 60 F254 silica gel glass backed plates (5 × 10 cm); zones were detected visually under ultraviolet irradiation (254 nm) or by spraying with phosphomolybdic acid reagent (Aldrich) followed by heating at 80 °C. All starting materials and amines were commercially available unless otherwise indicated. The purity of compounds was determined by a Hitachi 2000 series HPLC system and a Waters Acquity UPLC/BSM with PhotoDiode Array detector. Purity of all target compounds shown in Table 1 was over 95% based on a reverse phase C18 column (Agilent ZORBAX Eclipse XDB-C18 5 μm, 4.6 mm × 150 mm) under the following gradient elution conditions: Mobile phase A-acetonitrile (10 to 90%, 0 to 45 min) and mobile phase B-2 mM NH4OAc aqueous solution containing 0.1% formic acid (90 to 10%, 0 to 60 min). The flow-rate was 0.5 mL/min and the injection volume was 20 μL. The system operated at 25 °C. Peaks were detected at λ = 254 nm.
General Procedure for the Preparation of Compounds 11 and 13
Targeted compound 11 and intermediate 13 were synthesized according to the literature report.31 Representative compounds 11 and 13i (a key intermediate to 16i) are selected to show their NMR and mass data.
1-(2,4-Diamino-6-oxo-1,6-dihydropyrimidin-5-yl)-3-(4-nitrophenyl)urea (11)
1H NMR (400 MHz, DMSO-d6): δ 9.98 (s, 1H), 9.28 (s, 1H), 8.14 (d, J = 9.2 Hz, 2H), 7.68 (d, J = 8.8 Hz, 2H), 6.87 (s, 1H), 6.16 (s, 2H), 5.91 (s, 2H). MS (ES+) m/z: calcd for C11H11N7O4, 305.1, found, 306.1 (M + H)+.
4-{[(2-Amino-4-hydroxy-6-oxo-1,6-dihydropyrimidin-5-yl)carbamoyl]amino}benzoic Acid (13i)
1H NMR (400 MHz, DMSO-d6): δ 11.31 (s, 2H), 8.91 (s, 1H), 7.81 (d, J = 8.8 Hz, 2H), 7.52 (d, J = 8.7 Hz, 2H), 6.80 (s, 1H), 6.67 (s, 2H); MS (ES+) m/z: calcd for C12H11N5O5, 305.1; found, 306.1 (M + H)+.
Targeted compounds 16, 19 and 23 were prepared following the previous publication with some modifications.24,31 To a solution of 13 (1.0 equiv) in dry DMSO at room temperature was added HOSu (2 equiv) and EDC HCl (2 equiv) and the resultant mixture was stirred at room temperature for 3–4 h. The reaction mixture was added amine 14 or 15 (4.0 equiv). After stirring at room temperature overnight, the solvent DMSO were removed under reduced pressure and the residue was washed with water and MeOH to yield intermediate ester. The ester (1.0 equiv) was suspended in water and added 1 M NaOH solution (2–4 equiv). The reaction was stirred at room temperature for 1–2 h. 1 M HCl was added until pH ∼ 2 and the product was collected by filtration. The crude product was washed with water and MeOH. The resultant solid was collected by filtration and dried in vacuo or was further purified by SiliaBondR C18 (17%) eluted with 0–20% MeOH in water containing 0.1% formic acid or trifluoroacetic acid to yield desired diacid or monoacid 16.
(2S)-2-[(4-{[(2,4-Diamino-6-oxo-1,6-dihydropyrimidin-5-yl)carbamoyl]amino}benzoyl)amino]-4-(1H-tetrazol-5-yl)butanoic Acid (16a)
1H NMR (400 MHz, DMSO-d6): δ 10.00 (s, 1H), 8.83 (s, 1H), 8.52 (d, J = 7.6 Hz, 1H), 7.80 (d, J = 8.8 Hz, 2H), 7.52 (d, J = 8.8 Hz, 2H), 6.73 (s, 1H), 6.16 (s, 2H), 5.88 (s, 2H), 4.43–4.38 (m, 1H), 2.98 (t, J = 7.7 Hz, 2H), 2.33–2.29 (m, 1H), 2.23–2.14 (m, 1H); 13C NMR (150 MHz, DMSO-d6): δ 173.50, 166.21, 161.75, 160.30, 155.93, 154.73, 153.34, 143.65, 128. 37, 126.10, 116.57, 89.36, 52.07, 28.54, 20.31; MS (ES+) m/z: calcd for C17H20N11O5, 458.2; found, 458.1 (M + H)+; HRMS (ESI–): calcd for C17H18N11O5, 456.1492; found, 456.1492 (M – H)−; UPLC tR = 6.82 min, 97.5%.
4-{[(2,4-Diamino-6-oxo-1,6-dihydropyrimidin-5-yl)carbamoyl]amino}-N-[(1S)-1,3-di(1H-tetrazol-5-yl)propyl]benzamide (16b)
1H NMR (400 MHz, DMSO-d6): δ 9.97 (br s, 1H), 8.86 (d, J = 8.0 Hz,, 1H), 8.85 (br s, 1H), 7.82 (d, J = 8.0 Hz,, 2H), 7.53 (d, J = 8.0 Hz, 2H), 6.71 (s, 1H), 6.14 (s, 2H), 5.87 (s, 2H), 5.49–5.43 (m, 1H), 3.05–3.01 (m, 2H), 2.60–2.40 (m, 2H); 13C NMR (100 MHz, DMSO-d6): δ 166.02, 161.69, 160.30, 158.27, 155.56, 154.70, 153.32, 143.74, 128.52, 125.89, 116.62, 89.36, 44.19, 30.60, 19.81; MS (ES+) m/z: calcd for C17H20N15O3, 482.2; found, 482.4 (M + H)+; HRMS (ESI–): calcd for C17H18N15O3, 480.1717; found, 480.1714 (M – H)−; UPLC tR = 5.02 min, 96.9%.
N-2-(4-{[(2,4-Diamino-6-oxo-1,6-dihydropyrimidin-5-yl)carbamoyl]amino}benzoyl)-l-glutamine (16c)
1H NMR (400 MHz, DMSO-d6): δ 8.84 (br s, 1H), 8.48 (d, J = 6.8 Hz, 1H), 7.80 (d, J = 8.8 Hz, 2H), 7.52 (d, J = 8.4 Hz, 2H), 7.32 (s, 1H), 6.82 (br s, 4H), 6.33 (br s, 1H), 4.32 (br s, 1H), 2.21 (m, 2H), 2.07 (m, 1H), 1.94 (m, 1H); 13C NMR (150 MHz, DMSO-d6): δ 173.89, 173.80, 166.09, 161.71, 160.28, 154.74, 153.34, 143.59, 128.32, 126.18, 116.66, 89.37, 52.41, 31.63, 26.26; MS (ES+) m/z: calcd for C17H21N8O6, 433.2, found, 433.1 (M + H)+; HRMS (ESI–): calcd for C17H19N8O6, 431.1428; found, 431.1429 (M – H)−; UPLC tR = 6.71 min, 95.0%.
N-(4-{[(2,4-Diamino-6-oxo-1,6-dihydropyrimidin-5-yl)carbamoyl]amino}-3-methylbenzoyl)-l-glutamic Acid (16d)
1H NMR (600 MHz, DMSO-d6): δ 12.39 (br s, 2H), 8.39 (d, J = 6.6 Hz, 1H), 8.02 (br d, J = 25.2 Hz, 2H), 7.70 (s, 1H), 7.66 (d, J = 7.8 Hz, 1H), 7.38 (s, 1H), 6.91 (s, 2H), 6.42 (s, 2H), 4.38 (s, 1H), 2.34 (s, 2H), 2.26 (s, 3H), 2.08 (br s, 1H), 1.94 (br s, 1H); 13C NMR (150 MHz, DMSO-d6): δ 174.03, 173.73, 166.43, 161.18, 160.38, 154.71, 153.22, 141.51, 129.57, 126.38, 125.84, 125.01, 118.19, 89.48, 51.92, 30.51, 26.02, 17.93; MS (ES+) m/z: calcd for C18H22N7O7, 448.2; found, 448.1 (M + H)+; HRMS (ESI–): calcd for C18H20N7O7, 446.1424; found, 446.1427 (M – H)−; UPLC tR = 4.62 min, 96.4%.
N-(3-Chloro-4-{[(2,4-diamino-6-oxo-1,6-dihydropyrimidin-5-yl)carbamoyl]amino}benzoyl)-l-glutamic Acid (16e)
1H NMR (400 MHz, DMSO-d6): δ 12.38 (br s, 2H), 10.02 (br s, 1H), 8.54 (d, J = 8.0 Hz, 1H), 8.36 (d, J = 8.0 Hz, 1H), 8.30 (br s, 1H), 7.97 (d, J = 4.0 Hz, 1H), 7.78 (dd, J = 8.0, 4.0 Hz, 1H), 7.68 (br s, 1H), 6.18 (br s, 2H), 5.97 (br s, 2H), 4.42–4.30 (m, 1H), 2.34 (t, J = 8.0 Hz, 2H), 2.14–2.00 (m, 1H), 2.00–1.86 (m, 1H); 13C NMR (150 MHz, DMSO-d6): δ 173.88, 173.46, 164.96, 161.55, 160.18, 154.15, 153.38, 139.65, 128.28, 127.09, 126.99, 119.86, 118.60, 88.90, 51.99, 30.43, 25.92; MS (ES+) m/z: calcd for C17H19ClN7O7, 468.1; found, 468.1 (M + H)+; HRMS (ESI–): calcd for C17H17ClN7O7, 466.0878; found, 466.0878 (M – H)−; UPLC tR = 5.90 min, 96.3%.
N-(4-{[(2,4-Diamino-6-oxo-1,6-dihydropyrimidin-5-yl)carbamoyl]amino}-3-fluorobenzoyl)-l-glutamic Acid (16f)
1H NMR (400 MHz, DMSO-d6): δ 8.77 (s, 1H), 8.53 (d, J = 4.0 Hz,, 1H), 8.26 (t, J = 8.0 Hz,, 1H), 7.74 (d, J = 8.0 Hz, 1H), 7.69 (d, J = 4.0 Hz, 1H), 7.40 (s, 1H), 6.95 (br s, 1H), 6.45 (br s, 1H), 4.41–4.32 (m, 1H), 2.35 (t, J = 4.0 Hz, 2H), 2.13–2.03 (m, 1H), 1.99–1.89 (m, 1H); 13C NMR (150 MHz, DMSO-d6): δ 173.91, 173.48, 165.12, 159.99, 154.13, 152.52, 151.42, 149.82, 131.51 (d, J = 10.5 Hz), 126.56, 124.07, 118.58, 114.00 (d, J = 21 Hz), 88.95, 52.02, 30.45, 25.93; MS (ES+) m/z: calcd for C17H19FN7O7, 452.1, found, 452.4 (M + H)+; HRMS (ESI–): calcd for C17H17FN7O7, 450.1174; found, 450.1175 (M – H)−; UPLC tR = 5.13 min, 98.2%.
(2S)-2-[(3-Chloro-4-{[(2,4-diamino-6-oxo-1,6-dihydropyrimidin-5-yl)carbamoyl]amino}benzoyl)amino]-4-(1H-tetrazol-5-yl)butanoic Acid (16g)
1H NMR (400 MHz, DMSO-d6): δ 10.03 (br s, 1H), 8.68 (d, J = 4.0 Hz, 1H), 8.38 (d, J = 8.0 Hz, 1H), 8.31 (br s, 1H), 7.98 (d, J = 4.0 Hz, 1H), 7.79 (dd, J = 8.0, 4.0 Hz, 1H), 7.69 (br s, 1H), 6.19 (br s, 2H), 5.99 (br s, 2H), 4.43–4.38 (m, 1H), 3.00 (t, J = 8.0 Hz, 2H), 2.35–2.30 (m, 1H), 2.23–2.16 (m, 1H); 13C NMR (150 MHz, DMSO-d6): δ 173.31, 164.94, 161.76, 160.20, 156.20, 154.16, 153.44, 139.64, 128.29, 127.06, 119.89, 118.62, 88.89, 52.28, 28.59, 20.44; MS (ES+) m/z: calcd for C17H19ClN11O5, 492.1, found, 492.2 (M + H)+; HRMS (ESI–): calcd for C17H17ClN11O5, 490.1103; found, 490.1102 (M – H)−; UPLC tR = 6.14 min, 96.9%.
N-[(6-{[(2,4-Diamino-6-oxo-1,6-dihydropyrimidin-5-yl)carbamoyl]amino}pyridin-3-yl)carbonyl]-l-glutamic Acid (16h)
1H NMR (400 MHz, DMSO-d6): δ 12.49 (br s, 1H), 10.01 (br s, 1H), 9.49 (br s, 1H), 8.80 (s, 1H), 8.71 (d, J = 4.0 Hz, 1H), 8.57 (d, J = 8.0 Hz, 1H), 8.14 (dd, J = 4.0 and 8.0 Hz, 1H overlapped with –NH), 7.67 (br d, J = 8.0 Hz,1H), 6.15 (s, 2H), 5.92 (s, 2H), 4.40–4.30 (m, 1H), 2.37 (t, J = 8.0 Hz, 2H), 2.10–2.00 (m, 1H), 2.00–1.87 (m, 1H); 13C NMR (100 MHz, DMSO-d6): δ 173.88, 173.40, 164.86, 161.30, 160.06, 155.34, 154.00, 153.31, 147.28, 137.24, 122.60, 110.43, 89.07, 51.89, 30.46, 26.03; MS (ES+) m/z: calcd for C16H19N8O7, 435.1, found, 435.1 (M + H)+; HRMS (ESI–): calcd for C16H17N8O7, 433.1220; found, 433.1219 (M – H)−; UPLC tR = 5.94 min, 95.11%.
N-(4-{[(2-Amino-4-hydroxy-6-oxo-1,6-dihydropyrimidin-5-yl)carbamoyl]amino}benzoyl)-l-glutamic Acid (16i)
1H NMR (400 MHz, DMSO-d6): δ 11.54 (br s, 2H), 8.85 (br s, 1H), 8.38 (d, J = 8.0 Hz, 1H), 7.78 (d, J = 8.0 Hz, 2H), 7.50 (d, J = 8.0 Hz, 2H), 6.78 (br s, 1H), 6.70 (br s, 2H), 4.40–4.34 (m, 1H), 2.35 (t, J = 8.0 Hz, 2H), 2.12–2.04 (m, 1H), 1.99–1.89 (m, 1H); 13C NMR (150 MHz, DMSO-d6): δ 174.05, 173.78, 166.29, 162.18, 154.82, 152.09, 143.57, 128.39, 126.27, 116.86, 91.30, 51.98, 30.53, 26.06; MS (ES+) m/z: calcd for C17H19N6O8, 435.1, found, 435.1 (M + H)+; HRMS (ESI–): calcd for C17H17N6O8, 433.1113; found, 433.1111 (M – H)−; UPLC tR = 7.72 min, 96.7%.
N-(4-{[(2-Amino-6-oxo-1,6-dihydropyrimidin-5-yl)carbamoyl]amino}benzoyl)-l-glutamic Acid (16j)
1H NMR (600 MHz, DMSO-d6): δ 9.63 (s, 1H), 8.46 (d, J = 7.2 Hz, 1H), 8.44 (s, 1H), 8.18 (br s, 3H), 7.84 (d, J = 9.0 Hz, 2H), 7.49 (d, J = 8.4 Hz, 2H), 4.40–4.36 (m, 1H), 2.35 (t, J = 7.2 Hz, 2H), 2.11–2.06 (m, 1H), 1.97–1.91 (m, 1H); 13C NMR (150 MHz, DMSO-d6): δ 173.96, 173.64, 166.08, 158.30, 152.05, 149.90, 142.26, 128.66, 127.27, 124.10, 118.16, 116.90, 51.93, 30.46, 25.98; MS (ES+) m/z: calcd for C17H19N6O7, 419.1, found, 419.1 (M + H)+; HRMS (ESI–): calcd, for C17H17N6O7, 417.1159; found, 417.1159 (M – H)−; UPLC tR = 4.60 min, 97.9%.
N-(4-{[(6-Amino-2,4-dioxo-1,2,3,4-tetrahydropyrimidin-5-yl)carbamoyl]amino}benzoyl)-l-glutamic Acid (16k)
1H NMR (600 MHz, DMSO-d6): δ 12.35 (br s, 2H), 10.37 (s, 1H), 10.17 (br s, 1H), 8.39 (d, J = 6.0 Hz, 1H), 7.79 (d, J = 12.0 Hz, 2H), 7.54 (br s, 2H), 6.75 (s, 1H), 6.18 (s, 2H), 4.38–4.34 (m, 1H), 2.34 (t, J = 6.0, Hz, 2H), 2.09–2.05 (m, 1H), 1.96–1.91 (m, 1H); 13C NMR (150 MHz, DMSO-d6): δ 173.97, 173.70, 166.16, 162.19, 154.74, 152.68, 149.92, 143.44, 128.33, 126.34, 116.70, 86.78, 51.91, 30.49, 26.01; MS (ES–) m/z: calcd for C17H17N6O8, 433.1, found, 433.1 (M – H)−; HRMS (ESI–): calcd for C17H17N6O8, 433.1113; found, 433.1108 (M – H)−; UPLC tR = 6.80 min, 95.1%.
N-(4-{[(4-Amino-6-oxo-1,6-dihydropyrimidin-5-yl)carbamoyl]amino}benzoyl)-l-glutamic Acid (16l)
1H NMR (300 MHz, DMSO-d6): δ 11.74 (s, 1H), 9.04 (s, 1H), 8.41 (d, J = 7.8 Hz, 1H), 7.80 (d, J = 8.7 Hz, 2H), 7.76 (s, 1H), 7.51 (d, J = 8.7 Hz, 2H), 7.11 (s, 1H), 6.37 (s, 2H), 4.41–4.34 (m, 1H), 2.35 (t, J = 7.4 Hz, 2H), 2.11–2.05 (m, 1H), 2.00–1.90 (m, 1H); 13C NMR (150 MHz, DMSO-d6): δ 173.96, 173.67, 166.20, 159.49, 153.82, 146.74, 143.31, 128.46, 126.42, 116.74, 98.45, 51.89, 30.46, 25.97; MS (ES+) m/z: calcd for C17H19N6O7, 419.1, found, 419.2 (M + H)+; HRMS (ESI–): calcd for C17H17N6O7, 417.1159; found, 417.1159 (M – H)−; UPLC tR = 4.96 min, 98.3%.
N-[(4-{[(2,4-Diamino-6-oxo-1,6-dihydropyrimidin-5-yl)carbamoyl]amino}phenyl)sulfonyl]-l-glutamic Acid (19)
To a mixture of amine 17 (1.7 mmol) and DIEPA (2.0 mmol) in dry CH2Cl2 (20 mL) was added bis(trichloromethyl)carbonate (0.7 mmol) at 15 °C and the mixture was stirred for 30 min. The organic solvent was removed under reduced pressure to give the crude product isocyanate 18. 4-Hydroxy-2,5,6-triaminopyrimidine sulfate (1.5 mmol) was suspended in water (2 mL) and mixed with a 1 N NaOH solution (5.0 mL). A solution of compound 18 (1.7 mmol) in 5 mL of acetonitrile was added dropwise. After stirring at room temperature for 12 h, the solvent were removed under reduced pressure. The mixture was adjusted to pH = 2 with 2 N HCl and stirred for 10 min. The solid was filtered off and washed with water. After drying, the crude product was purified by Al2O3 (eluted with CH2Cl2/CH3OH/HCOOH = 50/48/2) yielded the tert-butyl ester of 19 as a pale yellow solid. A mixture of tert-butyl ester (0.15 mmol) in 5 mL of TFA was stirred at room temperature for 10 min. TFA were removed under reduced pressure and the residue was washed with acetonitrile to give the desired diacid 19 as a pale brown solid. 1H NMR (300 MHz, DMSO-d6): δ 8.99 (br s, 1H), 7.89 (d, J = 9.0 Hz,, 1H), 7.63–7.56 (m, 4H), 6.85 (s, 1H), 6.71 (br s, 2H), 6.26 (br s, 2H), 3.70 (td, J = 12.0, 6.0 Hz, 1H), 2.21 (t, J = 6.0 Hz, 2H), 1.90–1.76 (m, 1H), 1.75–1.50 (m, 1H); 13C NMR (150 MHz, DMSO-d6): δ 173.54, 172.59, 160.22, 152.84, 144.22, 132.58, 127.68, 117.03, 89.08, 54.71, 29.58, 27.44; MS (ES+) m/z: calcd for C16H20N7O8S, 470.1, found, 470.2 (M + H)+; HRMS (ESI–): calcd for C16H18N7O8S, 468.0938; found, 468.0943 (M – H)−; UPLC tR = 5.23 min, 96.6%.
N-(4-{2-[(2,4-Diamino-6-oxo-1,6-dihydropyrimidin-5-yl)amino]-2-oxoethyl}benzoyl)-l-glutamic Acid (23)
To a solution of acid 20 (2.0 mmol) in dry CH2Cl2 was added thionyl chloride (4.0 mmol) and pyridine (one drop). The resultant solution was then refluxed at 55 °C for 1.5 h. Solvent were removed under reduced pressure and the crude product 21 was used directly for the next step without further purification. The synthetic route for the preparation of the final product diacid 23 starting from 21 is like that of 16.
1H NMR (400 MHz, DMSO-d6): δ 8.54 (s, 1H), 8.49 (d, J = 8.0 Hz, 1H), 7.81 (d, J = 8.0 Hz, 2H), 7.43 (d, J = 8.0 Hz, 2H), 6.20 (s, 2H), 5.61 (s, 2H), 4.42–4.36 (m, 1H), 3.62 (s, 2H), 2.35 (t, J = 8.0 Hz, 2H), 2.12–2.04 (m, 1H), 2.00–1.91 (m, 1H); 13C NMR (150 MHz, DMSO-d6): δ 174.04, 173.57, 169.62, 166.42, 160.61, 159.79, 153.40, 140.40, 131.96, 129.13, 127.27, 89.82, 52.08, 42.01, 30.61, 26.12; MS (ES+) m/z: calcd for C18H21N6O7, 433.2, found, 433.2 (M + H)+; HRMS (ESI–): calcd for C18H19N6O7, 431.1315; found, 431.1315 (M – H)−; UPLC tR = 5.21 min, 99.7%.
Protein Expression and Purification for Structural Biology Studies
The vector pET14b (Novagen, Madison, USA) was utilized for the expression of MTHFD2. The cDNA fragment encoding MTHFD2 residues 36–350 was cloned with an N-terminal 6×-histidine tag followed by a thrombin cleavage site. Expression was induced in the bacterial strain BL21(DE3) and continued for 6 h. Harvested cell pellets stored at −80 °C was subsequently lysed by sonication in lysis buffer (50 mM Tris, pH 7.8, 250 mM NaCl). MTHFD2 proteins were purified using a HisTrap HP column (Cytiva, Marlborough, USA). The eluate containing MTHFD2 protein was then exchanged into thrombin cleavage buffer (20 mM Tris, pH 8.2, 150 mM NaCl, 2.5 mM CaCl2) and subjected to overnight digestion with thrombin protease at 4 °C. The MTHFD2 protein solution was finally concentrated to 7 mg/mL with the addition of 1 mM TCEP.
The vector pET28a (Novagen, Madison, USA) was employed for the expression of MTHFD1. The cDNA fragment encoding human MTHFD1 residues 1–301 was cloned with a C-terminal 6x-histidine tag. Expression was induced in the bacterial strain BL21(DE3) and continued for 6 h. MTHFD1 proteins were purified with a HisTrap HP column. After washing, eluant containing MTHFD1 proteins was exchanged to the final buffer (20 mM Tris, pH 7.3, 250 mM NaCl) using a HiPrep 26/10 desalting column. The MTHFD1 protein solution was finally concentrated to 7 mg/mL with the addition of 1 mM TCEP and NADP+.
Crystallization
Crystals of MTHFD2 or MTHFD1 in complex with LY374571, 16a, 16d, 16e and 16g were prepared using the cocrystallization method. MTHFD2 or MTHFD1 proteins were incubated with 1 to 3 mM of various compounds on ice for 30 min. Crystals of MTHFD2 were obtained by the hanging-drop vapor-diffusion method, where 1 μL of protein was mixed with 1 μL of a reservoir solution containing 23% isopropanol, 0.1 M bis-Tris, pH 7.1, 0–8% PEG200, 5–20% PEG400, 0–12% PEG1000. For MTHFD1 crystals, the protein/compound mixture were added to a reservoir solution consisting of 0.09 M Morpheus NPS Mix, 0.01 M Morpheus Buffer System 2, pH 7.2 or 7.5 and 31–42% Morpheus Precipitant Mix 4 (Molecular Dimensions). After 1 week, the crystals were grown at 18 °C. Crystals of MTHFD2 were flash-frozen in liquid nitrogen with the addition of DMSO to the drop as a cryoprotectant, while MTHFD1 crystals were flash-frozen directly without cryoprotectant.
Structure Determination
Diffraction data were obtained at the NSRRC, Taiwan (beamline TLS15A1 and TPS05A) and SPring-8 (beamline BL44XU), Japan. The data were processed using HKL200055 software. The molecular replacement method MOLREP56 of the CCP457 program suites was applied to determine the protein structures, using the MTHFD2 structure (PDB 5TC4) and MTHFD1 structure (PDB 1DIG) as the template models. The programs PHENIX58 and COOT59 were used for subsequent refinement and model building. Figures of structures were generated by PyMOL (Schrödinger, LLC.).
Cell Culture
MOLM-13, MOLM-14, HSC-3, and HuH-7 human cancer cells were purchased from Japanese Collection of Research Bioresources Cell Bank (Osaka, Japan). RS4; 11, FaDu, NCI-H2030, and MIA PaCa-2 were purchased from American Type Culture Collection (Virginia, US). HL-60, CCRF-CEM, K-562, SW620, LoVo, Hep G2, A549, and AsPC-1 human cancer cell lines were purchased from Bioresource Collection and Research Center (BCRC) (Hsinchu, Taiwan). All cell lines were cultured according to the manufacturer’s protocol and maintained in a humidified incubator with 5% CO2 at 37 °C.
Protein Expression and Purification for Activity Assays
The preparation of purified human MTHFD2 and MTHFD1 proteins followed the protocol described by Gustafsson et al.29 Briefly, a 36–350 amino acid fragment of human MTHFD2 and a 1–306 amino acid fragment of human MTHFD1 were constructed using the pBacPAK8-MTGFP-His vector and overexpressed in insect cells. The C-terminal-His-tagged MTHFD2 and MTHFD1 proteins were then purified using a HisTrap-HP column (Cytiva, Marlborough).
MTHFD1 and MTHFD2 Activity Assays
These assays were performed and modified by Mejia and MacKenzie60 Purified MTHFD2 and MTHFD1 were preincubated with 0.4 mM NAD+ and 2 mM NADP+, respectively. After a 10 min incubation, the MTHFD2 inhibitor was added and incubated for an additional 10 min. MTHFD1 and MTHFD2 enzymatic reactions were carried out for 10 min after the respective assay buffer was added. The MTHFD1 assay buffer included 30 mM potassium phosphate, pH 7.3, 0.3 mM tetrahydrofolate, 2.5 mM formaldehyde, 6 mM MgCl2, and MTHFD2 assay buffer included 30 mM potassium phosphate, pH 7.3, 0.15 mM tetrahydrofolate, 2.5 mM formaldehyde, 6 mM MgCl2. Finally, the enzymatic reaction was terminated by adding HCl (final 0.18 N) and the absorbance was measured at 350 nm.
Cell Growth Inhibition Assays
Suspension and adherent cells were seeded in 96-well- and 24-well plates, respectively. After culturing overnight, cells were treated with MTHFD2 inhibitors, such as LY374571, 16e, and 16a, for 72 h. Suspension cells were analyzed using the MTT assay, while adherent cells were examined using methylene blue staining assay. The efficacy of the compounds was evaluated through GI50 analysis, which determines the concentration of a compound that inhibits 50% of cell growth.
Drugs Combination Assays
Seeded MOLM-14 cells were treated with increased concentrations of Alimta combined with either 16a or 16e. After 72 h of incubation, cell viability was assessed using the MTT assay. The combination index was analyzed by Calcusyn software (Version 1.1.1). A combination index score of less than 1 indicated a synergistic effect, a score of 1 indicated an additive effect, and a score greater than 1 indicated an antagonistic effect.
Pharmacokinetic Studies
Male ICR mice aged 6–8 weeks (Biolasco, Taiwan) were intravenously administered a single dose of either 2 mg/kg LY374571 or 2 mg/kg 16e. After drug treatment, mice were sacrificed at 0.003, 0.083, 0.25, 0.5, 1, 2, 4, 6, 8, and 24 h, with three mice per group. Plasma samples were collected by cardiac puncture and analyzed using LC–MS/MS to obtain the data of moderate plasma half-life (T1/2), area under the curve–time curve from 0 to infinity (AUC (0-inf)), total body clearance rate (CL), and volume of distribution (Vss).
In Vivo Anticancer Studies
All mice (NOD/SCID, female, 9–10 weeks) were purchased from BioLASCO (Taiwan) and experiments were performed in strict accordance with the recommendations in the guidelines for the Care and Use of Laboratory Animals of the National Health Research Institutes (Miaoli, Taiwan). The Institutional Animal Care and Use Committee of the National Health Research Institutes approved the animal protocol (protocol no. 107085). MOLM-14 cells were subcutaneously implanted in the flank region of mice. Drug treatments were started when the tumor size reached ∼100 mm3 (D1). Tumor size and weight change were monitored twice weekly until the study finished. Tumor size (mm3) was calculated from (w2 × l)/2. Where w = width and l = length in mm of the tumor. Tumor growth inhibition (TGI) was used to evaluate the antitumor efficacy and was calculated as follows: TGI = {1 – [(mean volume of treatment group at day 7 or day 14 – mean volume of treatment group at day 1)/(mean volume of control group at day 7 or day 14 – mean volume of control group at day 1)] × 100%}.
Statistical Analysis
Data was expressed as the mean ± SD. Student’s t-test was used to examine differences between the control and test groups. Differences were considered significant at p < 0.05. All statistics were performed using SigmaStat (Jandel Scientific, Palo Alto, CA) Ancillary Information.
Acknowledgments
We thank the experimental facility and the technical services provided by beamlines TPS05A and TLS15A1 at the National Synchrotron Radiation Research Center (NSRRC), Taiwan and BL44XU at the SPring-8, Japan. This work was supported by Ministry of Science and Technology (105-2320-B-400-011-MY3, 109-2113-M-400-004 and 109-2320-B-400-016) and National Health Research Institute.
Glossary
Abbreviations
- 10-CHO-THF
10-formyl tetrahydrofolate
- FLT3-ITD
FLT3 internal tandem duplication
- MTHFD2
methylenetetrahydrofolate dehydrogenase/cyclohydrolase 2
- SAR
structure–activity relationship
- SCID
severe combined immunodeficiency
Supporting Information Available
The Supporting Information is available free of charge at https://pubs.acs.org/doi/10.1021/acs.jmedchem.4c01775.
Author Contributions
§ Hsin-Hui Chang and Lung-Chun Lee contributed equally.
The authors declare no competing financial interest.
Notes
PDB ID Codes 9IS9 (MTHFD2/LY374571); 9ISC (MTHFD2/16a); 9ITA (MTHFD2/16d); 9IT3 (MTHFD2/16e); 9IT6 (MTHFD2/16g); 9ISE (MTHFD1/LY374571); 9ITD (MTHFD1/16a); 9IUO (MTHFD1/16d); 9ISL (MTHFD1/16e); 9ISR (MTHFD1/16g). Authors will release the atomic coordinates and experimental data upon article publication.
Supplementary Material
References
- Ramos L.; Henriksson M.; Helleday T.; Green A. C. Targeting MTHFD2 to Exploit Cancer-Specific Metabolism and the DNA Damage Response. Cancer Res. 2024, 84, 9–16. 10.1158/0008-5472.CAN-23-1290. [DOI] [PubMed] [Google Scholar]
- Mejia N. R.; Rios-Orlandi E. M.; MacKenzie R. E. NAD-dependent methylenetetrahydrofolate dehydrogenase-methenyltetrahydrofolate cyclohydrolase from ascites tumor cells. Purification and properties. J. Biol. Chem. 1986, 261, 9509–9513. 10.1016/S0021-9258(18)67686-0. [DOI] [PubMed] [Google Scholar]
- Ju H. Q.; Lu Y. X.; Chen D. L.; Zuo Z. X.; Liu Z. X.; Wu Q. N.; Mo H. Y.; Wang Z. X.; Wang D. S.; Pu H. Y.; Zeng Z. L.; Li B.; Xie D.; Huang P.; Hung M. C.; Chiao P. J.; Xu R. H. Modulation of Redox Homeostasis by Inhibition of MTHFD2 in Colorectal Cancer: Mechanisms and Therapeutic Implications. J. Natl. Cancer Inst. 2019, 111, 584–596. 10.1093/jnci/djy160. [DOI] [PMC free article] [PubMed] [Google Scholar]
- Nilsson R.; Jain M.; Madhusudhan N.; Sheppard N. G.; Strittmatter L.; Kampf C.; Huang J.; Asplund A.; Mootha V. K. Metabolic enzyme expression highlights a key role for MTHFD2 and the mitochondrial folate pathway in cancer. Nat. Commun. 2014, 5, 3128. 10.1038/ncomms4128. [DOI] [PMC free article] [PubMed] [Google Scholar]
- Wei Y.; Liu P.; Li Q.; Du J.; Chen Y.; Wang Y.; Shi H.; Wang Y.; Zhang H.; Xue W.; Gao Y.; Li D.; Feng Y.; Yan J.; Han J.; Zhang J. The effect of MTHFD2 on the proliferation and migration of colorectal cancer cell lines. OncoTargets Ther. 2019, 12, 6361–6370. 10.2147/OTT.S210800. [DOI] [PMC free article] [PubMed] [Google Scholar]
- Achreja A.; Yu T.; Mittal A.; Choppara S.; Animasahun O.; Nenwani M.; Wuchu F.; Meurs N.; Mohan A.; Jeon J. H.; Sarangi I.; Jayaraman A.; Owen S.; Kulkarni R.; Cusato M.; Weinberg F.; Kweon H. K.; Subramanian C.; Wicha M. S.; Merajver S. D.; Nagrath S.; Cho K. R.; DiFeo A.; Lu X.; Nagrath D. Metabolic collateral lethal target identification reveals MTHFD2 paralogue dependency in ovarian cancer. Nat. Metab. 2022, 4, 1119–1137. 10.1038/s42255-022-00636-3. [DOI] [PubMed] [Google Scholar]
- Cui X.; Su H.; Yang J.; Wu X.; Huo K.; Jing X.; Zhang S. Up-regulation of MTHFD2 is associated with clinicopathological characteristics and poor survival in ovarian cancer, possibly by regulating MOB1A signaling. J. Ovarian Res. 2022, 15, 23. 10.1186/s13048-022-00954-w. [DOI] [PMC free article] [PubMed] [Google Scholar]
- Mo X.; Liu Q.; Liang K.; Song Y. Interference with MTHFD2 induces ferroptosis in ovarian cancer cells through ERK signaling to suppress tumor malignant progression. J. Bioenerg. Biomembr. 2024, 56, 333–345. 10.1007/s10863-024-10014-1. [DOI] [PubMed] [Google Scholar]
- Koufaris C.; Gallage S.; Yang T.; Lau C. H.; Valbuena G. N.; Keun H. C. Suppression of MTHFD2 in MCF-7 Breast Cancer Cells Increases Glycolysis, Dependency on Exogenous Glycine, and Sensitivity to Folate Depletion. J. Proteome Res. 2016, 15, 2618–2625. 10.1021/acs.jproteome.6b00188. [DOI] [PubMed] [Google Scholar]
- Huang J.; Qin Y.; Lin C.; Huang X.; Zhang F. MTHFD2 facilitates breast cancer cell proliferation via the AKT signaling pathway. Exp. Ther. Med. 2021, 22, 703. 10.3892/etm.2021.10135. [DOI] [PMC free article] [PubMed] [Google Scholar]
- Zhang H.; Zhu S.; Zhou H.; Li R.; Xia X.; Xiong H. Identification of MTHFD2 as a prognostic biomarker and ferroptosis regulator in triple-negative breast cancer. Front. Oncol. 2023, 13, 1098357. 10.3389/fonc.2023.1098357. [DOI] [PMC free article] [PubMed] [Google Scholar]
- Yu C.; Yang L.; Cai M.; Zhou F.; Xiao S.; Li Y.; Wan T.; Cheng D.; Wang L.; Zhao C.; Huang X. Down-regulation of MTHFD2 inhibits NSCLC progression by suppressing cycle-related genes. J. Cell. Mol. Med. 2020, 24, 1568–1577. 10.1111/jcmm.14844. [DOI] [PMC free article] [PubMed] [Google Scholar]
- Zhou F.; Yuan Z.; Gong Y.; Li L.; Wang Y.; Wang X.; Ma C.; Yang L.; Liu Z.; Wang L.; Zhao H.; Zhao C.; Huang X. Pharmacological targeting of MTHFD2 suppresses NSCLC via the regulation of ILK signaling pathway. Biomed. Pharmacother. 2023, 161, 114412. 10.1016/j.biopha.2023.114412. [DOI] [PubMed] [Google Scholar]
- Pikman Y.; Puissant A.; Alexe G.; Furman A.; Chen L. M.; Frumm S. M.; Ross L.; Fenouille N.; Bassil C. F.; Lewis C. A.; Ramos A.; Gould J.; Stone R. M.; DeAngelo D. J.; Galinsky I.; Clish C. B.; Kung A. L.; Hemann M. T.; Vander Heiden M. G.; Banerji V.; Stegmaier K. Targeting MTHFD2 in acute myeloid leukemia. J. Exp. Med. 2016, 213, 1285–1306. 10.1084/jem.20151574. [DOI] [PMC free article] [PubMed] [Google Scholar]
- Bonagas N.; Gustafsson N. M. S.; Henriksson M.; Marttila P.; Gustafsson R.; Wiita E.; Borhade S.; Green A. C.; Vallin K. S. A.; Sarno A.; Svensson R.; Göktürk C.; Pham T.; Jemth A. S.; Loseva O.; Cookson V.; Kiweler N.; Sandberg L.; Rasti A.; Unterlass J. E.; Haraldsson M.; Andersson Y.; Scaletti E. R.; Bengtsson C.; Paulin C. B. J.; Sanjiv K.; Abdurakhmanov E.; Pudelko L.; Kunz B.; Desroses M.; Iliev P.; Färnegårdh K.; Krämer A.; Garg N.; Michel M.; Häggblad S.; Jarvius M.; Kalderén C.; Jensen A. B.; Almlöf I.; Karsten S.; Zhang S. M.; Häggblad M.; Eriksson A.; Liu J.; Glinghammar B.; Nekhotiaeva N.; Klingegård F.; Koolmeister T.; Martens U.; Llona-Minguez S.; Moulson R.; Nordström H.; Parrow V.; Dahllund L.; Sjöberg B.; Vargas I. L.; Vo D. D.; Wannberg J.; Knapp S.; Krokan H. E.; Arvidsson P. I.; Scobie M.; Meiser J.; Stenmark P.; Berglund U. W.; Homan E. J.; Helleday T. Pharmacological targeting of MTHFD2 suppresses acute myeloid leukemia by inducing thymidine depletion and replication stress. Nat. Cancer 2022, 3, 156–172. 10.1038/s43018-022-00331-y. [DOI] [PMC free article] [PubMed] [Google Scholar]
- Yang C.; Zhang J.; Liao M.; Yang Y.; Wang Y.; Yuan Y.; Ouyang L. Folate-mediated one-carbon metabolism: a targeting strategy in cancer therapy. Drug Discovery Today 2021, 26, 817–825. 10.1016/j.drudis.2020.12.006. [DOI] [PubMed] [Google Scholar]
- Zhu Z.; Leung G. K. K. More Than a Metabolic Enzyme: MTHFD2 as a Novel Target for Anticancer Therapy?. Front. Oncol. 2020, 10, 658. 10.3389/fonc.2020.00658. [DOI] [PMC free article] [PubMed] [Google Scholar]
- Zhao L. N.; Björklund M.; Caldez M. J.; Zheng J.; Kaldis P. Therapeutic targeting of the mitochondrial one-carbon pathway: perspectives, pitfalls, and potential. Oncogene 2021, 40, 2339–2354. 10.1038/s41388-021-01695-8. [DOI] [PubMed] [Google Scholar]
- Pardo-Lorente N.; Sdelci S. MTHFD2 in healthy and cancer cells: Canonical and non-canonical functions. npj Metab. Health Dis. 2024, 2, 3. 10.1038/s44324-024-00005-6. [DOI] [Google Scholar]
- Peri K. G.; MacKenzie R. E. Transcriptional regulation of murine NADP(+)-dependent methylenetetrahydrofolate dehydrogenase-cyclohydrolase-synthetase. FEBS Lett. 1991, 294, 113–115. 10.1016/0014-5793(91)81354-B. [DOI] [PubMed] [Google Scholar]
- Mejia N. R.; MacKenzie R. E. NAD-dependent methylenetetrahydrofolate dehydrogenase is expressed by immortal cells. J. Biol. Chem. 1985, 260, 14616–14620. 10.1016/S0021-9258(17)38612-X. [DOI] [PubMed] [Google Scholar]
- Di Pietro E.; Sirois J.; Tremblay M. L.; MacKenzie R. E. Mitochondrial NAD-dependent methylenetetrahydrofolate dehydrogenase-methenyltetrahydrofolate cyclohydrolase is essential for embryonic development. Mol. Cell. Biol. 2002, 22, 4158–4166. 10.1128/MCB.22.12.4158-4166.2002. [DOI] [PMC free article] [PubMed] [Google Scholar]
- Schmidt A.; Wu H.; MacKenzie R. E.; Chen V. J.; Bewly J. R.; Ray J. E.; Toth J. E.; Cygler M. Structures of three inhibitor complexes provide insight into the reaction mechanism of the human methylenetetrahydrofolate dehydrogenase/cyclohydrolase. Biochemistry 2000, 39, 6325–6335. 10.1021/bi992734y. [DOI] [PubMed] [Google Scholar]
- Eadsforth T. C.; Maluf F. V.; Hunter W. N. Acinetobacter baumannii FolD ligand complexes --potent inhibitors of folate metabolism and a re-evaluation of the structure of LY374571. FEBS J. 2012, 279, 4350–4360. 10.1111/febs.12025. [DOI] [PMC free article] [PubMed] [Google Scholar]
- Mainolfi N.; Moyer M. P.; Saiah E.; Lecci C.; Pace R. D. M.; Tye H.; Vile J.. Caffeine inhibitors of mthfd2 and uses thereof. WO 2017106352 A1. Jun 22, 2017.
- Lee L. C.; Peng Y. H.; Chang H. H.; Hsu T.; Lu C. T.; Huang C. H.; Hsueh C. C.; Kung F. C.; Kuo C. C.; Jiaang W. T.; Wu S. Y. Xanthine Derivatives Reveal an Allosteric Binding Site in Methylenetetrahydrofolate Dehydrogenase 2 (MTHFD2). J. Med. Chem. 2021, 64, 11288–11301. 10.1021/acs.jmedchem.1c00663. [DOI] [PMC free article] [PubMed] [Google Scholar]
- Kawai J.; Toki T.; Ota M.; Inoue H.; Takata Y.; Asahi T.; Suzuki M.; Shimada T.; Ono K.; Suzuki K.; Takaishi S.; Ohki H.; Matsui S.; Tsutsumi S.; Hirota Y.; Nakayama K. Discovery of a Potent, Selective, and Orally Available MTHFD2 Inhibitor (DS18561882) with in Vivo Antitumor Activity. J. Med. Chem. 2019, 62, 10204–10220. 10.1021/acs.jmedchem.9b01113. [DOI] [PubMed] [Google Scholar]
- Fu C.; Sikandar A.; Donner J.; Zaburannyi N.; Herrmann J.; Reck M.; Wagner-Dobler I.; Koehnke J.; Muller R. The natural product carolacton inhibits folate-dependent C1 metabolism by targeting FolD/MTHFD. Nat. Commun. 2017, 8, 1529. 10.1038/s41467-017-01671-5. [DOI] [PMC free article] [PubMed] [Google Scholar]
- Gustafsson R.; Jemth A. S.; Gustafsson N. M.; Färnegårdh K.; Loseva O.; Wiita E.; Bonagas N.; Dahllund L.; Llona-Minguez S.; Häggblad M.; Henriksson M.; Andersson Y.; Homan E.; Helleday T.; Stenmark P. Crystal Structure of the Emerging Cancer Target MTHFD2 in Complex with a Substrate-Based Inhibitor. Cancer Res. 2017, 77, 937–948. 10.1158/0008-5472.CAN-16-1476. [DOI] [PubMed] [Google Scholar]
- Kawai J.; Ota M.; Ohki H.; Toki T.; Suzuki M.; Shimada T.; Matsui S.; Inoue H.; Sugihara C.; Matsuhashi N.; Matsui Y.; Takaishi S.; Nakayama K. Structure-Based Design and Synthesis of an Isozyme-Selective MTHFD2 Inhibitor with a Tricyclic Coumarin Scaffold. ACS Med. Chem. Lett. 2019, 10, 893–898. 10.1021/acsmedchemlett.9b00069. [DOI] [PMC free article] [PubMed] [Google Scholar]
- Eadsforth T. C.; Pinto A.; Luciani R.; Tamborini L.; Cullia G.; De Micheli C.; Marinelli L.; Cosconati S.; Novellino E.; Lo Presti L.; Cordeiro da Silva A.; Conti P.; Hunter W. N.; Costi M. P. Characterization of 2,4-Diamino-6-oxo-1,6-dihydropyrimidin-5-yl Ureido Based Inhibitors of Trypanosoma brucei FolD and Testing for Antiparasitic Activity. J. Med. Chem. 2015, 58, 7938–7948. 10.1021/acs.jmedchem.5b00687. [DOI] [PMC free article] [PubMed] [Google Scholar]
- Itoh F.; Yukishige K.; Wajima M.; Ootsu K.; Akimoto H. Non-glutamate type pyrrolo[2,3-d]pyrimidine antifolates. I: Synthesis and biological properties of pyrrolo[2,3-d]pyrimidine antifolates containing tetrazole congener of glutamic acid. Chem. Pharm. Bull. 1995, 43, 230–235. 10.1248/cpb.43.230. [DOI] [PubMed] [Google Scholar]
- Pawelczak K.; Makowski M.; Kempny M.; Dzik J. M.; Golos B.; Rode W.; Rzeszotarska B. Sulfamide antifolates inhibiting thymidylate synthase: synthesis, enzyme inhibition and cytotoxicity. Acta. Biochim. Polym. 2002, 49, 407–420. 10.18388/abp.2002_3799. [DOI] [PubMed] [Google Scholar]
- Yamaura T.; Nakatani T.; Uda K.; Ogura H.; Shin W.; Kurokawa N.; Saito K.; Fujikawa N.; Date T.; Takasaki M.; Terada D.; Hirai A.; Akashi A.; Chen F.; Adachi Y.; Ishikawa Y.; Hayakawa F.; Hagiwara S.; Naoe T.; Kiyoi H. A novel irreversible FLT3 inhibitor, FF-10101, shows excellent efficacy against AML cells with FLT3 mutations. Blood 2018, 131, 426–438. 10.1182/blood-2017-05-786657. [DOI] [PubMed] [Google Scholar]
- Kazi J. U.; Al Ashiri L.; Purohit R.; Ronnstrand L. Understanding the Role of Activation Loop Mutants in Drug Efficacy for FLT3-ITD. Cancers 2023, 15, 5426. 10.3390/cancers15225426. [DOI] [PMC free article] [PubMed] [Google Scholar]
- Zheng R.; Friedman A. D.; Levis M.; Li L.; Weir E. G.; Small D. Internal tandem duplication mutation of FLT3 blocks myeloid differentiation through suppression of C/EBPα expression. Blood 2004, 103, 1883–1890. 10.1182/blood-2003-06-1978. [DOI] [PubMed] [Google Scholar]
- Zhao J. C.; Agarwal S.; Ahmad H.; Amin K.; Bewersdorf J. P.; Zeidan A. M. A review of FLT3 inhibitors in acute myeloid leukemia. Blood Rev. 2022, 52, 100905. 10.1016/j.blre.2021.100905. [DOI] [PMC free article] [PubMed] [Google Scholar]
- Lagunas-Rangel F. A. DNA damage accumulation and repair defects in FLT3-ITD acute myeloid leukemia: Implications for clonal evolution and disease progression. Hematol. Oncol. 2023, 41, 26–38. 10.1002/hon.3076. [DOI] [PMC free article] [PubMed] [Google Scholar]
- Chen Y.; Zou Z.; Gaman M. A.; Xu L.; Li J. NADPH oxidase mediated oxidative stress signaling in FLT3-ITD acute myeloid leukemia. Cell Death Discovery 2023, 9, 208. 10.1038/s41420-023-01528-5. [DOI] [PMC free article] [PubMed] [Google Scholar]
- Fan J.; Ye J.; Kamphorst J. J.; Shlomi T.; Thompson C. B.; Rabinowitz J. D. Quantitative flux analysis reveals folate-dependent NADPH production. Nature 2014, 510, 298–302. 10.1038/nature13236. [DOI] [PMC free article] [PubMed] [Google Scholar]
- Ducker G. S.; Rabinowitz J. D. One-Carbon Metabolism in Health and Disease. Cell Metab. 2017, 25, 27–42. 10.1016/j.cmet.2016.08.009. [DOI] [PMC free article] [PubMed] [Google Scholar]
- Mo H. Y.; Wang R. B.; Ma M. Y.; Zhang Y.; Li X. Y.; Wen W. R.; Han Y.; Tian T. MTHFD2-mediated redox homeostasis promotes gastric cancer progression under hypoxic conditions. Redox Rep. 2024, 29, 2345455. 10.1080/13510002.2024.2345455. [DOI] [PMC free article] [PubMed] [Google Scholar]
- Bjelosevic S.; Gruber E.; Newbold A.; Shembrey C.; Devlin J. R.; Hogg S. J.; Kats L.; Todorovski I.; Fan Z.; Abrehart T. C.; Pomilio G.; Wei A.; Gregory G. P.; Vervoort S. J.; Brown K. K.; Johnstone R. W. Serine Biosynthesis Is a Metabolic Vulnerability in FLT3-ITD-Driven Acute Myeloid Leukemia. Cancer Discovery 2021, 11, 1582–1599. 10.1158/2159-8290.CD-20-0738. [DOI] [PubMed] [Google Scholar]
- Peri K. G.; MacKenzie R. E. NAD(+)-dependent methylenetetrahydrofolate dehydrogenase-cyclohydrolase: detection of the mRNA in normal murine tissues and transcriptional regulation of the gene in cell lines. Biochim. Biophys. Acta 1993, 1171, 281–287. 10.1016/0167-4781(93)90066-M. [DOI] [PubMed] [Google Scholar]
- Patel H.; Pietro E. D.; MacKenzie R. E. Mammalian fibroblasts lacking mitochondrial NAD+-dependent methylenetetrahydrofolate dehydrogenase-cyclohydrolase are glycine auxotrophs. J. Biol. Chem. 2003, 278, 19436–19441. 10.1074/jbc.M301718200. [DOI] [PubMed] [Google Scholar]
- Christensen K. E.; Deng L.; Leung K. Y.; Arning E.; Bottiglieri T.; Malysheva O. V.; Caudill M. A.; Krupenko N. I.; Greene N. D.; Jerome-Majewska L.; MacKenzie R. E.; Rozen R. A novel mouse model for genetic variation in 10-formyltetrahydrofolate synthetase exhibits disturbed purine synthesis with impacts on pregnancy and embryonic development. Hum. Mol. Genet. 2013, 22, 3705–3719. 10.1093/hmg/ddt223. [DOI] [PubMed] [Google Scholar]
- MacFarlane A. J.; Perry C. A.; Girnary H. H.; Gao D.; Allen R. H.; Stabler S. P.; Shane B.; Stover P. J. Mthfd1 is an essential gene in mice and alters biomarkers of impaired one-carbon metabolism. J. Biol. Chem. 2009, 284, 1533–1539. 10.1074/jbc.M808281200. [DOI] [PMC free article] [PubMed] [Google Scholar]
- Watkins D.; Schwartzentruber J. A.; Ganesh J.; Orange J. S.; Kaplan B. S.; Nunez L. D.; Majewski J.; Rosenblatt D. S. Novel inborn error of folate metabolism: identification by exome capture and sequencing of mutations in the MTHFD1 gene in a single proband. J. Med. Genet. 2011, 48, 590–592. 10.1136/jmedgenet-2011-100286. [DOI] [PubMed] [Google Scholar]
- Keller M. D.; Ganesh J.; Heltzer M.; Paessler M.; Bergqvist A. C.; Baluarte H. J.; Watkins D.; Rosenblatt D. S.; Orange J. S. Severe combined immunodeficiency resulting from mutations in MTHFD1. Pediatrics 2013, 131, e629–e634. 10.1542/peds.2012-0899. [DOI] [PubMed] [Google Scholar]
- Burda P.; Kuster A.; Hjalmarson O.; Suormala T.; Burer C.; Lutz S.; Roussey G.; Christa L.; Asin-Cayuela J.; Kollberg G.; Andersson B. A.; Watkins D.; Rosenblatt D. S.; Fowler B.; Holme E.; Froese D. S.; Baumgartner M. R. Characterization and review of MTHFD1 deficiency: four new patients, cellular delineation and response to folic and folinic acid treatment. J. Inherit. Metab. Dis. 2015, 38, 863–872. 10.1007/s10545-015-9810-3. [DOI] [PubMed] [Google Scholar]
- Ramakrishnan K. A.; Pengelly R. J.; Gao Y.; Morgan M.; Patel S. V.; Davies E. G.; Ennis S.; Faust S. N.; Williams A. P. Precision Molecular Diagnosis Defines Specific Therapy in Combined Immunodeficiency with Megaloblastic Anemia Secondary to MTHFD1 Deficiency. J. Allergy Clin. Immunol. Pract. 2016, 4, 1160–1166 e10. 10.1016/j.jaip.2016.07.014. [DOI] [PubMed] [Google Scholar]
- Al-Mousa H.; Al-Dakheel G.; Jabr A.; Elbadaoui F.; Abouelhoda M.; Baig M.; Monies D.; Meyer B.; Hawwari A.; Dasouki M. High Incidence of Severe Combined Immunodeficiency Disease in Saudi Arabia Detected Through Combined T Cell Receptor Excision Circle and Next Generation Sequencing of Newborn Dried Blood Spots. Front. Immunol. 2018, 9, 782. 10.3389/fimmu.2018.00782. [DOI] [PMC free article] [PubMed] [Google Scholar]
- Bidla G.; Watkins D.; Chery C.; Froese D. S.; Ells C.; Kerachian M.; Saskin A.; Christensen K. E.; Gilfix B. M.; Gueant J. L.; Rosenblatt D. S. Biochemical analysis of patients with mutations in MTHFD1 and a diagnosis of methylenetetrahydrofolate dehydrogenase 1 deficiency. Mol. Genet. Metab. 2020, 130, 179–182. 10.1016/j.ymgme.2020.04.008. [DOI] [PubMed] [Google Scholar]
- Hazarika M.; White R. M.; Johnson J. R.; Pazdur R. FDA Drug Approval Summaries: Pemetrexed (Alimta®). Oncologist 2004, 9, 482–488. 10.1634/theoncologist.9-5-482. [DOI] [PubMed] [Google Scholar]
- Otwinowski Z.; Minor W. [20] Processing of X-ray diffraction data collected in oscillation mode. Methods Enzymol. 1997, 276, 307–326. 10.1016/S0076-6879(97)76066-X. [DOI] [PubMed] [Google Scholar]
- Vagin A.; Teplyakov A. Molecular replacement with MOLREP. Acta Crystallogr., Sect. D: Biol. Crystallogr. 2010, 66, 22–25. 10.1107/S0907444909042589. [DOI] [PubMed] [Google Scholar]
- The CCP4 suite: programs for protein crystallography. Acta Crystallogr., Sect. D: Biol. Crystallogr. 1994, 50, 760–763. 10.1107/s0907444994003112. [DOI] [PubMed] [Google Scholar]
- Afonine P. V.; Grosse-Kunstleve R. W.; Echols N.; Headd J. J.; Moriarty N. W.; Mustyakimov M.; Terwilliger T. C.; Urzhumtsev A.; Zwart P. H.; Adams P. D. Towards automated crystallographic structure refinement with phenix.refine. Acta Crystallogr., Sect. D: Biol. Crystallogr. 2012, 68, 352–367. 10.1107/S0907444912001308. [DOI] [PMC free article] [PubMed] [Google Scholar]
- Emsley P.; Cowtan K. Coot: model-building tools for molecular graphics. Acta Crystallogr., Sect. D: Biol. Crystallogr. 2004, 60, 2126–2132. 10.1107/S0907444904019158. [DOI] [PubMed] [Google Scholar]
- Mejia N. R.; MacKenzie R. E. NAD-dependent methylenetetrahydrofolate dehydrogenase-methenyltetrahydrofolate cyclohydrolase in transformed cells is a mitochondrial enzyme. Biochem. Biophys. Res. Commun. 1988, 155, 1–6. 10.1016/S0006-291X(88)81040-4. [DOI] [PubMed] [Google Scholar]
Associated Data
This section collects any data citations, data availability statements, or supplementary materials included in this article.