

Key Points
Question
Do critically ill adult patients hospitalized for suspected sepsis and treated with intravenous antibiotics based on procalcitonin (PCT) or C-reactive protein (CRP) protocols, have a safe reduction in treatment duration compared with standard care?
Findings
In this multicenter, randomized trial of 2760 patients, the daily PCT-guided protocol reduced total antibiotic duration and had noninferior all-cause mortality compared with standard care. No difference was found in total antibiotic duration between standard care and daily CRP-guided protocol, and CRP showed inconclusive results for all-cause mortality.
Meaning
In hospitalized adults, daily PCT-guided protocol reduced antibiotic duration safely compared with standard care, but daily CRP-guided protocol does not.
Abstract
Importance
For hospitalized critically ill adults with suspected sepsis, procalcitonin (PCT) and C-reactive protein (CRP) monitoring protocols can guide the duration of antibiotic therapy, but the evidence of the effect and safety of these protocols remains uncertain.
Objective
To determine whether decisions based on assessment of CRP or PCT safely results in a reduction in the duration of antibiotic therapy.
Design, Setting, and Participants
A multicenter, intervention-concealed randomized clinical trial, involving 2760 adults (≥18 years), in 41 UK National Health Service (NHS) intensive care units, requiring critical care within 24 hours of initiating intravenous antibiotics for suspected sepsis and likely to continue antibiotics for at least 72 hours.
Intervention
From January 1, 2018, to June 5, 2024, 918 patients were assigned to the daily PCT-guided protocol, 924 to the daily CRP-guided protocol, and 918 assigned to standard care.
Main Outcomes and Measures
The primary outcomes were total duration of antibiotics (effectiveness) and all-cause mortality (safety) to 28 days. Secondary outcomes included critical care unit data and hospital stay data. Ninety-day all-cause mortality was also collected.
Results
Among the randomized patients (mean age 60.2 [SD, 15.4] years; 60.3% males), there was a significant reduction in antibiotic duration from randomization to 28 days for those in the daily PCT-guided protocol compared with standard care (mean duration, 10.7 [SD, 7.6] days for standard care and 9.8 [SD, 7.2] days for PCT; mean difference, 0.88 days; 95% CI, 0.19 to 1.58, P = .01). For all-cause mortality up to 28 days, the daily PCT-guided protocol was noninferior to standard care, where the noninferiority margin was set at 5.4% (19.4% [170 of 878] of patients receiving standard care; 20.9% [184 of 879], PCT; absolute difference, 1.57; 95% CI, −2.18 to 5.32; P = .02). No difference was found in antibiotic duration for standard care vs daily CRP-guided protocol (mean duration, 10.6 [7.7] days for CRP; mean difference, 0.09; 95% CI, −0.60 to 0.79; P = .79). For all-cause mortality, the daily CRP-guided protocol was inconclusive compared with standard care (21.1% [184 of 874] for CRP; absolute difference, 1.69; 95% CI, −2.07 to 5.45; P = .03).
Conclusions and Relevance
Care guided by measurement of PCT reduces antibiotic duration safely compared with standard care, but CRP does not. All-cause mortality for CRP was inconclusive.
Trial Registration
isrctn.org Identifier: ISRCTN47473244
This clinical trial assessed whether treatment protocols for monitoring C-reactive protein or procalcitonin safely reduced the amount of time critically ill adults with suspected sepsis received antibiotics while maintaining treatment safety measured by 28-day all-cause mortality.
Introduction
Delivering timely, appropriate antimicrobial therapy is an international care standard to help provide the best outcomes for patients with sepsis.1 The optimum duration of antibiotic treatment for sepsis is uncertain, with decisions to stop therapy guided by clinical progress and serum inflammatory biomarkers such as serum C-reactive protein (CRP) and procalcitonin (PCT).2 Optimizing antibiotics duration helps reduce overtreatment, limits unwanted effects, and preserves antibiotic effectiveness by minimizing resistance.3 Biomarker-guided discontinuation, especially with PCT, has shown safe reductions in antibiotic duration.4 However, the body of clinical trial evidence has been judged to be low quality1,5,6 leading to a weak recommendation for routine sepsis care adoption of PCT-guided antibiotic discontinuation1 and with no consensus guidance for CRP.1
A 3-group multicenter, intervention-concealed randomized clinical trial was performed to determine whether treatment protocols for monitoring CRP or PCT safely resulted in a reduction in the duration of antibiotic therapy for critically ill hospitalized adults with suspected sepsis. The primary aim was to assess reduction in antibiotic duration (clinical effectiveness) while maintaining treatment safety (noninferiority) as measured by 28-day all-cause mortality.
Methods
Trial Design and Oversight
The Biomarker-Guided Duration of Antibiotic Treatment in Hospitalised Patients With Suspected Sepsis (ADAPT-Sepsis) trial was an investigator-initiated, randomized clinical trial conducted in 41 National Health Service (NHS) intensive care units in the UK. The trial protocol and amendments (Supplement 1) were approved by the South-Central Oxford and Scotland Research Ethics Committees (17/SC/0434), and the protocol has been published.7 The statistical analysis plan was approved by an independent data monitoring and ethics committee (Supplement 2). The independent trial steering and data monitoring committees oversaw the operational processes and statistical rigor of this study. All patients or their legal representatives provided signed informed consent. Enrollment was paused during the UK lockdown (March-August 2020) due to the SARS-CoV-2 pandemic. This trial followed the Consolidated Standards of Reporting Trials (CONSORT) reporting guideline.
Patient Population
Patients (≥18 years) admitted to either a critical care or intensive care unit (ICU) whose intravenous antibiotics for suspected sepsis had been initiated within 24 hours and likely to be continued for at least 72 hours were enrolled in the trial. Suspected sepsis was defined as “acute organ dysfunction associated with suspected infection.”8 We did not mandate a definition for acute organ dysfunction, and patient information underpinning local clinical decisions were captured, which included the Sequential Organ Failure Assessment (SOFA) score. A 24-hour recruitment window was required to determine baseline biomarkers for treatment guidance.2,9 Patients were ineligible if they: (1) required prolonged antibiotic therapy (ie, >21 days); (2) were severely immunocompromised from a cause other than sepsis (eg, neutropenia <500 neutrophils/μL); (3) were expected to receive IL-6 receptor inhibitors (eg, tocilizumab or sarilumab) during their acute hospital admission; (4) had sepsis treatments likely to stop within 24 hours because of futility; (5) declined consent; or (6) had previously enrolled into this trial. Full inclusion and exclusion criteria are provided in Supplement 3.
Randomization
Patients were randomly assigned to standard care, PCT, or CRP groups in a 1:1:1 ratio using a computer-generated sequence (minimization method; Figure 1). Stratification factors were sepsis severity (shock or not),8 recruitment site, and recent surgery (within 72 hours). Allocation was concealed by a centralized 24-hour web-based system (located at the Warwick Clinical Trials Unit), with randomization conducted by site research staff.
Figure 1. Recruitment, Randomization and Follow-Up in the ADAPT-Sepsis Trial.
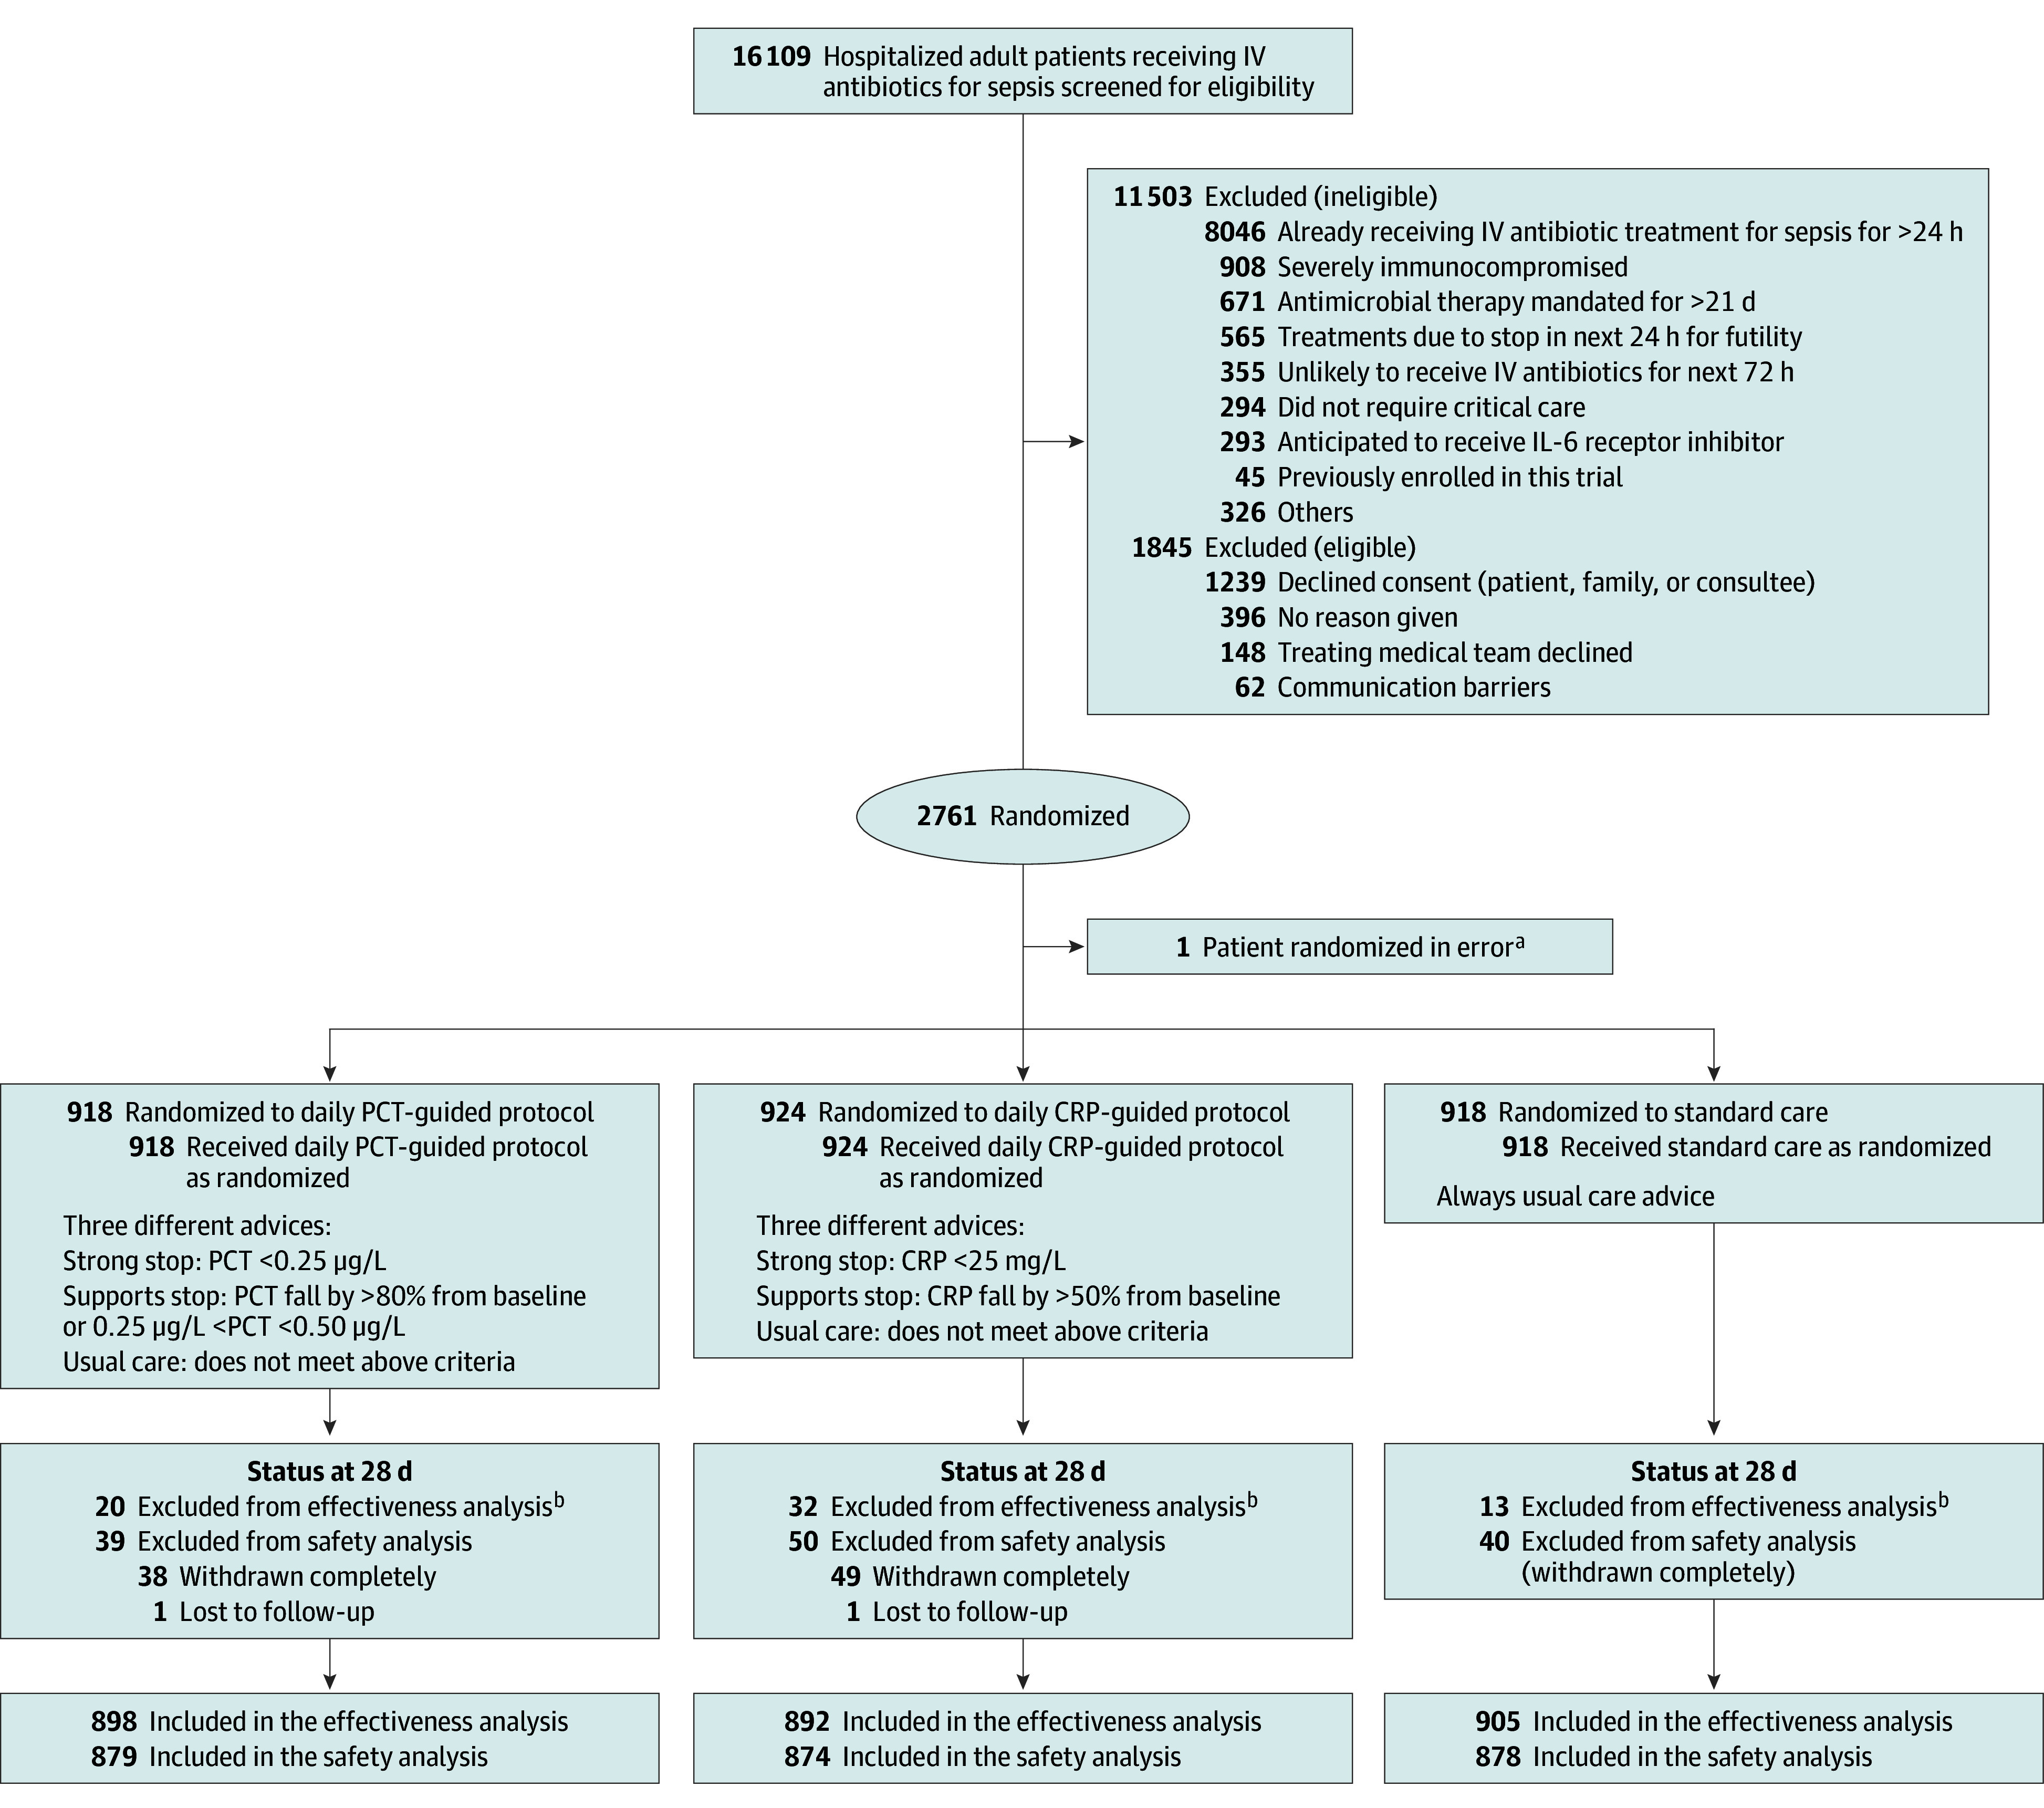
aNo data were collected for this patient.
bEleven patients withdrew completely from the trial by day 28 and requested removal of their data. In addition, data were missing and unobtainable from 54 patients.
CRP indicates C-reactive protein; IV, intravenous; and PCT, procalcitonin.
Interventions
Blood was drawn daily from trial patients from randomization until antibiotic discontinuation for the sepsis episode or hospital discharge. Clinicians responsible for managing patients received daily standardized written advice from the local research team on either standard care or on biomarker-guided antibiotic discontinuation. Advice was based on daily serum testing of PCT, CRP, or no test (standard care group). Patients received standard NHS care for sepsis and antibiotic stewardship, which followed national care service standards.10,11 The intervention phase consisted of daily research blood sampling and local NHS-quality-assured laboratory biomarker testing. Reporting of laboratory results was via a trial-specific centralized web-based system, leading to automated production of written treatment advice for the local clinical research team. The intervention phase continued until antibiotics were discontinued or the patient died or withdrew. The follow-up phase began when daily blood collection stopped. Research blood sampling did not resume if antibiotics were reintroduced within 28 days. If a patient was discharged from the hospital with a course of antibiotics for the initial sepsis episode, the trial intervention ceased at the time of discharge. Phlebotomy and samples followed local standard care practice. The antibiotic discontinuation protocols and advice are described in eTable 1 in Supplement 3.
Procalcitonin and C-Reactive Protein
For those assigned to 1 of the intervention arms, blood collection and serum biomarker laboratory testing (PCT or CRP) commenced within the first 24 hours of initiating intravenous antibiotics for sepsis. Based on evidence from national pretrial surveys of standard critical care in the UK, described in our trial protocol,7 CRP, but not PCT, could be measured outside of the study protocol if deemed necessary by the clinician but could not be used for protocolized antibiotic duration guidance. Daily patient reviews by the treating clinical team included documented decisions on antibiotic treatment guided by standard clinical assessment and review of microbiological culture results. Daily clinical reviews of patients also allowed incorporation of the intervention protocols for daily assessment of antibiotic discontinuation described in eTable 1 in Supplement 3.
Standard Care Group
For the standard care group, daily research blood samples were collected and transported to the laboratory. No CRP or PCT biomarker testing was performed, but there was standardized computer-generated treatment advice for the local clinical research team (eTable 1 in Supplement 3), time-delayed by the centralized web-based system to ensure maintenance of group concealment.
Routinely available laboratory data, such as white blood cell counts, remained part of standard care for each group.10
Intervention Concealment
Group assignment was available to the local laboratory service only through the trial-specific web-based system, concealed from patients, their relatives, clinical teams, and research staff. Research blood samples were allocated a unique research study number and were transported to the local hospital laboratory, until the antibiotics were discontinued. The research number did not reveal the identity of the patient, and biomarker measurement results were not recorded in the patient’s care record form or shared with the clinical team.
Procedure
The schedule of delivery and data collection are detailed in Supplement 3. Data were collected daily using a local paper clinical record form and a web-based data capture system. Ninety-day all-cause mortality status was collected from sites and validated against available linked NHS England mortality data. For patients discharged to another hospital or the community before day 28, the local site research team ensured data completeness.7 Disease severity was collected using the ICNARC (Intensive Care National Audit and Research Centre) Case Mix Program (England, Northern Ireland, and Wales) and Scottish equivalent (Scottish Intensive Care Society Audit Group).
Outcomes
The primary clinical effectiveness outcome was the total antibiotic duration (days), from randomization to 28 days. The primary safety outcome was the 28-day all-cause mortality.
Several secondary outcomes were evaluated: (1) antibiotic duration for initial sepsis period; (2) total antibiotic dose (defined daily dose); (3) antibiotic dose for initial sepsis period; (4) unscheduled escalation care or readmission; (5) infection relapse or recurrence requiring further antibiotic treatment; (6) superinfection defined as new infection at a different anatomical site; (7) suspected antibiotic adverse reactions; (8) time to fit for hospital discharge; (9) critical care unit length of stay; (10) hospital length of stay; and (11) all-cause mortality at 90 days. Adverse events (see Supplement 3) and trial process data were also obtained. Clinical effectiveness outcomes are reported herein; health economics and process evaluation will be detailed in subsequent articles.
Statistical Analysis
This study, using a sample size of 2760 patients, aimed to detect a 1-day reduction in total antibiotic duration (standard care mean: 7 [SD, 6] days, 90% power, 5% significance level, 5% withdrawal rate). The primary outcome focused on effectiveness, but safety was equally critical. For this reason, this study aimed to show noninferiority with a 5.4% safety margin (1-sided significance level, 2.5%12,13) assuming 28-day all-cause mortality of 15% in both treatment arms (Supplement 1 details the justification of the choice in these parameter estimates). Analyses followed an intention-to-treat approach.14 Each intervention arm was compared with standard care and no adjustments were made for multiple comparisons for the primary effectiveness outcome. All statistical analyses were conducted in Stata SE version 18.0 (StataCorp).15
The statistical analysis plan is provided in Supplement 2. For the primary outcome, linear mixed-effect regression models were fitted, adjusted for age, sex, and stratification factors (where recruiting site was a random effect). Several sensitivity analyses were carried out: (1) a per-protocol analysis, for which major protocol violations were excluded from the sample; (2) a complier average causal effect (CACE) analysis,16 adjusted for patients who withdrew from the intervention phase but remained in the study for follow-up; (3) imputation analysis, which accommodated for missing antibiotic treatment duration (Supplement 2); and (4) the Pocock win ratio test17 used to assess the competing risks of death, with death as the first event and duration of antibiotics as the second event, in the hierarchy of outcomes. Total duration of antibiotic therapy was displayed using Kaplan-Meier curves, and bayesian probabilities were also reported using an uninformative prior distribution.
The primary safety outcome was assessed using a mixed-effect logistic regression model. From this model, 95% CIs in proportions between the treatments were obtained. For the adjusted models, the standard error was obtained using bootstrapping methods.18,19 As per guidance for noninferiority trials,20 inferiority was declared if P < .025 and the lower bound of the 95% CI exceeded the margin.12,13 A post hoc per-protocol analysis was also conducted (for which per protocol was defined as for the primary analysis).
Secondary outcomes were analyzed using mixed-effects linear and logistic regression models, with additional analyses for SARS-CoV-2 impact and serious adverse events. For the categorical outcomes, for which absolute and relative differences were reported, bootstrapping methods18,19 were used to obtain the standard errors for the CIs. Prespecified subgroup analyses included community-acquired pneumonia (yes/no), hospital-acquired pneumonia (yes/no), urinary tract infection (yes/no), intra-abdominal infection (yes/no), positive blood culture infection (yes/no), community-acquired and hospital-acquired infections and SARS-CoV-2 (yes/no); sepsis and septic shock; ward and critical care unit (intervention stopped); and surgery and nonsurgery previous 72 hours. These subgroups were carried out using the duration of antibiotics up to 28 days and the initial sepsis period (post hoc analysis). Subgroup analyses were conducted using linear regression models with interaction terms and 99% CIs.
Results
Patient Characteristics
From January 1, 2018, to June 5, 2024, a total of 16 109 patients were screened for eligibility for the trial in 41 UK critical care units. Of these, 2761 patients (17.1%) were enrolled into the study; 1 patient was removed due to an error in randomization. Of the remaining, 918 (33.3%) were assigned to standard care, 918 (33.3%) to the daily PCT-guided protocol, and 924 (33.4%) to the daily CRP-guided protocol. One hundred twenty-seven patients (4.6%) completely withdrew from the study prior to 28 days, and these were similar across the interventions (Figure 1; eTables 9 and 12 in Supplement 3). In total, 364 patients (13.2%) withdrew from the intervention phase but remained in the study for follow-up (eTable 12 in Supplement 3).
Patients in the 3 groups had similar demographic and baseline characteristics (Table 1). The overall mean age was 60.2 [SD, 15.4] years, with 1657 (60.3%) males. The mean Acute Physiology and Chronic Health Evaluation II (APACHE II) score was 17.3 [SD, 6.5], and virtually all the patients would have met the Sepsis-3 criteria for the diagnosis of sepsis (SOFA score, 7 [IQR 5-9]).8 There were 1397 patients (50.8%) with sepsis and 1352 (49.2%) with septic shock.
Table 1. Demographics and Clinical Characteristics of the Randomized Patientsa.
| Characteristics | Daily PCT-guided protocol (n = 918) | Daily CRP-guided protocol (n = 924) | Standard care (n = 918) |
|---|---|---|---|
| Age, mean (SD), y [No.] | 60.6 (15.2) [914] | 60.3 (15.6) [918] | 59.8 (15.3) [915] |
| Sex, No. (%) | 915 | 918 | 915 |
| Female | 354 (38.7) | 366 (39.9) | 371 (40.6) |
| Male | 561 (61.3) | 552 (60.1) | 544 (59.5) |
| Critical admission care category, No. (%) | 908 | 912 | 913 |
| Medical | 563 (62.0) | 558 (61.2) | 552 (60.5) |
| Emergency surgical | 245 (27.0) | 251 (27.5) | 253 (27.7) |
| Elective surgical | 73 (8.0) | 73 (8.0) | 73 (8.0) |
| Other | 27 (3.0) | 30 (3.3) | 35 (3.8) |
| Origin, No. (%) | 907 | 911 | 913 |
| Emergency department | 542 (59.8) | 525 (57.6) | 556 (60.9) |
| Surgical ward | 106 (11.7) | 110 (12.1) | 97 (10.6) |
| Medical ward | 99 (10.9) | 92 (10.1) | 83 (9.1) |
| Operating department | 66 (7.3) | 78 (8.6) | 77 (8.4) |
| Emergency assessment unitb | 21 (2.3) | 39 (4.3) | 35 (3.8) |
| Another critical care unit | 30 (3.3) | 27 (3.0) | 28 (3.1) |
| Otherc | 43 (4.7) | 40 (4.4) | 37 (4.1) |
| Place of acquired infection causing sepsis, No. (%) | 904 | 904 | 907 |
| Community acquired | 612 (67.7) | 616 (68.1) | 618 (68.1) |
| Hospital acquired | 292 (32.3) | 288 (31.9) | 289 (31.9) |
| Presumed site of infection causing sepsis, No. (%)d | |||
| Respiratory tract | 437 (48.3) | 447 (49.5) | 451 (49.6) |
| Intra-abdominal | 230 (25.5) | 208 (23.0) | 198 (21.8) |
| Urinary tract | 124 (13.7) | 109 (12.1) | 118 (13.0) |
| Unknown focus | 98 (10.9) | 104 (11.5) | 96 (10.6) |
| Bloodstream | 84 (9.3) | 90 (10.0) | 84 (9.3) |
| Skin and soft tissue | 69 (7.6) | 73 (8.1) | 88 (9.7) |
| Central nervous system | 31 (3.4) | 32 (3.5) | 20 (2.2) |
| Ear, nose, and throat | 19 (2.1) | 19 (2.1) | 29 (3.2) |
| Central-line–related infection | 15 (1.7) | 9 (1.0) | 15 (1.7) |
| Not categorized | 42 (4.7) | 45 (5.0) | 42 (4.6) |
| Causative microorganism identified for the infection causing sepsis, No./total (%) | 422/901 (46.8) | 411/901 (45.6) | 428/904 (47.4) |
| Baseline core body temperature, mean (SD), °C [No.] | 37.2 (1.4) [904] | 37.2 (1.4) [904] | 37.2 (1.4) [906] |
| Baseline white blood cell count, mean (SD), ×109/L [No.] | 15.7 (9.3) [907] | 15.9 (9.8) [909] | 15.7 (9.8) [911] |
| Sepsis severity, No. (%) | 915 | 918 | 916 |
| Sepsis | 465 (50.8) | 466 (50.8) | 466 (50.9) |
| Septic shock | 450 (49.2) | 452 (49.2) | 450 (49.1) |
| Surgery within last 72 h, No./total (%) | 256/915 (28.0) | 258/918 (28.1) | 256/916 (28.0) |
| SOFA score (5 items), median (IQR) [No.]e | 7.0 (5.0-9.0) [836] | 7.0 (5.0-9.0) [839] | 7.0 (5.0-9.0) [841] |
| APACHE II, mean (SD) [No.]e | 17.5 (6.5) [811] | 17.3 (6.4) [825] | 17.2 (6.5) [810] |
Abbreviations: APACHE, Acute Physiology and Chronic Health Evaluation; CRP, C-reactive protein; PCT, procalcitonin; SOFA, Sequential Organ Failure Assessment.
The column percentage sums may not sum to 100 because of rounding.
Provides short-stay hospital care for up to 72 hours to allow for early assessment and treatment to adult patients, who are referred by their family physician directly from the community or by an emergency physician from the emergency department.
Others includes transfer from another hospital (n = 49), hospital ward (n = 49), ambulatory care clinic (n = 8), and interventional radiology (n = 14).
Multiple response per patient, so the sum is more than 100%.
The SOFA score range, 0 (best) to 20 (worst); APACHE outcomes score range, 0 (best) to 71 (worst). A SOFA score of 7 and/or APACHE II score of 17 indicates severe organ dysfunction and a high mortality risk, with potential respiratory failure, cardiovascular instability, acute kidney injury, liver dysfunction, altered consciousness, and severe coagulopathy.
Implementation of Intervention Protocols
Site monitoring revealed very low use of open PCT measurements (eTable 27 in Supplement 3), and there was no evidence of open protocolized daily CRP-guided antibiotic duration decisions in this intervention-concealed trial. The daily PCT and CRP protocols were implemented into routine sepsis care, with concealed nonmandated advice on standard care and antibiotic discontinuation produced as summarized in Figure 2 (with additional data in eTables 29 and 30 and eFigure 6 in Supplement 3). No stop or strong stop advice was produced for the standard care group. Stop advice production was similar for both biomarker intervention groups. However, strong stop advice was more common and produced earlier for the PCT-protocol compared with the CRP-protocol.
Figure 2. Indicative Maps of Patient Care Pathways.
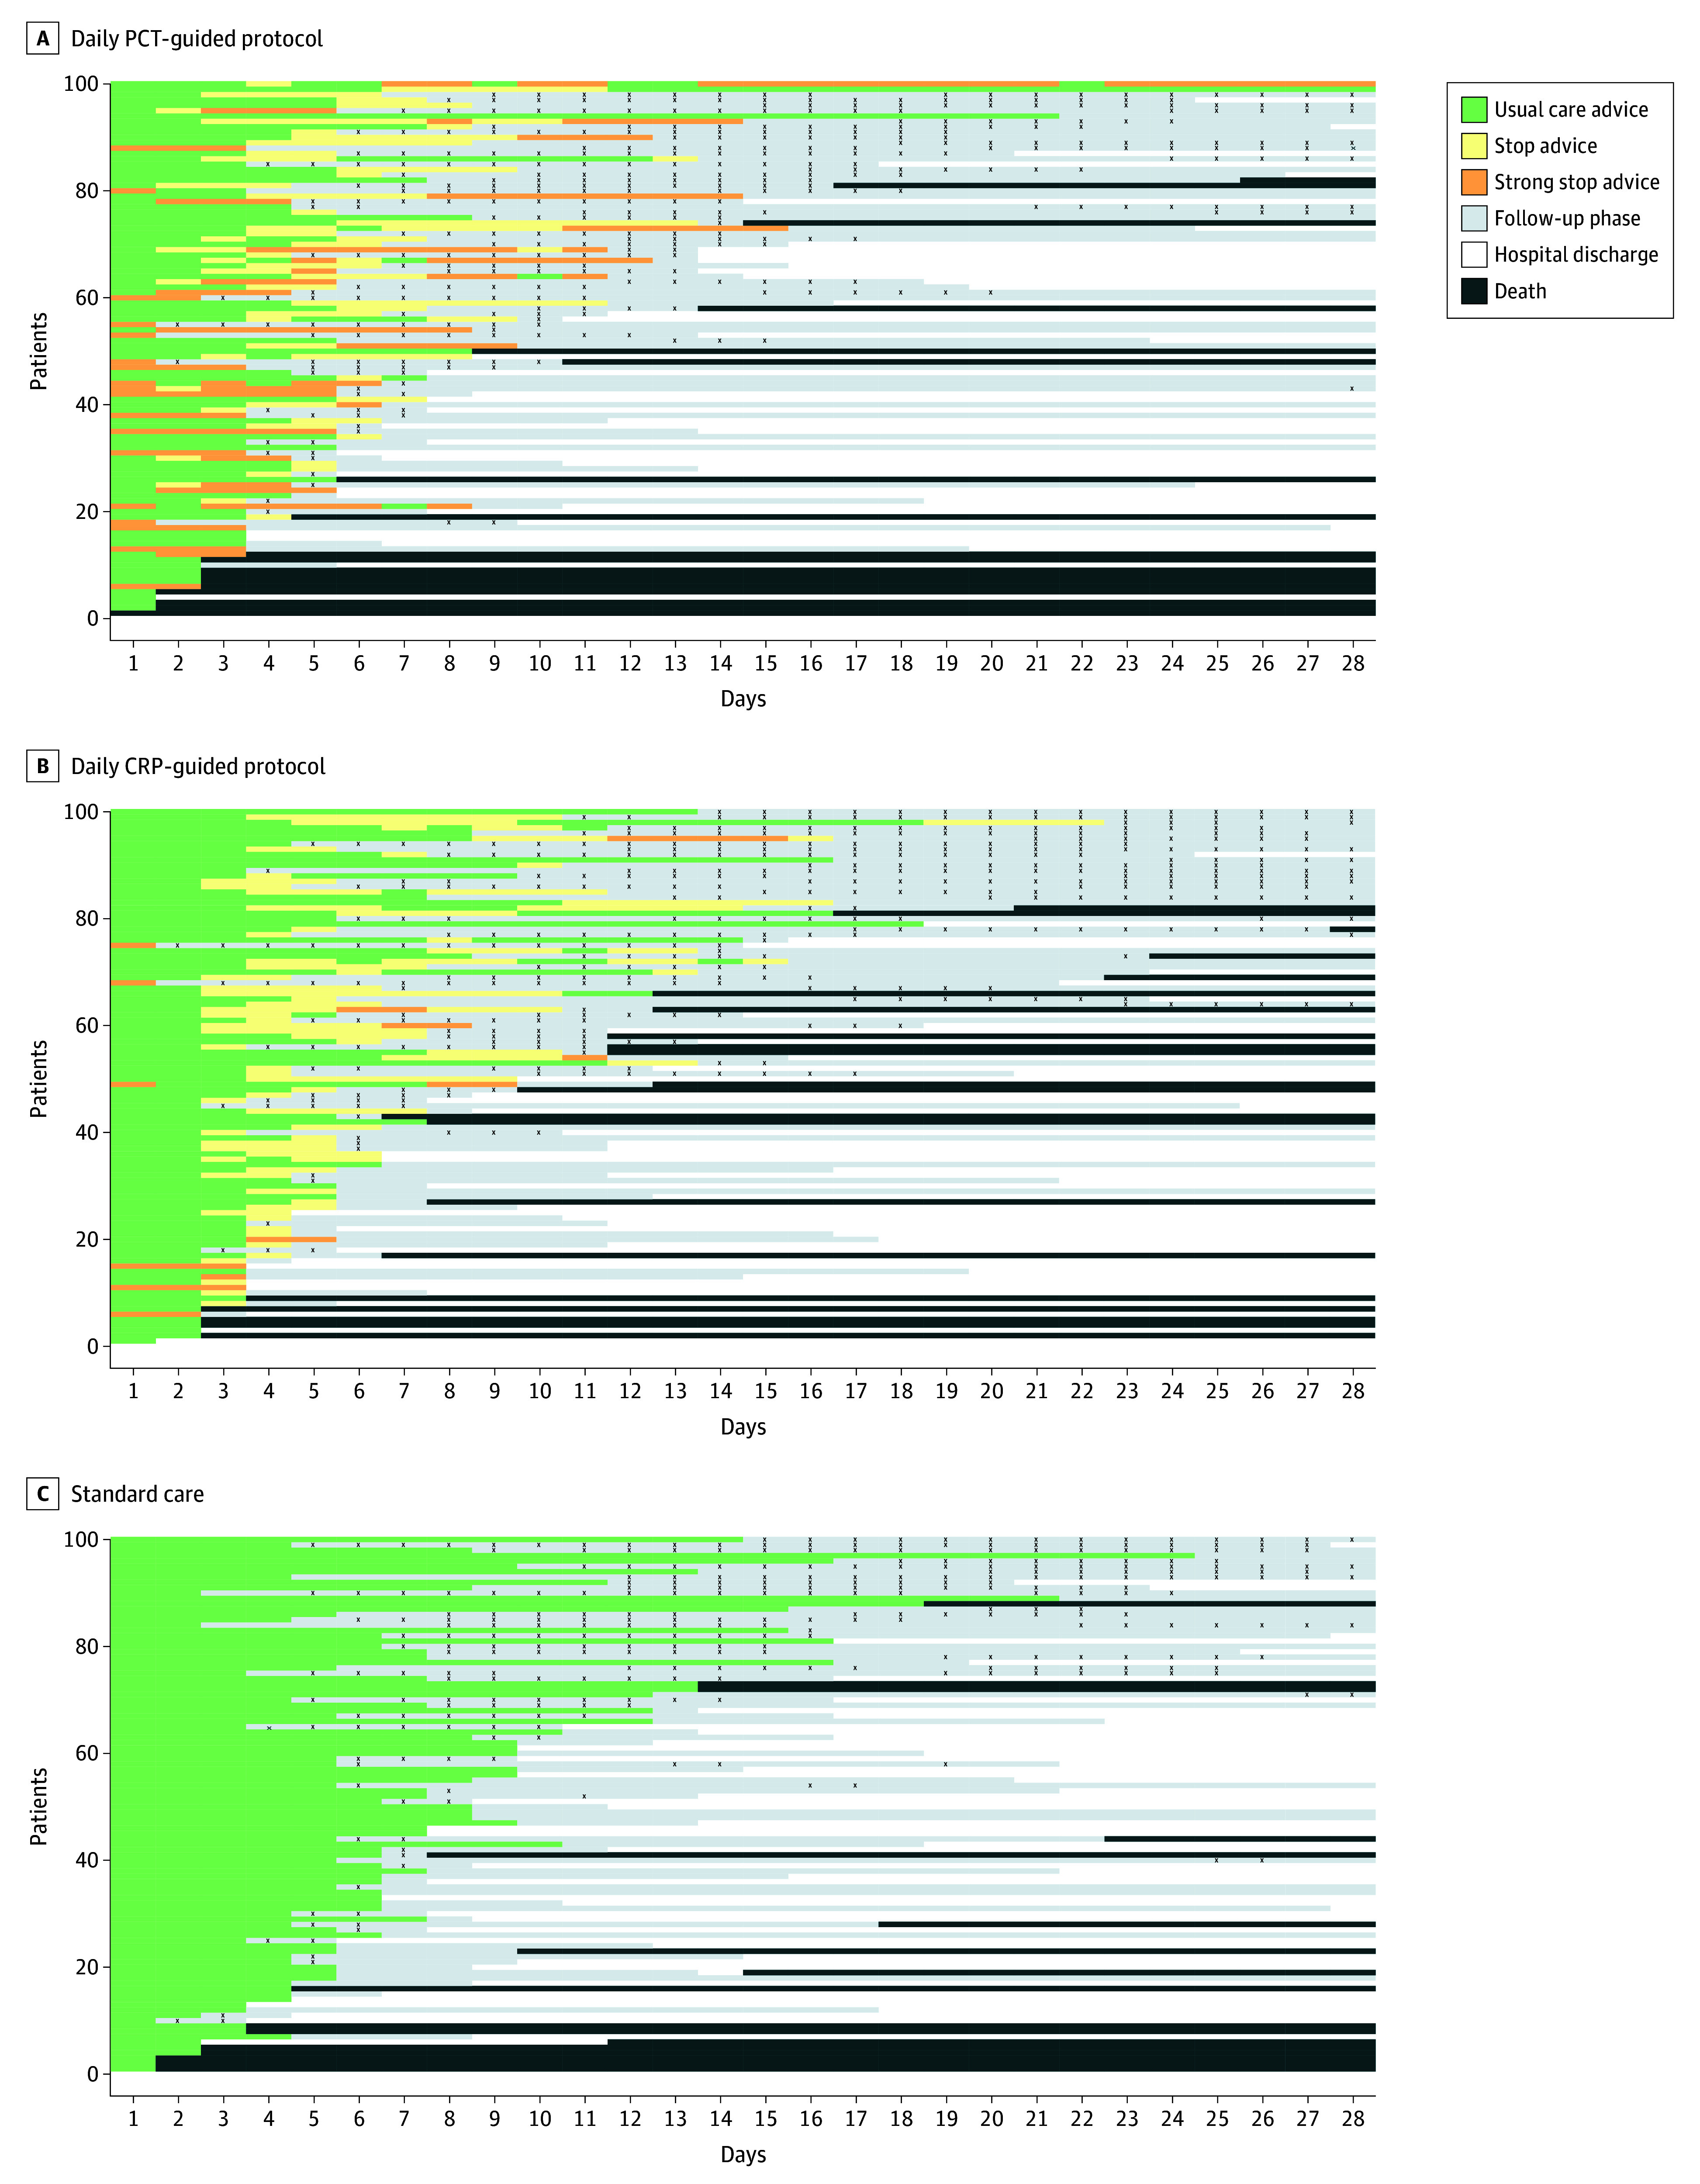
Trial patients were drawn at random (100 per group) and shown to indicate their care pathways from randomization to day 28 in each group. When antibiotics were stopped and protocol advice ended, the patient entered the follow-up phase or was discharged from the hospital. Any antibiotics administered during the follow-up phase are shown by black X’s. Patients in each panel are ordered by length of total antibiotics from randomization to day 28.
Primary and Secondary Efficacy Outcomes
Primary outcome data were available on 898 patients (97.8%) for the daily PCT-guided protocol, 892 (96.5%) for the daily CRP-guided protocol, and 905 (98.6%) for standard care groups. Compared with standard care, there was a significant reduction in the total duration of antibiotic treatment from randomization to 28 days for the daily PCT-guided protocol (mean total duration, 10.7 [7.6]) days for standard care and 9.8 [SD, 7.2] days for daily PCT-guided protocol; mean difference, 0.88 days; 95% CI, 0.19 to 1.58; P = .01). No difference was seen between standard care and daily CRP-guided protocol (mean total duration, 10.6 [SD, 7.7] days for daily CRP-guided protocol; mean difference, 0.09 days; 95% CI, −0.60 to 0.79; P = .79; Table 2 and Figure 3A). Results were similar in the adjusted analyses (eTable 18 in Supplement 3) and for all sensitivity analyses, including accounting for those who died within 28 days (Table 2). The bayesian analyses illustrated that the probability of a mean difference in favor of the daily PCT-guided protocol of more than 0.5 days was 0.85 and for daily CRP-guided protocol being more than 0.5 days was 0.13, respectively (eTables 19 and 20 in Supplement 3 for further estimates).
Table 2. Primary and Secondary Outcomes.
| Outcomes | Daily PCT-guided protocol (n = 918) | Daily CRP-guided protocol (n = 924) | Standard care (n = 918) | Unadjusted treatment effect (95% CI) | |||
|---|---|---|---|---|---|---|---|
| Standard care vs daily PCT-guided protocol | P valuea | Standard care vs daily CRP-guided protocol | P valuea | ||||
| Primary outcomes | |||||||
| Effectiveness | |||||||
| Total antibiotic treatment duration to 28 d after randomization, mean (SD), d [No.] | 9.8 (7.2) [898] | 10.6 (7.7) [892] | 10.7 (7.6) [905] | MD: 0.88 (0.19 to 1.58) | .01 | MD: 0.09 (−0.60 to 0.79) | .79 |
| Safety | |||||||
| 28-d All-cause mortality, No./total (%)b | 184/879 (20.9) | 184/874 (21.1) | 170/878 (19.4) | AD: 1.57 (−2.18 to 5.32) | .02c | AD: 1.69 (−2.07 to 5.45) | .03c |
| Sensitivity analysis | |||||||
| Per-protocol analysis for both effectiveness and safety outcomes | |||||||
| Effectiveness: total antibiotic treatment duration to 28 d after randomization, mean (SD), days [No.] | 9.8 (7.2) [880] | 10.6 (7.7) [874] | 10.7 (7.6) [891] | MD: 0.86 (0.16 to 1.56), | .02 | MD: 0.05 (−0.65 to 0.75) | .88 |
| Safety: 28-d all-cause mortality, No./total (%) | 176/860 (20.5) | 182/854 (21.3) | 166/864 (19.2) | AD: 1.25 (−2.51 to 5.02) | .02c | AD: 2.10 (−1.70 to 5.90) | .04c |
| CACE analysis for the effectiveness outcome | MD: 1.00 (0.22 to 1.77) | .01 | 0.10 (−0.70 to 0.91) | .81 | |||
| Imputation analysis, mean (SD) [No.] | 9.8 (7.3) [915] | 10.6 (7.9) [918] | 10.8 (7.7) [916] | MD: 0.99 (0.29 to 1.69) | .005 | MD: 0.15 (−0.55 to 0.85) | .67 |
| Pocock win ratiod | Odds: 1.12 (1.00 to 1.25) | .04 | Odds: 0.98 (0.88 to 1.10) | .77 | |||
| Secondary outcomes | |||||||
| Antibiotic treatment duration for initial sepsis period, mean (SD), days [No.] | 7.0 (5.7) [893] | 7.4 (6.0) [889] | 8.1 (6.1) [902] | MD: 1.13 (0.58 to 1.68) | MD: 0.71 (0.16 to1.26) | ||
| Antibiotic dose from randomization until 28-d, median (IQR), DDD | 11.5 (6.0 to 19.1) [797] | 12.0 (6.0 to 20.1) [773] | 11.0 (5.8 to 19.8) [760] | ||||
| Antibiotic dose for sepsis period, median (IQR), DDD [No.] | 8.0 (4.0 to 14.0) [851] | 8.0 (4.2 to 15.0) [830] | 9.0 (4.8 to 17.0) [823] | ||||
| Unscheduled care escalation or readmission | |||||||
| No. of events | 314 | 349 | 365 | ||||
|
|
|
|
|
|
||
| Time to first deemed fit for hospital discharge, mean (SD), d [No.] | 12.5 (7.9) [190] | 13.0 (6.9) [215] | 12.4 (7.2) [194] | MD: −0.09 (−1.56 to 1.38) | MD: −0.59 (−2.02 to 0.83) | ||
| Time to hospital discharge (survivors), mean (SD), d [No.] | 12.6 (6.8) [439] | 12.6 (6.9) [441] | 12.7 (6.8) [436] | MD: 0.10 (−0.81 to 1.01) | MD: 0.11 (−0.80 to 1.02) | ||
| Length of ICU stay, median (IQR), [No.] | 6.2 (3.1 to 12.3) [763] | 6.0 (3.1 to 11.9) [771] | 5.8 (3.0 to 12.4) [762] | ||||
| Infection relapse or recurrence requiring further antibiotic treatment | |||||||
| Events, No. | 15 | 8 | 5 | ||||
| ≥1 Event, No./total (%) | 11/908 (1.2) | 5/908 (0.6) | 5/913 (0.5) |
|
|
||
| New infection or superinfection at a different anatomical site | |||||||
| No. of events | 41 | 39 | 32 | ||||
| ≥1 Event, No./total (%) | 29/908 (3.2) | 27/908 (3.0) | 24/913 (2.6) |
|
|
||
| Suspected clinically relevant antibiotic-related events | |||||||
| No. of events | 118 | 137 | 118 | ||||
| ≥1 Event, No./ (%) | 71/888 (8.0) | 77/894 (8.6) | 70/900 (7.8) |
|
|
||
| 90-d All-cause mortality, No./total (%) | 217/847 (25.6) | 223/846 (26.4) | 215/842 (25.5) |
|
|
||
Abbreviations: AD, absolute difference; CACE, complier average causal effect; DDD, defined daily dose; ICU, intensive care unit; MD, mean difference; OR, odds ratio; RD, relative difference.
P values for primary outcomes analyses only.
For 28-day all-cause mortality, the comparisons are made as daily PCT-guided protocol vs standard care, and daily CRP-guided protocol vs standard care.
P values of the test if the RD is less than or equal to the prespecified margin 5.4% (significance level = .025).
Using 28-day all-cause mortality status and total antibiotic duration to 28 days after randomization. The win-ratio is the odds that the intervention treatment wins for any randomly chosen patients’ pair (intervention vs control).
Figure 3. Kaplan-Meier Curves for Probability of Antibiotic Duration and Mortality to 28 Days.
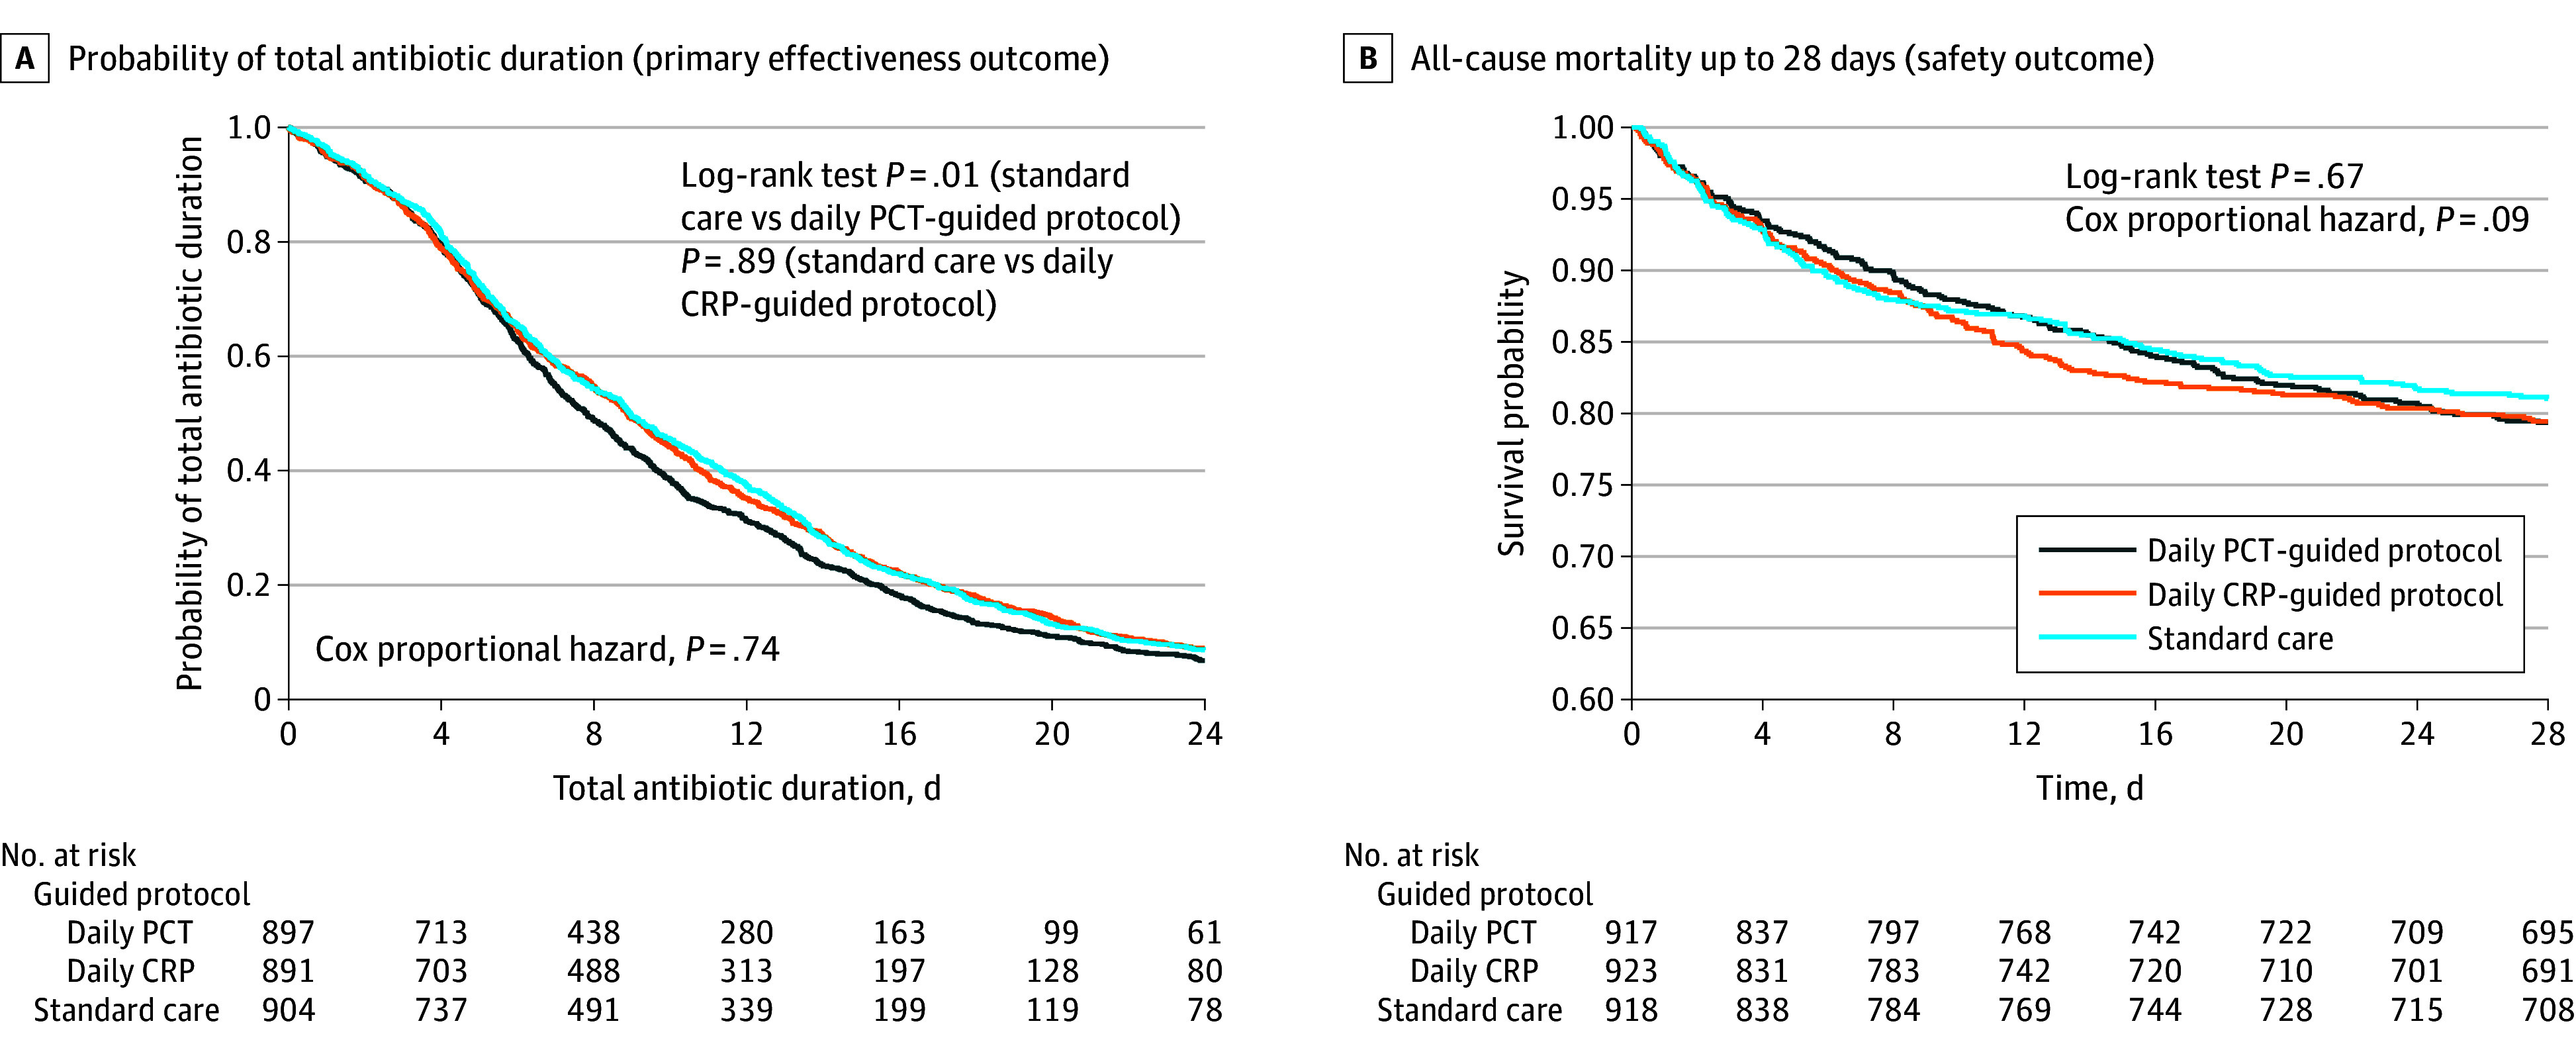
The medians of the total antibiotic treatment duration up to 28 days for each of the 3 groups are 7.8 (IQR, 4.5-13.6) days for the daily procalcitonin (PCT)–guided protocol, 8.9 (IQR, 4.5-14.9) days for the daily C-reactive protein (CRP)–guided protocol, and 9.0 (IQR, 4.7-14.6) days for standard care.
There was also a significant reduction in the duration of antibiotics for the initial sepsis period, with the difference favoring the biomarker protocols as opposed to standard care (daily PCT-guided protocol: mean difference, 1.13 days; 95% CI, 0.58 to 1.68 and daily CRP-guided protocol: mean difference, 0.71 days; 95% CI, 0.16 to 1.26). For the other secondary outcomes, there was no statistical evidence in intervention effects when compared with standard care. Regarding additional analyses, the summary statistics for patients recruited before and after SARS-CoV-2 are presented in eTables 22 and 23 in Supplement 3. It is worth noting that there were only 19 trial patients included with a SARS-CoV-2 virus infection during the study.
Safety Outcomes
The 28-day all-cause mortality for the daily PCT-guided protocol was noninferior to standard care (mortality, 19.4% [170 of 878] for standard care, 20.9% [184 of 879] for PCT; absolute difference, 1.57; 95% CI, −2.18 to 5.32; P = .02; comparisons are made with P = .025). However, the treatment difference for the daily CRP-guided protocol was inconclusive with regards to noninferiority (mortality, 19.4% [170 of 878] for standard care, 21.1% [184of 874] for CRP; absolute difference, 1.69; 95% CI, −2.07 to 5.45; P = .03); Table 2 and eFigure 1 in Supplement 3). Results were supported by the per-protocol (Table 2) and the adjusted analyses (eTable 18 and eFigure 1 in Supplement 3). There were 9 serious adverse events equally distributed across the treatment and standard care arms (eTables 25 and 26 in Supplement 3). There were no differences in all-cause mortality at 90 days when comparing each intervention group with the control group (Table 2).
Kaplan-Meier survival curves show no differences when comparing each intervention group with standard care for all-cause mortality to day 28 (Figure 3B) and to day 90 (eFigure 7 in Supplement 3).
Prespecified Subgroup Analyses
The effect of the 2 protocols on the duration of antibiotic treatment was not significantly modified by any of the baseline characteristics defining the prespecified subgroups (eFigures 2 and 3 in Supplement 3) and for the initial sepsis period (eFigures 4 and 5 in Supplement 3). Similar results were produced for unadjusted and adjusted subgroup analyses.
Discussion
In hospitalized critically ill adult patients with suspected sepsis, a daily PCT biomarker-guided antibiotic discontinuation protocol, but not CRP-guided protocol, resulted in safe reductions in total antibiotic duration when compared with standard care. Noninferiority for 28-day all-cause mortality, the primary safety outcome, was met for the daily PCT-guided protocol.
Secondary outcomes suggest that antibiotic duration for the initial sepsis period was significantly reduced by both daily PCT-guided and daily CRP-guided protocols, with greater reductions for PCT. According to our primary outcomes, these initial antibiotic duration reductions are not present by the end of the trial period (28 days from randomization) for the daily CRP-guided protocol group, but there remain significant total antibiotic duration reductions for the daily PCT-guided protocol group, when compared with standard care. Supported by data on the implementation of these protocols, it is likely that the differential clinical effectiveness findings for daily PCT-guided and daily CRP-guided protocols are explained by the differences in the utility of these biomarkers to track inflammation caused by bacterial infection in the setting of critical illness, where PCT concentrations are known to increase earlier and normalize more rapidly than CRP in response to treatment.21
There are several important strengths to this study. This multicenter trial was designed to inform international guidance1 for both daily PCT- and CRP-guided antibiotic discontinuation protocols for sepsis. The intervention concealment strategy was successfully delivered to minimize risk of bias, rigorously testing biomarker-guided protocols within standard sepsis care and antibiotic stewardship. The vast majority of enrolled study patients would have met the Sepsis-3 criteria for the diagnosis of sepsis.8 This trial addressed 2 important areas: (1) the use of total antibiotic duration from randomization to day 28 to embrace the possibility that biomarker-guided reductions in initial antibiotic duration for sepsis may result in later antibiotic use; and (2) the use of primary outcomes that embraced total antibiotic duration (effectiveness) and all-cause mortality (safety). The design of the biomarker protocols was informed by the best available evidence published in advance of the trial.7
The daily PCT-guided protocol’s safe reductions in antibiotic duration, though seemingly modest, are equivalent to the current synthesized evidence for PCT-guided duration effects from open-label clinical trials using PCT.4 The duration reduction is of the order of 10% in antibiotic use for sepsis, which could provide significant cost and labor savings, and might also reduce the development of antimicrobial resistance.
Limitations
The trial protocol and concealed interventions provided high-quality evidence required to confidently assess biomarker-guided antibiotic protocols in standard sepsis care. However, there are a number of potential limitations to the study design. First, it is possible that the concealment strategy could have led clinicians to stop antibiotics later in the standard care group while awaiting the return of stop advice. Reassuringly, the measured standard care antibiotic duration for the initial sepsis period was less than the synthesized standard care mean reported from current open-label biomarker-guided trials.4 Second, patient-level randomization in this study could have led to contamination because treatment protocols and standard care were carried out in a shared environment. The complete elimination of these effects would be challenging and not pragmatic in this care setting. A cluster-randomized trial design was considered initially, which resulted in a much larger sample size and other care process challenges, making the study infeasible; therefore, this was not adopted. It is anticipated that, in this trial, a strategy to conceal group assignment and daily biomarker results, and the use of remote centralized hospital laboratories at each site, has gone a long way to eliminate the bias created by a potential for contamination. Third, it remains unclear whether allowing clinicians to monitor CRP as part of standard care, outside of the trial concealed daily biomarker protocols, impacted trial results. Any effects would have been mitigated by the intervention-concealed nature of the trial and across all 3 randomized groups. Further analysis of this potential limitation is planned as part of a subsequent trial process evaluation. Fourth, for the pairwise comparisons, where treatment arms were compared to standard care, no statistical adjustments were applied to the results for multiple comparisons. Had the correction been applied retrospectively, where each pairwise comparison was based on a P value of .025 (using a Bonferroni correction, for 2 tests), the conclusions of the study would not have altered.
The ADAPT-Sepsis trial strengthens substantially international recommendations for the routine use of protocolized daily PCT-guided antibiotic discontinuation in critically ill adults with sepsis.1 and no evidence was found to recommend protocolized daily CRP-guided antibiotic discontinuation. Critically ill patients recruited to this trial had already commenced antibiotics for sepsis, so this study does not provide evidence for biomarker use in initiating antibiotic therapy. In addition, this clinical research evidence was generated within a high-income country; therefore, it is unclear if this evidence is generalizable to low-resource settings.
Conclusions
In critically ill hospitalized adults with sepsis, there is a significant safe reduction in the total antibiotic days when a daily PCT-guided protocol is administered compared with standard care. A daily CRP-guided protocol does not reduce the total duration of antibiotics.
Section Editor: Christopher Seymour, MD, Associate Editor, JAMA (christopher.seymour@jamanetwork.org).
Trial protocol
Statistical analysis plan
eMethods
eSection 1. ADAPT-Sepsis sites, collaborators and investigators
eSection 2. Acknowledgments
eSection 3. Competing interests disclosure
eSection 4. Eligibility criteria: inclusion and exclusion
eSection 5. Clinical trials which co-enrolled with ADAPT-Sepsis
eSection 6. Schedule of delivery of intervention and data collection
eSection 7. Adverse event reporting
eTable 1. Trial biomarker-guided antibiotic discontinuation protocol
eTable 2. UK sites recruitment for ADAPT Sepsis (2017-24 Recruitment target met on 5th June 2024)
eTable 3. Reasons for non-randomisation by each site
eTable 4. Reasons for non-enrollment key
eTable 5. Randomised participants summarised by treatment and randomisation strata1 sepsis severity
eTable 6. Randomised participants summarised by treatment and randomisation strata1 surgery within last 72 hours
eTable 7. Randomised participants summarised by recruiting site
eTable 8. Additional demographics and clinical characteristics of the randomised patients
eTable 9. Number of participants withdrawn completely throughout the trial
eTable 10. Number of deaths throughout the trial
eTable 11. 28-days all-cause mortality status across the treatment arms
eTable 12. Overall summary of withdrawals by treatment arm
eTable 13. Time from randomisation to death, withdrawal and follow-up summarised by treatment arm
eTable 14. Daily data collection – summary of patient status
eTable 15. Summary of discharge data by treatment arm
eTable 16. Summary of readmission data by treatment arm
eTable 17. Initial care bundle at baseline summarised by treatment arm
eTable 18. Primary and secondary outcomes (adjusted analysis)
eTable 19. Adjusted and unadjusted estimate of treatment effect with 95% credible interval using bayesian analysis
eTable 20. The probabilities the mean difference using posterior distribution
eTable 21. SOFA score at day 3 and day 7
eTable 22. Additional analyses: baseline demographic characteristics comparing participants recruited pre- sars-cov-2 period versus post- sars-cov-2 periods
eTable 23. Additional analysis: summary of primary outcomes (effectiveness and safety) among participants recruited pre- sars-cov-2 period and post- SARS-CoV-21 periods
eTable 24. Summary of suspected clinically relevant antibiotic related events
eTable 25. Serious adverse events (SAE) summarised by treatment arm
eTable 26. Serious adverse events (relatedness and expectedness) by treatment arm occurring over 28 days
eTable 27. Summary of the protocol deviations events by treatment arm occurring over 28 days
eTable 28. Summary of the protocol violations events by treatment arm occurring over 28 days
eFigure 1. Diagram illustrating non-inferiority margins and 95% ci of difference in proportions for the 28-day all-cause mortality outcome
eFigure 2. Forest plots of subgroup analysis for duration of antibiotics to 28 days (unadjusted mean difference, 99% ci, and interaction p-values)
eFigure 3. Forest plots of subgroup analysis for duration of antibiotics to 28 days (adjusted mean difference, 99% ci, and interaction p-values)
eFigure 4. Forest plots of subgroup analysis for duration of antibiotics in the sepsis period (unadjusted mean difference, 99% ci, and interaction p-values)
eFigure 5. Forest plots of subgroup analysis for duration of antibiotics in the sepsis period (adjusted mean difference, 99% ci, and interaction p-values)
eTable 29. Duration in days between randomization and first stop/strong stop advice
eFigure 6. Advice (usual care, suggest stop, strong advice) produced each day (from randomisation to 28 days) by intervention arm
eTable 30. Advice (usual care, suggest stop, strong advice) produced each day (from randomisation to 28 days) by intervention arm
eFigure 7. Kaplan-Meier curve for all-cause mortality up to 90 days
Nonauthor collaborators
Data sharing statement
References
- 1.Evans L, Rhodes A, Alhazzani W, et al. Surviving sepsis campaign: international guidelines for management of sepsis and septic shock 2021. Intensive Care Med. 2021;47(11):1181-1247. doi: 10.1007/s00134-021-06506-y [DOI] [PMC free article] [PubMed] [Google Scholar]
- 2.Albrich WC, Harbarth S. Pros and cons of using biomarkers versus clinical decisions in start and stop decisions for antibiotics in the critical care setting. Intensive Care Med. 2015;41(10):1739-1751. doi: 10.1007/s00134-015-3978-8 [DOI] [PubMed] [Google Scholar]
- 3.Hellyer TP, Mantle T, McMullan R, Dark P. How to optimise duration of antibiotic treatment in patients with sepsis? BMJ. 2020;371:m4357. doi: 10.1136/bmj.m4357 [DOI] [PubMed] [Google Scholar]
- 4.Wirz Y, Meier MA, Bouadma L, et al. Effect of procalcitonin-guided antibiotic treatment on clinical outcomes in intensive care unit patients with infection and sepsis patients: a patient-level meta-analysis of randomized trials. Crit Care. 2018;22(1):191. doi: 10.1186/s13054-018-2125-7 [DOI] [PMC free article] [PubMed] [Google Scholar]
- 5.Westwood M, Ramaekers B, Whiting P, et al. Procalcitonin testing to guide antibiotic therapy for the treatment of sepsis in intensive care settings and for suspected bacterial infection in emergency department settings: a systematic review and cost-effectiveness analysis. Health Technol Assess. 2015;19(96):v-xxv, 1-236. doi: 10.3310/hta19960 [DOI] [PMC free article] [PubMed] [Google Scholar]
- 6.Andriolo BN, Andriolo RB, Salomão R, Atallah ÁN. Effectiveness and safety of procalcitonin evaluation for reducing mortality in adults with sepsis, severe sepsis or septic shock. Cochrane Database Syst Rev. 2017;1(1):CD010959. doi: 10.1002/14651858.CD010959.pub2 [DOI] [PMC free article] [PubMed] [Google Scholar]
- 7.Dark P, Perkins GD, McMullan R, et al. Biomarker-guided Duration of Antibiotic treatment in hospitalised Patients with Suspected Sepsis (ADAPT-Sepsis): a protocol for a multicentre randomised controlled trial. J Intensive Care Soc. 2023;24(4):427-434. doi: 10.1177/17511437231169193 [DOI] [PMC free article] [PubMed] [Google Scholar]
- 8.Singer M, Deutschman CS, Seymour CW, et al. The Third International Consensus Definitions for Sepsis and Septic Shock (Sepsis-3). JAMA. 2016;315(8):801-810. doi: 10.1001/jama.2016.0287 [DOI] [PMC free article] [PubMed] [Google Scholar]
- 9.Procalcitonin testing for diagnosing and monitoring sepsis (ADVIA Centaur BRAHMS PCT assay, BRAHMS PCT Sensitive Kryptor assay, Elecsys BRAHMS PCT assay, LIAISON BRAHMS PCT assay and VIDAS BRAHMS PCT assay). National Institute of Health and Care Excellence . October 7, 2015. Accessed August 26, 2024. https://www.nice.org.uk/guidance/dg18
- 10.Public Health England . Start smart—then focus: antimicrobial stewardship toolkit for English hospitals. PHE publications gateway number: 2014828. March 2015. Accessed August 26, 2024. https://www.ficm.ac.uk/sites/ficm/files/documents/2021-10/FICM-Start_Smart_Then_Focus_FINAL.pdf
- 11.Guidelines for the Provision of Intensive Care Services—Version 2.1. Faculty of Intensive Care Medicine. June 2022. Accessed August 26, 2024. https://www.ficm.ac.uk/standards/guidelines-for-the-provision-of-intensive-care-services
- 12.Kim K, Zeraatkar D, Pitre TS, et al. ; Retina Evidence and Trials International Alliance (R.E.T.I.N.A.) Study Group . Noninferiority randomised trials in ophthalmology. Eye (Lond). 2023;37(15):3059-3060. doi: 10.1038/s41433-023-02465-4 [DOI] [PMC free article] [PubMed] [Google Scholar]
- 13.Leung JT, Barnes SL, Lo ST, Leung DY. Non-inferiority trials in cardiology: what clinicians need to know. Heart. 2020;106(2):99-104. doi: 10.1136/heartjnl-2019-315772 [DOI] [PMC free article] [PubMed] [Google Scholar]
- 14.International Harmonisation for Better Health . Addendum on estimands and sensitivity analysis in clinical trials to the guideline on statistical principles for clinical trials e9(R1). November 20, 2019. Accessed August 26, 2024. https://database.ich.org/sites/default/files/E9-R1_Step4_Guideline_2019_1203.pdf
- 15.Stata Corp . Stata Statistical Software: Release 18. StataCorp LLC; 2021. [Google Scholar]
- 16.Dunn G, Maracy M, Dowrick C, et al. ; ODIN group . Estimating psychological treatment effects from a randomised controlled trial with both non-compliance and loss to follow-up. Br J Psychiatry. 2003;183:323-331. doi: 10.1192/bjp.183.4.323 [DOI] [PubMed] [Google Scholar]
- 17.Pocock SJ, Ariti CA, Collier TJ, Wang D. The win ratio: a new approach to the analysis of composite endpoints in clinical trials based on clinical priorities. Eur Heart J. 2012;33(2):176-182. doi: 10.1093/eurheartj/ehr352 [DOI] [PubMed] [Google Scholar]
- 18.Kleinman LC, Norton EC. What’s the risk? a simple approach for estimating adjusted risk measures from nonlinear models including logistic regression. Health Serv Res. 2009;44(1):288-302. doi: 10.1111/j.1475-6773.2008.00900.x [DOI] [PMC free article] [PubMed] [Google Scholar]
- 19.Austin PC. Absolute risk reductions, relative risks, relative risk reductions, and numbers needed to treat can be obtained from a logistic regression model. J Clin Epidemiol. 2010;63(1):2-6. doi: 10.1016/j.jclinepi.2008.11.004 [DOI] [PubMed] [Google Scholar]
- 20.US Department of Health and Human Services . Non-inferiority clinical trials to establish effectiveness—guidance for industry. US Dept of Health and Human Services. November 2016. Accessed August 26, 2024. https://www.fda.gov/media/78504/download
- 21.Meisner M. Pathobiochemistry and clinical use of procalcitonin. Clin Chim Acta. 2002;323(1-2):17-29. doi: 10.1016/S0009-8981(02)00101-8 [DOI] [PubMed] [Google Scholar]
Associated Data
This section collects any data citations, data availability statements, or supplementary materials included in this article.
Supplementary Materials
Trial protocol
Statistical analysis plan
eMethods
eSection 1. ADAPT-Sepsis sites, collaborators and investigators
eSection 2. Acknowledgments
eSection 3. Competing interests disclosure
eSection 4. Eligibility criteria: inclusion and exclusion
eSection 5. Clinical trials which co-enrolled with ADAPT-Sepsis
eSection 6. Schedule of delivery of intervention and data collection
eSection 7. Adverse event reporting
eTable 1. Trial biomarker-guided antibiotic discontinuation protocol
eTable 2. UK sites recruitment for ADAPT Sepsis (2017-24 Recruitment target met on 5th June 2024)
eTable 3. Reasons for non-randomisation by each site
eTable 4. Reasons for non-enrollment key
eTable 5. Randomised participants summarised by treatment and randomisation strata1 sepsis severity
eTable 6. Randomised participants summarised by treatment and randomisation strata1 surgery within last 72 hours
eTable 7. Randomised participants summarised by recruiting site
eTable 8. Additional demographics and clinical characteristics of the randomised patients
eTable 9. Number of participants withdrawn completely throughout the trial
eTable 10. Number of deaths throughout the trial
eTable 11. 28-days all-cause mortality status across the treatment arms
eTable 12. Overall summary of withdrawals by treatment arm
eTable 13. Time from randomisation to death, withdrawal and follow-up summarised by treatment arm
eTable 14. Daily data collection – summary of patient status
eTable 15. Summary of discharge data by treatment arm
eTable 16. Summary of readmission data by treatment arm
eTable 17. Initial care bundle at baseline summarised by treatment arm
eTable 18. Primary and secondary outcomes (adjusted analysis)
eTable 19. Adjusted and unadjusted estimate of treatment effect with 95% credible interval using bayesian analysis
eTable 20. The probabilities the mean difference using posterior distribution
eTable 21. SOFA score at day 3 and day 7
eTable 22. Additional analyses: baseline demographic characteristics comparing participants recruited pre- sars-cov-2 period versus post- sars-cov-2 periods
eTable 23. Additional analysis: summary of primary outcomes (effectiveness and safety) among participants recruited pre- sars-cov-2 period and post- SARS-CoV-21 periods
eTable 24. Summary of suspected clinically relevant antibiotic related events
eTable 25. Serious adverse events (SAE) summarised by treatment arm
eTable 26. Serious adverse events (relatedness and expectedness) by treatment arm occurring over 28 days
eTable 27. Summary of the protocol deviations events by treatment arm occurring over 28 days
eTable 28. Summary of the protocol violations events by treatment arm occurring over 28 days
eFigure 1. Diagram illustrating non-inferiority margins and 95% ci of difference in proportions for the 28-day all-cause mortality outcome
eFigure 2. Forest plots of subgroup analysis for duration of antibiotics to 28 days (unadjusted mean difference, 99% ci, and interaction p-values)
eFigure 3. Forest plots of subgroup analysis for duration of antibiotics to 28 days (adjusted mean difference, 99% ci, and interaction p-values)
eFigure 4. Forest plots of subgroup analysis for duration of antibiotics in the sepsis period (unadjusted mean difference, 99% ci, and interaction p-values)
eFigure 5. Forest plots of subgroup analysis for duration of antibiotics in the sepsis period (adjusted mean difference, 99% ci, and interaction p-values)
eTable 29. Duration in days between randomization and first stop/strong stop advice
eFigure 6. Advice (usual care, suggest stop, strong advice) produced each day (from randomisation to 28 days) by intervention arm
eTable 30. Advice (usual care, suggest stop, strong advice) produced each day (from randomisation to 28 days) by intervention arm
eFigure 7. Kaplan-Meier curve for all-cause mortality up to 90 days
Nonauthor collaborators
Data sharing statement