

ABSTRACT
Background and Objectives
Social and environmental injustice may influence accessibility and utilization of health resources, affecting outcomes of patients with cancer. We sought to assess the impact of socio‐environmental inequalities on cancer screening and mortality rates for breast, colon, and cervical cancer.
Methods
Data on cancer screening and environmental justice index social and environmental ranking (SER) was extracted from the CDC PLACES and ATSDR, respectively. Mortality rates were extracted using CDC WONDER. Screening targets were defined by Healthy People 2030.
Results
Among census tracts, 14 659 were classified as “low,” 29 534 as “moderate,” and 15 474 as “high” SER (high SER denoting greater socioenvironmental injustice). Screening targets were achieved by 31.1%, 16.2%, and 88.6% of tracts for colon, breast, and cervical cancers, respectively. High SER tracts were much less likely to reach screening targets compared with low SER tracts for colon (OR: 0.06), breast (OR: 0.24), and cervical cancer (OR: 0.05) (all p < 0.001). Median mortality rates for low and high SER were 16.7, and 21.0, respectively, for colon, 13.4, 14.75, respectively, for breast, and 1.0, 1.6, respectively, for cervical cancer (all p < 0.05).
Conclusion
Socioenvironmental disparities negatively influence cancer screening and mortality, underscoring the need to reduce environmental injustices through measures like equitable cancer screening services.
Keywords: breast, cancer, cervical, colorectal, environmental, mortality, screening
1. Introduction
Cancer is the leading cause of death in the United States for people under 85 years of age [1]. In turn, access to preventive services has been declared a priority by the Healthy People 2030 initiative, which has defined measurable national cancer screening objectives [2]. Unfortunately, this initiative has resulted only in an increase in breast cancer screening, with no changes in colorectal and cervical cancer screening rates; in addition, screening for all three cancers has not achieved the desired target goals [3, 4, 5]. The reason for the inability to implement population‐based screening is complex and multifactorial. Social determinants of health, such as where people live, their ethnicity, and their education level, has gained increased interest as a driving factor of overall health outcomes. In fact, several studies have demonstrated that individuals from disadvantaged communities often experience worse health outcomes [6, 7, 8]. These disparities may be particularly pronounced in cancer health outcomes and screening rates among different communities based on geographic location, social vulnerability, and historical redlining [9, 10].
Marginalized communities may also experience distributive environmental injustice, characterized by the presence of poor environmental factors [11, 12]. Specifically, environmental factors, such as toxins and pollution, are generally more prevalent in marginalized communities, which may increase the risk of cancer [11]. Environmental Justice Index (EJI) is a validated measure developed by Centers for Disease Control/Agency for Toxic Substances and Disease Registry (CDC/ATSDR), that measures environmental injustice and health hazards in communities at the census tract level [13]. EJI is comprised of an environmental burden module (EBM), that includes environmental, air, and water pollution, built environment and transport infrastructure; EJI also has a social vulnerability module (SVM) that assesses socioeconomic status, household characteristics, housing type, and racial/ethnicity minority status [13].
A higher burden of environmental injustice may drive disparities in health outcomes in certain communities [14, 15]. To date, however, few studies have investigated the relationship between environmental injustice and different health outcomes [16, 17, 18]. In particular, while environmental injustice has gained increasing interest as a contributor to health outcomes, the impact of environmental burden on cancer screening and mortality remains ill defined. Therefore, the objective of the current study was to characterize the association between EJI and screening for breast, cervical, and colorectal cancer. In addition, we sought to define how EJI impacted the achievement of screening targets set by the Healthy People 2030 initiative. We hypothesized that individuals residing in areas with high EJI would have lower screening rates and high cancer‐associated mortality associated with these three cancers compared with individuals living in low EJI regions.
2. Methods
This population‐based cross‐sectional study utilized census‐tract level data on cancer screening rates from Centers for Disease Control (CDC) PLACES database. The 2024 dataset uses 2022 Behavioral Risk Factor Surveillance System to report the crude and age‐adjusted prevalence of breast, cervical, and colorectal cancer screening at the census‐tract level [19]. Of note, census‐tract level estimates are the most granular data available. The CDC/ATSDR database was used to extract census‐tract level data on EJI 2022 [13]. EJI is comprised of an EBM that includes environmental, air, and water pollution, and built environment and transport infrastructure [13]. EJI also includes a SVM, which assesses socioeconomic status, household characteristics, housing type, and racial/ethnicity minority status; there is also a health burden module that measures pre‐existing chronic disease burden (Supporting Information S1: Table S1) [13]. The EJI is a percentile ranking developed to assess the varying EJI factors, which is reported as a continuous variable ranging from 0 to 1 in which higher scores indicate higher levels of a hazardous and unfavorable environment [13]. Thus, the final score represents proportion of regions in the United States with an equal or lower socio‐environmental burden compared with the geographic region of interest. The CDC Social Vulnerability Index (SVI) database was also used to extract data on social determinants of health at the census tract level [20]. The SVI is a composite metric of 16 American Community Survey sociodemographic characteristics [20]. County level data for breast, cervical, and colorectal cancer incidence rates per 100 000 persons were obtained from United States Cancer Statistics (USCS) database for a 5‐year period 2017–2021 [21]. The USCS collects data from CDC's National Program of Cancer Registries and National Cancer Institute's Surveillance, Epidemiology, and End Results (SEER) Program [21]. Mortality for breast, cervical, and colorectal cancers were obtained at the county level; the CDC WONDER database was used to identify the underlying cause of death for the years 2018–2022 as crude death rates per 100,000 persons [22]. The current study followed Strengthening the Reporting of Observational Studies in Epidemiology (STROBE) guidelines. As the data were publicly available with no information at the individual patient level, the current study was deemed exempt from approval by The Ohio State University Institutional Review Board.
2.1. Outcomes of Interest
The primary outcomes of interest were the achievement of Healthy People 2030 screening rate targets for breast (80.3%), cervical (79.2%), and colorectal (68.3%) cancers [3, 4, 5]. Secondary outcomes included incidence and mortality rates for all three cancers. For breast cancer, up‐to‐date screening was defined as female respondents aged 50–74 years who received a mammogram in the past 2 years [23]. Up‐to‐date cervical cancer screening was defined as female respondents aged 21–29 years who had a Pap test alone in the past 3 years, or individuals aged 30–65 years who had a Pap test alone in the past 3 years, a human papillomavirus test alone in the past 5 years, or a combination of a Pap test and a human papillomavirus test in the past 5 years [23]. Up‐to‐date colorectal screening was defined as respondents aged 45–75 years who received a fecal occult blood test in the past year, a sigmoidoscopy in the past 5 years, or a colonoscopy in the past 10 years [23].
2.2. Statistical Analysis
Continuous variables were reported as median values (interquartile rage [IQR]), categorical variables were reported as frequencies (percentage); comparisons were made using Kruskal–Wallis H tests and Chi‐square tests, respectively. Logistic regression analysis was used to assess the association between EJI and achievement of target cancer screening rates. The EJI social‐environmental ranking (SER) was calculated by combining rankings from the EBM and SVM of the EJI excluding the health burden module, which made SER better suited for analysis in which outcomes of interest (i.e., cancer) was a component of the health burden module. SER was categorized into “low” (less social and environmental hazards), “moderate”, and “high” (more social and environmental hazards) using quartiles (low ≤ 0.25; > 0.25 moderate ≤ 0.75; > 0.75 high ≤ 1). Attributable fractions for both components of SER, namely environmental burden and the SVM were calculated to quantify the relative contributions to census‐tracts not achieving screening targets. Logistic regression was employed to estimate coefficients for each module, modeling the likelihood of the outcome, before converting into presented percentages. All statistical analyses were Stata/MP v18.0 (StataCorp, College Station, TX).
3. Results
Among 59 667 census tracts, 24.6% (n = 14 659) were categorized as having low SER, 49.5% (n = 29 534) as moderate SER, and 25.9% (n = 15 474) as high SER. Louisiana (40.8%, n = 347) and Alabama (36.6%, n = 340) had the highest proportion of tracts with high SER, while Maine (0.99%, n = 3) had the lowest (Figure 1). Moreover, tracts with poor socio‐environmental conditions were more likely to have a higher proportion of adults with no high school diploma (high: 20%, IQR [13.9–28.4] vs. moderate: 9.6%, IQR [5.9–14.9] vs. low: 4.6%, IQR [2.7–7.3]) and a higher unemployment status (high: 7.6%, IQR [5.2–11.2] vs. moderate: 4.7, IQR [3.0–6.8] vs. low: 3.3, IQR [2.2–4.7]) (both p < 0.001) (Table 1).
Figure 1.
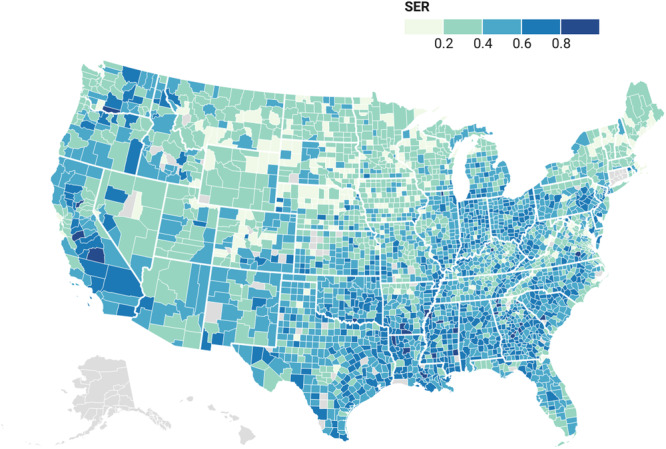
County level distribution of Social Environmental Ranking across United States.
Table 1.
Demographics and associated census‐tract characteristics.
| Environmental Justice Index—Social Environmental Ranking (SER) | p‐value | |||
|---|---|---|---|---|
| Low (n = 14 659) | Moderate (n = 29 534) | High (n = 15 474) | ||
| % Uninsured Median (IQR) | 3.9 (2.2–6.3) | 4 (2.2–6.9) | 11.5 (7.4–17) | < 0.001 |
| % Unemployed (Median (IQR) | 3.3 (2.2–4.7) | 4.7 (3–6.8) | 7.6 (5.1–11.2) | < 0.001 |
| % No High School Diploma Median (IQR) | 4.6 (2.7–7.3) | 9.6 (5.9–14.9) | 20 (13.9–28.4) | < 0.001 |
| % Living with Crowding Median (IQR) | 1.4 (1.0–2.2) | 1.9 (1.2–3.3) | 3.4 (1.9–5.5) | < 0.001 |
| % Limited English Proficiency Median (IQR) | 1.8 (1.4–2.4) | 2.1 (1.5–3.2) | 3.5 (2.3–5.2) | < 0.001 |
3.1. SER and Cancer Screening Rates
Median screening rates were highest for cervical cancer (84.3%, IQR: 81.7–86.5), followed by breast cancer (76.1%, IQR: 72.6–79.0), and then colorectal cancer (65.2%, IQR: 60.0–69.3). Furthermore 88.6% (n = 52 839) of census tracts achieved target screening rates for cervical cancer compared with only16.2% (9669) for breast cancer and 31.1% (n = 18 541) for colorectal cancer. Of note, high SER tracts had lower screening rates for cervical cancer (low: 86.7, IQR [85.0–88.2] vs. moderate: 84.3, IQR [82.2–86.2] vs. high: 81.5, IQR [79.1–83.6]), breast cancer (low: 78.2, IQR [75.6–80.4] vs. moderate: 76.0, IQR [72.7–78.9] vs. high: 73.8, IQR [70.4–76.9]), and colorectal cancer (low: 69.1, IQR [65.8–72.1] vs. moderate: 65.6, IQR [61.5–69.2] vs. high: 59.0, IQR [53.5–63.7]) (all p < 0.001) (Table 2) (Figure 2).
Table 2.
Census‐tract level cancer screening rates, achievement of target screening rates.
| Environmental Justice Index—Social Environmental Ranking (SER) | p‐value | |||
|---|---|---|---|---|
| Low (n = 14 659) | Moderate (n = 29 534) | High (n = 15 474) | ||
| Colon cancer screening | 69.1 (65.8–72.1) | 65.6 (61.5–69.1) | 59 (53.5–63.7) | < 0.001 |
| Target achieved colon cancer screening | 8390 (57.23%) | 9059 (30.67%) | 1092 (7.06%) | < 0.001 |
| Mammography breast cancer Screening | 78.2 (75.6–80.4) | 76 (72.7–78.9) | 73.8 (70.4–76.9) | < 0.001 |
| Target achieved breast cancer screening | 3879 (26.46%) | 4556 (15.43%) | 1234 (7.97%) | < 0.001 |
| Cervical cancer screening | 86.7 (85.0–88.2) | 84.3 (82.2–86.2) | 81.5 (79.1–83.6) | < 0.001 |
| Target achieved cervical cancer screening | 14 404 (98.26%) | 27 073 (91.67%) | 11 362 (73.43%) | < 0.001 |
Figure 2.
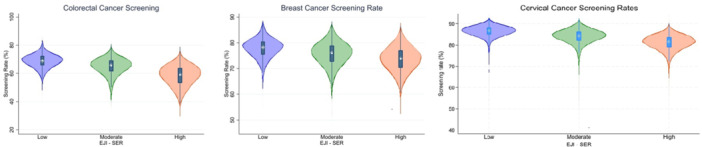
Distribution of cancer screening rates categorized by Social Environmental Ranking.
Low SER tracts were less likely to achieve the Healthy People 2030 screening target rates for cervical cancer (low: n = 14 404, 98.26% vs. moderate: 27 073, 91.67% vs. high: 11 362, 73.43%), breast cancer (low: n = 3879, 26.46% vs. moderate: n = 4556, 15.43% vs. high: n = 1234, 7.97%), and colorectal cancer (low: n = 8390, 57.23% vs. moderate: n = 9059, 30.67% vs. high: n = 1092, 7.06%) (all p‐value < 0.001) (Table 2). On logistic regression analysis, census tracts with high SER had 95% lower odds of achieving the targets set by Healthy People 2030 for cervical cancer (OR: 0.05, CI: 0.04–0.06), 76% lower for breast cancer (OR: 0.0.24, CI: 0.22–0.26), and 94% lower for colorectal cancer (OR: 0.06, CI: 0.05–0.06) (all p < 0.005) (Supporting Information S1: Table S2).
For tracts in which screening targets were not achieved, the failure to meet the targets was largely attributable to factors within the SVM rather than the EBM (cervical cancer: 90.20% vs. 9.80%; breast cancer: 86.95% vs. 13.05%; colorectal cancer: 89.93% vs. 10.07%) (Figure 3). Assessing screening rates as a continuous variable at the census tract level, odds of cervical cancer screening were 17% lower in moderate (OR: 0.83, CI: 0.82–0.83) and 32% lower in high (OR: 0.68, CI: 0.68–0.69) SER areas compared with individuals living in low SER regions. Similarly, breast cancer screening odds were 16% lower in moderate (OR: 0.84, CI: 0.84–0.85) and 36% lower in high (OR: 0.64, CI: 0.64–0.65) SER areas, while colorectal cancer screening odds were 11% lower in moderate (OR: 0.86, CI: 0.84–0.85) and 20% lower in high (OR: 0.80, CI: 0.79–0.80) SER areas (Supporting Information S1: Table S3).
Figure 3.
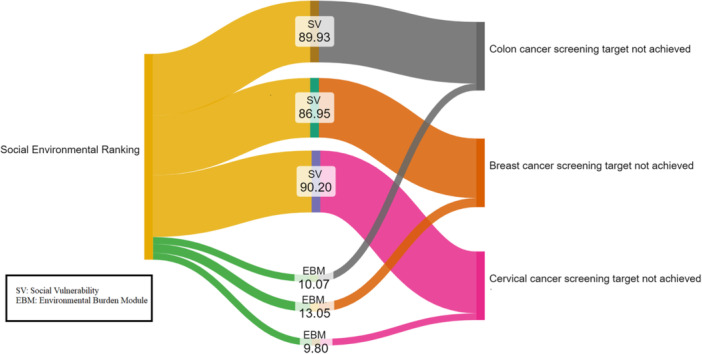
Attributable fractions of Social Environmental Ranking in not achieving screening targets.
3.2. Cancer Incidence and Mortality Rates by SER
Counties with high SER had a higher incidence of cervical cancer (low: 6.3, IQR [5.0–7.1] vs. moderate: 8.1, IQR [6.7–10.2] vs. high: 41.9, IQR [37.5–50.4]) and colorectal cancer (low: 35.5, IQR [31.4–42.0] vs. moderate: 40.0, IQR [35.3–45.8] vs. high: 41.9, IQR [37.5–50.4]) and (Table 3). Similarly, mortality was higher among individuals diagnosed with cervical cancer (low: 1.0, IQR [0.9–1.0] vs. moderate: 1.3, IQR [1.0–1.6] vs. high: 1.6, IQR [1.3–2.0]), breast cancer (low: 13.4, IQR [10.8–16.1] vs. moderate: 14.5, IQR [12.3–17.1] vs. high: 14.8, IQR [12.6–19.9]), and colorectal cancer (low: 16.7, IQR [13.9–21.0] vs. moderate: 20.0, IQR [15.9–24.5] vs. high: 21.0, IQR [16.7–27.2]) among individuals living in counties with high versus low SER (all p < 0.001) (Table 3).
Table 3.
County level incidence and mortality rates.
| Social environmental ranking | p‐value | |||
|---|---|---|---|---|
| Low | Moderate | High | ||
| Mortality (per 100 000) | ||||
| Colorectal cancer mortality | 16.7 (13.9–21.0) | 20.0 (15.9–24.5) | 21.0 (16.7–27.2) | 0.034 |
| Breast cancer mortality | 13.4 (10.8–16.1) | 14.5 (12.3–17.1) | 14.75 (12.6–19.9) | 0.002 |
| Cervical cancer mortality | 1.0 (0.9–1.0) | 1.3 (1.0–1.6) | 1.6 (1.3–2.0) | 0.007 |
| Incidence (per 100 000) | ||||
| Colorectal cancer incidence | 35.5 (31.4–42.0) | 40.0 (35.3–45.8) | 41.9 (37.5–50.4) | < 0.001 |
| Breast cancer incidence | 131.0 (116.0–144.6) | 125.2 (112.0–136.7) | 120.9 (110.0–130.9) | < 0.001 |
| Cervical cancer incidence | 6.3 (5.0–7.1) | 8.1 (6.7–10.2) | 9.3 (8.6–11.5) | < 0.001 |
4. Discussion
Over the last several decades, there has been increased focus on cancer screening as a means to decrease cancer‐related mortality [5, 24]. Unfortunately, despite ongoing efforts to improve healthcare accessibility, disparities in access to healthcare remain especially within traditionally marginalized communities [25]. Socioeconomic status, historical redlining, and the Area Deprivation Index (ADI) have been associated with regional healthcare inequities, with worse socioeconomic conditions correlating with reduced access to preventative care such as cancer screenings [10, 26]. The impact of environmental factors on health outcomes has not been as well examined. Environmental injustice, whereby economically disadvantaged and marginalized areas experience disproportionate exposure to pollutants and poor living conditions, may place individuals at “double jeopardy”: increased risk of cancer combined with decreased access to care [27, 28]. Environmental hazards are often disproportionately present in low‐income areas that also suffer from a lack of social infrastructure, further compounding geographic‐based vulnerabilities [29]. The intersectionality of poor environmental conditions and socioeconomic hardships can create a feedback loop in which inadequate resources led to deteriorating health outcomes, and poor health outcomes prevent social and economic mobility [18, 30]. The current study was important because we specifically examined the impact of environmental burden on cancer screening and mortality. In particular, we characterize the association between EJI and screening for breast, cervical, and colorectal cancer, as well as defined how EJI impacted the achievement of screening targets set by the Healthy People 2030 initiative. Of note, high SER tracts had lower screening rates for cervical cancer, breast cancer, and colorectal cancer (all p < 0.001) (Table 2) (Figure 2). In addition, areas with high environmental injustice had 94%, 76%, and 95% lower odds of achieving screening targets for colorectal, breast, and cervical cancers. Interestingly, a substantial portion of EJI's impact on cancer screening disparities was attributable to social burden module.
Environmental factors including water and air pollution are leading causes of disease burden and mortality in the world. In fact, according to the World Health Organization, ambient air pollution was estimated to have contributed to 4.2 million premature deaths worldwide in 2019 [31, 32]. Areas with poor environmental factors, such as elevated levels of toxins, air pollution, and inadequate infrastructure, consistently exhibit worse health outcomes, including a higher cancer incidence and mortality [33, 34, 35, 36]. An increased incidence of colorectal cancers has been linked to micro‐ and macro‐environmental factors including exposures to microplastics, an environmental hazard [37]. Prenatal exposure to chemical toxins have also been associated with increased risk of reproductive cancers including breast, cervical, endometrial, and testicular cancers [38]. Meanwhile, air pollution has been connected to not only the risk of lung cancers, but also bladder and kidney cancer, as well as liver, breast, and prostate cancers [39, 40, 41]. In the current study, there was a higher incidence of both cervical (high: 9.3 vs. low: 6.3 per 100 000) and colorectal (high: 41.9 vs. low: 35.5 per 100 000) cancer in areas with high SER. Social determinants of health are often correlated with environmental injustice. To this point, high SER tracts had a higher median percentage of the adult population who were unemployed (high: 7.6% vs. low: 3.3%) and uninsured (high: 11.5% vs. low: 3.9%) (both p < 0.01). In addition, 1 in 5 adults who lived in high SER regions did not have a high school diploma versus only 4.6% in low SER tracts. Other data have similarly suggested that race, insurance, and education status were independently associated with stage of breast cancer disease at diagnosis [42]. In turn, the data collectively suggest that environment and social factors act as strong drivers to healthcare access and outcomes among patients with cancer.
High SER tracts had lower screening rates for cervical cancer (low: 86.7, IQR [85.0–88.2] vs. moderate: 84.3, IQR [82.2–86.2] vs. high: 81.5, IQR [79.1–83.6]), breast cancer (low: 78.2, IQR [75.6–80.4] vs. moderate: 76.0, IQR [72.7–78.9] vs. high: 73.8, IQR [70.4–76.9]), and colorectal cancer (low: 69.1, IQR [65.8–72.1] vs. moderate: 65.6, IQR [61.5–69.2] vs. high: 59.0, IQR [53.5–63.7]) (all p < 0.001). In fact, assessing screening rates as a continuous variable at the census tract level, odds of screening for breast, cervical and colon cancer were 20%–36% lower in high SER areas (Supporting Information S1: Table S3). To quantify the possible factors impacting census‐tracts not achieving screening targets in high SER areas, attributable fractions for the EJI, environmental burden and the SVMs were calculated. The attributable impact of the environmental burden independent of social burden was 9.80% for cervical cancer, 13.05% for breast cancer, and 10.07% for colorectal cancer. As such, addressing screening disparities, will require a focus not only on socioeconomic disparities but also on the environmental conditions that play a significant role in shaping health trajectories. Many communities, particularly in rural areas, face barriers such as a lack of hospitals, the digital divide, as well as inadequate transportation infrastructure that make it difficult for residents to access preventive care, including cancer screenings [43, 44]. Historical distrust of the healthcare system, particularly among racial and ethnic minorities, may further contribute to lower screening rates observed in high‐SER areas [45, 46]. Unmet social needs in terms of food insecurity, housing instability, transportation challenges, and social isolation have been associated with disparities in care [47]. Screening specific barriers may also exist in different patient populations. For example, psychological factors such as shame, fear, and pain around Pap testing have been linked to decreased cervical screening rates [48].
In addition to lower screening rates, the current study demonstrated higher mortality in high SER areas compare with low SER areas across for all three cancers. Previous studies have noted a higher mortality and decreased long‐term cancer‐specific survival relative to level of education, employment and insurance, as well as housing status [49, 50]. These results point to a troubling reality: lack of screening and delayed presentation likely leads to lack of timely treatment and worse outcomes [51, 52, 53]. Addressing disparities in cancer screening and care will need a custom‐tailored approach as the increased insurance coverage provided by Affordable Care Act had not been enough to guarantee equitable coverage [54]. Evidence based effective strategies to increase screening are needed and should be culturally and linguistically sensitive, as well as at the appropriate patient education level; in addition, “nudges” including text or mail reminders to patients can be helpful [55, 56, 57]. With regards to pollution and environmental injustice, the Cancer Moonshot coordinated by the White House Cancer Cabinet aims to close the screening gap and address environmental injustice and factors impacting cancer care [58]. Certain policies under the Environmental Protection Agency United States have also worked toward improving environmental conditions focusing on air pollution, water quality, and waste management [59]. Programs and policies like “Clean school bus program,” national primary drinking water regulations, and “superfund” programs aim to reduce pollution and contaminations from vulnerable [60, 61]. Further fundings and research are needed in this area to improve cancer outcomes, specifically by implementing policies to address inequity and injustice [62].
The current study should be interpreted in light of several limitations. Screening rates were obtained from the CDC PLACES dataset, which uses Behavioral Risk Factor Surveillance System data to generate small area estimates. As these estimates are based on self‐reported data, there may have been some reporting bias; this bias should have been random in nature and not affected the results. Additionally, the screening rates were reported at the census tract level as crude prevalence, rather than age‐adjusted rates, which may not fully account for age group variations across different tracts. As with any ecological study, the associations observed at the county and census‐tract levels may not necessarily apply at smaller levels of geographic areas and individuals.
In conclusion, there is a complex interplay between social and environmental factors relative to cancer screening, incidence, and mortality, particularly in marginalized communities. EJI and SER markedly impacted screening rates and lead to wide dramatic geographic variations in cancer screening for breast, cervical and colorectal cancer. While there have been advancements in cancer screening and management, significant disparities remain in traditionally marginalized areas. The data underscore the urgent need to address both social vulnerabilities, such as limited access to healthcare facilities and transportation, as well as environmental burdens, including exposure to pollutants, to mitigate health disparities and improve cancer outcomes among vulnerable populations.
Synopsis
This study highlights the detrimental impact of socio‐environmental injustices on cancer screening and mortality rates for breast, colon, and cervical cancers. It underscores the need for equitable interventions to address disparities in cancer care and outcomes.
Supporting information
Supporting information.
Data Availability Statement
The data that supports the findings of this study are openly available in Centers for Disease Control/Agency for Toxic Substances and Disease Registry at https://www.atsdr.cdc.gov/placeandhealth/eji/index.html, reference number 13, in Centers for Disease Control (CDC) PLACES database at https://www.cdc.gov/places/index.html, reference number 19, and in United States Cancer Statistics (USCS) database at https://www.cdc.gov/cancer/dataviz, reference number 21.
References
- 1. Siegel R. L., Giaquinto A. N., and Jemal A., “Cancer Statistics, 2024,” CA: A Cancer Journal for Clinicians 74, no. 1 (2024): 12–49, 10.3322/caac.21820. [DOI] [PubMed] [Google Scholar]
- 2. Healthy People 2030 . Objectives – Cancer, accessed October 27, 2024, https://odphp.health.gov/healthypeople/objectives-and-data/browse-objectives/cancer.
- 3. Healthy People 2030 . Increase the Pproportion of Females Who Get Screened for Cervical Cancer — C‑09. Published online Revised 2024 2020, accessed October 22, 2024, https://odphp.health.gov/healthypeople/objectives-and-data/browse-objectives/cancer/increase-proportion-females-who-get-screened-cervical-cancer-c-09.
- 4. Healthy People 2030 . Increase the Proportion of Adults Who Get Screened for Colorectal Cancer — C‑07. Published online Revised 2024 2020, accessed October 22, 2024, https://odphp.health.gov/healthypeople/objectives-and-data/browse-objectives/cancer/increase-proportion-adults-who-get-screened-colorectal-cancer-c-07.
- 5. Healthy People 2030 . Increase the Proportion of Females Who get Screened for Breast Cancer — C‑05. Published online Revised 2024 2020, accessed October 22, 2024, https://odphp.health.gov/healthypeople/objectives-and-data/browse-objectives/cancer/increase-proportion-females-who-get-screened-breast-cancer-c-05.
- 6. LaVeist T. A., Pérez‐Stable E. J., Richard P., et al., “The Economic Burden of Racial, Ethnic, and Educational Health Inequities in the US,” Journal of the American Medical Association 329, no. 19 (2023): 1682, 10.1001/jama.2023.5965. [DOI] [PubMed] [Google Scholar]
- 7. Alderwick H. and Gottlieb L. M., “Meanings and Misunderstandings: A Social Determinants of Health Lexicon for Health Care Systems,” The Milbank Quarterly 97, no. 2 (2019): 407–419, 10.1111/1468-0009.12390. [DOI] [PMC free article] [PubMed] [Google Scholar]
- 8. Khalil M., Munir M. M., Endo Y., et al., “Association of County‐Level Food Deserts and Food Swamps With Hepatopancreatobiliary Cancer Outcomes,” Journal of Gastrointestinal Surgery 27, no. 12 (2023): 2771–2779, 10.1007/s11605-023-05879-3. [DOI] [PubMed] [Google Scholar]
- 9. Khan M. M. M., Munir M. M., Woldesenbet S., et al., “Association of COVID‐19 Pandemic With Colorectal Cancer Screening: Impact of Race/Ethnicity and Social Vulnerability,” Annals of Surgical Oncology 31, no. 5 (2024): 3222–3232, 10.1245/s10434-024-15029-x. [DOI] [PMC free article] [PubMed] [Google Scholar]
- 10. Moazzam Z., Woldesenbet S., Endo Y., et al., “Association of Historical Redlining and Present‐Day Social Vulnerability With Cancer Screening,” Journal of the American College of Surgeons 237, no. 3 (2023): 454–464, 10.1097/XCS.0000000000000779. [DOI] [PubMed] [Google Scholar]
- 11. Downey L. and Hawkins B., “Race, Income, and Environmental Inequality in the United States,” Sociological Perspectives 51, no. 4 (2008): 759–781, 10.1525/sop.2008.51.4.759. [DOI] [PMC free article] [PubMed] [Google Scholar]
- 12. Beard S., Freeman K., Velasco M. L., et al., “Racism as a Public Health Issue in Environmental Health Disparities and Environmental Justice: Working Toward Solutions,” Environmental Health 23, no. 1 (2024): 8, 10.1186/s12940-024-01052-8. [DOI] [PMC free article] [PubMed] [Google Scholar]
- 13.Centers for Disease Control and Prevention and Agency for Toxic Substances Disease Registry. 2022 Environmental Justice Index, accessed October 22, 2024, https://www.atsdr.cdc.gov/placeandhealth/eji/index.html.
- 14. Kuehn R., “A Taxonomy of Environmental Justice,” Environ Law Report 30 (2000): 10681. [Google Scholar]
- 15. Maantay J., “Mapping Environmental Injustices: Pitfalls and Potential of Geographic Information Systems in Assessing Environmental Health and Equity,” Environmental Health Perspectives 110, no. suppl 2 (2002): 161–171, 10.1289/ehp.02110s2161. [DOI] [PMC free article] [PubMed] [Google Scholar]
- 16. Del Pozzo J., Kouba I., Alvarez A., O'sullivan‐Bakshi T., Krishnamoorthy K., and Blitz M. J., “Environmental Justice Index and Adverse Pregnancy Outcomes,” AJOG Global Reports 4, no. 1 (2024): 100330, 10.1016/j.xagr.2024.100330. [DOI] [PMC free article] [PubMed] [Google Scholar]
- 17. Correction to: Association of Environmental Injustice and Cardiovascular Diseases and Risk Factors in the United States,” Journal of the American Heart Association 13, no. 13 (2024): e027778, 10.1161/JAHA.123.027778. [DOI] [PMC free article] [PubMed] [Google Scholar]
- 18. Catalano G., Munir M. M., Chatzipanagiotou O. P., et al., “The Association of Socio‐Environmental Inequality and Outcomes Among Patients Undergoing Major Surgery,” Journal of Surgical Research 301 (2024): 664–673, 10.1016/j.jss.2024.07.063. [DOI] [PubMed] [Google Scholar]
- 19. Centers for Disease Control and Prevention . PLACES: local data for better health. Published online August 2024, accessed October 9, 2024, https://www.cdc.gov/places/index.html.
- 20.Centers for Disease Control and Prevention/Agency for Toxic Substances and Disease Registry/Geospatial Research, Analysis, and Services Program. CDC/ATSDR Social Vulnerability Index 2022 Database U.S, accessed October 10, 2024, https://www.atsdr.cdc.gov/placeandhealth/svi/data_documentation_download.html.
- 21. U.S. Cancer Statistics Working Group . U.S. Cancer Statistics Data Visualizations Tool. U.S. Department of Health and Human Services, Centers for Disease Control and Prevention and National Cancer Institute. Published online June 2024, accessed October 10, 2024, https://www.cdc.gov/cancer/dataviz.
- 22. Centers for Disease Control and Prevention, National Center for Health Statistics . National Vital Statistics System, Mortality 2018‐2022 on CDC WONDER Online Database, released in 2024. Data are from the Multiple Cause of Death Files, 2018‐2022, as compiled from data provided by the 57 vital statistics jurisdictions through the Vital Statistics Cooperative Program, accessed October 9, 2024, http://wonder.cdc.gov/ucd-icd10-expanded.html.
- 23.Prevention Measure Definitions, CDC PLACES: Local Data for Better Health. Published online August 29, 2024, accessed October 27, 2024, https://www.cdc.gov/places/measure-definitions/prevention/index.html.
- 24. Cronin K. A., Scott S., Firth A. U., et al., “Annual Report to the Nation on the Status of Cancer, Part 1: National Cancer Statistics,” Cancer 128, no. 24 (2022): 4251–4284, 10.1002/cncr.34479. [DOI] [PMC free article] [PubMed] [Google Scholar]
- 25. Siegel R. L., Miller K. D., Fuchs H. E., and Jemal A., “Cancer Statistics, 2022,” CA: A Cancer Journal for Clinicians 72, no. 1 (2022): 7–33, 10.3322/caac.21708. [DOI] [PubMed] [Google Scholar]
- 26. Kurani S. S., McCoy R. G., Lampman M. A., et al., “Association of Neighborhood Measures of Social Determinants of Health With Breast, Cervical, and Colorectal Cancer Screening Rates in the US Midwest,” JAMA Network Open 3, no. 3 (2020): e200618, 10.1001/jamanetworkopen.2020.0618. [DOI] [PMC free article] [PubMed] [Google Scholar]
- 27. Cook Q., Argenio K., and Lovinsky‐Desir S., “The Impact of Environmental Injustice and Social Determinants of Health on the Role of Air Pollution in Asthma and Allergic Disease in the United States,” Journal of Allergy and Clinical Immunology 148, no. 5 (2021): 1089–1101.e5, 10.1016/j.jaci.2021.09.018. [DOI] [PubMed] [Google Scholar]
- 28. Donley N., Bullard R. D., Economos J., et al., “Pesticides and Environmental Injustice in the USA: Root Causes, Current Regulatory Reinforcement and a Path Forward,” BMC Public Health 22, no. 1 (2022): 708, 10.1186/s12889-022-13057-4. [DOI] [PMC free article] [PubMed] [Google Scholar]
- 29. Min E., Piazza M., Galaviz V. E., et al., “Quantifying the Distribution of Environmental Health Threats and Hazards in Washington State Using a Cumulative Environmental Inequality Index,” Environmental Justice 14, no. 4 (2021): 298–314, 10.1089/env.2021.0021. [DOI] [PMC free article] [PubMed] [Google Scholar]
- 30. Cushing L., Faust J., August L. M., Cendak R., Wieland W., and Alexeeff G., “Racial/Ethnic Disparities in Cumulative Environmental Health Impacts in California: Evidence From a Statewide Environmental Justice Screening Tool (CalEnviroScreen 1.1),” American Journal of Public Health 105, no. 11 (2015): 2341–2348, 10.2105/AJPH.2015.302643. [DOI] [PMC free article] [PubMed] [Google Scholar]
- 31.Ambient (outdoor) air pollution, World Health Organization. Published online October 24, 2024, accessed October 27, 2024, https://www.who.int/news-room/fact-sheets/detail/ambient-(outdoor)-air-quality-and-health.
- 32.Water, sanitation and hygiene: burden of disease, World Health Organization, accessed October 27, 2024, https://www.who.int/data/gho/data/themes/topics/water-sanitation-and-hygiene-burden-of-disease.
- 33. Jenwitheesuk K., Peansukwech U., and Jenwitheesuk K., “Accumulated Ambient Air Pollution and Colon Cancer Incidence in Thailand,” Scientific Reports 10, no. 1 (2020): 17765, 10.1038/s41598-020-74669-7. [DOI] [PMC free article] [PubMed] [Google Scholar]
- 34. Hamra G. B., Guha N., Cohen A., et al., “Outdoor Particulate Matter Exposure and Lung Cancer: A Systematic Review and Meta‐Analysis,” Environmental Health Perspectives 122, no. 9 (2014): 906–911, 10.1289/ehp/1408092. [DOI] [PMC free article] [PubMed] [Google Scholar]
- 35. Zare Sakhvidi M. J., Lequy E., Goldberg M., and Jacquemin B., “Air Pollution Exposure and Bladder, Kidney and Urinary Tract Cancer Risk: A Systematic Review,” Environmental Pollution 267 (2020): 115328, 10.1016/j.envpol.2020.115328. [DOI] [PubMed] [Google Scholar]
- 36. Pope Iii C. A., “Lung Cancer, Cardiopulmonary Mortality, and Long‐Term Exposure to Fine Particulate Air Pollution,” Journal of the American Medical Association 287, no. 9 (2002): 1132, 10.1001/jama.287.9.1132. [DOI] [PMC free article] [PubMed] [Google Scholar]
- 37. Li S., Keenan J. I., Shaw I. C., and Frizelle F. A., “Could Microplastics be a Driver for Early Onset Colorectal Cancer?,” Cancers 15, no. 13 (2023): 3323, 10.3390/cancers15133323. [DOI] [PMC free article] [PubMed] [Google Scholar]
- 38. Fuller R., Landrigan P. J., Balakrishnan K., et al., “Pollution and Health: A Progress Update,” The Lancet Planetary Health 6, no. 6 (2022): e535–e547, 10.1016/S2542-5196(22)00090-0. [DOI] [PMC free article] [PubMed] [Google Scholar]
- 39. Santibáñez‐Andrade M., Quezada‐Maldonado E. M., Osornio‐Vargas Á., Sánchez‐Pérez Y., and García‐Cuellar C. M., “Air Pollution and Genomic Instability: The Role of Particulate Matter in Lung Carcinogenesis,” Environmental Pollution 229 (2017): 412–422, 10.1016/j.envpol.2017.06.019. [DOI] [PubMed] [Google Scholar]
- 40. Zare Sakhvidi M. J., Lequy E., Goldberg M., and Jacquemin B., “Air Pollution Exposure and Bladder, Kidney and Urinary Tract Cancer Risk: A Systematic Review,” Environmental Pollution 267 (2020): 115328, 10.1016/j.envpol.2020.115328. [DOI] [PubMed] [Google Scholar]
- 41. Gan T., Bambrick H., Tong S., and Hu W., “Air Pollution and Liver Cancer: A Systematic Review,” Journal of Environmental Sciences 126 (2023): 817–826, 10.1016/j.jes.2022.05.037. [DOI] [PubMed] [Google Scholar]
- 42. Markey C., Weiss J. E., and Loehrer A. P., “Influence of Race, Insurance, and Rurality on Equity of Breast Cancer Care,” Journal of Surgical Research 271 (2022): 117–124, 10.1016/j.jss.2021.09.042. [DOI] [PubMed] [Google Scholar]
- 43. Wercholuk A. N., Parikh A. A., and Snyder R. A., “The Road Less Traveled: Transportation Barriers to Cancer Care Delivery in the Rural Patient Population,” JCO Oncology Practice 18, no. 9 (2022): 652–662, 10.1200/OP.22.00122. [DOI] [PubMed] [Google Scholar]
- 44. Fei‐Zhang D. J., Moazzam Z., Ejaz A., et al., “The Impact of Digital Inequities on Gastrointestinal Cancer Disparities in the United States,” Journal of Surgical Oncology 128, no. 1 (2023): 155–166, 10.1002/jso.27257. [DOI] [PubMed] [Google Scholar]
- 45. Pugh M., Perrin P. B., Rybarczyk B., and Tan J., “Racism, Mental Health, Healthcare Provider Trust, and Medication Adherence Among Black Patients in Safety‐Net Primary Care,” Journal of Clinical Psychology in Medical Settings 28, no. 1 (2021): 181–190, 10.1007/s10880-020-09702-y. [DOI] [PubMed] [Google Scholar]
- 46. Do Y. K., Carpenter W. R., Spain P., et al., “Race, Healthcare Access and Physician Trust Among Prostate Cancer Patients,” Cancer Causes & Control 21, no. 1 (2010): 31–40, 10.1007/s10552-009-9431-y. [DOI] [PMC free article] [PubMed] [Google Scholar]
- 47. Goel N., Lubarsky M., Hernandez A. E., et al., “Unmet Social Needs and Breast Cancer Screening Utilization and Stage at Presentation,” JAMA Network Open 7, no. 2 (2024): e2355301, 10.1001/jamanetworkopen.2023.55301. [DOI] [PMC free article] [PubMed] [Google Scholar]
- 48. Baezconde‐Garbanati L., Agurto I., Gravitt P. E., et al., “Barriers and Innovative Interventions for Early Detection of Cervical Cancer,” Salud pública de México 61, no. 4 (July–August 2019): 456, 10.21149/10425. [DOI] [PMC free article] [PubMed] [Google Scholar]
- 49. Odunsi K., “Perspectives on Disparities and Equity in Cancer Outcomes: A Call to Action,” Academic Medicine 98, no. 6S (2023): S54–S59, 10.1097/ACM.0000000000005181. [DOI] [PubMed] [Google Scholar]
- 50. Halpern M. T. and Brawley O. W., “Insurance Status, Health Equity, and the Cancer Care Continuum,” Cancer 122, no. 20 (2016): 3106–3109, 10.1002/cncr.30158. [DOI] [PubMed] [Google Scholar]
- 51. Dawes A. J., Rajasekar G., Arnow K. D., et al., “Disparities in Access, Quality, and Clinical Outcome for Latino Californians with Colon Cancer,” Annals of Surgery. Published ahead of print, February 26, 2024, 10.1097/SLA.0000000000006251 [DOI] [PMC free article] [PubMed] [Google Scholar]
- 52. Nicot‐Cartsonis M. S., Digbeu B. D. E., Raji M. A., and Kuo Y. F., “Disparities in Late‐Stage Breast and Colorectal Cancer Diagnosis Among Hispanic, Non‐Hispanic White, and Non‐Hispanic Black Patients: A Retrospective Cohort Study of Texas Medicare Beneficiaries,” Journal of Racial and Ethnic Health Disparities 10, no. 6 (2023): 3168–3177, 10.1007/s40615-022-01491-4. [DOI] [PMC free article] [PubMed] [Google Scholar]
- 53. Mutebi M., Anderson B. O., Duggan C., et al., “Breast Cancer Treatment: A Phased Approach to Implementation,” Cancer 126, no. S10 (2020): 2365–2378, 10.1002/cncr.32910. [DOI] [PubMed] [Google Scholar]
- 54. Dee E. C., Pierce L. J., Winkfield K. M., and Lam M. B., “In Pursuit of Equity in Cancer Care: Moving Beyond the Affordable Care Act,” Cancer 128, no. 18 (2022): 3278–3283, 10.1002/cncr.34346. [DOI] [PubMed] [Google Scholar]
- 55. Demb J. and Gupta S., “Racial and Ethnic Disparities in Colorectal Cancer Screening Pose Persistent Challenges to Health Equity,” Clinical Gastroenterology and Hepatology 18, no. 8 (2020): 1691–1693, 10.1016/j.cgh.2019.11.042. [DOI] [PMC free article] [PubMed] [Google Scholar]
- 56. Dee E. C., Pierce L. J., Winkfield K. M., and Lam M. B., “In Pursuit of Equity in Cancer Care: Moving Beyond the Affordable Care Act,” Cancer 128, no. 18 (2022): 3278–3283, 10.1002/cncr.34346. [DOI] [PubMed] [Google Scholar]
- 57. Vernon M., Coughlin S. S., Tingen M., Jones S., and Heboyan V., “Cancer Health Awareness Through Screening and Education: A Community Approach to Healthy Equity,” Cancer Medicine 13, no. 13 (2024): e7357, 10.1002/cam4.7357. [DOI] [PMC free article] [PubMed] [Google Scholar]
- 58. FACT SHEET: As Part of the Inaugural National Cancer Prevention and Early Detection Month, Biden Cancer Moonshot Announces New Actions to Strengthen Preventive Cancer Care and Expand Accessibility of Cancer Screenings. May 1, 2024, accessed October 24, 2024, https://www.whitehouse.gov/ostp/news-updates/2024/05/01/fact-sheet-as-part-of-the-inaugural-national-cancer-prevention-and-early-detection-month-biden-cancer-moonshot-announces-new-actions-to-strengthen-preventive-cancer-care-and-expand-accessibility-of/.
- 59.EPA Efforts to Reduce Exposure to Carcinogens and Prevent Cancer. May 2024, accessed October 24, 2024, https://www.epa.gov/environmental-topics/epa-efforts-reduce-exposure-carcinogens-and-prevent-cancer.
- 60. EPA Clean School Bus Program ‐ Third Report to Congress (U.S. EPA Ofce of Transportation and Air Quality, 2024). [Google Scholar]
- 61. EPA Spuerfund Program ., accessed October 24, 2024, https://www.epa.gov/superfund.
- 62. Overcoming Cancer Health Disparities through Science‐Based Public Policy, American Association for Cancer Research. [Google Scholar]
Associated Data
This section collects any data citations, data availability statements, or supplementary materials included in this article.
Supplementary Materials
Supporting information.
Data Availability Statement
The data that supports the findings of this study are openly available in Centers for Disease Control/Agency for Toxic Substances and Disease Registry at https://www.atsdr.cdc.gov/placeandhealth/eji/index.html, reference number 13, in Centers for Disease Control (CDC) PLACES database at https://www.cdc.gov/places/index.html, reference number 19, and in United States Cancer Statistics (USCS) database at https://www.cdc.gov/cancer/dataviz, reference number 21.