

ABSTRACT
Background
Hemorrhagic transformation (HT) is a tragic complication of acute ischemic stroke (AIS), with spontaneous HT (sHT) occurring even without reperfusion therapies. Despite evidence suggesting that several inflammation biomarkers are closely related to HT, its utility in sHT risk stratification remains unclear. This study aimed to identify and integrate effective inflammatory biomarkers associated with sHT and to develop a novel nomogram model for the early detection of sHT.
Methods
We conducted a retrospective observational cohort study of AIS patients receiving conventional medical treatment solely from March 2022 to March 2023, using a prospectively maintained database. All patients underwent CT follow‐up within 7 days after admission, with sHT occurrence within this period as the outcome. Data on demographics, clinical information, laboratory results, and imaging were collected. The cohort was divided into training and validation sets (7:3). Least absolute shrinkage and selection operator (LASSO) regression selected inflammatory biomarkers for a novel index. Univariable and multivariable logistic regressions were conducted to identify independent sHT risk factors. Receiver operating characteristic (ROC) analysis determined optimal cut‐off values for continuous factors. A nomogram was developed and validated internally and externally. Predictive accuracy was assessed using the area under the ROC curve (AUC) and calibration plots. Decision curve analysis (DCA) evaluated clinical usefulness.
Results
Of 803 AIS patients, 325 were included in the final analysis. sHT was found in 9.5% (31 patients). Training (n = 228) and validation (n = 97) cohorts showed no significant demographic or clinical differences. LASSO regression integrated neutrophil‐to‐albumin ratio (NAR) and triglycerides (TGs) into a novel index—NATG. Independent sHT risk factors included baseline National Institute of Health Stroke Scale (NIHSS) (OR = 1.09, 95% CI (1.02, 1.16), p = 0.0095), NATG (OR = 1534.87, 95% CI (5.02, 469638.44), p = 0.0120), D‐dimer (DD) (OR = 1.12, 95% CI (1.01, 1.25), p = 0.0249), and total cholesterol (TC) (OR = 1.01, 95% CI (1.00, 1.01), p = 0.0280), with their respective optimal cut‐off values being 13, 0.059, 0.86, and 3.6. These factors were used to develop the nomogram in the training cohort, which achieved an AUC of 0.804 (95% CI, 0.643–0.918) in the training cohort and 0.713 (95% CI, 0.499–0.868) in the validation cohort, demonstrating consistent calibration. DCA confirmed the nomogram's clinical applicability in both cohorts.
Conclusions
A novel indicator combining NAR and TG is positively associated with sHT in AIS patients. The constructed nomogram, integrating this novel indicator with other risk factors, provides a valuable tool for identifying sHT risk, aiding in clinical decision‐making.
Keywords: AIS, NAR, NATG, spontaneous hemorrhagic transformation (sHT), triglycerides (TGs)
A novel indicator combining NAR and TG is positively associated with sHT in AIS patients. The constructed nomogram, integrating this novel indicator with other risk factors, provides a valuable tool for identifying sHT risk, aiding in clinical decision‐making.

1. Introduction
Hemorrhagic transformation (HT) is a natural and spontaneous tragic complication of acute ischemic stroke (AIS), which is related to increased mortality and a worse functional outcome. HT occurs in 3%–40% of AIS patients [1, 2], exacerbated by reperfusion with alteplase (recombinant tissue plasminogen activator) or endovascular therapy (EVT). However, most AIS patients did not receive thrombolysis and thrombectomy in the real world, and the overall frequency of HT in those AIS patients was 0.4%–10.3% [3], which has been regarded as spontaneous HT (sHT) [4, 5].
Identifying early predictive risk factors before HT occurs has an effect on improving functional outcomes of AIS patients [6]. Accordingly, it is important to evaluate the prognostic risk factors for HT [6]. National Institute of Health Stroke Scale (NIHSS) on admission, medicine treatment (anticoagulant or antithrombotic treatment, and statin use), and collateral condition were associated with postthrombectomy and thrombolysis HT as previously reported [7, 8, 9, 10]. Moreover, accumulating evidence suggested that inflammation plays an important role in the process of HT after AIS [5]. Several combined inflammatory biomarkers, such as NLR, SII, and LMR, have been reported as potential risk factors for postthrombolysis and postthrombectomy HT [1, 11, 12, 13]. However, whether these inflammatory biomarkers could enable accurately stratify the risk of sHT remains unknown [14].
In this present study, we aimed to identify effective prognostic inflammatory biomarkers associated with the occurrence of sHT and develop a new nomogram model based on inflammatory biomarkers, collateral status, and other clinical risk factors. Our research could aid in the early detection of sHT and guide its clinical management strategies.
2. Methods
2.1. Ethics Statement
The study was conducted in compliance with the transparent reporting of a multivariable prediction model for individual prognosis or diagnosis (TRIPOD) statement [15]. The Ethical Review Committee of the West China Hospital of Sichuan University approved this research (No. 2020(069)). As this is a retrospective study that collects deidentified data, the requirement of obtaining informed consent was waived.
2.2. Study Design and Population
We performed a retrospective observational cohort of patients with AIS from March 2022 to March 2023 from a consecutively collected and prospectively maintained database in the Department of Neurology of our hospital. The diagnosis of AIS was based on the World Health Organization stroke diagnostic criteria and confirmed with evidence of neuroimaging, including magnetic resonance imaging (MRI) or computed tomography (CT). Patients were eligible for the study if they met the following criteria: (1) aged over 18 years old and admitted to the hospital within 7 days after onset of symptoms [16, 17, 18], (2) patients met the AIS diagnostic criteria based on WHO, and confirmed with the evidence of neuroimaging; (3) received conventional medication treatment alone without reperfusion therapies such as intravenous thrombolysis or endovascular thrombectomy; and (4) underwent baseline laboratory investigation within 24 h after admission. Exclusion criteria were as follows: (1) pre‐AIS modified Rankin scale score (mRS) was over 2; (2) missing baseline or follow‐up brain imaging; (3) infection within 2 weeks prior to AIS onset; (4) patients with cerebral hemorrhage, brain tumors, other severe space‐occupying effect diseases, cerebral aneurysm, and cerebrovascular malformation; (5) patients with hematological disorders, and severe hepatic or renal dysfunction, and (6) patients with unavailable or incomplete clinical and imaging information.
Finally, a total of 325 patients were met the criteria and included in final analysis. The flowchart of study population selection and screening is shown in Figure 1. All patients underwent CT follow‐up within 7 days after admission and immediately in case of a worsening condition.
FIGURE 1.
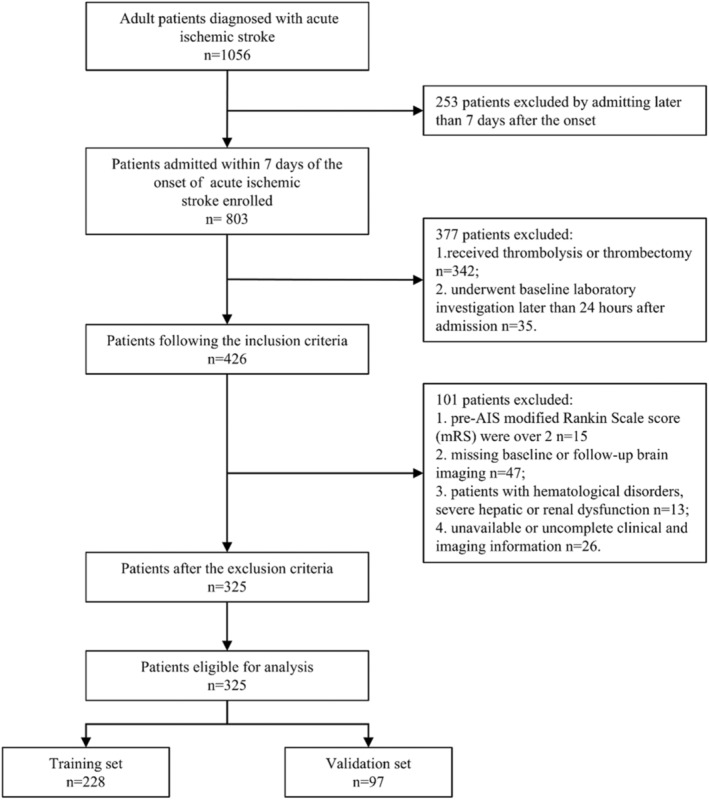
Flow diagram of patients in this study. AIS = acute ischemic stroke.
2.3. Clinical Data and Outcome Assessment
We collected the demographic characteristics, vascular risk factors, medical history, laboratory examination data, imaging information, and therapy treatment (including prior and post‐AIS onset) at admission and during hospitalization.
BMI was calculated by weight (kilograms) divided by the square of the height (meters). The definitions of hypertension, diabetes mellitus, atrial fibrillation, and coronary heart disease are in accordance with WHO criteria. The collateral status was evaluated through the regional leptomeningeal collateral (rLMC) scores in accordance with previous study [19]. The severity of stroke was assessed by the NIHSS at admission and the stroke subtypes were classified according to the Trial of Org 10172 in Acute Stroke Treatment (TOAST) classification, as described previously [20].
All blood venous samples, including complete blood count (CBC), biochemistry panel, coagulation, and thyroid functions were collected and tested within 24 h of admission in accordance with the standard institutional guidelines [11, 12, 13]. The inflammatory parameters derived by CBC were also calculated. The neutrophil‐to‐lymphocyte ratio (NLR), systemic immune‐inflammation index (SII), platelet–lymphocyte ratio (PLR), lymphocyte‐to‐monocyte ratio (LMR), neutrophil‐to‐albumin ratio (NAR), prognostic nutritional index (PNI), derived neutrophil‐to‐lymphocyte ratio (dNLR), albumin–bilirubin (ALBI), platelet–albumin–bilirubin (PALBI), and low‐density lipoprotein cholesterol‐to‐lymphocyte ratio were defined as previous studies described [18, 21, 22].
The primary outcome was defined as the occurrence of sHT within 7 days after admission based on the initial and follow‐up brain imaging [23]. HT was defined as any type of intracranial hemorrhage (ICH) observed on follow‐up CT, which was not observed on initial CT imaging according to the European Cooperative Acute Stroke Study (ECASS) II criteria [24]. All enrolled patients underwent at least one follow‐up neuroimaging (CT and/or MRI) within 7 days after admission and immediately in case of a worsening condition. Two neurologists who were blinded to the patients' information independently reviewed and evaluated the neuroimages. If there were any controversial diagnoses, the images would be reviewed by a third neurologist. In line with previous studies, the HT observed in patients who received conventional medical therapy alone was regarded as sHT in this study [4, 25]. Due to the limitation in sample size, the subtypes of HT were not categorized.
2.4. Development of the Nomogram
2.4.1. Variables Selection and Nomogram Model Construction
We randomly divided the whole cohort into the nomogram development set and validation set at a 7:3 ratio. The training cohort was used to build the nomogram. Considering the possibility of multicollinearity among inflammatory biomarkers, we initially conducted the Least Absolute Shrinkage and Selection Operator (LASSO) analysis with 10‐fold cross‐validation to exclude the relatively unimportant variables and select important variables by incorporating an L1 regularization penalty, thereby simplifying the model structure and preventing overfitting. Inflammatory biomarkers with nonzero coefficients in the LASSO regression were combined to develop a novel index [22]. Sensitivity analysis involving stratified analysis and interaction test was also conducted to evaluate whether the inflammatory biomarkers selected by LASSO exhibit potential interactive or synergistic effects Subsequently, univariable and multivariable logistic regression were used to identify independent risk factors for sHT. For the multivariable analysis, variables that showed a p < 0.05 in the univariate analysis and were clinically relevant were included.
The optimal cut‐off value of these identified continuous factors for predicting HT of AIS patients with conventional medical treatment alone was determined through the receiver operating characteristic (ROC) curves, which were then classified as categorical variables according to the Youden index, respectively.
The nomogram of the prediction model based on the risk factors selected through multivariable logistic regression was established using stepwise logistic regression analyses. The F probability thresholds were set at 0.05 for entry and 0.10 for removal. The effect estimates of these selected factors were presented as the odds ratios (OR) with 95% confidence interval (CI) and p values.
2.4.2. Validation and Evaluation of the Nomogram
The evaluation of the effect of the nomogram by internal validation in the training cohort bootstrapping validation (500 bootstrap resamples) and external validation in the validation cohort. Then, we conducted the area under the ROC curve (AUC) to evaluate the predictive accuracy of the nomogram. The calibration curves were plotted to assess the calibration of the nomogram in both the training and the validation cohort by comparing the predictive sHT occurrence with actual observed risk. For the clinical usefulness of our nomogram, we further assessed the decision curve analysis (DCA) to quantify the net benefit across a range of threshold probabilities.
2.5. Statistical Analyses
All patients were randomly assigned into two cohorts in a ratio of 7:3: the training cohort and the validation cohort. Descriptive statistics and univariate comparisons were conducted in both cohorts. Continuous data were expressed as mean ± standard deviation (SD) or median (interquartile range [IQR]) by using Student's t‐test or Mann–Whitney U‐test. Categorical variables were shown as absolute values (percentages) through Chi‐square test or Fisher's exact test. The LASSO regression was used to select important inflammatory biomarkers. And the univariable and multivariable logistic regression were applied to determine the independent risk factors of sHT occurrence in AIS patients receiving conventional medical treatment. All statistical analyses were two tailed, and p < 0.05 was considered statistically significant. SPSS 25.0 (IBM, Armonk, NY, United States) and R software (version 4.0.2; R Foundation for Statistical Computing, Vienna, Austria) were used for all statistical analyses.
3. Results
3.1. Baseline Characteristics of Participants
From 803 patients with AIS, we identified 325 patients with AIS receiving conventional medical treatment solely who met our study criteria and enrolled our final analysis (Figure 1). A total of 9.5% (31 patients) sHT were found among total cohort. Of these patients, the average age was 69.1 ± 14.2 years, and 50.85% (300 patients) were male. All patients were randomly assigned to the training cohort (7/10 of the sample, n = 228) and the validation cohort (3/10 of the sample, n = 97). There were 22 (9.6%) patients and 9 (9.3%) patients occurred sHT in the training cohort and validation cohort, respectively. The demographic and clinical characteristics of the total patients and the comparison of the training and validating cohorts are presented in Table 1. No significant differences in demographics and clinical characteristics were found between both cohorts.
TABLE 1.
Demographic and clinical characteristics of patients in the training and validation cohorts (n = 325).
| All patients (n = 325) | Training cohort (n = 228) | Validation cohort (n = 97) | p | |
|---|---|---|---|---|
| Age, mean ± SD, year | 69.1 ± 14.2 | 69.9 ± 13.1 | 67.2 ± 16.3 | 0.124 |
| Gender, n (%) | 0.126 | |||
| Female | 145 (44.6%) | 108 (47.4%) | 37 (38.1%) | |
| Male | 300 (50.85%) | 120 (52.6%) | 60 (61.9%) | |
| Blood pressure, mean ± SD, mmHg | ||||
| SBP | 149.4 ± 25.2 | 148.3 ± 25.0 | 151.8 ± 25.7 | 0.258 |
| DBP | 85.1 ± 15.0 | 83.8 ± 15.1 | 88.2 ± 14.5 | 0.015* |
| BMI, mean ± SD, kg/m2 | 23.7 ± 3.2 | 23.9 ± 3.2 | 23.5 ± 3.1 | 0.387 |
| Preexisting conditions, n (%) | ||||
| Hypertension | 187 (57.5%) | 136 (59.6%) | 51 (52.6%) | 0.238 |
| Diabetes mellitus | 54 (16.6%) | 34 (14.9%) | 20 (20.6%) | 0.206 |
| Atrial fibrillation | 82 (25.2%) | 59 (25.9%) | 23 (23.7%) | 0.681 |
| Coronary heart disease | 42 (12.9%) | 30 (13.2%) | 12 (12.4%) | 0.847 |
| Current smoking | 119 (36.6%) | 83 (36.4%) | 36 (37.1%) | 0.903 |
| Medication history, n (%) | ||||
| Antiplatelet, n (%) | 39 (12.0%) | 26 (11.4%) | 13 (13.4%) | 0.612 |
| Anticoagulant, n (%) | 39 (12.0%) | 29 (12.7%) | 10 (10.3%) | 0.541 |
| Statins, n (%) | 33 (10.2%) | 25 (11.0%) | 8 (8.2%) | 0.458 |
| Clinical variables | ||||
| Baseline NIHSS, median (IQR) | 316.5 ± 400.3 | 10.1 ± 7.7 | 10.0 ± 7.8 | 0.889 |
| TOAST | 0.140 | |||
| LAO, n (%) | 112 (34.5%) | 84 (36.8%) | 28 (28.9%) | |
| CE, n (%) | 135 (41.5%) | 96 (42.1%) | 39 (40.2%) | |
| SAO, n (%) | 20 (6.2%) | 12 (5.3%) | 8 (8.2%) | |
| OE, n (%) | 10 (3.1%) | 4 (1.8%) | 6 (6.2%) | |
| UE, n (%) | 48 (14.8%) | 32 (14.0%) | 16 (16.5%) | |
| Onset to admission time, median (IQR), min | 10.1 ± 7.7 | 305.7 ± 277.7 | 341.6 ± 597.2 | 0.461 |
| rLMC, median (IQR) | 13.9 ± 4.8 | 13.9 ± 4.7 | 13.8 ± 5.1 | 0.835 |
| Laboratory parameters, mean ± SD | ||||
| NLR | 6.2 ± 5.7 | 6.2 ± 5.8 | 6.3 ± 5.5 | 0.984 |
| SII | 1037.7 ± 1277.0 | 1066.7 ± 1424.9 | 970.2 ± 839.9 | 0.541 |
| PLR | 150.6 ± 99.9 | 155.1 ± 103.2 | 140.0 ± 91.3 | 0.222 |
| LMR | 5.2 ± 20.4 | 5.7 ± 24.3 | 4.2 ± 4.1 | 0.563 |
| NAR | 0.2 ± 0.1 | 0.2 ± 0.2 | 0.2 ± 0.1 | 0.679 |
| PNI | 42.1 ± 5.0 | 41.9 ± 5.5 | 42.6 ± 3.8 | 0.258 |
| DNLR | −1.1 ± 11.0 | −0.6 ± 11.9 | −2.5 ± 8.2 | 0.143 |
| ALBI | −2.9 ± 0.4 | −2.8 ± 0.5 | −2.9 ± 0.3 | 0.32 |
| PALBI | −1.2 ± 0.3 | −1.2 ± 0.3 | −1.2 ± 0.2 | 0.774 |
| LDL‐C/lymphocyte | 2.3 ± 1.4 | 2.3 ± 1.4 | 2.2 ± 1.6 | 0.551 |
| Platelet, ×109/L | 167.9 ± 65.4 | 170.9 ± 67.9 | 160.7 ± 59.0 | 0.196 |
| Hb, g/L | 133.4 ± 20.0 | 132.7 ± 19.7 | 135.1 ± 20.8 | 0.323 |
| INR | 1.3 ± 4.7 | 1.0 ± 0.2 | 1.9 ± 8.5 | 0.123 |
| DD, mg/L | 2.1 ± 4.1 | 2.0 ± 4.3 | 2.1 ± 3.9 | 0.853 |
| TC, mmol/L | 7.3 ± 37.8 | 8.7 ± 45.3 | 4.2 ± 1.1 | 0.338 |
| TG, mmol/L | 2.1 ± 9.9 | 2.3 ± 11.9 | 1.7 ± 1.2 | 0.625 |
| LDL, mmol/L | 2.5 ± 1.0 | 2.5 ± 1.0 | 2.5 ± 0.9 | 0.697 |
| HDL, mmol/L | 1.6 ± 4.4 | 1.4 ± 0.5 | 2.1 ± 8.0 | 0.168 |
| Serum glucose, mmol/L | 10.6 ± 47.1 | 11.7 ± 56.3 | 8.0 ± 2.8 | 0.525 |
| Albumin, g/L | 41.9 ± 5.1 | 41.7 ± 5.4 | 42.4 ± 4.1 | 0.290 |
| Uric acid, μmol/L | 363.5 ± 118.2 | 364.2 ± 122.2 | 361.9 ± 109.2 | 0.876 |
| Creatinine, μmol/L | 78.4 ± 30.8 | 78.1 ± 32.2 | 79.2 ± 27.4 | 0.784 |
| Treatment after admission, n (%) | ||||
| Antiplatelet | 274 (84.3%) | 190 (83.3%) | 84 (86.6%) | 0.459 |
| Anticoagulant | 55 (16.9%) | 38 (16.7%) | 17 (17.5%) | 0.85 |
| Statins | 289 (88.9%) | 203 (89.0%) | 86 (88.7%) | 0.921 |
| Antihypertensives | 134 (41.2%) | 93 (40.8%) | 41 (42.3%) | 0.804 |
| HT, n (%) | 31 (9.5%) | 22 (9.6%) | 9 (9.3%) | 0.917 |
Abbreviations: ALBI = albumin–bilirubin; BMI=body mass index; CE = cardioembolic; DBP=diastolic blood pressure; DD=D‐Dimer; dNLR = derived neutrophil‐to‐lymphocyte ratio; HDL = high‐density lipoprotein; HT = hemorrhagic transformation; INR = international normalized ratio; IQR = interquartile range; LAO = large vessels atherosclerosis; LDL = low‐density lipoprotein; LMR = lymphocyte‐to‐monocyte ratio; NAR = neutrophil‐to‐albumin ratio; NATG = NAR–triglyceride ratio; NIHSS = National Institute of Health Stroke Scale; NLR = neutrophil‐to‐lymphocyte ratio; OE = other etiology; PALBI = platelet–albumin–bilirubin; PLR = platelet–lymphocyte ratio; PNI = prognostic nutritional index; rLMC = regional leptomeningeal score; SAO=small‐artery occlusion; SBP=systolic blood pressure; SD=Standard deviation; SII = systemic immune‐inflammation index; TC = total cholesterol; TG = triglyceride; TOAST = Trial of ORG 10172 in Acute Stroke Treatment; UE = undetermined etiology.
p value less than 0.05.
3.2. LASSO Regression for Variables Selection
We performed the LASSO regression to select important variables from 25 inflammatory biomarkers. Figure 2A shows the curve for partial likelihood deviance (binomial deviance), while Figure 2B depicts the coefficient profile plot. The optimal lambda (λ) value, determined at 1 standard error (1 se), was 0.0541 [log (lambda.1 se) = −2.9163], leading to the selection of NAR and triglyceride (TG) as significant factors. These were then incorporated into a novel index, defined as NATG, using the formula: NATG = 0.56 * NAR + 0.0025 * TG. Moreover, the sensitivity analysis indicated that NAR and TG had no interactive effect (Table S1).
FIGURE 2.
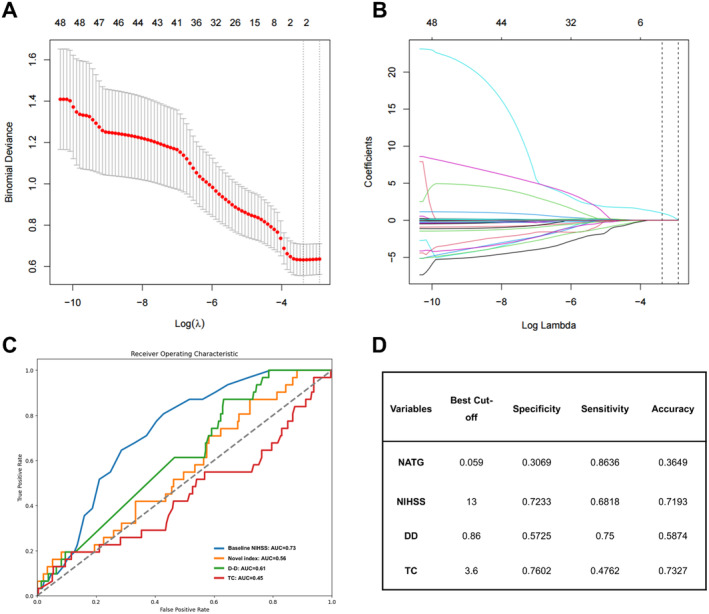
LASSO regression was used to select potential factors and develop a novel laboratory index, while ROC curves were used to evaluate the predictive value and determine the optimal cut‐off value of independent risk factors. (A) Partial likelihood deviance curve (binomial deviance). (B) Coefficient profile plot. (C) ROC curves. (D) Optimal cut‐off value. AUC = area under the ROC curve; DD=D‐dimer; LASSO = Least absolute shrinkage and selection operator; NATG = NAR–triglyceride ratio; NIHSS=National Institute of Health Stroke Scale; ROC = receiver operating characteristic; TC = total cholesterol.
3.3. Independent Predictors in the Training Cohort
To identify the independent factors related to sHT, univariable and multivariable logistic regression analyses were conducted in the training cohort, as shown in Table 2. In the univariate logistic regression analysis, gender, prior‐stroke anticoagulant use, baseline NIHSS, NATG, and statin use at admission were significantly associated with sHT in training cohort. After adjusting for potential confounders (Model 1: adjusted for age and gender; and Model 2: adjusted for age, gender, baseline NIHSS, TOAST, anticoagulant history, statins after admission, and antihypertension after admission), baseline NIHSS (OR = 1.09, 95% CI (1.02, 1.16), p = 0.0095), NATG (OR = 1534.87, 95% CI (5.02, 469638.44), p = 0.0120), D‐dimer (DD) (OR = 1.12, 95% CI (1.01, 1.25), p = 0.0249), total cholesterol (TC) (OR = 1.01, 95% CI (1.00, 1.01), p = 0.0280) were independent risk factors for the sHT (Table 2).
TABLE 2.
Univariate and multivariate logistic regression analysis of prognostic factors for spontaneous hemorrhage transformation in AIS patients in training set.
| Characteristics | Univariate regression | Multivariate regression | |
|---|---|---|---|
| OR (95% CI), p | Model 1 a | Model 2 b | |
| OR (95% CI), p | OR (95% CI), p | ||
| Age, year | 1.01 (0.98, 1.05) 0.5673 | 1.00 (0.97, 1.04) 0.8900 | 0.99 (0.95, 1.03) 0.6715 |
| Gender, male | 0.38 (0.15, 0.98) 0.0456 | 0.39 (0.15, 1.01) 0.0537 | 0.50 (0.16, 1.55) 0.2312 |
| SBP, mmHg | 1.00 (0.98, 1.02) 0.8013 | 1.00 (0.98, 1.02) 0.7033 | 1.00 (0.98, 1.02) 0.8477 |
| DBP, mmHg | 1.01 (0.98, 1.04) 0.6111 | 1.01 (0.98, 1.04) 0.5441 | 1.02 (0.99, 1.05) 0.3266 |
| BMI, kg/m2 | 1.04 (0.85, 1.28) 0.7008 | 1.04 (0.85, 1.27) 0.7237 | 0.93 (0.71, 1.20) 0.5688 |
| Preexisting conditions | |||
| Hypertension | 0.79 (0.33, 1.92) 0.6083 | 0.67 (0.26, 1.73) 0.4045 | 0.43 (0.14, 1.37) 0.1540 |
| Diabetes mellitus | 1.80 (0.61, 5.24) 0.2846 | 1.65 (0.56, 4.92) 0.3649 | 1.88 (0.56, 6.38) 0.3091 |
| Atrial fibrillation | 1.74 (0.69, 4.38) 0.2419 | 1.36 (0.51, 3.65) 0.5358 | 0.55 (0.15, 2.04) 0.3681 |
| Coronary heart disease | 1.54 (0.48, 4.90) 0.4662 | 1.27 (0.38, 4.20) 0.6977 | 0.77 (0.21, 2.88) 0.7018 |
| Current smoking | 0.48 (0.17, 1.36) 0.1682 | 0.84 (0.23, 3.07) 0.7901 | 1.21 (0.28, 5.16) 0.7987 |
| Medication history | 0.87 (0.46, 1.64) 0.6718 | 0.58 (0.26, 1.27) 0.1714 | 0.66 (0.26, 1.63) 0.3634 |
| Antiplatelet | 1.26 (0.34, 4.58) 0.7294 | 1.14 (0.31, 4.20) 0.8487 | 0.88 (0.21, 3.65) 0.8592 |
| Anticoagulant | 2.98 (1.06, 8.39) 0.0382* | 2.65 (0.93, 7.57) 0.0691 | 1.80 (0.53, 6.09) 0.3465 |
| Statins | 1.96 (0.61, 6.33) 0.2619 | 2.27 (0.68, 7.59) 0.1821 | 2.18 (0.57, 8.29) 0.2543 |
| Clinical variables | |||
| Baseline NIHSS | 1.09 (1.04, 1.15) 0.0013* | 1.09 (1.03, 1.15) 0.0032* | 1.09 (1.02, 1.16) 0.0095* |
| TOAST | |||
| LAO, n (%) | — | — | — |
| CE, n (%) | 3.13 (0.98, 10.01) 0.0541 | 2.36 (0.70, 7.94) 0.1649 | 1.08 (0.28, 4.23) 0.9116 |
| SAO, n (%) | 0.00 (0.00, Inf) 0.9898 | 0.00 (0.00, Inf) 0.9898 | 0.00 (0.00, Inf) 0.9896 |
| OE, n (%) | 6.67 (0.56, 79.29) 0.1332 | 9.99 (0.74, 134.46) 0.0827 | 6.10 (0.38, 98.88) 0.2035 |
| UE, n (%) | 2.86 (0.67, 12.20) 0.1562 | 2.51 (0.58, 10.92) 0.2191 | 1.51 (0.31, 7.32) 0.6104 |
| Onset to admission time, min | 1.00 (1.00, 1.00) 0.4765 | 1.00 (1.00, 1.00) 0.5112 | 1.00 (1.00, 1.00) 0.4636 |
| rLMC | 0.94 (0.86, 1.03) 0.1659 | 0.96 (0.87, 1.06) 0.4097 | 1.05 (0.94, 1.18) 0.3931 |
| Laboratory parameters | |||
| NATG | 257.59 (1.38, 48103.06) 0.0375* | 388.09 (1.92, 78608.77) 0.0278* | 1534.87 (5.02, 469638.44) 0.0120* |
| NLR | 1.04 (0.98, 1.10) 0.2453 | 1.05 (0.98, 1.12) 0.1532 | 1.01 (0.94, 1.10) 0.7211 |
| SII | 1.00 (1.00, 1.00) 0.6638 | 1.00 (1.00, 1.00) 0.5925 | 1.00 (1.00, 1.00) 0.6716 |
| PLR | 1.00 (0.99, 1.00) 0.6717 | 1.00 (0.99, 1.00) 0.6159 | 1.00 (0.99, 1.00) 0.1847 |
| LMR | 0.96 (0.81, 1.14) 0.6526 | 0.95 (0.78, 1.15) 0.6080 | 0.98 (0.85, 1.14) 0.8398 |
| NAR | 19.39 (0.47, 797.17) 0.1179 | 19.16 (0.36, 1030.43) 0.1465 | 15.96 (0.21, 1216.70) 0.2104 |
| PNI | 1.02 (0.94, 1.10) 0.6327 | 1.03 (0.95, 1.11) 0.5084 | 1.00 (0.93, 1.09) 0.9144 |
| dNLR | 0.99 (0.89, 1.09) 0.7756 | 0.97 (0.81, 1.16) 0.7100 | 0.95 (0.77, 1.17) 0.6118 |
| ALBI | 0.80 (0.32, 1.97) 0.6287 | 0.74 (0.30, 1.82) 0.5116 | 0.83 (0.34, 2.04) 0.6893 |
| PALBI | 1.60 (0.27, 9.31) 0.6021 | 1.49 (0.24, 9.25) 0.6699 | 1.21 (0.36, 4.07) 0.7531 |
| LDL‐C/lymphocyte | 0.96 (0.69, 1.33) 0.8104 | 0.96 (0.68, 1.34) 0.8028 | 0.95 (0.67, 1.34) 0.7578 |
| Platelet, ×109/L | 1.00 (0.99, 1.00) 0.3894 | 1.00 (0.99, 1.00) 0.2947 | 0.99 (0.99, 1.00) 0.2017 |
| Hb, g/L | 1.00 (0.97, 1.02) 0.7278 | 1.01 (0.98, 1.03) 0.6501 | 1.01 (0.98, 1.04) 0.4981 |
| INR | 1.13 (0.10, 13.04) 0.9227 | 1.18 (0.09, 15.58) 0.9000 | 0.15 (0.00, 7.28) 0.3348 |
| DD, mg/L | 1.09 (1.00, 1.20) 0.0561 | 1.11 (1.01, 1.22) 0.0345* | 1.12 (1.01, 1.25) 0.0249* |
| TC, mmol/L | 1.00 (1.00, 1.01) 0.1235 | 1.00 (1.00, 1.01) 0.1208 | 1.01 (1.00, 1.01) 0.0280* |
| TG, mmol/L | 1.03 (0.97, 1.10) 0.3195 | 1.04 (0.97, 1.11) 0.2657 | 1.05 (0.97, 1.13) 0.2346 |
| LDL, mmol/L | 0.65 (0.39, 1.07) 0.0877 | 0.63 (0.38, 1.04) 0.0723 | 0.79 (0.46, 1.38) 0.4111 |
| HDL, mmol/L | 1.63 (0.83, 3.20) 0.1556 | 1.56 (0.76, 3.21) 0.2286 | 1.70 (0.71, 4.07) 0.2307 |
| Serum glucose, mmol/L | 1.00 (0.97, 1.02) 0.8181 | 1.00 (0.96, 1.03) 0.7954 | 1.00 (0.95, 1.05) 0.8481 |
| Albumin, g/L | 1.02 (0.95, 1.10) 0.5913 | 1.03 (0.95, 1.11) 0.4657 | 1.01 (0.93, 1.09) 0.8202 |
| Uric acid, μmol/L | 1.00 (0.99, 1.00) 0.4163 | 1.00 (1.00, 1.00) 0.6521 | 1.00 (0.99, 1.00) 0.5312 |
| Creatinine, μmol/L | 1.00 (0.98, 1.01) 0.5653 | 1.00 (0.98, 1.01) 0.8770 | 0.99 (0.97, 1.02) 0.6655 |
| Treatment after admission | |||
| Antiplatelet | 0.49 (0.18, 1.35) 0.1673 | 0.48 (0.17, 1.35) 0.1640 | 0.89 (0.22, 3.55) 0.8665 |
| Anticoagulant | 0.77 (0.22, 2.75) 0.6890 | 0.71 (0.19, 2.61) 0.6008 | 0.50 (0.11, 2.32) 0.3765 |
| Statins | 0.27 (0.09, 0.77) 0.0148* | 0.27 (0.09, 0.79) 0.0165* | 0.53 (0.16, 1.75) 0.2973 |
| Antihypertensives | 2.81 (1.13, 7.01) 0.0264* | 2.52 (0.99, 6.40) 0.0523* | 2.67 (0.93, 7.69) 0.0682 |
Abbreviations: AIS = Acute ischemic stroke; ALBI = albumin–bilirubin; BMI=body mass index; CE = cardioembolic; CI=confidence interval; DBP=diastolic blood pressure; DD=D‐dimer; dNLR = derived neutrophil‐to‐lymphocyte ratio; HDL = high‐density lipoprotein; II = systemic immune‐inflammation index; INR = international normalized ratio; LAO = Large vessels atherosclerosis; LDL = low‐density lipoprotein; LMR = lymphocyte‐to‐monocyte ratio; NAR = neutrophil‐to‐albumin ratio; NATG = NAR–triglyceride ratio; NIHSS=National Institute of Health Stroke Scale; NLR = neutrophil‐to‐lymphocyte ratio; SOE = other etiology; OR = odds ratio; PALBI = platelet–albumin–bilirubin; PLR = platelet–lymphocyte ratio; PNI = prognostic nutritional index; rLMC = regional leptomeningeal score; SAO=small‐artery occlusion; SBP=systolic blood pressure; TC = total cholesterol; TG = triglyceride; TOAST = Trial of ORG 10172 in Acute Stroke Treatment; UE = undetermined etiology.
Model 1 adjusted for age and gender.
Model 2 adjusted for Model 1 adding to baseline NIHSS, TOAST, anticoagulant history, statins after admission, and antihypertension after admission.
p value less than 0.05.
Subsequently, we conducted Youden index and AUC‐ROC to determine the optimal cut‐off threshold for those continuous independent risk factors to distinguish between sHT and non‐sHT (Figure 2C). The best cut‐off values for these risk factors were 0.059 for the NATG, 13 for the baseline NIHSS, 3.6 for TC, and 0.86 for DD, respectively (Figure 2D).
3.4. Development and Validation of the Nomogram
The training cohort (228 patients) was included in the study for establishing the nomogram. Variables with significant statistical differences in the multivariable logistic regression, including baseline NIHSS ≥ 13, novel index ≥ 0.059, TC ≥ 3.6, and DD ≥ 0.86, were selected for developing the nomogram. As shown in Figure 3, the total score was calculated by adding the corresponding score of each risk factor to estimate the probability of sHT.
FIGURE 3.
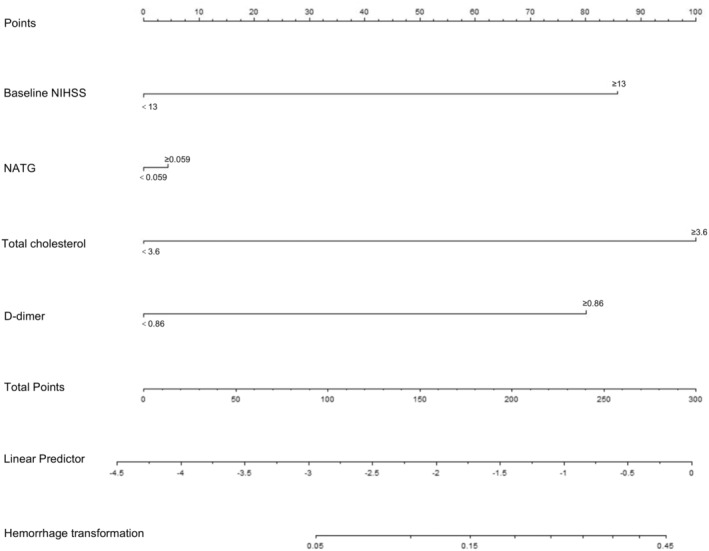
The novel indicator integrating NATG and other clinical features was developed into nomogram. NATG = NAR–triglyceride ratio; NIHSS = National Institute of Health Stroke Scale; TOAST = Trial of ORG 10172 in Acute Stroke Treatment.
The calibration plots using 500 bootstrapping resamples displayed a good consistency of the model in both the internal (0.804, 95% CI: 0.643–0.918) and external validation (0.713, 95% CI: 0.499–0.868), as shown in Figure 4A,C. Moreover, DCA was performed to estimate the clinical usefulness, with the net benefit rate plotted on the y‐axis and the high‐risk threshold on the x‐axis, where the high‐risk threshold was set at 0.1. As shown in Figure 4B,D, the DCA demonstrated good practicality in both internal and external validation.
FIGURE 4.
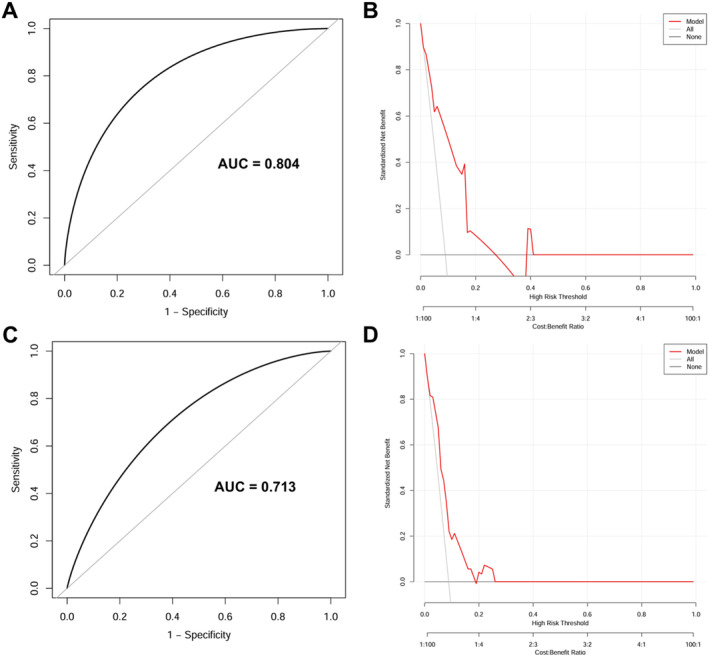
The performance of the nomogram model. (A, B) The training cohort. (C, D) The validation cohort. (A, C) Calibration curves suggest that our nomogram performed well in both derivations. (B, D) The DCA curves show that our nomogram had good practicability in both internal and external validation. AUC = area under the ROC curve; DCA = decision curve analysis; ROC = Receiver operating characteristic.
4. Discussion
HT is a severe complication of AIS with a significant impact on patients' prognosis. Accumulating evidence suggests that inflammation plays a crucial role in the pathophysiology of AIS and thrombosis. Furthermore, inflammation and immune system activation are likely key contributors to blood–brain barrier (BBB) disruption in the pathophysiology of HT [5]. sHT can be challenging in early identification and detection owing to its often asymptomatic or without warning signs [26]. Several inflammatory biomarkers derived from CBC and blood biochemistry have been reported that are related to occurrence of HT and may have predictive or prognostic value for HT. Although the role of these inflammatory biomarkers in predicting HT risk following IVT or EVT in AIS patients has been extensively investigated, there is still a lack of understanding of their effects on sHT, given that predictors of sHT differ from those in HT following IVT [14, 26, 27, 28]. Moreover, inflammatory biomarkers could be promising as significant predictors of sHT, potentially aiding in clinical decision‐making and monitoring prognosis during the acute stage [26]. Therefore, this study aimed to determine the independent predictor within inflammatory biomarkers and to develop a novel inflammatory index. Furthermore, we establish a nomogram model based on NATG and other significant risk factors for convenient usefulness in clinical practice.
In the present study, sHT was observed in 31 of 325 patients (9.5%) over a 3‐month period after AIS onset, which was similar to previous studies (9.6%–12.3%) [26, 29]. The novel index combined with NAR and TG was positively associated with the risk of sHT in AIS patients and the significance relationship was further supported in the validation cohort. Importantly, the predictive power of NATG for sHT was superior to that of the other inflammatory biomarkers. As for NAR, our previous study found that NAR levels have stated a negative relationship of 3‐month functional outcomes in AIS patients. Moreover, a prior study found that NAR could be recognized as an independent risk factor for aneurysmal subarachnoid hemorrhage [30]. The NAR, defined as the neutrophil counts divided by the serum albumin, is the result of increasing neutrophil and/or decreasing serum albumin level [31]. Specifically, elevated neutrophil counts represented an inflammatory activity that could injure vascular and cause tissue ischemia [32]. It is noted that increasing neutrophil also has a profound impact on plaque development and instability which may motivate the platelet aggregation [33]. Regarding TG, several previous studies demonstrated that there was a correction between serum TG level and cerebral hemorrhage through undermining cerebral vessel completeness [34, 35]. Moreover, we also evaluated the interaction between NAR and TG and found no significant effect. Based on above, it is reasonable that integrating NAR and TG into a novel indicator (NATG) has demonstrated potential importance for predicting the occurrence of sHT with AIS in our nomogram. Further confirmations in different populations and larger sample sizes should be conducted in future.
Additionally, DD has been identified as predictor of sHT in our nomogram model. Both are coagulation and fibrinolysis parameters. Obviously, the coagulative function plays pivotal role in hemorrhagic diseases, including HT in AIS [36]. DD is a product of fibrin degradation by plasmin, and the elevating DD level indicates a hypercoagulable status [37, 38]. In accordance with previous studies, we found that elevating DD was associated with a higher sHT risk [39, 40]. Specifically, DD level greater than 0.86 mg/L was identified as the optimal cut‐off value for predicting sHT risk in this study. In brief, DD is an independent indicator of the sHT occurrence.
Consistent with previous studies [9, 10, 14], we found that the baseline NIHSS was a significant predictor of sHT in AIS patients. Notably, the NIHSS is the most critical predictor in our nomogram model. It is known that the higher the NIHSS, the more severe the degree of neurological deficiency and the greater the susceptibility to HT in AIS patients [41]. Although poor collateral circulation has been reported as a predictor of HT in previous studies [13, 41, 42], there was no statistically significant association between collateral status (rLMC) and the occurrence of sHT in our study. The possible reasons may be due to most previous studies focusing on the risk of HT in AIS patients undergoing recanalization treatments [41, 42], whereas our study aimed to identify the risk factors of sHT in AIS patients without thrombolysis and thrombectomy treatments. Another reason could be the limited sample size of our study. Furthermore, we would consider more effective imaging markers of collateral status to predict the risk of sHT in AIS patients, and larger‐scale investigations may be warranted to clarify these results and confirm their potential clinical value.
The main strength of this study is the identification of NATG—a novel indicator derived from inflammatory biomarkers and serum lipids, and the construction of a nomogram model for clinical application. Moreover, our nomogram demonstrated significant predictive capability, achieving an AUC of 0.804. However, some limitations of our study should be noted. Firstly, given our study is a single‐center, retrospective observational design with a relatively small sample size, it inevitably contains biases, including selection bias. Secondly, according to ECASS criteria, HT could be classified into HI or PH subtypes. However, we did not perform statistical analysis on each HT subgroup, considering the limited sample size and need for sufficient statistic power. Thirdly, we collected blood samples within the first 24 h after admission, which limits the dynamic observation of changes in inflammatory indices. Future studies should involve larger cohorts, prospective data collection, and multiple centers to address these limitations.
In conclusion, this study found a novel combined indicator, NATG, that was significantly positively related to sHT occurrence in AIS patients. A nomogram model based on NATG and other important risk factors was constructed for clinical use, which is beneficial for accurately identifying individuals at high risk of sHT and enabling timely prevention and therapeutic.
Author Contributions
J.B., J.F., and L.H. researched the literature and conceived the study. J.B., M.M., and K.W. were involved in protocol development, gaining ethical approval, and patient recruitment. J.B., M.M., J.W., M.Z., J.G., and N.C. conducted the data analysis and interpretation. J.B. and M.M. wrote the first draft of the manuscript. All authors reviewed and edited the manuscript and approved the final version of the manuscript.
Ethics Statement
The Ethical Review Committee of the West China Hospital of Sichuan University approved this research (No. 2020(069)).
Consent
All authors agreed to submit the paper.
Conflicts of Interest
The authors declare no conflicts of interest.
Supporting information
Table S1.
Acknowledgments
We thank the participants of the study and our colleagues at the Department of Neurology at West China Hospital of Sichuan University.
Funding: This study was supported by the National Natural Science Foundation of China (82271360) and the Sichuan Province Science and Technology Support Program (2022YFS0139 and 2023NSFSC1562).
Jiajia Bao and Mengmeng Ma contributed equally to this study.
Contributor Information
Jinghuan Fang, Email: jinghuan_fang@126.com.
Li He, Email: heli2003new@126.com.
Data Availability Statement
The datasets used and/or analyzed during the current study are available from the corresponding author upon reasonable request.
References
- 1. Spronk E., Sykes G., Falcione S., et al., “Hemorrhagic Transformation in Ischemic Stroke and the Role of Inflammation,” Frontiers in Neurology 12 (2021): 661955. [DOI] [PMC free article] [PubMed] [Google Scholar]
- 2. Sun J., Meng D., Liu Z., et al., “Neutrophil to Lymphocyte Ratio Is a Therapeutic Biomarker for Spontaneous Hemorrhagic Transformation,” Neurotoxicity Research 38 (2020): 219–227. [DOI] [PubMed] [Google Scholar]
- 3. Lindley R. I., Wardlaw J. M., Sandercock P. A. G., et al., “Frequency and Risk Factors for Spontaneous Hemorrhagic Transformation of Cerebral Infarction,” Journal of Stroke and Cerebrovascular Diseases 13, no. 6 (2004): 235–246. [DOI] [PubMed] [Google Scholar]
- 4. Chen G., Wang A., Zhao X., et al., “Frequency and Risk Factors of Spontaneous Hemorrhagic Transformation Following Ischemic Stroke on the Initial Brain CT or MRI: Data From the China National Stroke Registry (CNSR),” Neurological Research 38, no. 6 (2016): 538–544. [DOI] [PubMed] [Google Scholar]
- 5. Bagoly Z., “Hemorrhagic Transformation After Acute Ischemic Stroke Thrombolysis Treatment: Navigating the Landscape of Hemostasis Genetic Risk Factors,” Journal of Thrombosis and Haemostasis 22, no. 4 (2024): 919–921. [DOI] [PubMed] [Google Scholar]
- 6. Hiraga A., “Prediction of Hemorrhagic Transformation in Ischemic Stroke,” Neuroepidemiology 33, no. 3 (2009): 266–267. [DOI] [PubMed] [Google Scholar]
- 7. Thomas S. E., Plumber N., Venkatapathappa P., and Gorantla V., “A Review of Risk Factors and Predictors for Hemorrhagic Transformation in Patients With Acute Ischemic Stroke,” International Journal of Vascular Medicine 2021 (2021): 1–8. [DOI] [PMC free article] [PubMed] [Google Scholar]
- 8. Álvarez‐Sabín J., Maisterra O., Santamarina E., and Kase C. S., “Factors Influencing Haemorrhagic Transformation in Ischaemic Stroke,” Lancet Neurology 12, no. 7 (2013): 689–705. [DOI] [PubMed] [Google Scholar]
- 9. Saposnik G., Guzik A. K., Reeves M., Ovbiagele B., and Johnston S. C., “Stroke Prognostication Using Age and NIH Stroke Scale: SPAN‐100,” Neurology 80, no. 1 (2013): 21–28. [DOI] [PMC free article] [PubMed] [Google Scholar]
- 10. Strbian D., Engelter S., Michel P., et al., “Symptomatic Intracranial Hemorrhage After Stroke Thrombolysis: The SEDAN Score,” Annals of Neurology 71, no. 5 (2012): 634–641. [DOI] [PubMed] [Google Scholar]
- 11. Wang L., Song Q., Wang C., et al., “Neutrophil to Lymphocyte Ratio Predicts Poor Outcomes After Acute Ischemic Stroke: A Cohort Study and Systematic Review,” Journal of the Neurological Sciences 406 (2019): 116445. [DOI] [PubMed] [Google Scholar]
- 12. Topcuoglu M. A., Pektezel M. Y., Yilmaz E., and Arsava E. M., “Systemic Inflammation Indices in Patients With Acute Ischemic Stroke Treated With Intravenous Tissue Plasminogen Activator: Clinical Yield and Utility,” Angiology 72, no. 3 (2021): 279–284. [DOI] [PubMed] [Google Scholar]
- 13. Feng X., Ye G., Cao R., et al., “Identification of Predictors for Hemorrhagic Transformation in Patients With Acute Ischemic Stroke After Endovascular Therapy Using the Decision Tree Model,” Clinical Interventions in Aging 15 (2020): 1611–1624. [DOI] [PMC free article] [PubMed] [Google Scholar]
- 14. Zhang X. X., Yao F. R., Zhu J. H., et al., “Nomogram to Predict Haemorrhagic Transformation After Stroke Thrombolysis: A Combined Brain Imaging and Clinical Study,” Clinical Radiology 77, no. 1 (2022): e92–e98. [DOI] [PubMed] [Google Scholar]
- 15. Collins G. S., Reitsma J. B., Altman D. G., and Moons K. G. M., “Transparent Reporting of a Multivariable Prediction Model for Individual Prognosis or Diagnosis (TRIPOD): The TRIPOD Statement,” Annals of Internal Medicine 162, no. 1 (2015): 55–63. [DOI] [PubMed] [Google Scholar]
- 16. Luo Y., Li Y., Dong S., et al., “Development and Validation of a Prognostic Nomogram Based on Objective Nutritional Indexes in Ischemic Stroke Patients With Large Vessel Occlusion Undergoing Endovascular Thrombectomy,” Nutrition, Metabolism, and Cardiovascular Diseases 32, no. 8 (2022): 1903–1912. [DOI] [PubMed] [Google Scholar]
- 17. Naito H., Nezu T., Hosomi N., et al., “Controlling Nutritional Status Score for Predicting 3‐Month Functional Outcome in Acute Ischemic Stroke,” Nutrition 55 (2018): 1–6. [DOI] [PubMed] [Google Scholar]
- 18. Bao J., Li Y., Zhang Y., et al., “Development and Validation of a Novel Nomogram Model Predicting the Unfavorable Outcome Based on NAR and Collateral Status for Patients With AIS,” Journal of Stroke and Cerebrovascular Diseases 33, no. 9 (2024): 107855. [DOI] [PubMed] [Google Scholar]
- 19. Menon B. K., O'Brien B., Bivard A., et al., “Assessment of Leptomeningeal Collaterals Using Dynamic CT Angiography in Patients With Acute Ischemic Stroke,” Journal of Cerebral Blood Flow and Metabolism 33, no. 3 (2013): 365–371. [DOI] [PMC free article] [PubMed] [Google Scholar]
- 20. H. P. Adams, Jr. , Bendixen B. H., Kappelle L. J., et al., “Classification of Subtype of Acute Ischemic Stroke. Definitions for Use in a Multicenter Clinical Trial. TOAST. Trial of Org 10172 in Acute Stroke Treatment,” Stroke 24, no. 1 (1993): 35–41. [DOI] [PubMed] [Google Scholar]
- 21. Güneş M. and Büyükgöl H., “A Novel Predictive Marker for in‐Hospital Mortality in Acute Cerebral Infarction: Low‐Density Lipoprotein Cholesterol to Lymphocyte Ratio,” Cureus 12, no. 8 (2020): e9986. [DOI] [PMC free article] [PubMed] [Google Scholar]
- 22. Zhu X., Cheang I., Xu F., et al., “Long‐Term Prognostic Value of Inflammatory Biomarkers for Patients With Acute Heart Failure: Construction of an Inflammatory Prognostic Scoring System,” Frontiers in Immunology 13 (2022): 1005697. [DOI] [PMC free article] [PubMed] [Google Scholar]
- 23. Shen Z., Jin H., Lu Y., et al., “Predictors and Prognosis of Symptomatic Intracranial Hemorrhage in Acute Ischemic Stroke Patients Without Thrombolysis: Analysis of Data From the Chinese Acute Ischemic Stroke Treatment Outcome Registry,” Frontiers in Neurology 12 (2021): 727304. [DOI] [PMC free article] [PubMed] [Google Scholar]
- 24. Larrue V., von Kummer R., Müller A., et al., “Risk Factors for Severe Hemorrhagic Transformation in Ischemic Stroke Patients Treated With Recombinant Tissue Plasminogen Activator: A Secondary Analysis of the European‐Australasian Acute Stroke Study (ECASS II),” Stroke 32, no. 2 (2001): 438–441. [DOI] [PubMed] [Google Scholar]
- 25. D'Amelio M., Terruso V., Famoso G., et al., “Early and Late Mortality of Spontaneous Hemorrhagic Transformation of Ischemic Stroke,” Journal of Stroke and Cerebrovascular Diseases 23, no. 4 (2014): 649–654. [DOI] [PubMed] [Google Scholar]
- 26. De Andrade J. B. C., Mohr J. P., Lima F. O., et al., “Predictors of Hemorrhagic Transformation Differences Between Patients Treated or Not With Reperfusion Therapy,” Journal of Clinical Neuroscience 101 (2022): 9–15. [DOI] [PubMed] [Google Scholar]
- 27. Cheng Z., Zhan Z., Huang X., Xia L., Xu T., and Han Z., “Troponin Elevation on Admission Along With Dynamic Changes and Their Association With Hemorrhagic Transformation After Thrombolysis,” Frontiers in Aging Neuroscience 13 (2021): 758678. [DOI] [PMC free article] [PubMed] [Google Scholar]
- 28. Cheng X. D., Zhang C. X., Zhang Q., et al., “Predictive Role of Pre‐Thrombolytic Neutrophil‐Platelet Ratio on Hemorrhagic Transformation After Intravenous Thrombolysis in Acute Ischemic Stroke,” Clinical and Applied Thrombosis/Hemostasis 30 (2024): 10760296231223192. [DOI] [PMC free article] [PubMed] [Google Scholar]
- 29. Tan S., Wang D., Liu M., Zhang S., Wu B., and Liu B., “Frequency and Predictors of Spontaneous Hemorrhagic Transformation in Ischemic Stroke and Its Association With Prognosis,” Journal of Neurology 261 (2014): 905–912. [DOI] [PubMed] [Google Scholar]
- 30. Zhang X., Zhang S., Wang C., and Li A., “Neutrophil‐To‐Albumin Ratio as a Novel Marker Predicting Unfavorable Outcome in Aneurysmal Subarachnoid Hemorrhage,” Journal of Clinical Neuroscience 99 (2022): 282–288. [DOI] [PubMed] [Google Scholar]
- 31. Wu T. H., Chien K. L., Lin H. J., et al., “Total White Blood Cell Count or Neutrophil Count Predict Ischemic Stroke Events Among Adult Taiwanese: Report From a Community‐Based Cohort Study,” BMC Neurology 13 (2013): 1–8. [DOI] [PMC free article] [PubMed] [Google Scholar]
- 32. Ernst E., Hammerschmidt D. E., Bagge U., et al., “Leukocytes and the Risk of Ischemic Diseases,” Journal of the American Medical Association 257, no. 17 (1987): 2318–2324. [PubMed] [Google Scholar]
- 33. Frangogiannis N. G., Smith C. W., and Entman M. L., “The Inflammatory Response in Myocardial Infarction,” Cardiovascular Research 53, no. 1 (2002): 31–47. [DOI] [PubMed] [Google Scholar]
- 34. Deng Q. W., Liu Y. K., Zhang Y. Q., et al., “Low Triglyceride to High‐Density Lipoprotein Cholesterol Ratio Predicts Hemorrhagic Transformation in Large Atherosclerotic Infarction of Acute Ischemic Stroke,” Aging (Albany NY) 11, no. 5 (2019): 1589–1601. [DOI] [PMC free article] [PubMed] [Google Scholar]
- 35. Reed D. M., “The Paradox of High Risk of Stroke in Populations With Low Risk of Coronary Heart Disease,” American Journal of Epidemiology 131, no. 4 (1990): 579–588. [DOI] [PubMed] [Google Scholar]
- 36. Bagoly Z., Szegedi I., Kálmándi R., Tóth N. K., and Csiba L., “Markers of Coagulation and Fibrinolysis Predicting the Outcome of Acute Ischemic Stroke Thrombolysis Treatment: A Review of the Literature,” Frontiers in Neurology 10 (2019): 445501. [DOI] [PMC free article] [PubMed] [Google Scholar]
- 37. Koenig W., Rothenbacher D., Hoffmeister A., Griesshammer M., and Brenner H., “Plasma Fibrin D‐Dimer Levels and Risk of Stable Coronary Artery Disease: Results of a Large Case‐Control Study,” Arteriosclerosis, Thrombosis, and Vascular Biology 21, no. 10 (2001): 1701–1705. [DOI] [PubMed] [Google Scholar]
- 38. Lu G., He Q., Shen Y., and Cao F., “Potential Biomarkers for Predicting Hemorrhagic Transformation of Ischemic Stroke,” International Journal of Neuroscience 128, no. 1 (2018): 79–89. [DOI] [PubMed] [Google Scholar]
- 39. Qiu K., Jia Z. Y., Cao Y., et al., “Emergency Admission Plasma D‐Dimer: A Novel Predictor for Symptomatic Intracranial Hemorrhage After Thrombectomy in Acute Ischemic Stroke,” Journal of NeuroInterventional Surgery 15 (2023): e375–e380. [DOI] [PubMed] [Google Scholar]
- 40. Yuan S., Ma Q., Hou C., et al., “The Combination Model of Serum Occludin and Clinical Risk Factors Improved the Efficacy for Predicting Hemorrhagic Transformation in Stroke Patients With Recanalization,” Heliyon 10, no. 2 (2024): e25052. [DOI] [PMC free article] [PubMed] [Google Scholar]
- 41. Cao R., Ye G., Wang R., et al., “Collateral Vessels on 4D CTA as a Predictor of Hemorrhage Transformation After Endovascular Treatments in Patients With Acute Ischemic Stroke: A Single‐Center Study,” Frontiers in Neurology 11 (2020): 60. [DOI] [PMC free article] [PubMed] [Google Scholar]
- 42. Christoforidis G. A., Karakasis C., Mohammad Y., Caragine L. P., Yang M., and Slivka A. P., “Predictors of Hemorrhage Following Intra‐Arterial Thrombolysis for Acute Ischemic Stroke: The Role of Pial Collateral Formation,” American Journal of Neuroradiology 30, no. 1 (2009): 165–170. [DOI] [PMC free article] [PubMed] [Google Scholar]
Associated Data
This section collects any data citations, data availability statements, or supplementary materials included in this article.
Supplementary Materials
Table S1.
Data Availability Statement
The datasets used and/or analyzed during the current study are available from the corresponding author upon reasonable request.