

Abstract
Introduction
Accurate identification and grading of clinically significant prostate cancer (csPCa, Gleason Score ≥ 7) without invasive procedures remains a significant clinical challenge. This study aims to develop and evaluate a two‐stage model designed for precise Gleason grading. The model initially uses radiomics‐based multiparametric MRI to identify csPCa and then refines the Gleason grading by integrating clinical indicators and radiomics features.
Methods
We retrospectively analysed 399 patients with PI‐RADS ≥ 3 lesions, categorising them into non‐significant prostate cancer (nsPCa, 263 cases) and csPCa (136 cases, subdivided by GGs). Regions of interest (ROIs) for the prostate and lesions were manually delineated on T2‐weighted and apparent diffusion coefficient (ADC) images, followed by the extraction of radiomics features. A two‐stage model was developed: the first stage identifies csPCa using radiomics‐based MRI, and the second integrates clinical indicators for Gleason grading. Model efficacy was evaluated by sensitivity, specificity, accuracy and area under the curve (AUC), with external validation on 100 patients.
Results
The first‐stage model demonstrated excellent diagnostic accuracy for csPCa, achieving AUCs of 0.989, 0.982 and 0.976 in the training, testing and external validation cohorts, respectively. The second‐stage model exhibited commendable Gleason grading capabilities, with AUCs of 0.82, 0.844 and 0.83 across the same cohorts. Decision curve analysis supported the clinical applicability of both models.
Conclusions
This study validated the potential of T2W and ADC image radiomics features as biomarkers in distinguishing csPCa. Combining these features with clinical indicators for csPCa Gleason grading provides superior predictive performance and significant clinical benefit.
Keywords: Clinically significant prostate cancer (csPCa), Gleason grading, multiparametric MRI (mpMRI), prostate cancer (PCa), radiomics
This study developed a two‐stage model using radiomics‐based multiparametric MRI and clinical indicators to help identify and grade clinically significant prostate cancer. The model showed promising levels of diagnostic accuracy and predictive performance. Importantly, the results were cautiously confirmed through both internal and external validation processes.

Introduction
Prostate cancer (PCa) is a prevalent global disease, ranking as the second most common cancer and the fifth leading cause of cancer‐related deaths among men. 1 While prostate‐specific antigen (PSA) testing is widely used for PCa screening, its diagnostic accuracy can be affected by various factors such as prostate volume, inflammation and body mass index (BMI). 2
The Gleason Score (GS) is an established measure of PCa aggressiveness, indicating tumour cell differentiation and heterogeneity. GS ≤ 6 are generally considered low‐risk and amenable to active surveillance. 3 The International Society of Urological Pathology (ISUP) introduced the Gleason Grading Group (GGG) to enhance prediction accuracy for tumour progression, capturing PCa's biological traits more effectively. 4 PCa with a Gleason grade (GG) of 2 or higher (GS 3 + 4 and above) is classified as clinically significant (csPCa). 5 However, definitions of csPCa vary across studies, with some classifying it as GG ≥ 3, 6 , 7 , 8 and others using GG > 4. 9 , 10 Gaudiano et al. 8 noted that GG 2 might be considered clinically insignificant (ciPCa). There is a significant histological difference between GG 1 and 2 versus 3 and 4, with GG 2 resembling low‐risk Pca. 11 GG 1 and GG 2 primarily exhibit a ‘3’ pattern, while GG 3, GG 4 (‘4’ pattern) and GG 5 show normal tissue being replaced by cancer cells. 12 GG 2 has a low risk of metastasis, making it suitable for active surveillance, 8 , 13 while GG 5 significantly increases mortality. 14 The GGG is essential for assessing prognosis, guiding treatment and predicting survival in PCa. 4 For patients in GG2, the findings suggest that active surveillance may be a viable option, potentially avoiding unnecessary aggressive treatments. Innovative focal ablative therapies also offer solutions for targeting low to intermediate‐risk PCa, preserving healthy tissue and minimising side effects associated with traditional treatments. 8 In contrast, patients with Gleason patterns ‘4’ and higher usually require more aggressive treatments, such as External Beam Radiation Therapy (EBRT) and Androgen Deprivation Therapy (ADT). GG5 is less differentiated than GG4 and may derive less survival benefit from ADT, necessitating more intensive interventions. 15 Research indicates that cancer‐specific survival rates are poorer for GG5 compared to GG4, highlighting the need for aggressive treatment and close monitoring of these patients. 14
Obtaining the GS requires an invasive procedure, which highlights the urgent need for reliable non‐invasive diagnostic methods to reduce reliance on biopsies. The European Association of Urology recommends multiparametric magnetic resonance imaging (mpMRI) before prostate biopsy for both biopsy‐naïve individuals and those with previously negative results, aligning with Prostate Imaging Reporting and Data System (PI‐RADS) guidelines. 16 T2‐weighted imaging (T2WI) and diffusion‐weighted imaging (DWI) are critical sequences within mpMRI for evaluating PCa. T2WI is essential for visualising prostate anatomy, outlining tumours and identifying benign changes, serving as the gold standard for volumetric assessment of the transition zone (TZ) and guiding image‐based biopsies. 10 DWI assesses tumour characteristics by measuring cellular density, which restricts water diffusion. By providing quantitative data through high b‐value images and apparent diffusion coefficient (ADC) maps, DWI is particularly effective for evaluating tumour aggressiveness, especially in the peripheral zone (PZ). 10 Moreover, mpMRI has emerged as a crucial imaging tool for PCa assessment, serving as a triage test and guiding targeted biopsies. 17 Compared to systematic biopsy alone, mpMRI‐targeted biopsy shows greater accuracy in detecting csPCa. 18 However, mpMRI has limitations, including the risk of misinterpreting low‐signal intensity areas, mistakenly associating rim enhancement with restricted diffusion and malignancy and improperly applying PI‐RADS scoring, which can vary depending on the radiologist's experience. 19 , 20 , 21 , 22
Radiomics based on mpMRI provide quantitative features, including morphological, statistical and textural characteristics, which offer insights beyond human visual perception. These features are crucial for understanding tumour phenotypes and heterogeneity, thereby delivering valuable diagnostic and prognostic information. 23 , 24 Monti et al. 25 demonstrated that standard radiomics models using T2W and ADC images outperform more complex models incorporating diffusion kurtosis imaging and dynamic contrast‐enhanced (DCE) imaging in the detection of PCa. Moreover, machine learning (ML) and deep learning (DL) models that leverage T2WI and DWI or ADC enhance diagnostic capabilities and provide clinical advantages over DCE imaging, including reduced costs, shorter examination times and the elimination of potential adverse reactions associated with contrast agents. 10 Notably, Castillo et al. 26 indicated that radiomics models generally outperform DL models in diagnosing csPCa, achieving area under the curves (AUCs) of 0.88, 0.91 and 0.65 for radiomics models, compared to 0.70, 0.73 and 0.44 for DL models across various test cohorts. This finding underscores the robustness and interpretability of radiomics approaches.
Previous studies have primarily focused on detecting PCa and csPCa or distinguishing csPCa from ciPCa. 8 , 26 , 27 , 28 , 29 , 30 , 31 , 32 Our study adopts a two‐step method for the non‐invasive prediction of GG. First, we apply ML to analyse mpMRI scans (T2WI and ADC) for the detection of csPCa. Then, we integrate clinical parameters to refine the GG classification. This approach undergoes both internal and external validation to ensure its effectiveness.
Materials and Methods
Patients
This is a retrospective study, and the initial cohort comprised 399 consecutive patients who were enrolled at our hospital (Institution 1) between January 2020 and September 2023. Our study was approved by the Medical Ethics Committee of Xiaogan Central Hospital, which waived the requirement for informed consent. Approval No.: KY‐2023091601.
Patients were included in the study if they exhibited well‐defined prostate lesions on T2WI and ADC maps from the mpMRI examinations conducted prior to the prostate biopsy. These lesions had a PI‐RADS v2.1 score of 3 or higher. This criterion was intentionally chosen to focus on individuals with suspicious lesions identified on mpMRI, as these typically require further investigation through targeted biopsy. 33 , 34 Additionally, all clinical indicators were comprehensive and complete. The enrolled patients underwent transrectal ultrasound‐MR (TRUS‐MR) fusion‐guided prostate biopsy within 4 weeks after the mpMRI. Subsequently, for those diagnosed with PCa, radical prostatectomy was performed within 3 months following the MRI and biopsy. Patients were excluded if they had a previous prostate biopsy, previous PCa treatment (surgery, biopsy, radiation therapy or hormonal therapy), a diagnosed tumour other than PCa, imaging artefacts that made the segmentation of cancerous lesions on mpMRI impossible or incomplete clinical data, such as missing serum PSA levels.
Furthermore, an external independent validation group consisting of 100 patients was recruited from Institution 2 between October and December 2023, following the same inclusion criteria as the primary cohort.
Baseline clinical risk factors, including age, serum total PSA (tPSA) level, free PSA (fPSA) level, complete blood count, urine analysis, blood biochemistry and pathological results, were obtained from medical records. The patient selection flowchart is depicted in (Fig.1).
Figure 1.
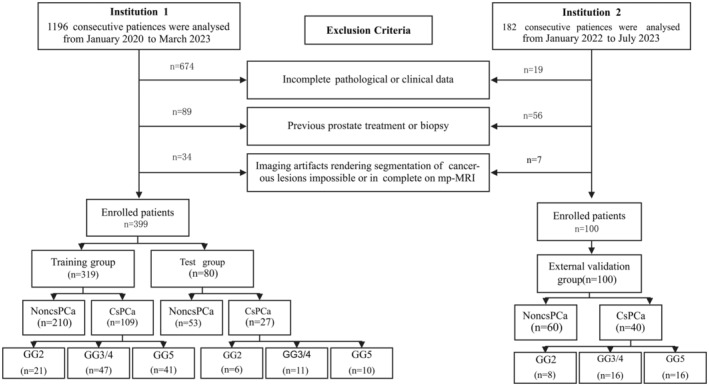
Flow diagram of patient selection for the study. Institution 1: Xiaogan Hospital Affiliated to Wuhan University of Science and Technology. Institution 2: Tongji Hospital, Tongji Medical College, Huazhong University of Science and Technology.
MRI protocol and image analysis
MR imaging was performed using two 3.0 Tesla MRI scanners (Institution 1: Siemens Verio, Siemens Healthineers, Erlangen, Germany; Institution 2: Siemens Skyra, Germany) with identical sequences and standard phased‐array surface coils. The MRI scanning protocol followed the PI‐RADS v2.0 guidelines, 19 including axial T1‐weighted imaging (T1WI), axial, coronal and sagittal T2WI, DWI and DCE imaging. For this analysis, only T2WI and ADC maps were used. The specific imaging parameters were: T2WI (TR = 3500 ms, TE = 101 ms) and DWI (TR = 4500 ms, TE = 93 ms, b‐values = 0, 800 s/mm2). The field of view was 26 × 22 cm, with a 3 mm slice thickness, 0 mm inter‐slice gap and 24 slices. Our ADC maps were automatically calculated using the syngo.via workstation (Siemens Verio, B17).
Two experienced radiologists (with 8 and 15 years of experience in prostate MRI interpretation) independently reviewed all MRI images and diagnosed and scored the lesions based on the PI‐RADS v2.1. In cases of disagreement, the two radiologists discussed and reached a consensus on the final lesion score. For multiple lesions, the largest lesion was recorded, and lesions with PI‐RADS scores of 3–5 and matching pathological findings were included.
Reference standard
All cases underwent mpMRI/TRUS fusion‐guided targeted biopsy and systematic biopsy, and patients diagnosed with PCa underwent radical prostatectomy with comprehensive histopathological evaluation. For the targeted biopsy, the radiologist fused the mpMRI data onto the real‐time 2D TRUS images to guide the biopsy procedure. An 18‐gauge side‐cutting needle was used to obtain 2–4 core biopsies for each target, incorporating the cognitive fusion of the mpMRI data. The obtained cores were then placed in separate pathology specimen containers based on the sampling site, for subsequent laboratory processing and interpretation. Regarding patients who underwent radical prostatectomy, the entire prostate specimens were sliced at 3‐mm intervals, extending from the apex to the base. Subsequently, two urological pathologists independently examined all the specimens. This process involved collaboration between the radiologists and pathologists as necessary to ensure the accuracy of the findings.
Image segmentation
Axial T2WI and ADC images were exported in Digital Imaging and Communications in Medicine format from the Picture Archiving and Communication System to a separate workstation for lesion segmentation. Histopathological‐radiological correlation was determined through a collaborative effort between experienced pathologists and radiologists, who reached a consensus based on their respective findings. The radiologists used the ITK‐SNAP software (version 4.0.1, Philadelphia, PA, USA) to manually delineate the prostate gland and lesion regions of interest (ROIs) on the T2W and ADC sequences. Anatomical landmarks were referenced, and a thorough, slice‐by‐slice delineation of the lesions was performed, with confirmation and correction conducted by a radiologist with 8 years of experience in prostate MRI diagnosis to ensure accuracy during the segmentation process. To further ensure the reliability of the image analysis, all results were thoroughly reviewed and validated by a pathologist and a radiologist, each possessing over 15 years of experience in their respective fields. The images of all patients were assessed and analysed using a research platform called the uAI Research Portal. 35
Grouping by pathology
In the first‐level model, lesions with csPCa were defined as those with a GS ≥ 7 (3 + 4) and were assigned a label of 1, 5 while lesions without significant PCa were defined as those with a GS ≤ 6 and were assigned a label of 0. The dataset was randomly partitioned into a training set comprising 80% of the data and a test set consisting of the remaining 20%. This division allowed for the evaluation of the radiomics model's diagnostic performance in identifying csPCa. The model was then further evaluated through external validation on an independent cohort.
In the second level model, for csPCa patients, the GG was further stratified: Grade 2 (7 = 3 + 4) was assigned a label of 0, Grade 3 (7 = 4 + 3) and Grade 4 (score 8) were assigned a label of 1, and Grade 5 (scores 9–10) was assigned a label of 2. Additionally, the dataset was randomly split into a training set, accounting for 80% of the data, and a test set, comprising the remaining 20%. This division aimed to evaluate the diagnostic performance of both the radiomics model and the hybrid model in Gleason grading. The models were then further evaluated through external validation on an independent cohort.
Radiomics analysis
The radiomics analysis workflow is shown in (Fig.2). We extracted radiomics features from both prostate gland and lesion regions on T2W and ADC images for combined modelling. Initially, all images underwent normalisation using the max‐min method. Next, 14 different image filters were applied to generate derived images. These filters included Box Mean, Additive Gaussian Noise, Binomial Blur Image, Curvature Flow, Box sigma Image and LoG with sigma values of 0.5, 1, 1.5 and 2. Additionally, filters such as Wavelet (with combinations of L and H), Normalise, Laplacian Sharpening, Discrete Gaussian, Mean, Speckle Noise, Recursive Gaussian and Shot Noise were used. From these derived images, first‐order statistics and texture features were extracted, resulting in 2160 derived features.
Figure 2.
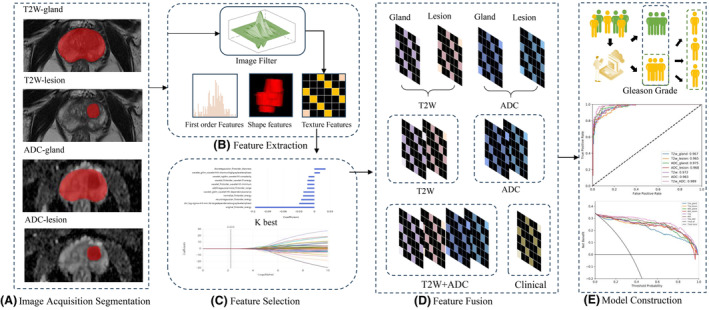
The Pipeline of radiomics analysis for Gleason Grading in Prostate Cancer Patients. (A) Image acquisition and segmentation. (B) Feature extraction. (C) Feature selection. (D) Feature fusion. (E) Model construction.
In total, 2264 radiomics features were computed for each prostate and PCa lesion region from both T2W and ADC images. These features were grouped into three categories: 14 shape features, 450 first‐order features quantifying voxel intensity distributions and 1800 texture features. The texture features included 525 from the grey level co‐occurrence matrix (GLCM), 350 from the grey level run length matrix (GLRLM), 400 from the grey level size zone matrix (GLSZM), 400 from the neighbouring grey tone difference matrix (NGTDM) and 125 from the grey level dependent matrix (GLDM). Detailed information on these radiomics features can be found in Table S1. Together, these features capture regional heterogeneity. To ensure comparability, all radiomics features were standardised using Z‐scores.
Subsequently, a three‐step feature selection process was conducted on the training cohort. Initially, low‐variance features (with a threshold of 0.8) were removed using the variance thresholding method. Next, the top 100 significant radiomics features were subsequently selected utilising the K‐best algorithm. Finally, the least absolute shrinkage and selection operator (LASSO) method was employed to identify the most robust predictive radiomics features. In both the first‐ and second‐stage models, we employed the above feature extraction and selection processes. All the selected features, along with clinical information, underwent quantile transformation as a data preprocessing method and a classification model was constructed using bagging decision trees.
Statistical analysis
Statistical analysis was conducted using R 4.1. To assess differences between multiple classes, ANOVA and the Kruskal–Wallis test were employed. Statistical significance was defined as a P‐value below 0.05. The diagnostic performance of the ML classification algorithm was evaluated using the AUC. Furthermore, 95% confidence intervals (CIs), accuracy, specificity and sensitivity were calculated.
Results
Clinical characteristics
The distribution and patient characteristics of training, testing and external validation groups are presented in Table 1. The proportion of csPCa was 34% and 40% at the two institutions, respectively. At Institution 1, patients were divided into a training group (80%, n = 319) and a testing group (20%, n = 80). An analysis of clinical characteristics between the csPCa and nsPCa groups revealed no statistically significant differences in any clinical parameters between the training and testing cohorts. In all three cohorts, significant differences in tPSA, fPSA and uric acid levels were observed between the csPCa and nsPCa groups (P < 0.05). Additionally, an analysis of clinical characteristics among different GGs showed no significant differences between the training and testing cohorts. Across the three cohorts, statistically significant differences in tPSA, fPSA, haemoglobin (Hb), haematocrit (HCT) and uric acid levels were found among the different GGs (P < 0.05). These clinical indicators were subsequently used to develop clinical models, which were combined with the radiomics model to construct a hybrid model.
Table 1.
Comparison of clinical characteristics between training and test cohorts in the classification of csPCa, nsPCa and Gleason grades (Mean ± SD).
| Patient cohort | Group | Characteristic | PSA (ng/mL) | fPSA (ng/mL) | Hb (g/L) | HCT | Uric acid (mol/L) | Age (years) | |
|---|---|---|---|---|---|---|---|---|---|
| Stage one |
Train set N = 319 |
nsPCa | N = 210 (66%) | 9 (6) | 1.1 (0.4) | 133 (17) | 40.4 (4.9) | 348 (82) | 69 (8) |
| csPCa | N = 109 (34%) | 27 (38) | 6.3 (8.2) | 133 (19) | 40.3 (5.2) | 379 (91) | 72 (7) | ||
| P‐value1 | <0.001* | <0.001* | 0.89 | 0.99 | 0.006* | 0.008* | |||
|
Test set N = 80 |
nsPCa | N = 53 (66%) | 9 (7) | 1.2 (0.9) | 136 (14) | 41.0 (4.4) | 349 (74) | 70 (10) | |
| csPCa | N = 27 (34%) | 29 (25) | 9.2 (9.7) | 123 (21) | 37.5 (6.3) | 378 (80) | 72 (8) | ||
| P‐value1 | <0.001* | <0.001* | 0.003* | 0.003* | 0.011* | 0.39 | |||
|
External validation set N = 100 |
nsPCa | N = 60 (60%) | 10 (7) | 1.3 (0.5) | 139 (14) | 40.2 (3.8) | 350 (87) | 65 (8) | |
| csPCa | N = 40 (40%) | 32 (19) | 8.3 (5.7) | 133 (18) | 39.4 (6.4) | 374 (98) | 68 (9) | ||
| P‐value1 | <0.001* | <0.001* | 0.55 | 0.39 | 0.006* | 0.78 | |||
|
Overall N = 499 |
P‐value2 | 0.27 | 0.25 | 0.19 | 0.23 | 0.96 | 0.36 | ||
| Stage two |
Train set N = 109 |
GG2 | N = 21 (19%) | 13 (32) | 1.3 (4) | 139 (19) | 42.4 (5.7) | 343 (75) | 70 (7) |
| GG3/4 | N = 47 (43%) | 28 (38) | 9 (8) | 128 (22) | 38.7 (6.7) | 371 (84) | 72 (7) | ||
| GG5 | N = 41 (38%) | 40 (41) | 10 (9) | 134 (15) | 40.7 (4.5) | 398 (78) | 71 (8) | ||
| P‐value1 | 0.026* | 0.014* | 0.013* | 0.031* | 0.026* | 0.69 | |||
|
Test set N = 27 |
GG2 | N = 6 (22%) | 9 (7) | 3 (0.9) | 133 (7) | 40.5 (1.8) | 342 (78) | 77 (5) | |
| GG3/4 | N = 11 (41%) | 30 (18) | 6 (12) | 118 (18) | 35.8 (4.7) | 407 (60) | 76 (7) | ||
| GG5 | N = 10 (37%) | 48 (34) | 18 (13) | 126 (21) | 38.6 (6.1) | 402 (91) | 67 (9) | ||
| P‐value1 | 0.037* | 0.041* | 0.027* | 0.043* | 0.045* | 0.570 | |||
|
External validation set N = 40 |
GG2 | N = 8 (20%) | 11 (20) | 2.7 (2) | 138 (17) | 41.2 (5.1) | 342 (56) | 65 (9) | |
| GG3/4 | N = 16 (40%) | 27 (16) | 7 (8) | 126 (22) | 36.3 (5.9) | 378 (74) | 71 (8) | ||
| GG5 | N = 16 (40%) | 47 (43) | 16 (9) | 130 (14) | 39.3 (4.8) | 396 (51) | 66 (8) | ||
| P‐value1 | 0.041* | 0.015* | 0.049* | 0.023* | 0.024* | 0.89 | |||
|
Overall N = 176 |
P‐value2 | 0.96 | 0.37 | 0.061 | 0.062 | 0.67 | 0.27 | ||
P‐value1 Wilcoxon rank sum test; P‐value2 Pearson's Chi‐squared test; csPCa, clinically significant prostate cancer; fPSA, free prostate‐specific antigen; GG2, Gleason Grade 2; GG3/4, Gleason Grade 3/4; GG5, Gleason Grade 5; Hb, Haemoglobin; HCT, Haematocrit; nsPCa, non‐significant prostate cancer; PSA, prostate‐specific antigen. The asterisk (*) indicates that the P‐value < 0.05, which signifies that the difference is statistically significant.
The first‐level model
In the classification of csPCa and nsPCa, LASSO analysis resulted in a final selection of nine features from the T2W gland images, 12 features from the lesion ROI on T2W images, 11 features from the ADC gland images and seven features from the lesion ROI on ADC images. The final selection resulted in 22 optimal radiomics features, including three first‐order features, six GLCM features, three GLDM features, seven GLRLM features, one GLSZM feature and two NGTDM features (Table S2 and Fig. S1).
Table 2 presents the predictive performance of radiomics models in classifying csPCa and nsPCa. Both single‐sequence radiomics models demonstrated significant effectiveness in predicting csPCa. Specifically, the ADC (gland + lesion) model achieved satisfactory performance, with AUCs of 0.983 (95% CI: 0.972–0.994), 0.977 (95% CI: 0.95–1) and 0.978 (95% CI: 0.952–0.994) for the training, test and external validation groups, respectively. The T2WI (gland + lesion) model exhibited AUCs of 0.972 (95% CI: 0.958–0.987), 0.929 (95% CI: 0.896–0.972) and 0.939 (95% CI: 0.87–0.989) for these three groups. Moreover, the combined radiomics model, which integrated both T2WI and ADC features, demonstrated even more significant effectiveness in predicting csPCa, achieving AUCs of 0.989, 0.982 and 0.976 for the training, test and external validation groups, respectively.
Table 2.
Predictive performance of multimodal feature fusion models in the classification of csPCa and nsPCa.
| Series | Feature number | Group | AUC (95% CI) | Sensitivity | Specificity | Accuracy | Precision |
|---|---|---|---|---|---|---|---|
| T2W_gland | 9 | Training | 0.967 (0.951–0.984) | 0.899 | 0.905 | 0.903 | 0.831 |
| Testing | 0.934 (0.869–0.998) | 0.852 | 0.874 | 0.8 | 0.657 | ||
| Extern testing | 0.936 (0.819–0.971) | 0.825 | 0.847 | 0.801 | 0.758 | ||
| T2W_lesion | 12 | Training | 0.965 (0.955–0.985) | 0.862 | 0.895 | 0.884 | 0.81 |
| Testing | 0.908 (0.794–0.98) | 0.815 | 0.849 | 0.838 | 0.733 | ||
| Extern testing | 0.958 (0.827–0.971) | 0.841 | 0.881 | 0.828 | 0.769 | ||
| ADC_gland | 11 | Training | 0.975 (0.961–0.99) | 0.936 | 0.914 | 0.922 | 0.85 |
| Testing | 0.943 (0.879–1) | 0.852 | 0.868 | 0.862 | 0.767 | ||
| Extern testing | 0.974 (0.876–0.987) | 0.851 | 0.869 | 0.858 | 0.766 | ||
| ADC_lesion | 7 | Training | 0.968 (0.962–0.988) | 0.89 | 0.924 | 0.912 | 0.858 |
| Testing | 0.971 (0.934–0.998) | 0.852 | 0.962 | 0.925 | 0.92 | ||
| Extern testing | 0.971 (0.942–0.991) | 0.90 | 0.912 | 0.910 | 0.825 | ||
| T2W (gland + lesion) | 9 | Training | 0.972 (0.958–0.987) | 0.908 | 0.905 | 0.906 | 0.832 |
| Testing | 0.929 (0.896–0.972) | 0.85 | 0.915 | 0.888 | 0.872 | ||
| Extern testing | 0.939 (0.87–0.989) | 0.815 | 0.887 | 0.862 | 0.786 | ||
| ADC (gland + lesion) | 13 | Training | 0.983 (0.972–0.994) | 0.908 | 0.938 | 0.928 | 0.884 |
| Testing | 0.977 (0.95–1) | 0.889 | 0.962 | 0.938 | 0.923 | ||
| Extern testing | 0.978 (0.952–0.994) | 0.925 | 0.881 | 0.90 | 0.841 | ||
| T2W_ADC (gland + lesion) | 22 | Training | 0.989 (0.982–0.997) | 0.927 | 0.957 | 0.947 | 0.918 |
| Testing | 0.982 (0.959–1) | 0.926 | 0.943 | 0.938 | 0.893 | ||
| Extern testing | 0.976 (0.953–0.994) | 0.950 | 0.898 | 0.920 | 0.864 |
ADC (gland + lesion), model utilising the ADC map to analyse both the gland and lesions; ADC_gland, prostate gland on the ADC map; ADC_lesion, prostate lesion on the ADC map; csPCa, clinically significant prostate cancer; nsPCa, non‐significant prostate cancer; T2W (gland + lesion), model using T2‐weighted imaging to analyse both the prostate gland and lesions; T2W_ADC (gland + lesion), combined model integrating T2‐weighted imaging and ADC mapping to analyse both the glands and lesions; Prostate gland refers to the entire prostate structure; T2W_gland, prostate gland on T2‐weighted imaging; T2W_lesion, prostate lesion on T2‐weighted imaging.
Figure 3A–C displays the ROC curves for the single‐sequence models and the combined radiomics model. The calibration curves, shown in Fig. 3D–F, illustrate that the combined radiomics model demonstrated the highest level of consistency between predicted values and observed values in the test group. Furthermore, the decision curves, depicted in Fig. 3G–I, indicate that the combined radiomics model exhibited superior clinical utility across the training, test and external validation groups.
Figure 3.
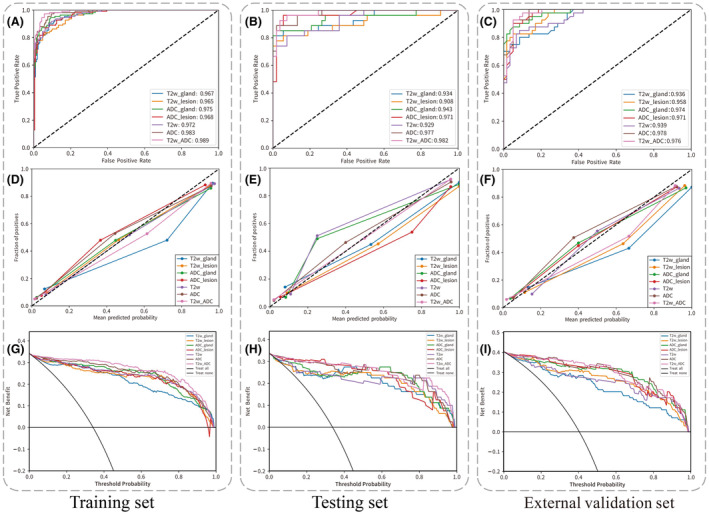
The ROC curve, calibration curve and decision curve of the multimodal feature fusion radiomics models for the classification of csPCa and nsPCa. Panels (A, D, G) represent the training set; panels (B, E, H) represent the testing set; and panels (C, F, I) represent the external validation set.
The second level model
In the classification of GG (2, 3/4, 5), LASSO analysis resulted in a final selection of eight features from the T2W gland images, four features from the lesion ROI on T2W images, five features from the ADC gland images and seven features from the lesion ROI on ADC images. The final selection resulted in 10 optimal radiomics features, including four first‐order features, two GLDM features, one GLRLM feature, two GLSZM features and one NGTDM feature (Table S3 and Fig. S2).
Table 3 presents the predictive performance of the clinical hybrid models in classifying GG (2, 3/4, 5). Among the single‐sequence radiomics models, both the ADC and T2WI models demonstrated comparable performance. The ADC model achieved AUCs of 0.793 (95% CI: 0.705–0.878), 0.806 (95% CI: 0.606–0.986) and 0.756 (95% CI: 0.680–0.902) for the training, test and external validation groups, respectively. The T2WI model exhibited AUCs of 0.793 (95% CI: 0.706–0.875), 0.744 (95% CI: 0.54–0.935) and 0.748 (95% CI: 0.670–0.914) for these three groups. The combined radiomics model demonstrated improved classification performance, achieving AUCs of 0.808 (95% CI: 0.725–0.887), 0.804 (95% CI: 0.610–0.975) and 0.792 (95% CI: 0.712–0.899) for the training, test and external validation groups, respectively. Incorporating clinical models into the hybrid model (T2W_ADC + clinical) further improved the predictive performance, with AUCs of 0.82 (95% CI: 0.734–0.9), 0.844 (95% CI: 0.664–1) and 0.83 (95% CI: 0.758–0.941) for the training, test and external validation groups, respectively. (Fig.4) shows the ROC curve, calibration curve and decision curve of the hybrid model.
Table 3.
Predictive performance of multimodal feature fusion models and clinical hybrid models in the classification of Gleason Grades (2, 3/4, 5).
| Series | Feature number | Group | AUC (95% CI) | Sensitivity | Specificity | Accuracy | Precision |
|---|---|---|---|---|---|---|---|
| T2W_gland | 8 | Training | 0.79 (0.697–0.881) | 0.611 | 0.797 | 0.615 | 0.608 |
| Testing | 0.659 (0.406–0896) | 0.501 | 0.764 | 0.556 | 0.545 | ||
| Extern testing | 0.71 (0.677–0.875) | 0.563 | 0.785 | 0.6 | 0.599 | ||
| T2W_lesion | 4 | Training | 0.719 (0.623–0.811) | 0.507 | 0.729 | 0.486 | 0.483 |
| Testing | 0.719 (0.492–0.933) | 0.56 | 0.792 | 0.593 | 0.561 | ||
| Extern testing | 0.720 (0.674–0.869) | 0.583 | 0.781 | 0.675 | 0.572 | ||
| ADC_gland | 5 | Training | 0.741 (0.64–0.837) | 0.461 | 0.745 | 0.55 | 0.704 |
| Testing | 0.757 (0.542–0.938) | 0.443 | 0.718 | 0.481 | 0.633 | ||
| Extern testing | 0.744 (0.624–0.895) | 0.417 | 0.708 | 0.475 | 0.638 | ||
| ADC_lesion | 7 | Training | 0.787 (0.694–0.875) | 0.574 | 0.789 | 0.615 | 0.617 |
| Testing | 0.78 (0.564–0.978) | 0.59 | 0.803 | 0.63 | 0.639 | ||
| Extern testing | 0.725 (0.658–0.897) | 0.583 | 0.792 | 0.625 | 0.730 | ||
| T2W (gland + lesion) | 8 | Training | 0.793 (0.706–0.875) | 0.437 | 0.734 | 0.541 | 0.411 |
| Testing | 0.744 (0.54–0.935) | 0.403 | 0.71 | 0.481 | 0.395 | ||
| Extern testing | 0.748 (0.670–0.914) | 0.40 | 0.708 | 0.475 | 0.362 | ||
| ADC (gland + lesion) | 7 | Training | 0.793 (0.705–0.878) | 0.535 | 0.775 | 0.596 | 0.611 |
| Testing | 0.806 (0.606–0.986) | 0.654 | 0.839 | 0.704 | 0.79 | ||
| Extern testing | 0.756 (0.680–0.902) | 0.542 | 0.778 | 0.60 | 0.72 | ||
| T2W_ADC (gland + lesion) | 10 | Training | 0.808 (0.725–0.887) | 0.632 | 0.803 | 0.633 | 0.634 |
| Testing | 0.804 (0.61–0.975) | 0.654 | 0.843 | 0.704 | 0.695 | ||
| Extern testing | 0.792 (0.712–0.899) | 0.646 | 0.812 | 0.650 | 0.663 | ||
| Clinical | 5 | Training | 0.673 (0.555–0.787) | 0.535 | 0.754 | 0.541 | 0.544 |
| Testing | 0.677 (0.455–0.889) | 0.398 | 0.699 | 0.444 | 0.449 | ||
| Extern testing | 0.651 (0.63–0.846) | 0.501 | 0.764 | 0.556 | 0.545 | ||
| T2W_ADC + clinical | 15 | Training | 0.82 (0.734–0.9) | 0.638 | 0.807 | 0.642 | 0.65 |
| Testing | 0.844 (0.664–1) | 0.642 | 0.822 | 0.667 | 0.684 | ||
| Extern testing | 0.83 (0.758–0.941) | 0.667 | 0.823 | 0.675 | 0.711 |
ADC (gland + lesion), model utilising the ADC map to analyse both the gland and lesions; ADC_gland, prostate gland on the ADC map; ADC_lesion, prostate lesion on the ADC map; csPCa, clinically significant prostate cancer; nsPCa, non‐significant prostate cancer; T2W (gland + lesion), model using T2‐weighted imaging to analyse both the prostate gland and lesions; T2W_ADC (gland + lesion), combined model integrating T2‐weighted imaging and ADC mapping to analyse both the glands and lesions; Prostate gland refers to the entire prostate structure; T2W_gland, prostate gland on T2‐weighted imaging; T2W_lesion, prostate lesion on T2‐weighted imaging.
Figure 4.

The ROC curve, calibration curve and decision curve of the multimodal feature fusion radiomics models (T2W_ADC + clinical) for the classification of Gleason grade (2, 3/4, 5). Panels (A, D, G) represent the training set; panels (B, E, H) represent the testing set; and panels (C, F, I) represent the external validation set.
Discussion
Our study proposes a two‐stage model aimed at accurately identifying csPCa. By integrating clinical features with radiomic characteristics extracted by Pyradiomics, 36 the model seeks to provide a non‐invasive approach for precise Gleason grading of csPCa.
In our first‐level model, the radiomics approach that combines T2WI with ADC maps exhibited notable diagnostic efficacy. We achieved AUCs of 0.982 and 0.976 in the internal and external validation sets, respectively. These results exceed those of a recent study that reported an accuracy of 84.4%, a sensitivity of 91.5% and an AUC of 80.4%. 30 Our superior performance is attributed to a larger and more diverse sample size, enhancing predictive accuracy. Additionally, the previous study mainly focused on lesions in the PZ, which may have introduced selection bias and limited its ability to identify csPCa.
Among the 22 optimal features of our first‐level model, the ADC_gland texture features (GLCM features) contribute the most. GLCM is an increasingly utilised radiomics feature and its clinical applicability has been confirmed by numerous studies. 30 , 31 , 37 , 38 , 39 Research indicates that the volumetric composition of each glandular component (stroma, epithelium and luminal space) has a greater impact on ADC than cell density. 40 Considering the diffuse and multifocal growth characteristics of PCa, 41 the glandular characteristics of the prostate can be interpreted as indicative of the presence of macroscopically invisible malignant features. In clinical practice, assessing these prostate gland texture features may be crucial for predicting the aggressiveness of suspicious lesions on mpMRI. Overall, the prostate gland structure provides additional context regarding the nature and progression of the tumour, potentially enhancing the robustness and accuracy of the grading process.
In the second phase of our study, we observed that both the T2W and ADC single‐sequence models each exhibited significant diagnostic efficacy. We identified seven key contributing features across different categories: ADC_lesion includes one texture feature and two first‐order features; ADC_gland comprises one first‐order feature; and for T2WI, one lesion texture feature and one first‐order feature, along with one gland texture feature, were noted. These results indicate that detailed analysis of texture and first‐order statistical features within T2WI and ADC is crucial for accurately classifying GGs of cancer. It is recommended that future research particularly focuses on analysing the texture and first‐order features of lesions in both T2WI and ADC, and where applicable, integrates gland‐wide features into the study. This approach will contribute to a more accurate assessment of the ISUP grading of csPCa.
Radiomics models have proven effective in distinguishing GGs in PCa across several studies. For instance, Ahmad Chaddad et al. developed a predictive model for assessing GS using T2W and ADC, employing GLCM analysis. The model achieved AUCs of 78.40% for GS ≤ 6, 82.35% for GS = 3 + 4 and 64.76% for GS ≥ 4 + 3. However, they did not explore other relevant tumour characteristics or include associated clinical features. 28 Another study utilised T2W and DWI with an SVM‐based model to predict GGs (GG 1–2 and GG 3–5), achieving an impressive AUC of 0.9248. The analysis highlighted that texture features, such as ‘DWI_wavelet HLL_glcm_SumAverage’, are crucial for the model's success and can be accurately and consistently extracted from the original images for precise classification of GGs. 31 Additionally, models analysing ADC map features demonstrated a strong AUC of 0.88 in distinguishing GG ≥ 3 from GG < 3, providing clinicians with valuable tools for characterising PCa lesions beyond visible boundaries. 8
While previous research mainly concentrated on detecting csPCa, our study advances this work by conducting a meticulous analysis of GGs, offering more detailed insights into their classification and behaviour. In the second level of our study, our hybrid model achieved AUCs of 0.841 for GG 2, 0.801 for GG 3/4 and 0.871 for GG 5 in internal validation and 0.926, 0.753 and 0.812, respectively, in external validation. These results demonstrate the model's promising potential for non‐invasively grading csPCa and can assist clinicians in making more informed decisions when developing personalised treatment plans.
Our hybrid model significantly outperforms models that rely solely on imaging data, underscoring the importance of integrating clinical features. While previous research primarily focused on PSA and its derivatives, 29 , 32 , 38 our study broadens the scope by incorporating additional laboratory results, including uric acid, Hb and HCT. These were selected for their statistical significance to enhance the robustness of our clinical model. The relationship between uric acid levels and PCa risk remains debated, with few recent studies addressing this issue. 42 , 43 A study suggests possible causal links between elevated genetically predicted uric acid levels and a heightened risk of PCa. 42 Conversely, another research indicates that uric acid levels are inversely related to PCa risk in older men, particularly those aged 60 and above. 43 Our findings revealed significant variations in uric acid levels across different grades of PCa, indicating a possible association between elevated uric acid and increased cancer risk, which warrants further investigation. Existing studies have frequently overlooked specific clinical parameters such as Hb and HCT. Our analysis demonstrated significant differences in Hb and HCT levels among the three groups of patients with csPCa, justifying their inclusion in the hybrid model. The clinical implications of these findings are promising but require further validation to confirm their utility in clinical practice.
Despite the promising results, our study has several limitations that should be considered. Firstly, the study's retrospective design may introduce inherent biases related to patient selection and data handling. Secondly, the sample size, especially across different Gleason categories, was relatively small and imbalanced, which may affect the model's training and generalisation capabilities. Finally, although we integrated a variety of clinical indicators, some relevant clinical or genetic markers were not included, which might further enhance the model's predictive accuracy if incorporated. Future research should prioritise prospective, multicenter studies with larger sample sizes to ensure the model's reliability and enhance its applicability across diverse patient populations. Exploring a wider range of meaningful clinical and genetic markers will further enhance the model's capabilities, improving its predictive accuracy and generalisation for real‐world clinical use.
Conclusions
Our study developed an innovative two‐stage model that incorporates new clinical indicators, showing the potential to enhance the accuracy of PCa diagnosis. This model emphasises the assessment of texture heterogeneity and signal intensity variations in T2WI and ADC maps for the accurate classification of GGs. This precise classification provides non‐invasive and effective pathological insights, which are crucial for crafting personalised treatment strategies.
Funding Information
This study was supported by the Xiaogan City Natural Science Program Project in 2024 (Project Number: XGKJ2024010035).
Conflict of Interest
The authors declare no conflict of interest.
Ethical Approval
Our study was approved by the Medical Ethics Committee of Xiaogan Central Hospital, which waived the requirement for informed consent. Approval No.: KY‐2023091601.
Consent for Publication
All authors have given their consent to the final manuscript and its submission to this journal.
Supporting information
Figure S1. The coefficient of features after feature selection (LASSO) in the classification of csPCa and nsPCa.
Figure S2. The coefficient of features after feature selection (LASSO) in the classification of Gleason grade (2, 3/4, 5).
Table S1. Radiomic features.
Table S2. In the classification of csPCa and nsPCa, the LASSO Path for Feature Selection Process.
Table S3. In the classification of Gleason grade (2, 3/4, 5), the LASSO Path for Feature Selection Process.
Acknowledgements
We extend our heartfelt gratitude to all who supported and contributed to this study.
Yuyan Zou is the first author and Xuechun Wang is the co‐first author.
Data Availability Statement
The datasets used and analysed during the current study are available from the corresponding author upon reasonable request.
References
- 1. Gandaglia G, Leni R, Bray F, et al. Epidemiology and prevention of prostate cancer. Eur Urol Oncol 2021; 4: 877–892. [DOI] [PubMed] [Google Scholar]
- 2. Park TY, Chae JY, Kim JW, et al. Prostate‐specific antigen mass and free prostate‐specific antigen mass for predicting the prostate volume of Korean men with biopsy‐proven benign prostatic hyperplasia. Korean J Urol 2013; 54: 609–614. [DOI] [PMC free article] [PubMed] [Google Scholar]
- 3. Ross HM, Kryvenko ON, Cowan JE, Simko JP, Wheeler TM, Epstein JI. Do adenocarcinomas of the prostate with Gleason score (GS) ≤6 have the potential to metastasize to lymph nodes? Am J Surg Pathol 2012; 36: 1346–1352. [DOI] [PMC free article] [PubMed] [Google Scholar]
- 4. Iczkowski KA, van Leenders G, van der Kwast TH. The 2019 International Society of Urological Pathology (ISUP) consensus conference on grading of prostatic carcinoma. Am J Surg Pathol 2021; 45: 1007. [DOI] [PubMed] [Google Scholar]
- 5. Cornford P, van den Bergh RCN, Briers E, et al. EAU‐EANM‐ESTRO‐ESUR‐SIOG guidelines on prostate cancer. Part II‐2020 update: treatment of relapsing and metastatic prostate cancer. Eur Urol 2021; 79: 263–282. [DOI] [PubMed] [Google Scholar]
- 6. Ahmed HU, El‐Shater Bosaily A, Brown LC, et al. Diagnostic accuracy of multi‐parametric MRI and TRUS biopsy in prostate cancer (PROMIS): a paired validating confirmatory study. Lancet 2017; 389: 815–822. [DOI] [PubMed] [Google Scholar]
- 7. Cuocolo R, Stanzione A, Ponsiglione A, et al. Clinically significant prostate cancer detection on MRI: a radiomic shape features study. Eur J Radiol 2019; 116: 144–149. [DOI] [PubMed] [Google Scholar]
- 8. Gaudiano C, Mottola M, Bianchi L, et al. Beyond multiparametric MRI and towards radiomics to detect prostate cancer: a machine learning model to predict clinically significant lesions. Cancers (Basel) 2022; 14: 6156. [DOI] [PMC free article] [PubMed] [Google Scholar]
- 9. Ghezzo S, Bezzi C, Presotto L, et al. State of the art of radiomic analysis in the clinical management of prostate cancer: a systematic review. Crit Rev Oncol Hematol 2022; 169: 103544. [DOI] [PubMed] [Google Scholar]
- 10. Michaely HJ, Aringhieri G, Cioni D, Neri E. Current value of biparametric prostate MRI with machine‐learning or deep‐learning in the detection, grading, and characterization of prostate cancer: a systematic review. Diagnostics (Basel) 2022; 12: 799. [DOI] [PMC free article] [PubMed] [Google Scholar]
- 11. Venderbos LD, Luiting H, Hogenhout R, Roobol MJ. Interaction of MRI and active surveillance in prostate cancer: Time to re‐evaluate the active surveillance inclusion criteria. Urol Oncol 2023; 41: 82–87. [DOI] [PubMed] [Google Scholar]
- 12. Epstein JI, Egevad L, Amin MB, et al. The 2014 International Society of Urological Pathology (ISUP) consensus conference on Gleason grading of prostatic carcinoma: definition of grading patterns and proposal for a new grading system. Am J Surg Pathol 2016; 40: 244–252. [DOI] [PubMed] [Google Scholar]
- 13. Baboudjian M, Breda A, Rajwa P, et al. Active surveillance for intermediate‐risk prostate cancer: a systematic review, meta‐analysis, and metaregression. Eur Urol Oncol 2022; 5: 617–627. [DOI] [PubMed] [Google Scholar]
- 14. Zhou Y, Lin C, Hu Z, et al. Differences in survival of prostate cancer Gleason 8–10 disease and the establishment of a new Gleason survival grading system. Cancer Med 2021; 10: 87–97. [DOI] [PMC free article] [PubMed] [Google Scholar]
- 15. Yang DD, Mahal BA, Muralidhar V, et al. Androgen deprivation therapy and overall survival for Gleason 8 versus Gleason 9–10 prostate cancer. Eur Urol 2019; 75: 35–41. [DOI] [PubMed] [Google Scholar]
- 16. Mottet N, van den Bergh RCN, Briers E, et al. EAU‐EANM‐ESTRO‐ESUR‐SIOG guidelines on prostate cancer‐2020 update. Part 1: screening, diagnosis, and local treatment with curative intent. Eur Urol 2021; 79: 243–262. [DOI] [PubMed] [Google Scholar]
- 17. Baccaglini W, Glina FPA, Pazeto CL, Bernardo WM, Sanchez‐Salas R. mpMRI‐targeted biopsy versus systematic biopsy for clinically significant prostate cancer diagnosis: a systematic review and metaanalysis. Curr Opin Urol 2020; 30: 711–719. [DOI] [PubMed] [Google Scholar]
- 18. Fang JH, Zhang L, Xie X, Zhao P, Bao L, Kong F. Comparative diagnostic accuracy of multiparametric magnetic resonance imaging‐ultrasound fusion‐guided biopsy versus systematic biopsy for clinically significant prostate cancer. PeerJ 2023; 11: e16614. [DOI] [PMC free article] [PubMed] [Google Scholar]
- 19. Franiel T, Röthke M. PI‐RADS 2.0 for prostate MRI. Radiologe 2017; 57: 665–678. [DOI] [PubMed] [Google Scholar]
- 20. Li D, Han X, Gao J, et al. Deep learning in prostate cancer diagnosis using multiparametric magnetic resonance imaging with whole‐mount histopathology referenced delineations. Front Med 2021; 8: 810995. [DOI] [PMC free article] [PubMed] [Google Scholar]
- 21. Panebianco V, Giganti F, Kitzing YX, et al. An update of pitfalls in prostate mpMRI: a practical approach through the lens of PI‐RADS v. 2 guidelines. Insights Imaging 2018; 9: 87–101. [DOI] [PMC free article] [PubMed] [Google Scholar]
- 22. Turkbey B, Rosenkrantz AB, Haider MA, et al. Prostate imaging reporting and data system version 2.1: 2019 update of prostate imaging reporting and data system version 2. Eur Urol 2019; 76: 340–351. [DOI] [PubMed] [Google Scholar]
- 23. Damascelli A, Gallivanone F, Cristel G, et al. Advanced imaging analysis in prostate MRI: building a radiomic signature to predict tumor aggressiveness. Diagnostics (Basel) 2021; 11: 594. [DOI] [PMC free article] [PubMed] [Google Scholar]
- 24. Gong L, Xu M, Fang M, et al. Noninvasive prediction of high‐grade prostate cancer via biparametric MRI radiomics. J Magn Reson Imaging 2020; 52: 1102–1109. [DOI] [PubMed] [Google Scholar]
- 25. Monti S, Brancato V, Di Costanzo G, et al. Multiparametric MRI for prostate cancer detection: new insights into the combined use of a radiomic approach with advanced acquisition protocol. Cancers (Basel) 2020; 12: 390. [DOI] [PMC free article] [PubMed] [Google Scholar]
- 26. Castillo TJ, Arif M, Starmans MPA, et al. Classification of clinically significant prostate cancer on multi‐parametric MRI: a validation study comparing deep learning and radiomics. Cancers (Basel) 2021; 14: 12. [DOI] [PMC free article] [PubMed] [Google Scholar]
- 27. Cai JC, Nakai H, Kuanar S, et al. Fully automated deep learning model to detect clinically significant prostate cancer at MRI. Radiology 2024; 312: e232635. [DOI] [PMC free article] [PubMed] [Google Scholar]
- 28. Chaddad A, Kucharczyk MJ, Niazi T. Multimodal radiomic features for the predicting Gleason score of prostate cancer. Cancers (Basel) 2018; 10: 249. [DOI] [PMC free article] [PubMed] [Google Scholar]
- 29. Hiremath A, Shiradkar R, Fu P, et al. An integrated nomogram combining deep learning, Prostate Imaging‐Reporting and Data System (PI‐RADS) scoring, and clinical variables for identification of clinically significant prostate cancer on biparametric MRI: a retrospective multicentre study. Lancet Digit Health 2021; 3: e445–e454. [DOI] [PMC free article] [PubMed] [Google Scholar]
- 30. Prata F, Anceschi U, Cordelli E, et al. Radiomic machine‐learning analysis of multiparametric magnetic resonance imaging in the diagnosis of clinically significant prostate cancer: new combination of textural and clinical features. Curr Oncol 2023; 30: 2021–2031. [DOI] [PMC free article] [PubMed] [Google Scholar]
- 31. Qiao X, Gu X, Liu Y, et al. MRI radiomics‐based machine learning models for Ki67 expression and Gleason grade group prediction in prostate cancer. Cancers (Basel) 2023; 15: 4536. [DOI] [PMC free article] [PubMed] [Google Scholar]
- 32. Woźnicki P, Westhoff N, Huber T, et al. Multiparametric MRI for prostate cancer characterization: combined use of radiomics model with PI‐RADS and clinical parameters. Cancers (Basel) 2020; 12: 1767. [DOI] [PMC free article] [PubMed] [Google Scholar]
- 33. Drost FH, Osses DF, Nieboer D, et al. Prostate MRI, with or without MRI‐targeted biopsy, and systematic biopsy for detecting prostate cancer. Cochrane Database Syst Rev 2019; 4: CD012663. [DOI] [PMC free article] [PubMed] [Google Scholar]
- 34. Barkovich EJ, Shankar PR, Westphalen AC. A systematic review of the existing prostate imaging reporting and data system version 2 (PI‐RADSv2) literature and subset meta‐analysis of PI‐RADSv2 categories stratified by Gleason scores. AJR Am J Roentgenol 2019; 212: 847–854. [DOI] [PubMed] [Google Scholar]
- 35. Wu J, Xia Y, Wang X, et al. uRP: an integrated research platform for one‐stop analysis of medical images. Front Radiol 2023; 3: 1153784. [DOI] [PMC free article] [PubMed] [Google Scholar]
- 36. van Griethuysen JJM, Fedorov A, Parmar C, et al. Computational radiomics system to decode the radiographic phenotype. Cancer Res 2017; 77: e104–e107. [DOI] [PMC free article] [PubMed] [Google Scholar]
- 37. Ogbonnaya CN, Zhang X, Alsaedi BSO, et al. Prediction of clinically significant cancer using radiomics features of pre‐biopsy of multiparametric MRI in men suspected of prostate cancer. Cancers (Basel) 2021; 13: 6199. [DOI] [PMC free article] [PubMed] [Google Scholar]
- 38. Hectors SJ, Chen C, Chen J, et al. Magnetic resonance imaging radiomics‐based machine learning prediction of clinically significant prostate cancer in equivocal PI‐RADS 3 lesions. J Magn Reson Imaging 2021; 54: 1466–1473. [DOI] [PubMed] [Google Scholar]
- 39. Giambelluca D, Cannella R, Vernuccio F, et al. PI‐RADS 3 lesions: role of prostate MRI texture analysis in the identification of prostate cancer. Curr Probl Diagn Radiol 2021; 50: 175–185. [DOI] [PubMed] [Google Scholar]
- 40. Chatterjee A, Watson G, Myint E, Sved P, McEntee M, Bourne R. Changes in epithelium, stroma, and lumen space correlate more strongly with Gleason pattern and are stronger predictors of prostate ADC changes than cellularity metrics. Radiology 2015; 277: 751–762. [DOI] [PubMed] [Google Scholar]
- 41. Løvf M, Zhao S, Axcrona U, et al. Multifocal primary prostate cancer exhibits high degree of genomic heterogeneity. Eur Urol 2019; 75: 498–505. [DOI] [PubMed] [Google Scholar]
- 42. Deng Y, Huang J, Wong MCS. Association between serum uric acid and prostate cancer risk in East Asian populations: a Mendelian randomization study. Eur J Nutr 2023; 62: 1323–1329. [DOI] [PubMed] [Google Scholar]
- 43. Yan W, Xiang P, Liu D, Zheng Y, Ping H. Association between the serum uric acid levels and prostate cancer: evidence from National Health and Nutrition Examination Survey (NHANES) 1999–2010. Transl Cancer Res 2024; 13: 2308–2314. [DOI] [PMC free article] [PubMed] [Google Scholar]
Associated Data
This section collects any data citations, data availability statements, or supplementary materials included in this article.
Supplementary Materials
Figure S1. The coefficient of features after feature selection (LASSO) in the classification of csPCa and nsPCa.
Figure S2. The coefficient of features after feature selection (LASSO) in the classification of Gleason grade (2, 3/4, 5).
Table S1. Radiomic features.
Table S2. In the classification of csPCa and nsPCa, the LASSO Path for Feature Selection Process.
Table S3. In the classification of Gleason grade (2, 3/4, 5), the LASSO Path for Feature Selection Process.
Data Availability Statement
The datasets used and analysed during the current study are available from the corresponding author upon reasonable request.