Abstract
Background
Deoxyribose nucleic acid (DNA) methylation is an important epigenetic modification that plays an important role in the occurrence and development of tumors. Identifying key methylation-driven genes that affect the prognosis of lung squamous cell carcinoma (LUSC) can provide direction for targeted therapy research.
Methods and results
Methylation and RNA-seq data were downloaded from The Cancer Genome Atlas (TCGA). The MethylMix package was used to integrate and analyze the methylation and gene expression data from TCGA, and the LUSC dataset (GSE37745) was downloaded from GEO for validation. Forty-five DNA-methylation-driven genes (MDGs) were obtained, and 3 genes (TRIM61, SMIM22, and ALDH7A1) were significantly associated with survival by using univariate and multivariate Cox regression. A risk model was constructed. KM analysis showed that patients with high-risk scores had poor survival. A nomination plot for prognosis prediction of LUSC patients was constructed, which showed a good predictive efficiency for tumor prognosis. The high expression of ALDH7A1 was an independent risk factor for poor prognosis in LUSC. The expression of ALDH7A1 in LUSC was negatively correlated with its methylation status (COR = −0.655). GSEA analysis showed that high expression of ALDH7A1 could activate multiple signaling pathways (JAK-STAT signaling pathway and mTOR signaling pathway). In vitro cell experiments confirmed that in LUSC, silencing ALDH7A1 could inhibit tumor progression, while overexpression of ALDH7A1 could promote tumor progression.
Conclusion
Our results indicated that ALDH7A1, a newly discovered MDG in LUSC, could act as an independent prognostic factor for OS in LUSC, with the potential to become a potential target for LUSC diagnosis and treatment. High expression of ALDH7A1 in LUSC could promote the occurrence and development of tumors. Signaling pathways, such as JAK-STAT and mTOR signaling pathways, might regulate the high expression of ALDH7A1.
Keywords: Lung squamous cell carcinoma, DNA methylation, survival analysis, methylation driver gene, ALDH7A
Introduction
Lung squamous cell carcinomas (LUSC) are a distinct histologic subtype of NSCLC, accounting for ∼25–30% of all NSCLC cases. The early symptoms of LUSC are not obvious, leading to its insidious nature, and patients are often older or have advanced disease at the time of diagnosis [1]. In recent years, the application of programmed death-1 (PD-1)/programmed death ligand 1 (PD-L1) inhibitors for the treatment of NSCLC patients has made great progress, with several benefits, especially for patients with early-stage disease [2,3]. Since most LUSC patients were diagnosed at an advanced stage, systemic treatment options are limited, and disease-related mortality is high. Even with the addition of PD-(L)1 inhibitors, the median OS for LUSC patients receiving first-line combination immunotherapy and chemotherapy is only 17.1 months [4]. Therefore, finding effective biomarkers for early identification is an important preventive measure to improve the prognosis of patients with LUSC.
DNA methylation (DNAme) is an important epigenetic event that can affect pre-transcriptional gene silencing, genetic imprinting, X chromosome inactivation, and genomic stability [5]. Changes in tumor DNAme, mainly including hypomethylation of proto-oncogenes and hypermethylation of oncogenes, are key molecular events in the development of many tumors, including lung cancer [6]. DNAme in tumors includes global hypomethylation affecting retroviral elements and genomic stability and local hypermethylation of the tumor suppressor gene promoter [7]. Aberrant DNAme in the promoter region is often considered a marker of tumorigenesis, which can lead to transcriptional silencing of tumor suppressor genes and aberrant activation of oncogenes in tumor cells [8]. With the development of methylation sequencing technology, epigenetic changes are easy to detect, and the sequencing depth and corresponding accuracy are high [9]. Studies have found that abnormal DNAme often occurs in early tumors [10], and this abnormal methylation is expected to be reversed through effective intervention of treatment [11], thereby reducing the risk of tumor occurrence, which makes preventative treatment of great importance. Methylation driver genes (MDGs) are hypo- and hypermethylated genes that predict transcription and are, therefore, functionally associated with specific diseases [9]. Tumorigenesis is influenced by multiple drivers, and the identification of driver genes mediated through DNAme during tumorigenesis and progression, distinguishing them from passenger genes with no apparent effect in carcinogenesis, will help to analyze those key drivers in tumor evolution [9] and the screening of optimal MDGs will contribute to the development of therapies targeting epigenetics. Much research has focused on the relationship between abnormal DNAme and the prognosis of lung cancer patients [12,13]. However, there is still a need for an individualized prognostic model of MDGs in LUSC, as there is no existing report on this topic.
In this study, by integrating LUSC methylation and RNA-seq data from the TCGA database, we identified differentially expressed genes (DEGs) with altered DNAme status associated with prognosis. To accurately determine a patient’s risk for a particular medical condition, a risk score model was established by univariate and multivariate COX regression combined with Kaplan-Meier (KM) analysis. Further, we established a nomogram to predict overall survival (OS) in LUSC patients by a comprehensive analysis of DNAme features and clinicopathological risk factors. Then, we validated in the Gene Expression Omnibus (GEO) cohort. Finally, we selected ALDH7A1 as a prognosis-related MDG gene and then applied molecular biology research by establishing in vitro cell models to investigate the regulatory role of ALDH7A1 in LUSC. Our study will provide a theoretical basis for individualized treatment of lung squamous carcinoma patients and contribute to the clinical translation of the findings.
Materials and methods
Data processing and identification of methylation-driven genes
The gene methylation and gene expression data for lung squamous cell carcinoma (LUSC) were extracted from The Cancer Genome Atlas (TCGA) database, accessible at https://www.cancer.gov/ccg/research/genome-sequencing/tcga. For methylation analysis, 504 LUSC samples and 69 matched non-tumor samples were analyzed using the Illumina Infinium Human Methylation 450 BeadChip. Methylation levels were quantified using β-values, which were calculated as the ratio of the intensity of methylated alleles to the total intensity of both methylated and unmethylated alleles, with values ranging from 0 (no methylation) to 1 (full methylation). For gene expression analysis, RNA sequencing (RNA-seq) data were gathered for 502 LUSC and 49 non-tumor samples. All collected data were standardized through normalization procedures using the R ‘limma’ package (version 3.6.1), ensuring consistent data quality and comparability across samples.
The gene expression and methylation data of tumor samples and methylation data of non-tumor samples were analyzed using the MethylMix algorithm to identify MDGs. MDGs must meet two requirements: (1) methylation differences between non-tumor and tumor samples and (2) negative correlation between gene expression and methylation status. Firstly, disease-specific low and high methylation genes were identified using the Wilcoxon rank-sum test based on the β-mixture model. Statistical analysis was performed using a significance level of p-value = 0.05. Secondly, linear regression models were used to study the correlation between gene methylation and expression levels. Genes with a correlation coefficient of < −0.3 were included.
Predictive risk model construction and risk score calculation
Merge the survival data of 45 MDGs with LUSC samples for univariate Cox analysis to screen for genes that have prognostic effects on LUSC; the cut-off value was p < 0.05. Next, the survival R package for multivariate Cox analysis was used to screen for independent prognostic genes. Finally, the remaining non-zero coefficient genes are included in the subsequent multivariate Cox analysis to establish a prognostic model. All samples were evaluated by the model. The prognostic risk index score is defined as follows in this formula:
β represents the expression level of genes in the model, while b represents their coefficients in the multivariate analysis.
Assessment of the model and component genes
Using the median value of prognostic risk as a threshold, patients were divided into two groups: high-risk group and low-risk group. The R package ‘survival’ was used to calculate and plot the KM survival curves for high-risk and low-risk groups to show overall survival (OS) rates. Time-dependent ROC curves were used to confirm the reliability of the prognostic model (survivalROC R package).
To test whether the risk score is an independent prognostic factor for LUSC, we combined the risk score with clinical data of patients in the TCGA database (including age, gender, and stage). Univariate and multivariate stratification analyses were performed using the R package ‘survival’ to ensure the reliability and feasibility of the prediction model. The R package ‘forestplot’ was used to draw a forest plot showing the hazard ratio (HR) and p-value for each factor. The joint survival analysis of gene expression and methylation status was used to evaluate the prognostic performance of each gene in the model, and genes significantly correlated with patient survival were identified as key genes. The correlation between methylation status and gene expression was assessed using a linear model, and sites with coefficients < −0.3 and p < 0.05 were considered to influence gene expression. KM curves were generated by R package ‘survival’ to assess the prognostic value of the methylation status of key genes. All analyses were judged to be statistically significant at p < 0.05. Gene expression data and corresponding clinical data from the GEO dataset GSE37745 were downloaded to test the reliability of the Cox model.
Gene Set Enrichment Analysis (GSEA) analysis
To verify the influence of key genes on pathways, we divided patients into high-expression and low-expression groups according to the median value of expression of key genes by using the GSEA software (version 4.2.3).
Patients and sample preparation
The tumor tissue and adjacent tissue were obtained from 30 LUSC patients who underwent surgery at Ningbo Medical Center Lihuili Hospital. The recruited participants had not received radiotherapy, chemotherapy, targeted therapy, or immunotherapy and were approved by the Ningbo Medical Center Lihuili Hospital review committee. Each patient signed an informed consent form before the study. The study was conducted in accordance with the principles of the ‘Declaration of Helsinki’.
Cell culture and lentiviral transfection
The human lung squamous carcinoma cell line NCI-H1703, the SK-MES-1 cell line, and the human normal lung epithelial cell line BEAS-2B were cultured in Roswell Park Memorial Institute (RPMI)-1640 medium (Gibco, USA). All cells were supplemented with 10% fetal bovine serum (FBS; Gibco, USA) and maintained at 37 °C and 5% CO2. SK-MES-1 cells were seeded into 12-well plates at a density of 4 × 10⁵ cells/mL. The overexpression DNA plasmids of ALDH7A1 (ALDH7A1_OE) and short hairpin RNA (sh-ALDH7A1) were provided from Vector Builder (Guangzhou, China), along with their respective controls. According to the manufacturer’s protocol, all transfections were performed using Lipofectamine 2000 (Invitrogen, CA, USA).
Cell viability assay
The proliferation ability of LUSC cells was evaluated using the CCK-8 assay (Beyotime, Shanghai, China). Cells in the logarithmic growth phase were digested with trypsin and resuspended in a complete medium (10% fetal bovine serum) and counted. Transfected LUSC cells (a control, a vector control, vector-ALDH7A1, sh-control, and ALDH7A1_shRNA groups) were seeded into a 96-well plate at a density of 1 × 10⁵ cells/well and incubated at 37 °C for 0, 24, 48, and 72 h. Further, 10 μl of CCK-8 solution was added to each well. Cell viability was measured by reading the optical density at 450 nm using a microplate reader (Eppendorf, Hamburg, Germany).
Cell clone formation
Cells in the logarithmic growth phase were digested with trypsin and resuspended in complete medium (base medium + 10% fetal bovine serum) and counted. 1 × 10³ cells/well were seeded in a 6-well plate for each experimental group. The cells were cultured for 14 days, and the medium was changed every 3 days to observe the cell status. After clone formation, cells were photographed under a microscope. Then, 1 mL of 4% paraformaldehyde was added to each well, fixed for 30 min, washed with PBS, and stained with crystal violet for 10 min. The cells were washed with PBS multiple times, dried, and photographed with a digital camera. Positive clones (each clone >50 cells) were counted, and the clone formation rate and clone size were calculated. Clone formation rate = (number of clones/number of seeded cells) × 100%.
Transwell assays
Transwell assays were used to measure cell migration and invasion using Transwell® cell culture plates (Corning, NY, USA). For invasion assays, the filter of the top chamber was pre-coated with Matrigel (BD, CA, USA). The top chamber is loaded with 1 × 10⁵ cells suspended in serum-free medium, and the bottom chamber is supplemented with complete medium and 10% FBS. After incubation at 37 °C and 5% CO2 for 24 h, cells on the upper surface are removed with a cotton swab, and cells that have migrated or invaded the lower surface are fixed with 4% paraformaldehyde and stained with crystal violet. Cells are then observed and counted under a microscope (Olympus, Tokyo, Japan). Matrigel pre-coating is not performed in cell migration assays.
mRNA expression analysis
The tumor and paracancerous tissues were collected, and RNA was extracted from each sample using a TRIZOL reagent (Life Technologies, USA). The total RNA was reverse transcribed into complementary DNA (cDNA) by the PrimeScript RT kit (Takara, Japan). Real-time fluorescence quantitative reverse transcription polymerase chain reaction (qRT-PCR) was performed by SYBR Premix Ex Taq (TaKaRa, RR420A) in the 7500 Real-Time PCR System (Applied Biosystems, USA). GAPDH was used as the internal reference. The PCR reaction conditions: pre-denaturation at 94 °C for 3 min, followed by 40 cycles (denaturation at 94 °C for 30 s, annealing at 53 °C for 30 s, extension at 72 °C for 45 s. The relative expression level of ALDH7A1 mRNA was analyzed using the method of 2−ΔΔCt. The primers were listed below:
GAPDH—Forward: 3′-GGAGCGAGATCCCTCCAAAAT
Reverse: GGCTGTTGTCATACTTCTCATGG-5′
ALDH7A1, Forward-3′-CCAGTATGCGTGGCTGAAAGA-5′
Reverse-3′-CAGGGCAATAGGTCGTAATAACC-5′
Western blot analysis
The total protein was extracted using RIPA protein buffer, separated by 12% SDS-PAGE, and transferred onto PVDF membranes (Roche, Basel, Switzerland). The membrane was blocked at room temperature for 1 h with blocking buffer (3% BSA in Tris-buffered saline (TBST) containing 0.1% Tween-20), followed by incubation with primary antibodies ALDH7A1 (1:1000, Abcam, Cambridge, UK) or GAPDH (1:2000, Abcam, Cambridge, UK) overnight at 4 °C. The membrane was washed 3 times with TBST and visualized using an enhanced chemiluminescence (ECL) detection kit (Thermo Fisher Scientific, Grand Island, NY, USA).
Immunohistochemistry
The Lung tissue was fixed with 4% paraformaldehyde; paraffin-embedded tissue sections (4 μm) were deparaffinized and dehydrated, followed by treatment with 3% hydrogen peroxide to block endogenous peroxidase. The sections were incubated with primary antibody (ALDH7A1; 1:200 dilution, Abcam, Cambridge, UK) overnight at 4 °C. The slides were washed with phosphate-buffered saline (PBS), incubated with biotinylated secondary antibody (1:500, Abcam, Cambridge, UK), and visualized using the avidin-biotin complex (ABC) kit (Vector Laboratories, Burlingame, CA, USA) and DAB detection kit (Enzo Life Sciences). The slides were counterstained with hematoxylin.
Methylated DNA immunoprecipitation (MeDIP)
Measure the DNA methylation level of the ALDH7A1 promoter region in LUSC using the MeDIP kit (BersinBio, Guangdong, China). For tissue detection, the tissue was cut into 0.3–0.5 cm3 pieces, homogenized with 0.5 mL Tris-ethylenediaminetetraacetic acid buffer, and centrifuged at 10,000 g for 5 min at room temperature. The cells were resuspended in DNA extraction buffer (1 × 10⁷ cells), lysed with 10% SDS and proteinase K, then DNA was extracted and sonicated to 300–700 bp. The samples were divided into two parts: 0.1 mL (input) and 0.8 mL (IP), and the input was stored at −20 °C. The DNA in the IP group was denatured at 95 °C for 3 min, quickly cooled on ice, and incubated overnight at 4 °C with 3–5 μg of 5-methylcytosine antibody or negative control IgG antibody. Protein A/G beads were added and eluted to collect protein-DNA complexes. Then, the purified DNA was collected. The enrichment of the ALDH7A1 promoter sequence was analyzed by qPCR.
Statistical analysis
Bioinformatics analyses were conducted using R software (version 3.6.1). Specifically, the gene expression and methylation data were analyzed using the MethylMix algorithm to identify methylation-driven genes (MDGs), employing Wilcoxon rank-sum tests based on a β-mixture model to discern disease-specific methylation profiles. The linear regression models were applied to assess the negative correlation between gene expression and methylation levels, with a correlation coefficient threshold of −0.3. All statistical tests were two-sided. For experimental analyses, SPSS software (version 25.0, SPSS Inc., USA) was utilized. The survival analyses, including univariate and multivariate Cox regression, were performed using the survival package in R, and results were visualized using the forest plot package to generate hazard ratios and p-values. GraphPad Prism (version 8.0, GraphPad Inc., USA) was used for generating plots, such as KM curves, considering p < 0.05 as statistically significant across all tests.
Results
Identification of LUSC methylation driver genes
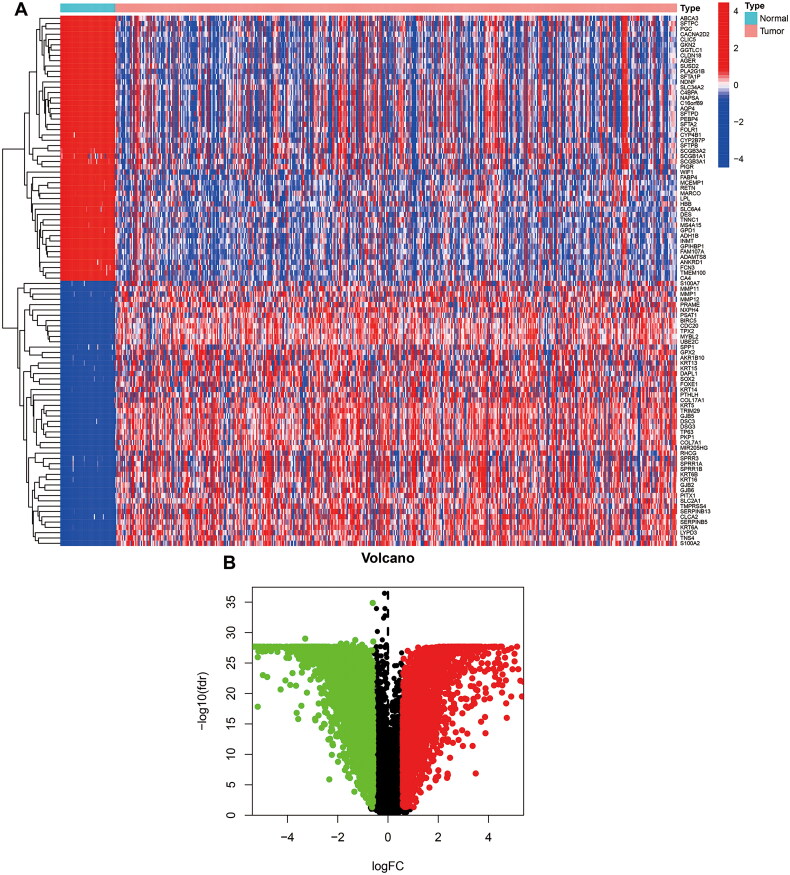
In our study, we used RNA-sequencing data from 551 cases of TCGA_LUSC. Among them, 49 cases were normal specimens, 502 were tumor specimens, and 573 were TCGA_LUSC DNA methylation data, including 69 normal samples and 504 tumor samples. Using FDR < 0.05 and log2FC > 0.585 as cutoff criteria, a total of 6767 DEGs (3382 up-regulated and 3385 down-regulated) were screened out for further analysis (Figures 1A,B).
Figure 1.
Screen DEGs between normal and LUSC in TCGA. (A) Heat map of DEGs in LUSC. The light blue and pink colors represent normal and tumor samples, respectively. (B) The volcano plot of DEGs. The red plots represent the upregulated genes, and the green plots represent the downregulated genes between tumor and normal tissues.
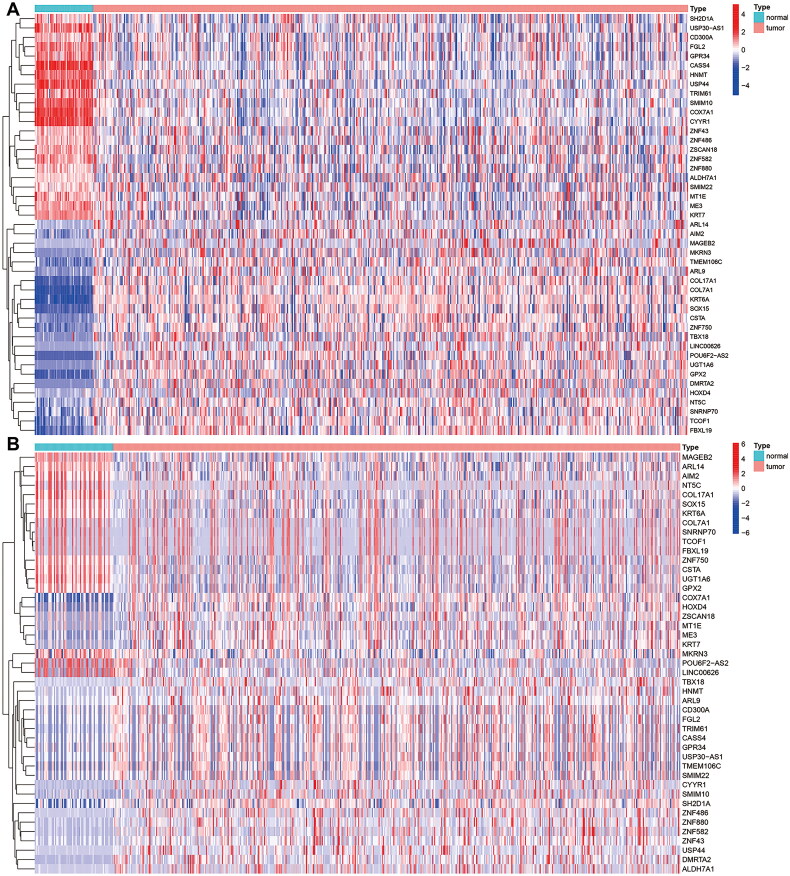
The expression data and DNA methylation data of 6767 DEGs were included for further analysis, and the screening criteria were log2FC > 0.263, p < 0.05, and COR < −0.3. We examined DNA methylation patterns in different patients, and as a result, we identified a total of 45 MDGs, of which 18 were hypomethylated, and 27 were hypermethylated (Supplementary Table S1). The expression of methylation-driven genes and the methylation status in different patients were compared, and the results were presented in heatmaps (Figures 2A,B).
Figure 2.
Heatmap of 45MDGs s in LUSC. (A) The expression pattern of 45 MDGs. Red represents upregulated genes, and blue represents downregulated genes between tumor and normal tissues. (B) The methylation pattern of 51 MDGs. Red represents highly methylated genes, and green represents low methylated genes between tumor and normal tissues.
Constructing and validating an MDG risk profile model
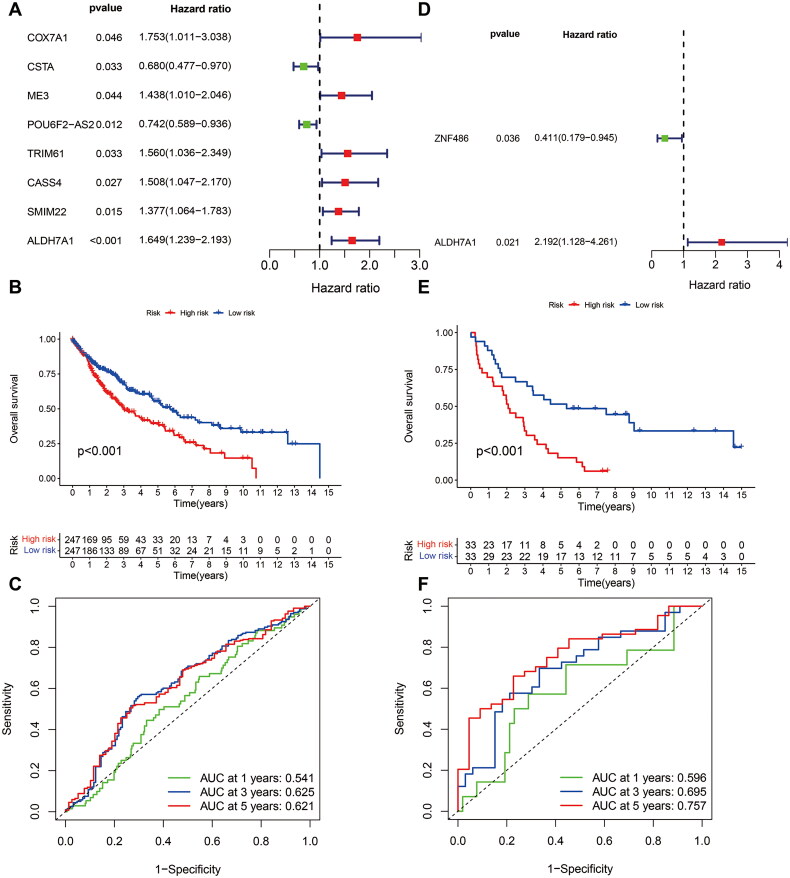
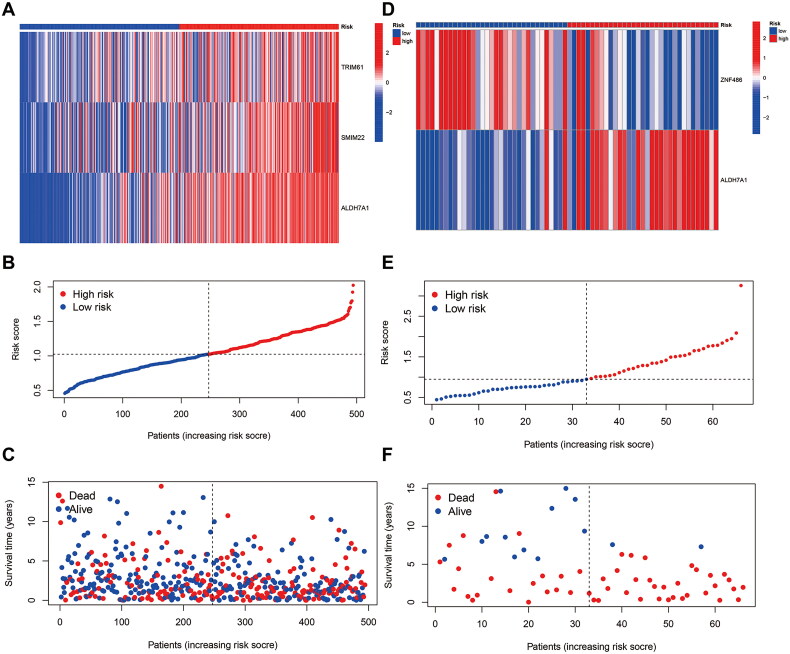
To determine the role of MDGs in the prognosis of LUSC, we performed a one-way Cox regression analysis on the TCGA cohort to identify prognosis-related MDGs, and the results showed that six MDGs (COX7A1, ME3, TRIM61, CASS4, SMIM22, and ALDH7A1) were high-risk genes with HR > 1. Two MDGs (CSTA and POU6F2-AS2) were low-risk genes with HR < 1 (Figure 3A, Supplementary Table S2). After conducting a multivariate COX regression analysis, three MDGs (TRIM61, SMIM22, and ALDH7A1) were identified and used to establish a prediction model. The p-value of ALDH7A1 was found to be <0.05 (Table 1), and the risk score of patients was calculated at the same time (Supplementary Table S3). According to the patients’ risk scores, patients were divided into high- and low-risk groups, and the survival time of different patients was combined. The survival curves were plotted by KM analysis to calculate the survival rate of high and low-risk groups (Figure 3B). The predictive efficiency of the model at 1, 3, and 5 years was validated by plotting Receiver Operating Characteristic (ROC) curves (Figure 3C). To ensure the accuracy of our model, GEO dataset GSE37745 validated the MDGs. The results were found to show that ALDH7A1 was also a risk factor for prognosis in the GSE dataset (Figure 3D, HR = 2.192, 95% CI [1.128, 4.261], p = 0.021). The multivariate COX regression analysis showed that the ALDH7A1 was an independent poor risk factor for prognosis (Table 1). Based on the risk score of patients, patients were divided into high and low-risk groups, and combined with the survival time of patients, survival curves were plotted by KM analysis (Figure 3E) and evaluate the predictive power of the model in 1, 3, and 5 years by using the AUC of the ROC curve (Figure 3F). Further scatter plots of patient risk revealed that ALDH7A1 was highly expressed in the high-risk group. The distribution of patients’ survival status at different times was significantly different (Figures 4A–F).
Figure 3.
Constructing and validating an MDG risk profile model. (A) Eight MDGs were significantly related to prognosis in patients with LUSC by univariate Cox regression analysis. (B) KM curves showed that high-risk patients had poorer survival in the TCGA cohort (p < 0.001). (C) The AUC of the ROC curve in the TCGA cohort. (D) Two MDGs were significantly related to prognosis in patients with LUSC by univariate Cox regression analysis. (E) KM curves showed that high-risk patients had poorer survival in the GEO cohort (p < 0.001). (F) The AUC value of the ROC curve in the GEO cohort. AUC: area under curve.
Table 1.
The multi-cox of the DNA-methylation-driven gene.
| ID | Gene | Co-efficiency | HR | HR.95L | HR.95H | p-Value |
|---|---|---|---|---|---|---|
| TCGA_LUSC | TRIM61 | 0.364 | 1.438 | 0.949 | 2.180 | 0.087 |
| SMIM22 | 0.258 | 1.294 | 0.996 | 1.681 | 0.053 | |
| ALDH7A1 | 0.433 | 1.542 | 1.148 | 2.072 | 0.004 | |
| GSE37745 | ZNF486 | −0.753 | 0.471 | 0.203 | 1.093 | 0.080 |
| GSE37745 | ALDH7A1 | 0.689 | 1.991 | 1.025 | 3.866 | 0.042 |
HR: hazard ratio; HR.95L: lower 95% confidence interval of hazard ratio; HR.95H: higher 95% confidence interval of hazard ratio.
Figure 4.
Heatmap and scatterplot of risk factors for patients. (A) TRIM61, SMIM22, ALDH7A1. (B,C) Risk score and survival status analysis of MDGs prognostic signature: the blue dots represent low-risk patients, and red dots represent high-risk patients; (D) ALDH7A1 was highly expressed in high-risk patients in the GEO cohort, and ZNF486 was highly expressed in low-risk patients in the GEO cohort; (E,F) risk score and survival status analysis of MDGs prognostic signature: the blue dots represent low-risk patients and red dots represent high-risk patients.
The risk score is an independent prognostic factor
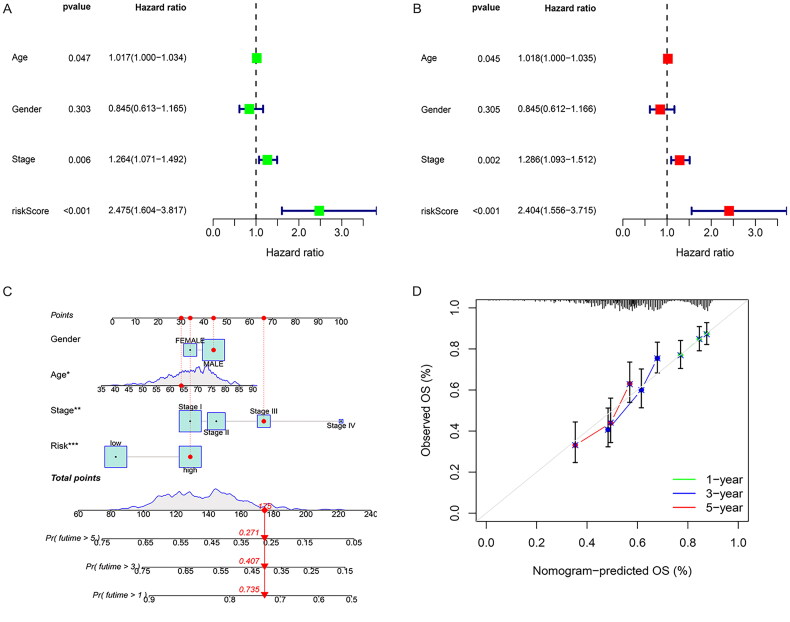
Univariate and multivariate Cox analyses were performed on the clinical data of patients to determine whether the risk score was an independent prognostic factor. The univariate Cox analysis showed that stage (p = 0.006, HR = 1.264, 95% CI [1.071, 1.492]) and risk score (p = 0.002, HR = 2.338, 95% CI [1.382, 3.955]) were closely related to OS (Figure 5A). The multivariate Cox regression analysis showed that stage (p = 0.002, HR = 1.301, 95% CI [1.102, 1.536]) and risk score (p < 0.001, HR = 2.507, 95% CI [1.479, 4.249]) were independent prognostic factors (Figure 5B). The results of our study demonstrate that combining the patient’s clinical information and risk characteristics, drawing a nomogram, predicting the 1-, 3-, and 5-year survival probabilities of different patients, and using the broken line graph to display and verify the efficiency of the prediction model, suggests that the prognosis model we established has a good effect on survival (Figures 5C,D).
Figure 5.
The risk score is an independent prognostic factor. (A) Forest plot of univariate survival analysis. (B) Forest plot of multivariate survival analysis. HR: hazard ratio; T: description of the primary tumor site; N: description of regional lymph node involvement; M: description of the presence or otherwise distance of metastatic spread. (C) Curve the nomogram of clinicopathological characteristics and RiskScore to predict the 1-, 3-, and 5-year OS of LUSC patients. (D) Calibration curve for the risk score model in the validation cohort. The dotted line represents the ideal predictive model, and the solid line represents the observed model.
The effect of ALDH7A1 expression and methylation status on prognosis and function in LUSC
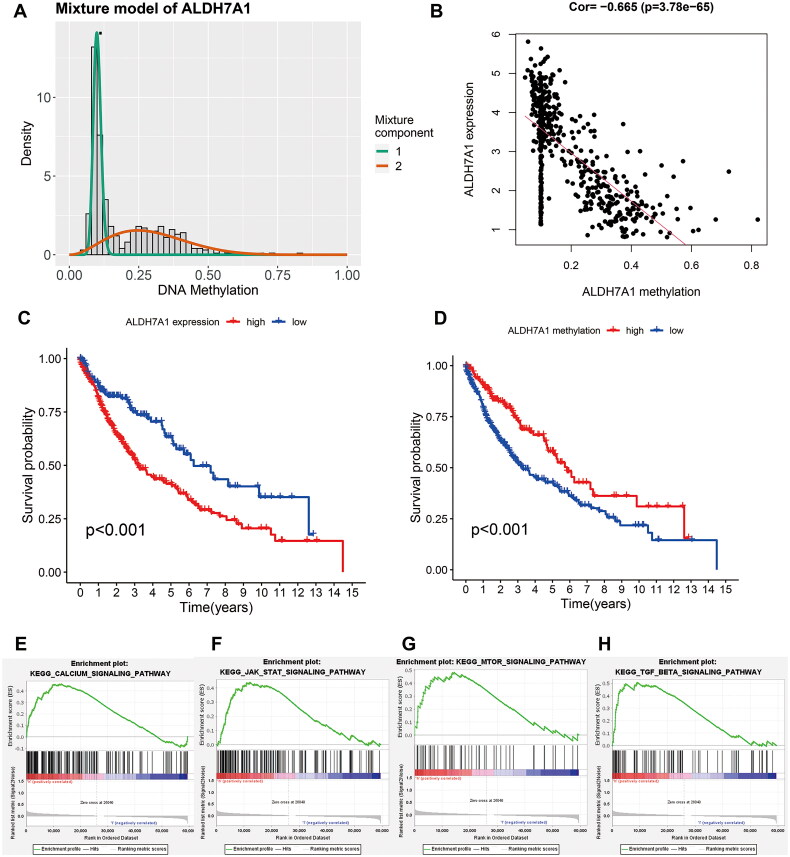
To explore the methylation status and expression of ALDH7A1 and their impact on prognosis, we first detected the methylation status of ALDH7A1. We found a robust negative correlation between its methylation status and expression (Figures 6A,B). Based on the median of ALDH7A1, we divided patients into low and high-expression groups, and according to the methylation status of ALDH7A1, we further divided them into high and low-methylation groups. We then used KM analysis to compare the survival differences among different groups. The results showed that LUSC patients with high ALDH7A1 expression had a poor prognosis, as did patients with low methylation status of ALDH7A1 (Figures 6C,D). Furthermore, Gene Set Enrichment Analysis (GSEA) revealed significant associations of high ALDH7A1 expression with several key signaling pathways. Specifically, the Calcium Signaling Pathway was enriched (NES = 1.796, p = 0.008), indicating a strong upregulation in patients with high ALDH7A1 expression. In addition, the JAK-STAT signaling pathway showed notable enrichment (NES = 1.669, p = 0.021), along with the mTOR signaling pathway (NES = 1.593, p = 0.051) and the TGF Beta Signaling Pathway (NES = 1.709, p = 0.017) (Figures 6E–H). Together, these findings underscored potential mechanisms by which ALDH7A1 could influence LUSC progression and patient outcomes.
Figure 6.
Effect of ALDH7A1 expression and methylation status on prognosis and function in LUSC. (A) Distribution map of the methylation degree of ALDH7A1. The X-axis represents the degree of methylation, and the Y-axis represents the number of methylated samples. The black horizontal line represents the methylation status distribution in the normal samples. (B) Correlation between the expression and methylation degree of ALDH7A1. The X-axis represents the methylation degree, and the Y-axis represents the gene expression level. (C,D) The survival analysis of the two subgroups stratified based on the median of ALDH7A1 expression and methylation status. (E–H) Terms enriched in ALDH7A1 high/low subgroups based on KEGG of GSEA.
Validate the expression of ALDH7A1 in LUSC cell lines and clinical specimens
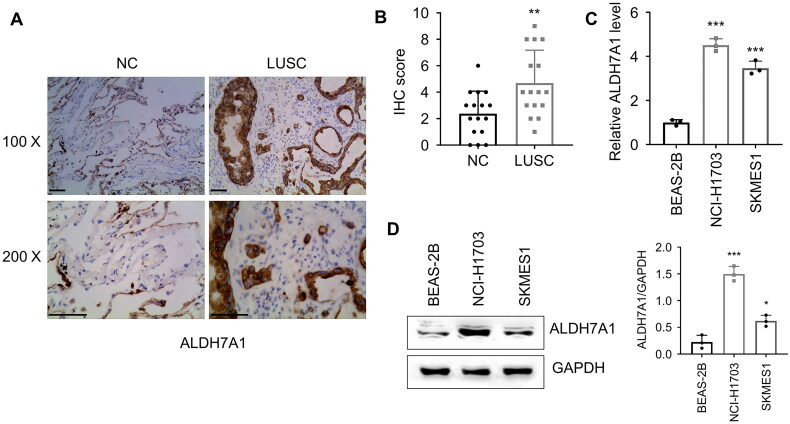
Based on the results of bioinformatics analysis, ALDH7A1 was a poor prognostic factor with high expression in LUSC samples, and patients with low methylation status of ALDH7A1 had poor prognosis. We collected LUSC specimens and analyzed the expression of ALDH7A1 by immunohistochemistry, and the results showed that the expression of ALDH7A1 was significantly higher in tumor tissue than in adjacent tissue (Figures 7A,B). Subsequently, we analyzed the expression levels of NCI-H1703 and SK-MES-1 LUSC cell lines by qRT-PCR and Western blot (Figures 7C,D). The results showed that the expression of ALDH7A1 in NCI-H1703 and SK-MES-1 lung squamous cell carcinoma cell lines was significantly higher than that in BEAS-2B.
Figure 7.
Validation of ALDH7A1 expression in lung squamous cell carcinoma cell lines and clinical specimens. (A,B) Detection of the expression of ALDH7A1 in matched tumor tissue and Para-cancerous tissues of LUSC via immunohistochemistry (IHC), student’s t-test, ***p < 0.001. (C,D) Detection of the expression of ALDH7A1 in NCI-H1703, SKMES1, and BEAS-2B. *p < 0.05, **p < 0.01, ***p < 0.001 using a two-sided student’s t-test.
The effect of the silence/overexpression of ALDH7A1 in LUSC on tumor cell malignancy
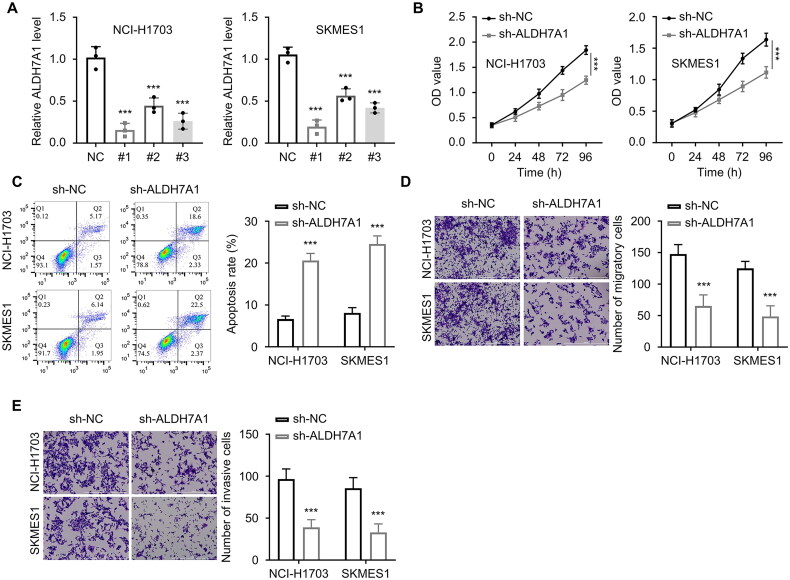
ALDH7A1 shRNAs (n = 3) were transfected into lung squamous cell carcinoma tumor cells NCI-H1703 and SKMES1. The mRNA and protein expression levels of ALDH7A1 were detected by the qRT-PCR and Western blot analyses to verify the interference efficiency. The results showed that the first shRNA had the best interference effect. The expression level of ALDH7A1 was significantly reduced after transfection (Figure 8A). Subsequently, we used the CCK-8 method to detect the absorbance values at 450 nm wavelength of different groups of cells (NC, ALDH7A1shRNA) in NCI-H1703 and SKMES1 at 0, 24, 48, 72, and 96 h. The results showed that si-ALDH7A1 significantly reduced the absorbance values of lung squamous cell carcinoma cells at 450 nm wavelength (p < 0.001, Figure 8B), and the difference was statistically significant. The apoptosis experiment detected the effect of si-ALDH7A1 on tumor cell apoptosis, and the results showed that si-ALDH7A1 promoted the apoptosis of lung squamous cell carcinoma cells (p < 0.001, Figure 8C). The Transwell experiment was used to detect the cell migration ability of NCI-H1703 and SKMES1 cells after transfection with si-ALDH7A1. The results showed that si-ALDH7A1 reduced the migration and invasion ability of cells (p < 0.001, Figures 8D,E).
Figure 8.
Effect of ALDH7A1 expression on malignant behavior of lung squamous cell carcinoma cells with silence. (A) The mRNA and protein expression levels of ALDH7A1 were detected by qRT-PCR to verify the interference efficiency. (B) The CCK-8 method was used to detect the absorbance at 450 nm wavelength of cells in different groups (NC, ALDH7A1shRNA) in NCI-H1703 and SKMES1 at 0, 24, 48, 72, and 96 h. (C) Cell apoptosis assay was used to detect the effect of si-ALDH7A1 on tumor cell apoptosis. (D) Transwell assay (without extracellular matrix gel EMC) was used to detect the cell migration ability of cells transfected with si-ALDH7A1 in NCI-H1703 and SKMES1. (E) Transwell assay (with extracellular matrix gel EMC) was used to detect the cell invasion ability of cells transfected with si-ALDH7A1 in NCI-H1703 and SKMES1. ***p < 0.001 using a two-sided student’s t-test.
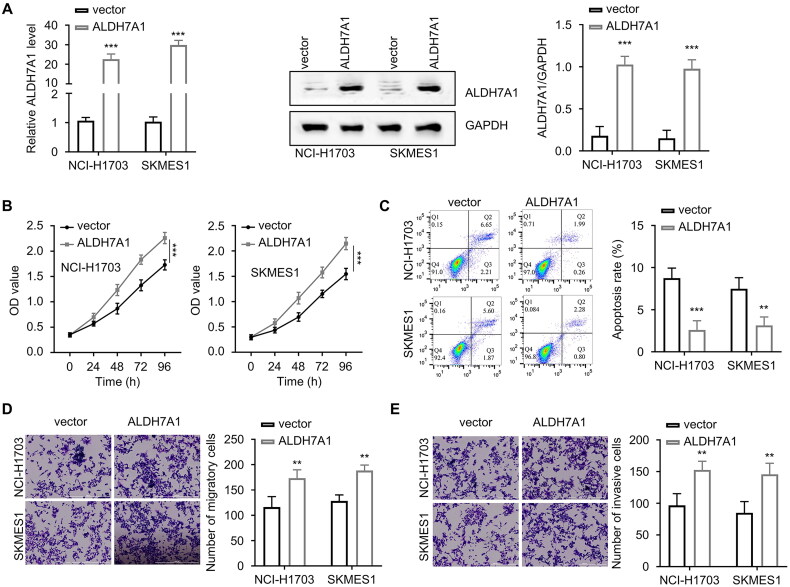
The company synthesized the overexpression plasmid of ALDH7A1 and then transfected it into LUSC cells NCI-H1703 and SKMES1. We found that the expression level of ALDH7A1 was significantly high after transfection (Figure 9A). The overexpression of ALDH7A1 significantly increased the absorbance value of lung squamous cell carcinoma cells at 450 nm wavelength (p < 0.001, Figure 9B), inhibited the apoptosis of LUSC cells (p < 0.001, Figure 9C), and increased the migration and invasion ability of cells (p < 0.001, Figures 9D,E).
Figure 9.
Effect of ALDH7A1 overexpression on malignant behavior of lung squamous cell carcinoma cells. (A) The mRNA and protein expression levels of ALDH7A1 were detected by qRT-PCR to verify the overexpression efficiency. (B) The CCK-8 method was used to detect the absorbance at 450 nm wavelength of cells in different groups (NC, ALDH7A1_OE) in NCI-H1703 and SKMES1 at 0, 24, 48, 72, and 96 h. (C) Cell apoptosis assay was used to detect the effect of ALDH7A1 overexpression on tumor cell apoptosis. (D) Transwell assay (without extracellular matrix gel EMC) was used to detect the cell migration ability of cells transfected with ALDH7A1_OE in NCI-H1703 and SKMES1. (E) Transwell assay (with extracellular matrix gel EMC) was used to detect the cell invasion ability of cells transfected with ALDH7A1_OE in NCI-H1703 and SKMES1. **p < 0.01, ***p < 0.001 using a two-sided student’s t-test.
Validation of ALDH7A1 as a methylation driver gene in LUSC
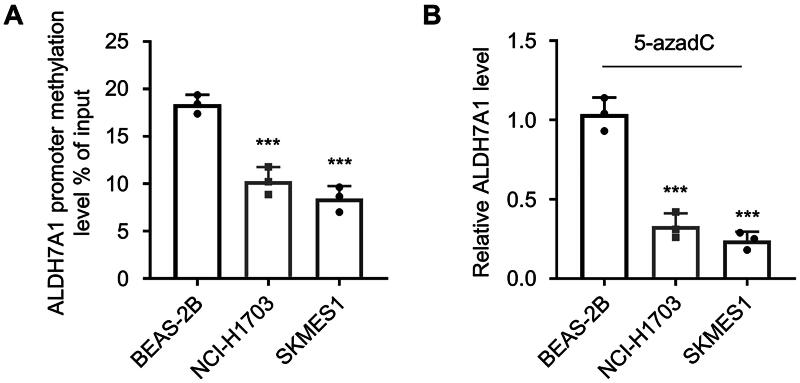
To verify that ALDH7A1 is a methylation-driven gene in LUSC, in this study, we examined the DNA methylation status of the ALDH7A1 promoter region in LUSC cell lines NCI-H1703 and SK-MES-1 and human normal lung epithelial cells BEAS-2B by MeDIP. The results showed that the DNA methylation level of ALDH7A1 was decreased in LUSC cells. At the same time, the mRNA expression of ALDH7A1 was increased (Figure 10A). To confirm the role of methylated ALDH7A1 gene expression, LUSC cell lines NCI-H1703 and SK-MES-1 were treated with methyltransferase inhibitor, 5-aza (1 μmol/L), and the expression of ALDH7A1 in different cells was detected by PCR. The results showed that the expression of ALDH7A1 was significantly decreased affected by the methyltransferase inhibitor (Figure 10B), further proving ALDH7A1 as MDG.
Figure 10.
Validation of ALDH7A1 as a methylation-driven gene in LUSC. (A) MeDIP was used to examine the DNA methylation levels of the ALDH7A1 promoter region in LUSC cell lines NCI-H1703 and SK-MES-1, as well as in normal human lung epithelial cells BEAS-2B. (B) The expression of ALDH7A1 was examined through PCR in squamous cell carcinoma cell lines NCI-H1703 and SK-MES-1 after treatment with methylation inhibitor 5-aza (1 μmol/L). ***p < 0.001 using a two-sided student’s t-test.
Discussion
In tumor cells, changes in the genome and epigenome are related to the occurrence and development of certain tumor characteristics [14]. The occurrence of tumors is related to abnormal methylation status, which can alter the expression levels of oncogenes and tumor suppressor genes [15]. Aberrant gene methylation is one of the most common epigenetic changes in tumor occurrence [16]. Recent studies have further emphasized the significance of epigenetic modifications in NSCLC. For example, Han et al. reported aberrant DNA methylation in the SMAD3 promoter region in tumor-associated fibroblasts, which affects the molecular mechanisms of radiosensitivity in NSCLC, underscoring the complex interactions within the tumor microenvironment [17]. Additionally, Liu et al. highlighted the role of arginine methylation-dependent cGAS stability in promoting NSCLC cell proliferation, suggesting novel epigenetic targets for therapeutic intervention [18]. Yu et al. identified a novel regQTL-SNP associated with lung cancer risk, providing insights into genetic susceptibility and potential diagnostic biomarkers for NSCLC [19]. These studies collectively highlight the critical role of genetic and epigenetic factors in the pathology of NSCLC and reinforce the need for a multi-dimensional approach to understanding and treating this complex disease.
Some of these MDGs may promote tumor malignant transformation by overexpression of oncogenes or knockout of tumor suppressor genes, thereby rebalancing the tumor microenvironment [20–22]. Therefore, identifying specific methylation-driven genes and conducting specific tests on these genes can help improve early diagnosis of tumors, especially for those with early symptoms that are difficult to identify, and has important implications for improving and changing tumor prognosis. In our study, we identified aberrantly methylated genes by comparing normal and LUSC samples using the MethylMix R package. We screened 45 MDGs. Using univariate and multivariate Cox regression, we identified three genes (TRIM61, SMIM22, and ALDH7A1) that were significantly associated with survival. We constructed a risk model using the risk score obtained from the multivariate Cox regression analysis. KM analysis using the risk score showed that patients with high-risk scores had poor survival, with AUC > 0.621 for predicting 5-year overall survival (OS). Validation using GEO data showed an AUC > 0.757 for a 5-year OS. By combining the risk score with different clinical factors, a nomination plot for prognosis prediction of LUSC patients was constructed, showing a good predictive efficiency for tumor prognosis. We found that high expression of ALDH7A1 was an independent risk factor for poor prognosis in LUSC. Further analysis showed that the expression of ALDH7A1 in LUSC was negatively correlated with its methylation status (COR = −0.655), and both high expression and low methylation of ALDH7A1 were associated with poor prognosis in LUSC. We also confirmed that the expression of ALDH7A1 is regulated by methylation through MeDIP analysis. GSEA analysis showed that high expression of ALDH7A1 could activate multiple signaling pathways related to tumorigenesis and tumor progression (JAK-STAT and mTOR signaling pathways). We speculate that ALDH7A1 may be a key biomarker for predicting the prognosis of LUSC. Our study provides a new idea for the prognosis management of LUSC patients.
The ALDH superfamily is a family of genes encoded by the ALDH gene, which plays an important role in the metabolism of physiological and pathological aldehydes [23]. As many as 19 ALDH genes have been found in the human genome, and studies have found that ALDH mutations are associated with the occurrence of various diseases, including cancer and neurological disorders [24,25]. It was found that ALDH activity is involved in drug resistance, cell proliferation, differentiation, and regulation of oxidative stress in tumor cells [26,27]. ALDH 7 family member A1 (ALDH7A1), a member of the ALDH superfamily, is the enzyme encoded by ALDH7A1 [28]. Previous research found that ALDH was found to have an important function in the homeostatic development of epithelial cells and to be involved in the epithelial cell transformation of tumor cells [29].
In the discovery of human nodular melanoma, the recurrence rate of the high-expressing ALDH7A1 melanoma subtype is higher than that of superficial spreading melanoma [30]. In prostate cancer, ALDH7A1 was found to be involved in tumor initiation, and high expression of ALDH7A1 can enhance the metastatic ability [31]. Knocking out ALDH7A1 can reduce bone growth and inhibit experimentally induced bone metastasis [31]. However, in hepatocellular carcinoma and renal clear cell carcinoma, low ALDH7A1 expression is a useful prognostic marker for poor clinical outcomes [32]. Therefore, there is some controversy about the role of ALDH7A1 in tumor cells. In a study on the main carcinogen in cigarettes, 4-(methylnitrosamino)-1-(3-pyridyl)-1-butanone, it was found that ALDH7A1 expression was significantly increased in human papillomavirus immortalized human cervical cells treated with 4-(methylnitrosamino)-1-(3-pyridyl)-1-butanone [33]. Epidemiological studies have found that the occurrence of LUSC is related to patients with a long history of smoking [34,35]. It was found that smoking can increase the activity of the ALDH superfamilies, in the preinvasive lesions that lead to infiltrative squamous cell carcinoma [36]. We speculate that high expression of ALDH7A1 may increase the malignant behavior of tumor cells in LUSC. Previous studies have found that high expression of ALDH7A1 in non-small cell lung cancer can increase the risk of tumor recurrence, and the positive staining of ALDH7A1 in tumor samples is extensive [37]. Our study found through clinical sample collection that the expression of ALDH7A1 in tumor tissue is significantly higher than that in adjacent tissue. In our study, we established models of ALDH7A1 knockdown and overexpression and detected their effects on the proliferation, tumorigenesis, migration, and invasion of LUSC tumor cells. Our study found that the biological behavior of tumor cells in ALDH7A1 knockdown LUSC cells was significantly inhibited, while the overexpression of ALDH7A1 significantly increased the biological behavior of tumor cells. The ALDH superfamily is closely related to biological oxidation. It is an important aldehyde oxidase in mitochondria, which can oxidize various harmful aromatic aldehydes and fatty aldehydes, preventing lipid peroxidation on cell membranes and serving as an important protective factor in the body [38]. Oxidative stress can induce the production of reactive oxygen intermediates, leading to lipid peroxidation, thereby increasing the level of aldehydes. Aldehydes can directly produce toxicity by forming adducts that damage DNA and inactivate enzymes [39]. In our study, we found that high expression of ALDH7A1 may be related to the activation of multiple signaling pathways. Previous studies have found that the JAK-STAT signaling pathway and the MTOR signaling pathway are both involved in the regulation of tumor progression [40,41]. We speculate that the high expression of ALDH7A1 may increase tumor progression through the regulation of signaling pathways, such as the JAK-STAT signaling pathway and the mTOR signaling pathway.
Conclusion
In summary, our results indicated that ALDH7A1, a newly discovered MDG in LUSC, could act as an independent prognostic factor for OS in LUSC patients, with the potential to become a potential target for LUSC diagnosis and treatment. High expression of ALDH7A1 in LUSC could promote the occurrence and development of tumors. The high expression of ALDH7A1 might be regulated by signaling pathways, such as JAK-STAT and mTOR signaling pathways.
Supplementary Material
Acknowledgements
None.
Funding Statement
This work was supported by Zhejiang Medical and Health Science and Technology Project (approval number: 2020KY867), NINGBO Medical & Health Leading Academic Discipline Project (approval number: 2022-F02), and Ningbo Clinical Research Center for Thoracic & Breast Neoplasms (approval number: 2021L002).
Ethical approval
The present study obtained ethics approval from the Ethics Committee of Ningbo Medical Center Lihuili Hospital (ethical approval number: 20230117-2). Every patient provided the informed consent. Written informed consent was obtained from each patient included in the study.
Consent for publication
All cases provided the informed consent. Every patient provided the informed consent. Written informed consent was obtained from each patient included in the study.
Author contributions
Kaizhong Yu, Weiyu Shen, and Gaofeng Liang conceived and designed the experiments. Gaofeng Liang, Jinxian He, and Tian Chen performed the experiments and wrote the paper. Gaofeng Liang, Liang Zhang, Kaizhong Yu, and Jinxian He analyzed the data. All authors approved the final version. All authors read and approved the final manuscript.
Disclosure statement
No potential conflict of interest was reported by the author(s).
Data availability statement
The data in this study are available from the corresponding author upon reasonable request.
References
- 1.Socinski MA, Obasaju C, Gandara D Jr., et al. Current and emergent therapy options for advanced squamous cell lung cancer. J Thorac Oncol. 2018;13(2):165–183. doi: 10.1016/j.jtho.2017.11.111. [DOI] [PubMed] [Google Scholar]
- 2.Felip E, Altorki N, Zhou C, et al. Adjuvant atezolizumab after adjuvant chemotherapy in resected stage IB-IIIA non-small-cell lung cancer (IMpower010): a randomised, multicentre, open-label, phase 3 trial. Lancet. 2021;398(10308):1344–1357. doi: 10.1016/S0140-6736(21)02098-5. [DOI] [PubMed] [Google Scholar]
- 3.Forde PM, Spicer J, Lu S, et al. Neoadjuvant nivolumab plus chemotherapy in resectable lung cancer. N Engl J Med. 2022;386(21):1973–1985. doi: 10.1056/NEJMoa2202170. [DOI] [PMC free article] [PubMed] [Google Scholar]
- 4.Paz-Ares L, Vicente D, Tafreshi A, et al. A randomized, placebo-controlled trial of pembrolizumab plus chemotherapy in patients with metastatic squamous NSCLC: protocol-specified final analysis of KEYNOTE-407. J Thorac Oncol. 2020;15(10):1657–1669. doi: 10.1016/j.jtho.2020.06.015. [DOI] [PubMed] [Google Scholar]
- 5.Moore LD, Le T, Fan G.. DNA methylation and its basic function. Neuropsychopharmacology. 2013;38(1):23–38. doi: 10.1038/npp.2012.112. [DOI] [PMC free article] [PubMed] [Google Scholar]
- 6.Hao X, Luo H, Krawczyk M, et al. DNA methylation markers for diagnosis and prognosis of common cancers. Proc Natl Acad Sci USA. 2017;114(28):7414–7419. doi: 10.1073/pnas.1703577114. [DOI] [PMC free article] [PubMed] [Google Scholar]
- 7.Baylin SB, Jones PA.. Epigenetic determinants of cancer. Cold Spring Harb Perspect Biol. 2016;8(9):a019505. doi: 10.1101/cshperspect.a019505. [DOI] [PMC free article] [PubMed] [Google Scholar]
- 8.Saif I, Kasmi Y, Allali K, et al. Prediction of DNA methylation in the promoter of gene suppressor tumor. Gene. 2018;651:166–173. doi: 10.1016/j.gene.2018.01.082. [DOI] [PubMed] [Google Scholar]
- 9.Pan H, Renaud L, Chaligne R, et al. Discovery of candidate DNA methylation cancer driver genes. Cancer Discov. 2021;11(9):2266–2281. doi: 10.1158/2159-8290.CD-20-1334. [DOI] [PMC free article] [PubMed] [Google Scholar]
- 10.Constâncio V, Nunes SP, Henrique R, et al. DNA methylation-based testing in liquid biopsies as detection and prognostic biomarkers for the four major cancer types. Cells. 2020;9(3):624. doi: 10.3390/cells9030624. [DOI] [PMC free article] [PubMed] [Google Scholar]
- 11.Weller M, Tabatabai G, Kästner B, et al. MGMT promoter methylation is a strong prognostic biomarker for benefit from dose-intensified temozolomide rechallenge in progressive glioblastoma: the DIRECTOR trial. Clin Cancer Res. 2015;21(9):2057–2064. doi: 10.1158/1078-0432.CCR-14-2737. [DOI] [PubMed] [Google Scholar]
- 12.Liang R, Li X, Li W, et al. DNA methylation in lung cancer patients: opening a “window of life” under precision medicine. Biomed Pharmacother. 2021;144(112202):112202. doi: 10.1016/j.biopha.2021.112202. [DOI] [PubMed] [Google Scholar]
- 13.Li P, Liu S, Du L, et al. Liquid biopsies based on DNA methylation as biomarkers for the detection and prognosis of lung cancer. Clin Epigenetics. 2022;14(1):118. doi: 10.1186/s13148-022-01337-0. [DOI] [PMC free article] [PubMed] [Google Scholar]
- 14.Nakagawa H, Fujita M.. Whole genome sequencing analysis for cancer genomics and precision medicine. Cancer Sci. 2018;109(3):513–522. doi: 10.1111/cas.13505. [DOI] [PMC free article] [PubMed] [Google Scholar]
- 15.Ding W, Chen G, Shi T.. Integrative analysis identifies potential DNA methylation biomarkers for pan-cancer diagnosis and prognosis. Epigenetics. 2019;14(1):67–80. doi: 10.1080/15592294.2019.1568178. [DOI] [PMC free article] [PubMed] [Google Scholar]
- 16.Di Pietro C, Ragusa M, Barbagallo D, et al. The apoptotic machinery as a biological complex system: analysis of its omics and evolution, identification of candidate genes for fourteen major types of cancer, and experimental validation in CML and neuroblastoma. BMC Med Genomics. 2009;2(1):20. doi: 10.1186/1755-8794-2-20. [DOI] [PMC free article] [PubMed] [Google Scholar]
- 17.Han F, Chen S, Zhang K, et al. Single-cell transcriptomic sequencing data reveal aberrant DNA methylation in SMAD3 promoter region in tumor-associated fibroblasts affecting molecular mechanism of radiosensitivity in non-small cell lung cancer. J Transl Med. 2024;22(1):288. doi: 10.1186/s12967-024-05057-2. [DOI] [PMC free article] [PubMed] [Google Scholar]
- 18.Liu X, Zheng W, Zhang L, et al. Arginine methylation-dependent cGAS stability promotes non-small cell lung cancer cell proliferation. Cancer Lett. 2024;586:216707. doi: 10.1016/j.canlet.2024.216707. [DOI] [PubMed] [Google Scholar]
- 19.Yu Y, Mao L, Cheng Z, et al. A novel regQTL-SNP and the risk of lung cancer: a multi-dimensional study. Arch Toxicol. 2021;95(12):3815–3827. doi: 10.1007/s00204-021-03170-5. [DOI] [PubMed] [Google Scholar]
- 20.Xu Z, Zhang L, Wang M, et al. A novel subtype to predict prognosis and treatment response with DNA driver methylation-transcription in ovarian cancer. Epigenomics. 2022;14(18):1073–1088. doi: 10.2217/epi-2022-0206. [DOI] [PubMed] [Google Scholar]
- 21.Yang H-S, Cai H-Y, Shan S-C, et al. Methylation of N6 adenosine-related long noncoding RNA: effects on prognosis and treatment in ‘driver-gene-negative’ lung adenocarcinoma. Mol Oncol. 2023;17(2):365–377. doi: 10.1002/1878-0261.13323. [DOI] [PMC free article] [PubMed] [Google Scholar]
- 22.Zhong C, Xie T, Chen L, et al. Immune depletion of the methylated phenotype of colon cancer is closely related to resistance to immune checkpoint inhibitors. Front Immunol. 2022;13:983636. doi: 10.3389/fimmu.2022.983636. [DOI] [PMC free article] [PubMed] [Google Scholar]
- 23.Tran TO, Vo TH, Lam LHT, et al. ALDH2 as a potential stem cell-related biomarker in lung adenocarcinoma: comprehensive multi-omics analysis. Comput Struct Biotechnol J. 2023;21:1921–1929. doi: 10.1016/j.csbj.2023.02.045. [DOI] [PMC free article] [PubMed] [Google Scholar]
- 24.Rodríguez-Zavala JS, Calleja LF, Moreno-Sánchez R, et al. Role of aldehyde dehydrogenases in physiopathological processes. Chem Res Toxicol. 2019;32(3):405–420. doi: 10.1021/acs.chemrestox.8b00256. [DOI] [PubMed] [Google Scholar]
- 25.Wang W, Wang C, Xu H, et al. Aldehyde dehydrogenase, liver disease and cancer. Int J Biol Sci. 2020;16(6):921–934. doi: 10.7150/ijbs.42300. [DOI] [PMC free article] [PubMed] [Google Scholar]
- 26.Moreb JS, Mohuczy D, Ostmark B, et al. RNAi-mediated knockdown of aldehyde dehydrogenase class-1A1 and class-3A1 is specific and reveals that each contributes equally to the resistance against 4-hydroperoxycyclophosphamide. Cancer Chemother Pharmacol. 2007;59(1):127–136. doi: 10.1007/s00280-006-0233-6. [DOI] [PubMed] [Google Scholar]
- 27.Moreb JS, Baker HV, Chang L-J, et al. ALDH isozymes downregulation affects cell growth, cell motility and gene expression in lung cancer cells. Mol Cancer. 2008;7(1):87. doi: 10.1186/1476-4598-7-87. [DOI] [PMC free article] [PubMed] [Google Scholar]
- 28.Lu H-J, Chuang C-Y, Chen M-K, et al. The impact of ALDH7A1 variants in oral cancer development and prognosis. Aging. 2022;14(10):4556–4571. doi: 10.18632/aging.204099. [DOI] [PMC free article] [PubMed] [Google Scholar]
- 29.Marchitti SA, Brocker C, Stagos D, et al. Non-P450 aldehyde oxidizing enzymes: the aldehyde dehydrogenase superfamily. Expert Opin Drug Metab Toxicol. 2008;4(6):697–720. doi: 10.1517/17425255.4.6.697. [DOI] [PMC free article] [PubMed] [Google Scholar]
- 30.Rose AE, Poliseno L, Wang J, et al. Integrative genomics identifies molecular alterations that challenge the linear model of melanoma progression. Cancer Res. 2011;71(7):2561–2571. doi: 10.1158/0008-5472.CAN-10-2958. [DOI] [PMC free article] [PubMed] [Google Scholar]
- 31.van den Hoogen C, van der Horst G, Cheung H, et al. The aldehyde dehydrogenase enzyme 7A1 is functionally involved in prostate cancer bone metastasis. Clin Exp Metastasis. 2011;28(7):615–625. doi: 10.1007/s10585-011-9395-7. [DOI] [PMC free article] [PubMed] [Google Scholar]
- 32.Andrejeva D, Kugler J-M, Nguyen HT, et al. Metabolic control of PPAR activity by aldehyde dehydrogenase regulates invasive cell behavior and predicts survival in hepatocellular and renal clear cell carcinoma. BMC Cancer. 2018;18(1):1180. doi: 10.1186/s12885-018-5061-7. [DOI] [PMC free article] [PubMed] [Google Scholar]
- 33.Prokopczyk B, Sinha I, Trushin N, et al. Gene expression profiles in HPV-immortalized human cervical cells treated with the nicotine-derived carcinogen 4-(methylnitrosamino)-1-(3-pyridyl)-1-butanone. Chem Biol Interact. 2009;177(3):173–180. doi: 10.1016/j.cbi.2008.10.051. [DOI] [PMC free article] [PubMed] [Google Scholar]
- 34.Freeman JR, Chu S, Hsu T, et al. Epigenome-wide association study of smoking and DNA methylation in non-small cell lung neoplasms. Oncotarget. 2016;7(43):69579–69591. doi: 10.18632/oncotarget.11831. [DOI] [PMC free article] [PubMed] [Google Scholar]
- 35.Zhang M, Zhang J, Liu Y.. Comprehensive analysis of molecular features, prognostic values, and immune landscape association of m6A-regulated immune-related lncRNAs in smoking-associated lung squamous cell carcinoma. Front Genet. 2022;13:887477. doi: 10.3389/fgene.2022.887477. [DOI] [PMC free article] [PubMed] [Google Scholar]
- 36.Patel M, Lu L, Zander DS, et al. ALDH1A1 and ALDH3A1 expression in lung cancers: correlation with histologic type and potential precursors. Lung Cancer. 2008;59(3):340–349. doi: 10.1016/j.lungcan.2007.08.033. [DOI] [PubMed] [Google Scholar]
- 37.Giacalone NJ, Den RB, Eisenberg R, et al. ALDH7A1 expression is associated with recurrence in patients with surgically resected non-small-cell lung carcinoma. Future Oncol. 2013;9(5):737–745. doi: 10.2217/fon.13.19. [DOI] [PMC free article] [PubMed] [Google Scholar]
- 38.Takagi S, Baba S, Iwai N, et al. The aldehyde dehydrogenase 2 gene is a risk factor for hypertension in Japanese but does not alter the sensitivity to pressor effects of alcohol: the Suita study. Hypertens Res. 2001;24(4):365–370. doi: 10.1291/hypres.24.365. [DOI] [PubMed] [Google Scholar]
- 39.Comporti M. Lipid peroxidation and biogenic aldehydes: from the identification of 4-hydroxynonenal to further achievements in biopathology. Free Radic Res. 1998;28(6):623–635. doi: 10.3109/10715769809065818. [DOI] [PubMed] [Google Scholar]
- 40.Erdogan F, Radu TB, Orlova A, et al. JAK-STAT core cancer pathway: an integrative cancer interactome analysis. J Cell Mol Med. 2022;26(7):2049–2062. doi: 10.1111/jcmm.17228. [DOI] [PMC free article] [PubMed] [Google Scholar]
- 41.Sanaei MJ, Razi S, Pourbagheri-Sigaroodi A, et al. The PI3K/Akt/mTOR pathway in lung cancer; oncogenic alterations, therapeutic opportunities, challenges, and a glance at the application of nanoparticles. Transl Oncol. 2022;18:101364. doi: 10.1016/j.tranon.2022.101364. [DOI] [PMC free article] [PubMed] [Google Scholar]
Associated Data
This section collects any data citations, data availability statements, or supplementary materials included in this article.
Supplementary Materials
Data Availability Statement
The data in this study are available from the corresponding author upon reasonable request.


