

Abstract
In the course of pipe jacking construction, the carrying-soil effect frequently arises, influenced by factors such as excavation unloading, ongoing disturbance from successive pipe sections, and the progressive accumulation of soil adhesion. The pipe jacking slurry serves as a critical agent for friction reduction and strata support, essential for the secure advancement of the construction process. This study introduces the Microbial-Induced Calcium Carbonate Precipitation (MICP) technology into the realm of pipe jacking slurry, aiming to enhance its friction-reduction capabilities and the stability of the soil enveloping the pipe. An optimal MICP-slurry formulation was determined using the uniform design approach. Subsequent model tests were carried out to assess the friction-reducing efficacy of the MICP-slurry, while the mechanism by which the MICP-slurry reinforces strata stability was investigated through soil mechanics and scanning electron microscopy (SEM) analyses. The findings indicate that the optimal MICP-slurry composition is as follows: bentonite: sodium carboxymethyl cellulose: soda ash: polyacrylamide: xanthan gum = 12%: 0.31%: 0.36%: 0.25%: 0.54%. The MICP-slurry achieves a 42.2% reduction in the friction coefficient between the test block and the sand. In comparison with the untreated sample, the cohesion of the MICP-treated sample is enhanced by 38.12%, and the internal friction angle increases by 14.01%. SEM examination reveals that the calcium carbonate crystals precipitated by the MICP-slurry within the soil populate the pores, increase the inter-particle bite force, and bolster the soil’s mechanical characteristics.
Keywords: Carrying-soil effect, MICP, Mud, Friction reduction effect, Mechanical properties, Microstructure
Subject terms: Biological techniques, Engineering
Research background
As urbanization accelerates, the imbalance between the supply and demand for above-ground space has progressively intensified, rendering the development and utilization of urban underground space an essential option for urban expansion. The pipe jacking technique, as a method for exploiting underground space, has seen growing application in various sectors, including underground pedestrian crossings, roadways, and utility tunnels. In recent years, with pipe jacking projects scaling up to ultra-large dimensions and extending over ultra-long distances, the carrying-soil effect has become a prominent issue that necessitates attention in pipe jacking activities1. The effective mitigation of frictional resistance during pipe jacking and the enhancement of surrounding soil stability are now pivotal research areas.
Pipe jacking slurry, a drag-reducing medium characterized by its unique mineral composition and thixotropic behavior, serves to fill the annular space between the pipe and the soil during pipe jacking operations. It transforms the dry friction into wet friction, while also sealing the gaps between the pipe and the soil, thereby diminishing soil deformation and offering strata support. Extensive research has been carried out domestically and internationally over the years, focusing on pipe jacking slurry and the carrying-soil effect, resulting in significant advancements. Shen Leilei2 systematically examined the variation trends of three key performance indicators of drag-reducing slurry—funnel viscosity, water loss, and bleeding rate—by altering the proportion of high-molecular-weight materials in the slurry, thereby elucidating the specific impacts of various high-molecular-weight additives on the overall performance of the slurry. Reilly et al.3 observed that the maximum length of a single pipe jacking is governed by the frictional resistance at the pipe surface as it moves through the soil. Although the application of drag-reducing slurry has proven effective in minimizing this resistance, the underlying mechanism is not yet fully comprehended. Yu Jun et al.4 examined the physical characteristics of the pipe jacking slurry sheath, asserting that maintaining sheath integrity depends on an understanding of the soil layer distribution and the development of a slurry with superior performance attributes. Xinbo Ji et al.5highlighted the necessity of refining jacking force calculation methodologies. They performed multiple direct shear tests to determine friction coefficients, which were subsequently employed in numerical simulations to validate the model’s feasibility against field data. Peng Limin et al.6 conducted comprehensive research on the carrying-soil effect in pipe jacking, informed by engineering practice. Wei Gang et al.7, utilizing the small deformation assumption and Mindlin’s solution, conducted a quantitative analysis of the soil compaction effects of single pipe jacking and the additional loads imposed by multiple pipe jackings. Yu Jun et al.8 introduced an innovative approach to calculating the jacking force for pipe jacking, grounded in the cylindrical hole expansion theory in semi-infinite elastic space and the flat plate model of viscous fluid mechanics, while considering the thixotropic nature of the friction-reducing slurry.
MICP technology utilizes the urease produced byproducts of microbial metabolic activities in nature to hydrolyze urea in the environment and react with free calcium sources to mineralize and form calcium carbonate9. Compared to traditional cementitious materials, the calcium carbonate precipitation induced by MICP technology offers a controllable reaction rate, high permeability, controllable crystal sizes, and cementation strength, while minimizing environmental pollution and maintaining a relatively low cost. Since E. Boquet et al.10discovered in 1973 that certain bacteria in soil could induce the precipitation of calcium carbonate crystals, this technology has rapidly garnered significant attention from scholars both domestically and internationally. Subsequent to further in-depth research, this technology has been increasingly applied in fields such as building material repair11, stone artifact restoration12, and soil property improvement13. Hang Lei et al.14 incorporated xanthan gum into the MICP cementing solution, which significantly enhanced the integrity and unconfined compressive strength of the treated sandy soil. The MICP process could also effectively improve the tolerance of xanthan gum to water flow erosion. Chittoori et al.15 demonstrated that MICP can be successfully replicated in the field to stabilize expansive soils, with the free swell index dropping from 114 to 29% after MICP treatment. Ma et al.16 used a bio-grout mixture of bentonite, bacterial solution, and cementing solution as a slurry to reinforce coarse sand and found that MICP could effectively reduce the permeability of coarse sand with the help of bentonite. Li Zhijun et al.17investigated the growth patterns of microorganisms in the environment of drilling fluids, studying the growth of Bacillus pasteurii in biological polymers within drilling fluids under different pH values, analyzing and fitting its growth pattern, and constructing a growth prediction model for it. Xiang Haotian18 utilized MICP technology to improve solid-free drilling fluids, targeting the weak cementation of rock and soil masses in fractured formations by employing the principle of microbial mineralization to enhance the wall-stabilizing effect of drilling fluids. He established a microbial solid-free drilling fluid system and studied its wall-stabilizing mechanism.
Nevertheless, the prevailing research primarily focuses on mitigating the carrying-soil effect by enhancing the friction-reducing properties of pipe jacking mud. Relatively few studies have investigated the interactions between the mud and the soil surrounding the pipe. MICP technology presents an innovative approach to combat the soil-carrying phenomenon. Its integration into pipe jacking mud creates a microbial mud system that can induce calcium carbonate precipitation within the adjacent formations during pipe jacking, thus enhancing the stability of the soil surrounding the pipe and diminishing the carrying-soil effect. This study employs MICP technology to enhance the properties of pipe jacking mud. Tests on the mud are conducted using the uniform design method to assess the viability of this technology for application in pipe jacking mud. The friction-reducing efficacy of the enhanced mud is investigated through scaled model testing. Moreover, mechanical tests and scanning electron microscopy (SEM) analyses are conducted to unravel the underlying mechanism of the MICP-mud, examining its action from both macroscopic and microscopic standpoints.
Preparation of experimental materials
Bentonite
The montmorillonite content in bentonite typically varies between 70% and 95%. The crystal structure of montmorillonite is distinctive; it is characterized by crystals connected via stacking, as shown in Fig. 1(a). The hydration and swelling process of montmorillonite is illustrated in Fig. 1(b).
Fig. 1.

(a) Schematic diagram of montmorillonite crystal. (b) Schematic diagram of bentonite hydration and expansion.
The additives used in the modified bentonite slurry for pipe jacking projects can be primarily categorized into two types. The first type, which includes soda ash, enhances the ion exchange in the slurry, leading to a negatively charged crystal structure that generates repulsion. This, in turn, enhances the dispersion effect and improves the suspensibility of the bentonite. The second type comprises polymers that adsorb onto the surface of the bentonite crystal structure via their molecular chains. This creates a three-dimensional network, which in turn enhances the engineering properties of the slurry. The primary materials employed in this study include bentonite, as well as polymeric additives such as xanthan gum (XG), polyacrylamide (PAM), soda ash, carboxymethyl cellulose (CMC), among others.
Bacterial solution and nutrient solution
The microorganism selected for the experiment, Sporosarcina pasteurii, is cultivated in a culture medium. The composition of the culture medium is provided in Table 1.sequent to preliminary pre-tests, the cementing solution was prepared, consisting of 0.5 M urea 0.5 M CaCl2. Urea acts as the nitrogen source for the biological reaction, whereas CaCl2 supplies the calcium source. absorbance of the bacterial solution was measured using a V-1100D spectrophotometer, with the OD600value serving as an indicator of bacterial concentration. The urease activity within the bacterial solution was assessed using the conductivity method proposed by Whiffin19. Figure 2 illustrates the microbial growth curve and the urease activity curve.
Table 1.
Yeast extract peptone multiplication medium.
| Composition | Peptone | Sodium chloride | Yeast extract powder | Agar |
|---|---|---|---|---|
| Content | 10 g/L | 5 g/L | 3 g/L | — |
Fig. 2.
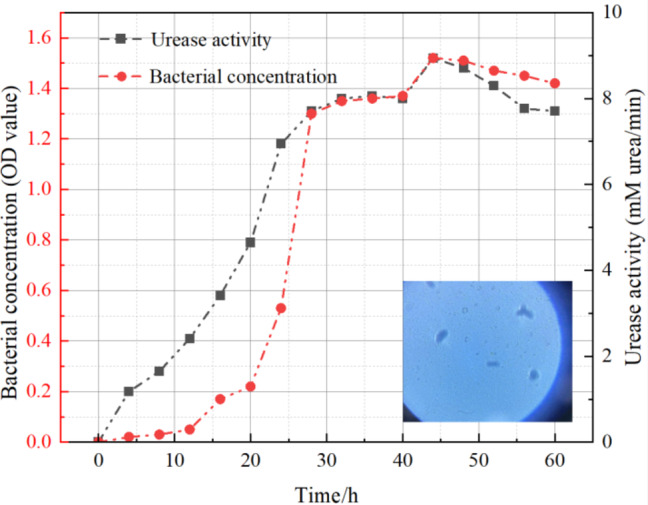
Microbial growth curve and urease activity curve.
Experimental methodology
MICP-slurry experiment
Following the preliminary experiments, the Data Processing System (DPS) was employed to simulate and select an experimental scheme via the uniform design method. The experimental design incorporated four material factors across nine different levels of material addition. The selected material factors included CMC, XG, soda ash, and PAM. Moreover, a uniform quantity of 120 g of bentonite and 1000 ml of water, containing the bacterial solution and nutrient solution (hereinafter referred to as ‘water’ for simplicity), were used in the slurry experiments. The uniform design matrix is displayed in Table 2.
Table 2.
U9*(94) Uniform design table.
| Test number | CMC | Soda ash | XG | PAM |
|---|---|---|---|---|
| 1 | 1(2.5) | 5(3.7) | 4(4.2) | 3(2.3) |
| 2 | 4(3.7) | 8(4.9) | 7(5.4) | 1(1.5) |
| 3 | 5(4.1) | 2(2.5) | 3(3.8) | 9(4.9) |
| 4 | 9(5.7) | 6(4.1) | 9(6.2) | 5(3.1) |
| 5 | 6(4.5) | 1(2.1) | 6(5.0) | 4(2.7) |
| 6 | 8(5.3) | 4(3.3) | 2(3.4) | 2(1.9) |
| 7 | 3(3.3) | 7(4.5) | 1(3.0) | 6(3.5) |
| 8 | 2(2.9) | 3(2.9) | 8(5.8) | 7(3.9) |
| 9 | 7(4.9) | 9(5.4) | 5(4.6) | 8(4.4) |
As detailed in Table 2, the slurry constituents for each treatment were sequentially added to 1000 ml of water to formulate the slurry. Following formulation, the slurry was left to settle for 16 h to facilitate complete hydration. Subsequently, the slurry’s various properties were assessed, and the experimental results were meticulously documented. To evaluate the slurry properties, four key performance indicators were selected: funnel viscosity, fluid loss, bleeding rate, and mud cake thickness20. The experimental setup is illustrated in Fig. 3.
Fig. 3.

(a) Funnel viscosity test. (b) Fluid loss test. (c) Water separation rate test. (d) Measurement of mud cake thickness.
Scaled model test
After determining the optimal mud mixture ratio, scaled model tests were conducted to investigate the friction-reducing effects of the friction-reducing mud in pipe jacking. Various mixtures, composed of friction-reducing mud and C35 concrete test blocks fabricated from the same material used for segments at the construction site, were selected for testing. The experimental setup is illustrated in Fig. 4. To assess the friction-reducing properties of the mud, the friction coefficient between the test block and the soil layer was determined. During the testing process, the concrete block was moved at a constant speed to stabilize the dynamometer reading, thus facilitating the precise determination of the tensile force value. This method was grounded in the principle of mechanical equilibrium, as presented in Eq. (1).
| 1 |
Fig. 4.
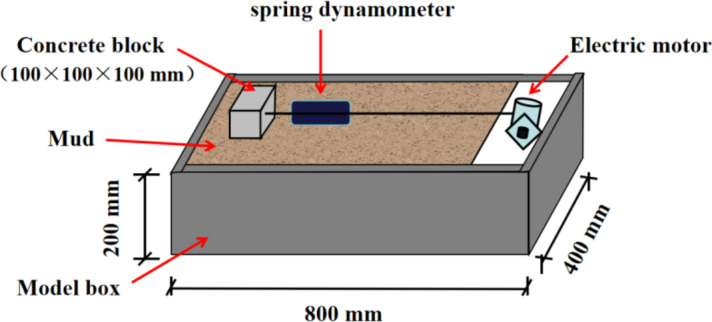
Test device for determining coefficient of friction.
In the formula, where f represents the friction force acting on the concrete block (N), μ represents the coefficient of friction, and FN represents the normal force on the contact surface (N).
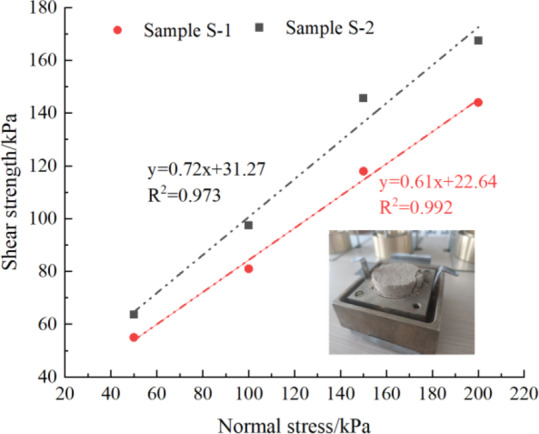
Direct shear test
According to the “Chinese code“21, a particle size distribution test was performed on the soil samples. Figure 5(a) illustrates the particle size distribution curve. The untreated sample is referred to as S-1, while the sample treated with MICP is designated as S-2. The fully contacting flexible sample molds were used in the experiment. The samples were soaked in a bacterial solution for 2 h to facilitate colonization. Subsequently, they were transferred to a container containing a cementing solution (comprising 0.5 M urea and 0.5 M CaCl2), as shown in Fig. 5(b), for full immersion. After 24 h of cementation, the samples were removed, cleaned, and dried.
Fig. 5.

(a) Cumulative particle size curve. (b) Reaction vessel.
A conventional ZJ strain-controlled direct shear apparatus, manufactured by Nanjing Soil Instrument Factory Co., Ltd., was utilized to conduct the direct shear test. The test was conducted in accordance with the provisions of the “Chinese code”21. During the direct shear test, the sand samples were subjected to a shear rate of 0.01 mm/min and exposed to vertical pressures of 50 kPa, 100 kPa, 150 kPa, and 200 kPa, respectively.
Experimental results and analysis
Results and analysis of MICP-Slurry experiments
The uniform design method, an experimental technique, assesses the distribution of data points across the experimental domain by relaxing the strict comparability requirements among the experimental subjects. To reduce the number of experiments, the number of experimental levels is typically set equal to the number of trials performed. The lack of strict comparability in the experimental outcomes complicates direct analysis, necessitating the use of specialized data analysis software to perform correlation regression analysis on the results. The experimental results are presented in Table 3, with the bleeding rates for all experimental groups meeting the criteria and, consequently, not warranting individual analysis.
Table 3.
The result of test and measurement.
| Test number | Fluid loss(ml) | Funnel viscosity(s) | Mud cake thickness(mm) | ||||||
|---|---|---|---|---|---|---|---|---|---|
| V1 | V2 | V3 | V1 | V2 | V3 | V1 | V2 | V3 | |
| 1 | 15.4 | 14.8 | 15.1 | 60.8 | 65.7 | 69.2 | 1.2 | 1.3 | 1.2 |
| 2 | 17.3 | 17.6 | 17.5 | 42.1 | 48.4 | 46.8 | 1.5 | 1.4 | 1.3 |
| 3 | 21.7 | 20.9 | 21.3 | 37.9 | 42.6 | 45.3 | 1.6 | 1.8 | 1.6 |
| 4 | 14.3 | 14.6 | 14.4 | 72.8 | 68.9 | 76.4 | 1.4 | 1.3 | 1.5 |
| 5 | 12.7 | 13.1 | 13.2 | 51.4 | 55.3 | 53.6 | 1.7 | 1.6 | 1.6 |
| 6 | 15.4 | 15.2 | 14.9 | 45.7 | 52.4 | 54.7 | 1.3 | 1.3 | 1.4 |
| 7 | 12.2 | 12.5 | 12.6 | 52.8 | 49.5 | 54.2 | 1.5 | 1.4 | 1.6 |
| 8 | 14.8 | 14.3 | 14.2 | 78.6 | 80.7 | 83.6 | 1.2 | 1.1 | 1.2 |
| 9 | 13.9 | 13.7 | 13.5 | 65.7 | 70.6 | 72.5 | 1.6 | 1.4 | 1.5 |
Statistical analysis of the four experimental variables (XG, CMC, soda ash, PAM) and three response variables (fluid loss, funnel viscosity, and mud cake thickness) was performed using DPS data analysis software. The results of this analysis are detailed in Table 4, with the variables designated as follows: CMC as x1, soda ash as x2, PAM as x3, XG as x4, fluid loss as Y1, funnel viscosity as Y2, and mud cake thickness as Y3.
Table 4.
Correlation analysis was conducted to examine the linear relationship between variables. The strength of this relationship is quantified by the correlation coefficient, which ranges from 0 to 1. A value of r above 0.7 suggests a strong positive correlation; a value between 0.4 and 0.7 indicates a moderate positive correlation; a value between 0.2 and 0.4 indicates a weak positive correlation, and a value below 0.2 suggests no significant correlation.
| Name | Fluid loss | Bleeding rate | Mud cake thickness |
|---|---|---|---|
| CMC | −0.294 | + 0.475 | −0.317 |
| Soda ash | −0.261 | + 0.248 | + 0.267 |
| PAM | + 0.547 | −0.456 | + 0.483 |
| Xanthan gum | −0.354 | + 0.625 | −0.546 |
As can be seen from Table 4:
(1) CMC exhibits a moderate negative correlation with fluid loss, a strong positive correlation with funnel viscosity, and a moderate negative correlation with mud cake thickness. High concentrations of cations can decrease the concentration of the slurry. If the cation concentration in the solution exceeds 500 mM, the Marsh viscosity of the slurry may not meet engineering specifications, and the addition of polymeric materials, such as CMC, can enhance the slurry’s viscosity22. CMC is a linear water-soluble polymer, with hydrated groups that can ionize hydroxyl groups, leading to negative charge repulsion between the groups. This repulsion causes the molecular chain to extend, enabling it to adsorb onto the surface of bentonite particles through these groups. The negatively charged hydroxyl groups readily form hydrogen bonds with water molecules. The mechanical entanglement and hydrogen bonding between the polymer chains effectively restrict the migration of nearby water molecules, thereby reducing the suspension’s overall fluidity and preventing the flocculation and agglomeration of bentonite particles, resulting in the formation of a dense filter cake. Consequently, the use of CMC leads to an increase in slurry viscosity, a reduction in fluid loss23 and a thinner mud cake.
(2) Sodium carbonate exhibits a moderate negative correlation with fluid loss; a moderate positive correlation with funnel viscosity; and a non-significant positive correlation with mud cake thickness. The presence of a substantial number of calcium ions in the slurry facilitates the displacement of interlayer bound water from the montmorillonite layers, leading to a reduction in the volume of bentonite particles. With an increasing dosage of sodium carbonate, a greater number of sodium ions infiltrate the montmorillonite lattice, restoring the original cation exchange balance between sodium and calcium ions24The replacement capacity of sodium ions is less than that of calcium ions25, which leads to an enhancement in the adsorption of water molecules within the interlayers, strengthens the double electric layer at the crystal surface, and enhances the dispersibility of bentonite. Concurrently, the high concentration of cations in the solution diminishes the interlayer bound water content of bentonite while also promoting the development of larger pores between the particles, with these two opposing effects potentially offsetting one another26. Consequently, the use of sodium carbonate results in an increased slurry viscosity, a reduced fluid loss, and an unchanged mud cake thickness.
(3) PAM exhibits a very strong positive correlation with fluid loss, a strong negative correlation with funnel viscosity, and a strong positive correlation with mud cake thickness. The presence of high concentrations of calcium ions in the slurry can neutralize the negative charge groups on the PAM molecular chain27, thereby reducing the thickness of the Stern layer and diminishing the negative surface charge. Simultaneously, the electrostatic repulsion between PAM molecular segments is mitigated by the cations present within the double layers, leading to a reduction in repulsive forces. Consequently, the PAM macromolecular segments tend to contract, decreasing their interaction with the solvent and reducing intermolecular friction, which results in a marked decrease in the viscosity of the polymer slurry28. Furthermore, the -CONH2 groups of PAM can ionize, releasing H+ ions, which facilitate the movement of bound water out from between the montmorillonite layers and decrease the size of bentonite particles. These processes collectively manifest macroscopically as diminished viscosity, increased fluid loss, and augmented mud cake thickness.
(4) XG demonstrates a strong negative correlation with fluid loss, a very strong positive correlation with funnel viscosity, and a very strong negative correlation with mud cake thickness. The XG molecule comprises repeating pentasaccharide units with a distinct structure, which contain strong polar groups such as hydroxyl (-OH) and carboxyl (-COO-) groups, endowing it with significant water absorption capacity and the ability to form hydrogen bonds with water molecules, thus reducing the activity of water in the slurry29. The negatively charged groups of XG, in conjunction with those in the slurry, diminish the cations’ capacity to displace bound water from the interlayers of montmorillonite, thereby increasing the number of water molecules adsorbed between these layers. The XG backbone is enveloped by side chains in the opposite direction, and in a structured state, the backbone and side chains utilize hydrogen bonds to adopt a double helix configuration. This distinctive molecular structure of XG enhances the intermolecular forces among the aggregated molecules. The presence of high concentrations of calcium ions can form complexes with the C-O bonds in the XG molecular chain30, thereby enhancing intermolecular interactions. Concurrently, the shielding effect of metal cations reduces the electrostatic repulsion between the -COO- groups of XG molecules, leading to contraction of the molecular chain and establishing a dynamic equilibrium within the system31. Macroscopically, these interactions result in an increased viscosity, reduced fluid loss, and a thinner mud cake.
The cell walls of microorganisms are characterized by the presence of numerous functional groups, including hydroxyl, carboxyl, and phosphate moieties. In alkaline environments, these cell surfaces acquire a negative charge, as do the extracellular polymers that are secreted as byproducts of cellular metabolism. Both the cell walls and the extracellular polymers demonstrate a pronounced electrostatic attraction to metal cations present in the solution, effectively chelating these cations within the mud matrix and facilitating the formation of a mineralized interface that serves as a nucleation site for crystal growth32. This interaction establishes a positive feedback loop with the other constituents of the mud, enhancing mutual promotion and stabilization.
A mathematical model was developed using regression analysis, where fluid loss33, funnel viscosity, and mud cake thickness served as dependent variables, and XG, CMC, soda ash, and PAM were considered as independent variables. By employing DPS software for multivariate stepwise regression analysis, the regression equation’s mathematical model was formulated as presented in Eq. 2:
| 2 |
This equation defines y as the dependent variable, with xi (where i ranges from 1 to 4) as the independent variables, βj (where j ranges from 0 to 4) as the regression coefficients, and ε as the error term. Regression equations, each with a different indicator serving as the objective function, were formulated, and the findings are presented in Table 5.
Table 5.
The regression equations for each dependent variable and their respective validations are as follows: The results of ridge regression indicate that the regression coefficients in the linear regression model are non-zero, and the P-values based on the F-test are less than 0.05, signifying statistical significance at this threshold. Additionally, the model’s goodness-of-fit R² value is close to 1, suggesting that the model is free from multicollinearity issues and exhibits good performance.
| Name | Regression equation | R 2 | F |
|---|---|---|---|
| Fluid loss |

|
0.967 | 0.027 |
| Bleeding rate |

|
0.956 | 0.03 |
| Mud cake thickness |

|
0.984 | 0.005 |
The MATLAB software is used to optimize the data for the objective function (3).
| 3 |
Where n = 1 to 3. The constraint conditions for y and x in the objective function are:
 |
4 |
By conducting optimization calculations, we determined the optimal blend ratio for the friction-reducing mud to be CMC : soda ash : PAM : XG at 0.31% : 0.36% : 0.25% : 0.54%. The corresponding experimental and calculated results for this optimal blend ratio are presented in Table 6.
Table 6.
The calculated value and the actual value of the optimal mix ratio.
| Name | Fluid loss | Bleeding rate | Mud cake thickness |
|---|---|---|---|
| Calculated value | 13.5 | 72.35 | 1.37 |
| Actual value | 13.1 | 69.2 | 1.4 |
Study on Drag Reduction Effect of MICP-Treated Mud
Utilizing the proportions derived from the mud test, we prepared MICP-mud and conducted a scaled-down test to investigate the drag reduction efficacy of the MICP-mud. We measured the friction coefficient between the test block and the sandy soil treated with MICP-mud. Concurrently, we performed a control experiment using conventional mud to benchmark and demonstrate the drag reduction capabilities. The findings are presented in Table 7.
Table 7.
Model test material parameters.
| Experimental materials | Specific parameters |
|---|---|
| Thixotropic mud with different mix ratios | Mix ratio M-N: Bentonite: CMC: Soda ash: PAM: Xanthan gum: Water = 12%: 0.31%: 0.36%: 0.25%: 0.54%: 86.54% |
| Mix ratio C-N-134: Bentonite: Soda ash: CMC: Water = 13%: 0.45%: 0.4%: 87% | |
| Mix ratio C-N-234 Bentonite: Soda ash: CMC: PAM: Water = 8%: 0.3%: 0.2%: 0.05%: 91.45% | |
| Concrete specimen | Length width width height = 10 cm height = 10 cm 10cm 10cm 10 cm, Density 2.45 g cm−1 10 cm, Density 2.45 g cm−1
|
Throughout the experiment, the concrete block was maintained in a state of uniform motion to ensure consistent readings from the dynamometer, and the resultant tension value was recorded. This procedure was grounded in the principle of mechanical equilibrium.
The result of the model test are as shown in Table 8. The table reveals that the friction coefficient without grouting for friction reduction is 0.64. The friction coefficient for the C-N-1 group is 0.35, indicating a 45.3% reduction relative to the group without grouting; for the C-N-2 group, it is 0.41, representing a 35.9% reduction; and for the M-N group, it is 0.37, showing a 42.2% reduction. The friction coefficient between the test block and the sandy soil, after the application of mud, has significantly decreased compared to conditions without grouting. The MICP mud not only maintains the friction reduction effect of traditional mud but also reinforces the surrounding strata with the calcium carbonate produced by bacterial reactions. This enhancement can notably improve the integrity and arching capacity of the soil around the pipe, effectively mitigating the soil’s carrying-soil effect.
Table 8.
Mud performance parameters.
| Mud mix ratio | f/N |
 /N /N
|
Friction coefficient/ μ | |||
|---|---|---|---|---|---|---|
| Ungrouted | 16.2 | 15.7 | 15.4 | 15.9 | 15.8 | 0.64 |
| Mix ratio M-N | 9.3 | 9.6 | 8.5 | 9.8 | 9.3 | 0.37 |
| Mix ratio C-N-1 | 8.6 | 9.0 | 8.9 | 8.8 | 8.8 | 0.35 |
| Mix ratio C-N-2 | 10.2 | 9.7 | 10.3 | 9.6 | 9.9 | 0.41 |
Analysis of mechanical properties and microscopic
Figure 6 illustrates the relationship between shear stress and shear displacement during the direct shear tests of the samples. As the shear displacement increases, the shear stress experienced by the samples increases progressively, with the rate of increase slowing down over time. At equivalent shear displacements, sample S-2 exhibited a strength 20–35% higher than that of sample S-1. This enhancement is attributed to the calcium carbonate crystals precipitated by microbial activity, which fill the interstitial pores within the samples, enhancing their compactness. These calcium carbonate crystals encase the soil particles, creating a three-dimensional network that enhances the collective load-bearing capacity of the surrounding soil, consequently bolstering the strength of the sand columns.
Fig. 6.

Correspondence Curve between Shear Displacement and Shear Stress of (a) Sample S-1.Correspondence Curve between Shear Displacement and Shear Stress of (b) Sample S-2.
Figure 7 presents the Coulomb strength fitting envelope. The analysis of the fitting results reveals that sample S-1 has a cohesion of 22.64 kPa and an internal friction angle of 31.4°, whereas sample S-2 exhibits a cohesion of 31.27 kPa and an internal friction angle of 35.8°. Sample S-2 demonstrates a 38.12% increase in cohesion and a 14.01% increase in internal friction angle relative to sample S-1. The uniform distribution of CaCO3 within sample S-2 fills soil pores, enhancing the inter-particle bite force and cohesion. The three-dimensional network framework composed of CaCO3 distributes the shear stress, thereby reinforcing the soil’s structurally weakest plane.
Fig. 7.
Sample Strength Curve.
Scanning electron microscopy (SEM) images in Fig. 7 illustrate the sample microstructures. A comparison of Fig. 8(a) and 8(b) with Fig. 8(c) and 8(d) at consistent magnifications reveals that the sample treated with microorganisms exhibits a substantial number of calcium carbonate crystals on its surface, which create a network-like membrane structure on and within the soil particles. This structure integrates the soil particles into a cohesive mass. Figure 8(a) and 8(b) demonstrate that in the absence of microorganisms, the sample exhibits larger interparticle pores and a more relaxed arrangement of particles, predominantly in point-to-point and point-to-surface contact configurations, leading to the presence of many small and medium-sized pores. The particle connections are weak, and the soil particles possess distinct edges and corners. In contrast, Fig. 8(c) and 8(d) show that the addition of microorganisms results in the precipitation of calcium carbonate crystals that fill the original mud jacket’s pores, diminishing the number of pore channels and shifting the particle contact mode to face-to-face engagement. This leads to the formation of fibrous and network-like structures among soil particles, polymers, and calcium carbonate, which significantly bridge and encapsulate the particles. Figure 8(d) indicates that the introduced CMC and PAM, with their elongated molecular chains, can adhere to the calcium carbonate on the soil particle surfaces, increasing surface roughness and the interparticle biting force. The calcium carbonate intertwines among the soil particles, forming a network that binds dispersed particle clusters, increases soil aggregation, enhances density, and reduces total porosity, consequently improving the mud jacket’s strength and decreasing its permeability coefficient35.
Fig. 8.

(a,b) Scan diagram of sample S-1. (c,d) Scan diagram of sample S-2.
Figure 9illustrates the sequence of infiltration processes. Initially, water within the slurry infiltrates the surrounding soil, subsequently facilitating the penetration of bentonite particles from the slurry into the soil matrix. Simultaneously, the microbial suspension infiltrates the soil with the water and slurry particles, forming a solidified mixture of slurry and soil at a certain depth. The slurry, characterized by its viscosity, fills the interstitial pores among soil particles and creates interconnections with adjacent soil particles, thus promoting the agglomeration of soil particles into aggregates. Furthermore, the slurry offers increased nucleation sites for microbial colonization, thereby enhancing bacterial retention rates during the biomineralization process36. This augmentation modifies the morphology and arrangement of calcium carbonate, transitioning it from a random distribution on the soil particle surfaces to an inter-particle bonding mechanism, which reinforces the cementation effect of microorganisms.
Fig. 9.

Schematic diagram of microbial induced reaction process.
Conclusion and outlook
This study employed the uniform design method to investigate the mix ratio of the Microbially-Induced Carbonate Precipitation (MICP)-enhanced mud. The optimized mix ratio was then employed to conduct scaled model experiments. Subsequent mechanical and scanning electron microscopy (SEM) analyses were used to evaluate the microstructure of the treated samples. These findings established a theoretical basis for the application of MICP technology in improving the arching capacity and stability of soil surrounding pipeline structures. The main conclusions are summarized as follows:
An experimental investigation into the MICP-mud mix ratio was performed utilizing the uniform design approach, which yielded the optimal blend proportions for the MICP-mud. Subsequently, the efficacy of this optimal mix ratio was validated through experimentation, resulting in the development of a mud composition that fulfills the criteria for practical engineering applications. Specifically, the mixture consists of CMC, soda ash, PAM, and XG in proportions of 0.31%, 0.36%, 0.25%, and 0.54%, respectively.
(2) The model test investigating the friction reduction effect of the mud revealed a significant decrease in the friction coefficient between the test blocks and the sandy soil post-mud application, indicative of a pronounced friction reduction effect. In comparison with the non-grouting scenario, the friction coefficient for the MICP-mud group was reduced by 42.2%. Moreover, the MICP-mud, in contrast to traditional friction-reducing muds, not only facilitates friction reduction but also reinforces the adjacent strata via the calcium carbonate produced by bacterial reactions. This leads to a marked improvement in the integrity and arching capacity of the soil encircling the pipeline, effectively mitigating the soil carrying effect.
-
(3)
The mechanical tests demonstrated that the cohesive force of samples treated with MICP increased by 38.12% compared to untreated samples, and the internal friction angle increased by 14.01%. Microstructural analysis indicated that MICP treatment can induce the formation of a network structure on the mud jacket’s surface and within the sand particle pores, effectively filling the interstitial spaces between sand and mud. This process enhances the inter-particle bite force, thereby integrating the soil particles into a cohesive mass. Consequently, the porosity of the mud jacket is reduced, and its integrity and arching capacity are improved. In particular, for large-scale and long-distance pipe-jacking projects, the increase in jacking distance leads to a progressive accumulation of soil disturbance around the pipeline, which not only intensifies the carrying-soil effect but also progressively raises the required jacking force. The application of MICP technology can effectively reinforce the soil surrounding the pipeline, mitigate the carrying-soil effect, lower the jacking force exerted during the jacking process, and reduce the necessity for relay stations.
-
(4)
Bacillus pasteuri, an aerobic bacterium, demonstrates enhanced activity in environments rich in oxygen. Throughout the process of long-distance pipe jacking, the limited oxygen availability in the ambient environment may impair the activity of Bacillus pasteuri, which could diminish its capacity to break down urea. This, subsequently, might result in a decline in its overall efficacy. Consequently, it is imperative to adapt and cultivate Bacillus pasteuri, as well as to examine its growth dynamics.
Acknowledgements
This research was funded by the Inner Mongolia Autonomous Region’s Universities Basic Scientific Research Operating Expenses Project: Application of Green Microbial Mineraliza-tion Technology in Restoration and Control of Abandoned Open-pit Mines in Inner Mongolia (2024QNJS063).
Author contributions
Conceptualization, G.Q. and H.Z.; methodology, G.Q. , H.Z. , C.M. and X.Z. ; formal analysis, G.Q. , H.Z. , C.M. ; investigation, G.Q. , H.Z. ,X.Z. , H.S. ; data curation, H.S. ; writing—original draft preparation, H.Z. ; writing—review and editing, G.Q. and H.Z. ; supervision, G.Q., C.M. ; project administration, G.Q. ; funding acquisition, G.Q. All authors have read and agreed to the published version of the manuscript.
Data availability
The original contributions presented in the study are included in thearticle. Further inquiries can be directed to the corresponding author.
Declarations
Competing interests
The authors declare no competing interests.
Footnotes
Publisher’s note
Springer Nature remains neutral with regard to jurisdictional claims in published maps and institutional affiliations.
References
- 1.Zhang, R. X. et al. Shadowing effect of an existing tunnel on the evolution of soil arching: impact of tunnel shape. Can. Geotech. J., (2024).
- 2.Shen Leilei. Impact of pipe jacking construction on surface and structure deformation and performance test of drag reduction slurry.2019.
- 3.Ciaran, C. R. & Trevor, L. L. .Orr.Physical modelling of the effect of lubricants in pipejacking. Tunn. Undergr. Space Technol. incorporating Trenchless Technol. Res.63, 44–53 (2017). [Google Scholar]
- 4.Yu Jun, Li, Y. Influence of physical properties of pipe jacking slurry sheath on jacking force. China Civil Eng. J.48 (S2), 327–331 (2015). [Google Scholar]
- 5.J.Yen and K.Shou.Numerical simulation for the estimation the jacking force of pipe jacking.Tunnelling and Underground Space Technology incorporating Trenchless Technology Research,2015,49:218–229.
- 6.Limin, P. E. N. G. et al. Technological development and research status of rectangular pipe jacking method.Tunnel Construction, 35(01): 1–8. (2015).
- 7.Gang, W. E. I., Xinjiang, W. E. I. & Riqing, X. U. Study of soilcompacting effects induced by pipe jacking construction. Rock. Soil. Mech. 2006, 27(05):717–722 .
- 8.Jun, Y. U. LI Yuanhai.Effect of physical properties of mud screen of pipe-jacking on jacking forces. China Civil Eng. J. 2015(S 2):327–331 .
- 9.Omoregie, I. A. et al. Perspective of Hydrodynamics in Microbial-Induced Carbonate Precipitation: A Bibliometric Analysis and Review of Research Evolution.Hydrology,2024,11(5):61 -.
- 10.BOQUET & E,BORONAT A,RAMOS–CORMENZANA A.Production of calcite (calcium carbonate) crystals by soil bacteria is a general phenomenon. Nature24 (6), 527–529 (1973).
- 11.Ahmad, A. M. et al. Synergistic effect of composite bacteria on self-healing process of concrete crack.Case Studies in Construction Materials,2024,20e03028-.
- 12.Fouladi, A. S. et al. Application of Microbially Induced Calcite Precipitation (MICP) technology in construction materials: A comprehensive review of waste stream contributions. Constr. Build. Mater.388, 131546 (2023). [Google Scholar]
- 13.Ahenkorah, I. et al. Cyclic liquefaction resistance of MICP- and EICP-treated sand in simple shear conditions: a benchmarking with the critical state of untreated sand.Acta Geotechnica,2024,(prepublish):1–23 .
- 14.Hang Lei, H. et al. Laboratory Test on Microbially Induced Carbonate Precipitation Combined with Xanthan Gum for Sand Reinforcement [J]. Fly. Ash Compr. Utilization. 35 (6), 29–33 (2021). (in Chinese). [Google Scholar]
- 15.Chittoori, B. C. S. et al. Application of bio-stimulated calcite precipitation to stabilize expansive soils: Field trials[C]//Geo-Congress 2020111–120 (American Society of Civil Engineers, 2020). [Google Scholar]
- 16.Ma, G. et al. Strength and permeability of bentonite-assisted biocemented coarse sand [J]. Can. Geotech. J.58 (7), 969–981 (2021). (in Chinese). [Google Scholar]
- 17.Li, Z. et al. Growth Prediction Model for Bacillus pasteurii in Biospolymer-Based Non-Solid Drilling Fluids with Different pH Values [J]. Drill. Eng.50 (S1), 106–112 (2023). (in Chinese). [Google Scholar]
- 18.Xiang Haotian. Research on the Wall-stabilizing Effect and Mechanism of Microbial Non-solid Drilling Fluids [D]. Chengdu Univ. Technol.10.26986/d.cnki.gcdlc.2021.000836 (2021). .(in Chinese). [Google Scholar]
- 19.Whiffin, V. S. Microbial CaCO3precipitation for the production of biocement [D] (Murdoch University, 2004). [Google Scholar]
- 20.Technical Specification for Rectangular Pipe Jacking Engineering. T/CECS 716–2020 [S] (China Architecture & Building, 2020). [Google Scholar]
- 21.Standard for Soil Test Methods. GB/T50123-2019 (China Planning, 2019). [Google Scholar]
- 22.Dong, Y. et al. Recent progresses in bentonite/lignin or polysaccharide composites for sustainable water treatment. Int. J. Biol. Macromol., : 134747. (2024). [DOI] [PubMed]
- 23.Zhang, S. et al. Evaluation and prediction of swelling properties of bentonite under the action of salt solution. Appl. Clay Sci.258, 107453 (2024). [Google Scholar]
- 24.Muratspahić, E. et al. Micellar aggregation of poly (acrylamide-co-styrene): Towards ‘self-removing’polymers from solution. Reactive Funct. Polym.192, 105732 (2023). [Google Scholar]
- 25.Rahmatpour, A., Alijani, N. & Mirkani, A. Supramolecular self-assembling hydrogel film based on a polymer blend of chitosan/partially hydrolyzed polyacrylamide for removing cationic dye from water. Reactive Funct. Polym.185, 105537 (2023). [Google Scholar]
- 26.Li, W. et al. Synergistic effect of particle size, carboxymethyl starch and Na2CO3 on rheological and filtration property of bentonite-based material. Case Stud. Constr. Mater.21, e03537 (2024). [Google Scholar]
- 27.Lee J,Benson C H,Shackelford C et al. Correlating Index Properties and Hydraulic Conductivity of Geosynthetic Clay Liners. J. Geotech. Geoenvironmental Eng. 2005, 131(11): 1319–1329 .
- 28.Xu, T. et al. A biomass-enhanced bentonite slurry for shield tunnelling in the highly permeable soil. Tunn. Undergr. Space Technol.147, 105744 (2024). [Google Scholar]
- 29.Wever D A Z,Picchioni F,Broekhuis A A.Comblike polyacrylamides as flooding agent in enhanced oil recovery. Industrial Eng. Chem. Res. 201352(46): 16352–16363 .
- 30.Bhat, I. M. et al. Advances in xanthan gum production, modifications and its applications. Biocatal. Agric. Biotechnol.42, 102328 (2022). [Google Scholar]
- 31.Kumar, P. et al. Review on emerging trends and challenges in the modification of xanthan gum for various applications. Carbohydr. Res., : 109070. (2024). [DOI] [PubMed]
- 32.Shu, Y. et al. Enhancing microbial-induced carbonate precipitation (MICP) sand consolidation with alkali-treated jute fibers. Powder Technol.441, 119845 (2024). [Google Scholar]
- 33.Liu, R. X. et al. Principal component regression analysis with SPSS. Comput. Methods Programs Biomed.71 (2), 141–147 (2003). [DOI] [PubMed] [Google Scholar]
- 34.REN Yedong. Study on control mechanism of sand pipe jacking friction. Anhui University of architecture,2021. (in Chinese).
- 35.Qian, Z. H. A. N. G. et al. Advances in soil cementation by biologically induced calcium carbonate precipitation. Rock. Soil. Mech.43 (2), 345–357 (2022). (in Chinese). [Google Scholar]
- 36.Ming-juan, C. U. I. Zheng Jun-jie, Lai Han-jiang. Experimental study on the effect of bacterial liquid injection method on the dynamic characteristics of microbial. Rock. Soil. Mech. 2017, 38(11): 100–105. (in Chinese).
Associated Data
This section collects any data citations, data availability statements, or supplementary materials included in this article.
Data Availability Statement
The original contributions presented in the study are included in thearticle. Further inquiries can be directed to the corresponding author.