

Abstract
This study aims to investigate the relationship between the triglyceride-glucose index (TyG) and all-cause mortality as well as cardiovascular mortality in arthritis patients. Additionally, it seeks to analyze the nonlinear characteristics and threshold effects of TyG index. We included 5,559 adult participants with arthritis from the 1999–2018 National Health and Nutrition Examination Survey (NHANES). The TyG index was calculated using fasting triglycerides and glucose levels. We employed Cox proportional hazards models and restricted cubic spline analyses to examine the relationship between TyG index and all-cause mortality in arthritis patients. Competing risks models were used to analyze the association between TyG index and cardiovascular mortality as well as mortality from other causes. Over a median follow-up period of 7.8 years, 1,388 cases of all-cause mortality were recorded among arthritis patients, including 369 cases of cardiovascular mortality. After adjusting for confounding factors, TyG index was found to be nonlinearly positively associated with all-cause mortality (P = 0.0019), with a significant increase in mortality risk when TyG index ≥ 8.43. Compared to the quartile 2 of TyG index, the highest quartile was associated with a 36% increased risk of all-cause mortality (HR 1.36, 95% CI 1.12–1.65). Additionally, competing risks models indicated that high TyG index levels were significantly associated with increased risks of cardiovascular mortality and mortality from other causes. Subgroup analyses confirmed the robustness of the association between TyG index and cardiovascular mortality in arthritis patients. The TyG index is nonlinearly associated with all-cause mortality and represents a potential prognostic indicator for mortality risk in arthritis patients.
Keywords: Triglyceride-glucose index, Arthritis, All-cause mortality, Cardiovascular mortality, Competing risks, NHANES
Subject terms: Cardiology, Diseases, Endocrinology, Medical research, Risk factors
Introduction
Arthritis is a prevalent chronic condition worldwide, with incidence and prevalence increasing as populations age. The World Health Organization estimates that approximately 350 million people globally are affected by arthritis1. In the United States, arthritis is the leading cause of disability, affecting around 54 million adults, or 22.7% of the population2. The condition not only causes joint pain, swelling, stiffness, and limited mobility but may also lead to mental health issues such as depression and anxiety3. These symptoms significantly impair the quality of life and increase the burden of daily living. Therefore, understanding the comprehensive impact of arthritis on overall health, particularly its associations with all-cause and cardiovascular mortality, is crucial for developing effective management and intervention strategies.
Despite the well-recognized disability effects of arthritis, its impact on all-cause and cardiovascular mortality risk remains contentious. Some studies report a significant increase in all-cause mortality risk among arthritis patients, especially those with comorbid cardiovascular conditions4,5. This may be related to chronic systemic inflammation and persistent cardiovascular dysfunction associated with arthritis6. Inflammatory markers such as C-reactive protein (CRP) and interleukin-6 (IL-6) are elevated in arthritis patients and are associated with increased cardiovascular disease and mortality risk7,8. However, other studies, after controlling for confounding factors, suggest that the direct impact of arthritis on all-cause mortality might be less pronounced9,10. Variations in study findings may arise from limitations in study design, differences in sample characteristics, and inadequate control of confounding factors. Moreover, existing research often focuses on specific types of arthritis, such as rheumatoid arthritis or osteoarthritis. The increased mortality risk in rheumatoid arthritis patients, particularly cardiovascular mortality, is well-established11,12. For osteoarthritis, some studies indicate an association with increased all-cause mortality risk13,14, while others find no significant link10. However, few studies have systematically evaluated the overall risk of all-cause and cardiovascular mortality in arthritis patients, especially when multiple mortality risks are present simultaneously.
The TyG index is a biomarker used to assess insulin resistance, calculated by combining triglyceride levels with fasting blood glucose levels15,16. Recent studies have increasingly explored the relationship between the TyG index and arthritis, noting that key features of metabolic syndrome (e.g., insulin resistance, obesity, hypertriglyceridemia) are related to the onset and progression of arthritis17. Furthermore, Since chronic low-grade inflammation is one of the pathological mechanisms of arthritis, the elevation of the TyG index could represent an enhancement of inflammatory responses. Some studies suggest a correlation between high TyG index and increased risk and severity of arthritis symptoms, such as pain and functional impairment18. However, while preliminary research indicates a potential link between the TyG index and arthritis, its association with all-cause and cardiovascular mortality in arthritis patients remains unclear. Given the high prevalence and broad impact of arthritis, systematically evaluating its relationship with all-cause and cardiovascular mortality holds significant theoretical and practical value.
Therefore, this study utilizes data from the NHANES database to establish proportional hazards and competing risks models to investigate the association between TyG index and cardiovascular mortality risk, as well as competing risks in arthritis patients. Compared to traditional Cox proportional hazards models, competing risks models account for the competitive relationship between different causes of death, providing more precise risk estimates19. This approach will enhance the scientific understanding of the relationship between arthritis and mortality risks, potentially revealing specific pathophysiological mechanisms in arthritis patients, and offer crucial insights for clinical management and public health decisions, ultimately improving patient quality of life and health outcomes20.
Methods and materials
Study population
This study utilized data from the NHANES spanning 1999 to 2018. NHANES, led by the Centers for Disease Control and Prevention (CDC), is a large-scale, complex, random sampling survey designed to assess the health and nutritional status of the U.S. population. The survey covers participants from all 50 states and the District of Columbia, employing a stratified, multistage probability sampling design to ensure sample representativeness. The survey includes household interviews, physical examinations, and laboratory tests. In this study, arthritis was defined based on self-reported arthritis from all participants. This definition follows the question from the NHANES dataset with the variable name “MCQ160a” (SAS Label: “Doctor ever said you had arthritis”). The exact wording of the question is: “Has a doctor or other health professional ever told (you/SP) that (you/s/he) had arthritis?”
Inclusion criteria for this study were:1 adults aged ≥ 18 years;2 availability of complete demographic data and laboratory test results. Exclusion criteria included:1 pregnant women, due to potential physiological and metabolic changes;2 individuals with missing triglyceride (TG) or fasting plasma glucose (FPG) data, as the TyG index could not be calculated. Ultimately, 5,559 adults with osteoarthritis from NHANES 1999–2018 were included, with a median follow-up duration of 7.8 years (Fig. 1).
Fig. 1.

Flow chart for inclusion of participants.
Definition of exposure variables and outcome events
The primary exposure variable is the TyG index, calculated using the formula: ln[TG(mg/dL)×FPG(mg/dL)/2]. The main outcome measures are all-cause mortality and cardiovascular mortality. All-cause mortality is defined as death from any cause, while cardiovascular mortality includes deaths due to cardiovascular diseases, categorized by ICD-10 codes I00-I09 (acute rheumatic fever), I11 (hypertensive heart disease), I13 (hypertensive heart and kidney disease), and I20-I51 (ischemic heart disease, pulmonary heart disease, and other forms of heart disease). Mortality data were obtained from the National Death Index (NDI) database.
Statistical analyses
Participants were divided into quartiles based on the TyG index: Q1 (≤ 8.34), Q2 (8.34–8.74), Q3 (8.74–9.16), and Q4 (≥ 9.16). Differences in baseline characteristics among TyG index quartiles were compared using one-way analysis of variance or chi-square tests. Kaplan-Meier survival curves were plotted to visually present survival across groups, with Log-rank tests employed to compare group differences. Cox proportional hazards models were used to examine the relationship between TyG index and all-cause mortality, calculating hazard ratios (HR) and 95% confidence intervals (CI). Three models were constructed to control for potential confounders:1 unadjusted model;2 model adjusted for age, sex, body mass index (BMI), and race;3 model further adjusted for coronary artery disease (CAD), hypertension, hyperlipidemia, education level, alanine aminotransferase (ALT), aspartate aminotransferase (AST), creatinine (Cr), uric acid (UA), blood urea nitrogen (UN), alcohol consumption, insurance, poverty index, and MET (metabolic equivalent of task in 30 days).
Additionally, restricted cubic spline (RCS) models were used to explore the nonlinear relationship between TyG index and all-cause mortality, with likelihood ratio tests assessing the presence of nonlinear associations. A piecewise linear model was employed to further investigate the threshold effect and inflection point of TyG index on all-cause mortality.
To account for potential competing risks between cardiovascular and other causes of death, Fine and Gray competing risks models were used to evaluate the relationship between TyG index quartiles and cardiovascular as well as non-cardiovascular mortality. This model estimates the cumulative incidence function (CIF) while considering both the event of interest and competing events, providing a more accurate risk assessment. Results from the competing risks model are presented as subdistribution hazard ratios (SHR).
To validate the robustness of the primary findings, a series of subgroup analyses were performed, stratified by sex (male/female), age (20-56 years /57-68 years / 69-85 years), BMI (15.4-26.78 kg/m² / 26.79-32.19 kg/m² / 32.2-84.87 kg/m²), race (Black/Mexican American/White/Other), hypertension (present/absent), coronary artery disease (present/absent), Hyperlipidemia (present/absent), COPD(present/absent), insurance(present/absent), poverty index(0-2.53, 2.54-5.0), MET(0.93-2920, 2921-44640) and smoking status (smoker/non-smoker). Subgroup analyses aim to reveal potential heterogeneity in the effect of TyG index on all-cause mortality across different populations.
Data processing and statistical analyses were conducted using R software version 4.1.0 and EmpowerStats version 4.2. All statistical tests were two-sided, with significance set at P < 0.05.
Results
Characteristics of the study population by TyG index quartiles
The study included 5,559 participants from the NHANES survey spanning 1999 to 2018, comprising 2,296 males (40.31%) and 3,263 females (59.69%). The weighted sample represents 51,487,924 adults in the United States. The median age of participants was 58.66 years (interquartile range: 58.18 ,59.14 years). Following stratification by TyG index quartiles, the groups were as follows: Q1 with 1,390 individuals (25.00%), Q2 with 1,388 individuals (24.97%), Q3 with 1,391 individuals (25.02%), and Q4 with 1,390 individuals (25.01%).
Comparison of baseline characteristics across TyG index quartiles indicated that higher TyG index levels were associated with significant increases in age, BMI, FPG, ALT, AST, UA, and HbA1c (P < 0.05). Additionally, the prevalence of coronary heart disease (CHD), hypertension, diabetes mellitus (DM), and male gender also increased with higher TyG index levels (P < 0.05). Conversely, there were no significant differences in creatinine levels or stroke history among the TyG index quartiles (P > 0.05). Furthermore, individuals with lower educational attainment, African Americans, Mexican Americans, and smokers were more prevalent in higher TyG index quartiles (P < 0.05). These findings suggest that individuals with high TyG index levels generally exhibit poorer cardiovascular metabolic profiles, indicating a potentially higher mortality risk (P < 0.05) (Table 1).
Table 1.
Characteristics of participants in the NHANES (1999–2018) by TyG index quartile.
| Variables | Overall | Q1(≤8.34) | Q2(8.34–8.74) | Q3(8.74–9.16) | Q4(≥9.16) | P-value |
|---|---|---|---|---|---|---|
| Unweighted number, n | 5559 | 1390 | 1388 | 1391 | 1390 | |
| Weighted number, n | 51,487,924 | 12,872,670 | 13,129,212 | 12,680,369 | 12,805,673 | |
| Age | 58.66 (58.18 ,59.14) | 56.49 (55.55 ,57.42) | 59.38 (58.39 ,60.37) | 59.73 (58.91 ,60.56) | 59.05 (58.13 ,59.96) | < 0.0001 |
| BMI | 30.37 (30.11 ,30.64) | 28.26 (27.77 ,28.76) | 29.21 (28.75 ,29.67) | 31.12 (30.55 ,31.69) | 32.94 (32.43 ,33.45) | < 0.0001 |
| Glu | 110.59 (109.52 ,111.67) | 97.33 (96.40 ,98.27) | 102.33 (101.38 ,103.27) | 109.48 (107.96 ,111.00) | 133.51 (129.83 ,137.19) | < 0.0001 |
| Hba1c | 5.79 (5.76 ,5.83) | 5.47 (5.44 ,5.51) | 5.57 (5.54 ,5.61) | 5.76 (5.70 ,5.82) | 6.36 (6.25 ,6.47) | < 0.0001 |
| Cr | 0.90 (0.89 ,0.91) | 0.89 (0.87 ,0.91) | 0.89 (0.87 ,0.90) | 0.89 (0.87 ,0.91) | 0.93 (0.89 ,0.96) | 0.2774 |
| UA | 5.60 (5.55 ,5.65) | 5.07 (4.98 ,5.16) | 5.47 (5.37 ,5.58) | 5.76 (5.67 ,5.86) | 6.10 (6.00 ,6.21) | < 0.0001 |
| Bun | 14.98 (14.79 ,15.18) | 14.34 (13.96 ,14.72) | 14.94 (14.59 ,15.29) | 15.02 (14.59 ,15.45) | 15.64 (15.24 ,16.03) | 0.0001 |
| ALT | 24.56 (24.00, 25.13) | 22.01 (20.94, 23.08) | 22.70 (21.85, 23.55) | 25.56 (24.42, 26.68) | 28.06 (26.62, 29.49) | < 0.001 |
| AST | 25.31 (24.78, 25.84) | 25.11 (24.06, 26.16) | 24.18 (23.51, 24.85) | 25.71 (24.24, 27.18) | 26.26 (25.27, 27.25) | 0.0051 |
| CHD | 0.0016 | |||||
| No | 5106 (92.81) | 1307(94.50 ) | 1289(94.05 ) | 1275(92.50) | 1235( 90.15) | |
| Yes | 453(7.19) | 83(5.50 ) | 99( 5.95 ) | 116(7.50 ) | 155(9.85) | |
| Hypertension, n (%) | < 0.0001 | |||||
| No | 2052(42.37) | 632(55.51 ) | 565(44.66) | 469(39.18) | 386(29.99) | |
| Yes | 3507(57.63) | 758(44.49) | 823(55.34 ) | 922(60.82) | 1004(70.01) | |
| Hyperlipidemia, n (%) | < 0.0001 | |||||
| No | 927(16.87) | 495(37.28) | 303(20.95) | 110(7.58) | 19(1.39 ) | |
| Yes | 4632 (83.13) | 895(62.72) | 1085(79.05) | 1281(92.42) | 1371(98.61) | |
| Stroke, n (%) | 0.8222 | |||||
| No | 5142(93.73) | 1283(93.80 ) | 1293(94.14 ) | 1292(93.81) | 1274(93.17) | |
| Yes | 417(6.27) | 107(6.20 ) | 95(5.86 ) | 99(6.19) | 116( 6.83) | |
| Sex, n (%) | 0.0002 | |||||
| Female | 3263(59.69) | 875(65.54 ) | 816(60.89) | 801(57.36) | 771( 54.89) | |
| Male | 2296(40.31) | 515(34.46) | 572(39.11) | 590(42.64 ) | 619(45.11 ) | |
| Race, n(%) | < 0.0001 | |||||
| Black | 1074(9.69) | 478(17.97) | 261(8.87 ) | 189(6.75 ) | 146(5.13 ) | |
| Mexican | 695(4.17) | 100(2.84 ) | 161(4.11) | 204( 4.78) | 230( 4.95 ) | |
| Other | 731(8.77) | 159( 8.04) | 186(8.69) | 206( 9.76) | 180( 8.59 ) | |
| White | 3059(77.37) | 653(71.15) | 780(78.33) | 792(78.71) | 834(81.33) | |
| Edu, n (%) | < 0.0001 | |||||
| College graduate | 984(17.70) | 318(29.61) | 252(18.16) | 243(20.83 ) | 171(16.23 ) | |
| Some college | 1564(28.13) | 391(28.45) | 402(28.96 ) | 393(31.92) | 378(31.65 ) | |
| Less than 9th grade | 784(14.10) | 131( 5.09 ) | 189(13.62) | 220(7.78) | 244(9.29) | |
| High school graduate | 1364(24.54) | 335(23.98) | 358(25.80) | 319(25.93) | 352(27.86) | |
| Some high school | 863(15.52) | 215(12.87 ) | 187(13.47) | 216(13.55) | 245(14.98) | |
| Mortstat, n (%) | < 0.0001 | |||||
| Alive | 4171 (80.69) | 1124(85.53 ) | 1044(81.81 ) | 1028(80.36) | 975(75.01) | |
| Deceased | 1388 (19.31) | 266(14.47) | 344(18.19 ) | 363(19.64) | 415(24.99) | |
| Alcohol.user, n (%) | 0.0009 | |||||
| Never | 835(11.79) | 194(10.56) | 202(12.05 ) | 224(11.82) | 215(12.72) | |
| Former | 1318(20.42) | 299( 18.21) | 307(17.61 ) | 340(21.89) | 372( 24.08) | |
| Moderate | 2007(39.78) | 507(39.30) | 542(42.53) | 502(40.31 ) | 456(36.95) | |
| Mild | 699(14.55) | 217(18.69) | 182(15.10 ) | 147(11.79) | 153(12.57) | |
| Heavy | 700(13.45) | 173(13.25) | 155(12.71) | 178(14.20) | 194(13.69) | |
| DM, n (%) | < 0.0001 | |||||
| No | 2884(57.36) | 1019(78.37) | 837(66.34) | 630(51.93) | 398(32.42) | |
| Yes | 2675(42.64) | 371(21.63) | 551(33.66) | 761(48.07) | 992(67.58) | |
| Poverty index | 2.75 (2.69 ,2.81) | 2.79 (2.71 ,2.87) | 2.82 (2.74 ,2.91) | 2.73 (2.62 ,2.84) | 2.66 (2.55 ,2.76) | 0.0661 |
| MET | 2970.85 (2809.81 ,3131.89) | 3131.02 (2822.00 ,3440.03) | 2967.04 (2719.13 ,3214.96) | 2915.34 (2560.27 ,3270.42) | 2868.72 (2582.26 ,3155.17) | 0.6469 |
| COPD, n (%) | ||||||
| No | 5081 (91.29) | 1274(90.83) | 1261(90.63) | 1272(90.74) | 1274(92.96) | 0.2305 |
| yes | 478 (8.71) | 116(9.17 ) | 127(9.37) | 119 (9.26) | 116 (7.04) | |
| Insurance, n (%) | 0.8486 | |||||
| no | 5001(91.30) | 1246 (90.91) | 1269 (91.15) | 1260 (92.05) | 1226(91.09) | |
| yes | 558(8.70) | 144(9.09) | 119,(8.85) | 131 (7.95) | 164(8.91) | |
| Smoking, n (%) | 0.0137 | |||||
| no | 2537(44.23 ) | 682 (46.80 ) | 674(47.70) | 611 (41.43 ) | 570( 40.87 ) | |
| yes | 3022(55.77 ) | 708( 53.20 ) | 714 (52.30) | 780 (58.57) | 820 (59.13) |
Continuous variables are expressed in Median (Q1, Q3) and categorical variables are expressed in n (%).
BMI body mass index, FBG fasting blood glucose, HbA1c glycated hemoglobin, Cr creatinine, UA uric acid, BUN blood urea nitrogen, CHD coronary heart disease, EDU education level, Mortstat: Mortality Status (Alive/Deceased), DM diabetes mellitus, UCOD underlying cause of death, COPD chronic obstructive pulmonary disease, MET metabolic equivalent of task in 30 days.
Survival analysis by TyG index quartiles
To assess the mortality risk associated with different TyG index levels among arthritis patients, we conducted a Kaplan-Meier survival analysis based on TyG index quartiles. The survival curves for higher TyG index groups were significantly lower than those for lower TyG index groups (Log-rank P < 0.01), indicating a strong association between elevated TyG index levels and reduced survival rates (Fig. 2A).
Fig. 2.

Kaplan-Meier cumulative risk curve for cardiac events. (all-cause mortality)
Restricted mean survival time (RMST) analysis
Restricted Mean Survival Time (RMST) analysis was conducted by dividing the participants into two groups based on the TyG index: Group 0 (Q1 + Q2) and Group 1 (Q3 + Q4). In the RMST analysis, Group 1 (arm = 1) had an RMST of 182.937 months (95% CI: 179.395-186.478) and an RMTL of 65.063 months (95% CI: 61.522–68.605). Group 0 (arm = 0) exhibited an RMST of 190.905 months (95% CI: 187.182-194.628) and an RMTL of 57.095 months (95% CI: 53.372–60.818) (Table 2; Fig. 2B). Between group comparison revealed an RMST difference of -7.968 months (p = 0.0024), with an RMST ratio of 0.958 (p = 0.0024). The RMTL ratio was 1.140 (p = 0.0026), indicating that the high TyG index group had a significantly shorter average survival time by 7.968 months compared to the low TyG index group (Table 3).
Table 2.
Restricted mean survival time (RMST) analysis.
| Group | RMST | SE | 95%CI | RMTL | SE | 95%CI |
|---|---|---|---|---|---|---|
| arm = 1 | 182.937 | 1.807 | 179.395-186.478 | 65.063 | 1.807 | 61.522–68.605 |
| arm = 0 | 190.905 | 1.900 | 187.182-194.628 | 57.095 | 1.900 | 53.372–60.818 |
Unadjusted RMST (restricted mean survival time) and RMTL (restricted mean time lost).
Table 3.
RMST (restricted mean survival time) and RMTL (restricted mean time lost) between group comparison.
| Est. | lower 0.95 | p | |
|---|---|---|---|
| RMST (arm = 1)-(arm = 0) | -7.968 | -13.107–2.830 | 0.0024 |
| RMST (arm = 1)/(arm = 0) | 0.958 | 0.932–0.985 | 0.0024 |
| RMTL (arm = 1)/(arm = 0) | 1.140 | 1.047–1.241 | 0.0026 |
Restricted to time point (tau=) 248.
arm = 1 refer to TyG indexQ3 + Q4.
arm = 0 refer to TyG indexQ1 + Q2.
Correlation between TyG index and outcome events
The association between TyG index and all-cause mortality was evaluated using Cox proportional hazards models. In the unadjusted model, each unit increase in the TyG index was associated with a 27% increase in all-cause mortality risk (HR 1.27, 95% CI 1.14–1.42, P < 0.0001). Quartile analysis revealed that compared to Q2 as the reference group, Q4 showed a significantly higher risk of all-cause mortality, with a 32% increase (HR 1.32, 95% CI 1.07–1.63, P = 0.0089). After adjusting for age, sex, BMI, and race in Model I, the association remained robust, with each unit increase in the TyG index linked to a 25% higher mortality risk (HR 1.25, 95% CI 1.12–1.41, P < 0.0001), and Q4 displaying a 43% higher risk compared to Q2 (HR 1.43, 95% CI 1.18–1.73, P = 0.0003). Further adjustments in Model II for additional covariates, including CHD, hypertension, hyperlipidemia, education level, AST, ALT, Cr, UA, smoking, alcohol use, and metabolic equivalents, showed that each unit increase in the TyG index was associated with a 19% increase in mortality risk (HR 1.19, 95% CI 1.06–1.34, P = 0.0041), while Q4 demonstrated a 36% higher risk compared to Q2 (HR 1.36, 95% CI 1.12–1.65, P = 0.0019). This indicates that the relationship between TyG index and all-cause mortality persists independently of traditional cardiovascular risk factors (Table 4). Multicollinearity among the adjusted variables was assessed using variance inflation factors (VIF). All VIF values were below 5, indicating weak multicollinearity. Therefore, multicollinearity is unlikely to pose a significant issue in the regression analysis, and the model’s integrity remains unaffected (Table 5).
Table 4.
The COX regression analysis between TyG index and all-cause mortality.
| Exposure | Non-adjusted | Adjust I | Adjust II | |||
|---|---|---|---|---|---|---|
| HR (95%CI) | P | HR (95%CI) | P | HR (95%CI) | P | |
| All-cause mortality | ||||||
| Tyg | 1.2726 (1.1426, 1.4173) | < 0.0001* | 1.2549 (1.1199, 1.4061) | < 0.0001* | 1.1923 (1.0574, 1.3443) | 0.0041* |
| Tyg quartile | ||||||
| Q1 | 0.8748 (0.6946, 1.1018) | 0.2558 | 1.1018 (0.9133, 1.3292) | 0.31111 | 1.0914 (0.9062, 1.3145) | 0.3566 |
| Q2 | Ref | Ref | Ref | Ref | Ref | Ref |
| Q3 | 1.0431 (0.8570, 1.2696) | 0.6737 | 1.0671 (0.8728, 1.3046) | 0.5264 | 1.0170 (0.8202, 1.2612) | 0.8777 |
| Q4 | 1.3222 (1.0725, 1.6299) | 0.0089* | 1.4288 (1.1778, 1.7333) | 0.0003* | 1.3593 (1.1202, 1.6494) | 0.0019* |
| TyGindex for trend | 1.1411 (1.0683, 1.2188) | < 0.0001* | 1.1068 (1.0368, 1.1816) | 0.0023* | 1.0791 (1.0046, 1.1591) | 0.0369* |
Non-Adjusted Model: No adjustments made.
Adjusted Model I: Adjusted for Age, Sex, BMI, and Race.
Adjusted Model II: Adjusted for Age, Sex, BMI, Race, CHD, Hypertension, Hyperlipidemia, EDU, ALT, AST, Cr, UA, Alcohol User, BUN, Smoking, COPD, Insurance, Poverty index, and MET.
BMI body mass index, Race ethnicity, CHD coronary heart disease, EDU education level, ALT alanine transaminase, AST aspartate transaminase, Cr creatinine, UA uric acid, BUN blood urea nitrogen, chronic obstructive pulmonary disease.
*P < 0.05.
Table 5.
Variance inflation factor.
| Variable | VIF | Variable | VIF |
|---|---|---|---|
| TyG index | 1.3 | AST | 2.4 |
| Age | 1.6 | CR | 1.5 |
| Sex | 1.3 | UA | 1.4 |
| Race | 1.1 | Alcohol user | 1.2 |
| BMI | 1.2 | Smoking | 1.2 |
| CHD | 1.1 | Bun | 1.7 |
| Hypertension | 1.2 | COPD | 1 |
| Hyperlipidemia | 1.2 | Insurance | 1.1 |
| Education | 1.1 | Poverty index | 1.1 |
| ALT | 2.5 | MET | 1 |
VIF variance inflation factors.
Threshold effect analysis for three follow-up endpoints
To explore the non-linear relationship between TyG index and all-cause mortality, we plotted RCS curves. The results suggested that the relationship between TyG index and all-cause mortality is best described by a non-linear model (likelihood ratio test P = 0.001) (Fig. 3). After adjusting for all covariates, the piecewise linear model further revealed a non-linear association with a threshold effect. Specifically, when TyG index < 8.43, each unit increase in TyG index was associated with a 34% decrease in all-cause mortality risk; however, when TyG index ≥ 8.43, each unit increase was associated with a 28% increase in all-cause mortality risk. This threshold effect is positioned between Q1 and Q2, suggesting that maintaining TyG index at lower levels may help reduce mortality risk (Table 6).
Fig. 3.
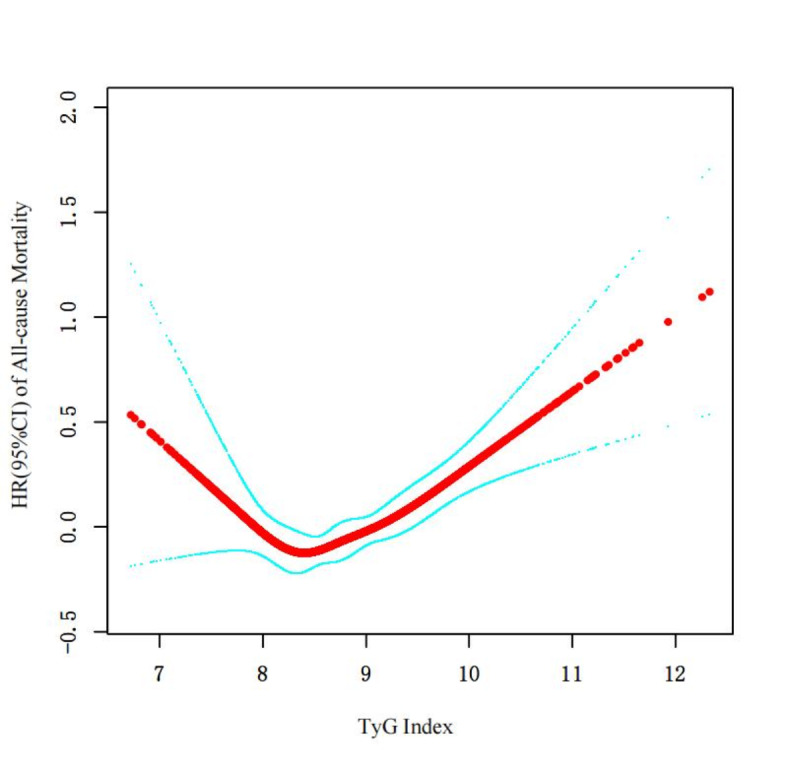
Restricted cubic spline curve for TyG index hazard ratio.
Table 6.
Threshold effect analysis of all-cause mortality.
| Standard linear regression model | All-cause mortality | |
|---|---|---|
| β/OR (95%CI) | P | |
| Two-stage regression models | 1.16 (1.05, 1.28) | 0.0050 |
| Inflection point (k) | 8.43 | |
| < k | 0.66 (0.47, 0.93) | 0.0163 |
| > k | 1.28 (1.14, 1.44) | < 0.001 |
| Log-likelihood ratio test | 0.001 |
Model adjust for: Age; SEX; BMI; Race; CHD; Hypertension; Hyperlipidemia; EDU; ALT; AST; CR; UA; Alcohol user; BUN; Smoking; COPD; Insurance; Poverty index; and MET.
BMI body mass index, Race ethnicity, CHD coronary heart disease, EDU education level, ALT alanine transaminase, AST aspartate transaminase, Cr creatinine, UA uric acid, BUN blood urea nitrogen, chronic obstructive pulmonary disease.
Competitive risk analysis
Considering the impact of competing risks for cardiovascular and other causes of death, we performed a competitive risk model analysis. The results indicated that TyG index levels were positively correlated with both cardiovascular and other causes of death. Compared to the Q1 group, cardiovascular mortality risk increased by 42%, 50%, and 62% for the Q2, Q3, and Q4 groups, respectively, while the risk of death from other causes increased by 34%, 45%, and 75%, respectively, independent of cardiovascular mortality (Table 7) (Fig. 4).
Table 7.
Subdistribution hazard ratios (HR) and 95% confidence intervals (CI) for the association between triglyceride-glucose index (TyG) quartiles and cause-specific mortality using Fine & Gray competing risk models.
| TyG index quartiles | Other causes of mortality | Cardiovascular mortality | ||
|---|---|---|---|---|
|
Subdistribution HR (95% CI) |
P |
Subdistribution HR (95% CI) |
P | |
| Q1 | Reference | Reference | ||
| Q2 | 1.338 (1.093, 1.638) | 0.0047 | 1.421 (1.029, 1.963) | 0.0331 |
| Q3 | 1.452 (1.184, 1.782) | 0.0003 | 1.498 (1.095, 2.050) | 0.0115 |
| Q4 | 1.754 (1.450, 2.120) | < 0.0001 | 1.618 (1.184, 2.210) | 0.0025 |
HR hazard ratio, CI confidence interval, TyG index triglyceride-glucose index, Q1 the first quartile of TyG index, Q2 the second quartile of TyG index, Q3 the third quartile of TyG index, Q4 the fourth quartile of TyG index.
Fig. 4.
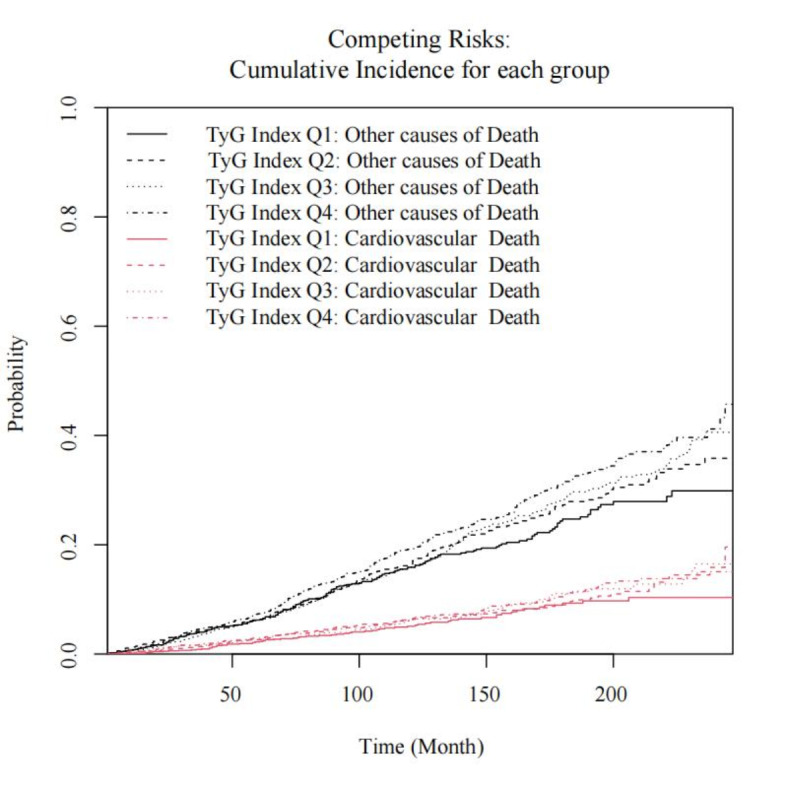
Cumulative incidence of cardiovascular mortality and other causes of mortality by quartiles of the TyG index.
Subgroup analysis
Subgroup analyses demonstrated that elevated TyG index levels were significantly associated with an increased risk of all-cause mortality across most subgroups, showing consistent trends. These findings support the feasibility of using TyG index as a predictor of mortality risk (Fig. 5).
Fig. 5.
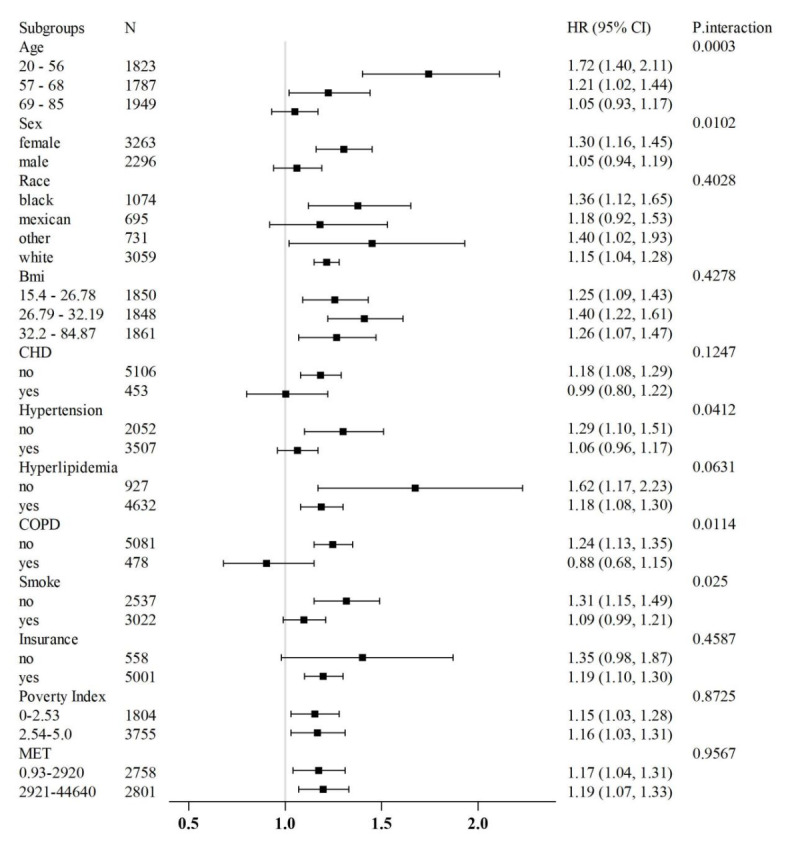
Subgroup analysis of outcomes from all-cause mortality.
Discussion
This study utilized data from the NHANES 1999–2018 to systematically evaluate the relationship between the TyG index and all-cause and cardiovascular mortality among U.S. adults with arthritis. Our findings indicate a nonlinear positive correlation between TyG index and all-cause mortality in this population, with a threshold effect observed at TyG index ≥ 8.43, beyond which mortality risk significantly increases. Additionally, analysis using the competing risks model revealed that TyG index Q4 and Q1 levels were associated with markedly increased risks of cardiovascular and other cause mortality compared to Q2 levels. Subgroup analyses corroborated these findings, demonstrating their consistency across various populations. Overall, this study underscores the potential of TyG index as a simple and practical indicator for predicting mortality risk in arthritis patients.
The TyG index has been shown to correlate highly with the hyperinsulinemic-euglycemic clamp test and is thus considered an alternative measure of insulin resistance15. Extensive epidemiological evidence links insulin resistance with various chronic conditions such as cardiovascular disease, stroke, type 2 diabetes, chronic kidney disease, and non-alcoholic fatty liver disease, all of which are associated with premature mortality21–24. Furthermore, insulin resistance may contribute to cardiovascular damage through mechanisms such as accelerated atherosclerosis, endothelial dysfunction, and increased thrombosis risk, thus heightening cardiovascular event and sudden death risks25. Therefore, insulin resistance might serve as a bridge linking TyG index with increased mortality risk in arthritis patients.
In addition to insulin resistance, the TyG index incorporates TG and FPG, both of which are critical indicators of glucose and lipid metabolism. High TG levels and elevated FPG are established independent risk factors for cardiovascular disease and mortality26,27. Elevated TG can disrupt apoprotein metabolism, leading to increased small dense LDL-C and decreased HDL-C, thus accelerating atherosclerosis. High TG levels also promote inflammation by activating monocytes and endothelial cells, which release pro-inflammatory mediators. Similarly, long-term high blood glucose can induce oxidative stress and advanced glycation end-products (AGEs), damaging endothelial cells and fostering cardiovascular disease26. Consequently, TG and FPG metabolic abnormalities might also contribute to the increased mortality risk associated with higher TyG index levels. Indeed, baseline comparisons between different TyG index groups in our study support this hypothesis, indicating poorer metabolic profiles in the high TyG index group.
The correlation between TyG index and all-cause and cardiovascular mortality observed in this study aligns with previous research. Wang et al. found that the TyG index had an AUC of 0.791 for predicting cardiovascular risk in rheumatoid arthritis patients, with sensitivity analyses confirming the association between arthritis-related markers and cardiovascular risk28. Wei et al. demonstrated in a 20-year follow-up of 4,097 Chinese individuals without cardiovascular disease that each 10-unit increase in TyG-BMI was associated with a 3% increase in all-cause mortality risk and a 5% increase in cardiovascular mortality risk29. Furthermore, Zhang et al. reported that in 1613 male rheumatoid arthritis patients, the risk of major adverse cardiovascular events (MACE) in the highest TyG index quartile was 2.7 times that of the lowest quartile30. These studies, sharing similarities with our findings, suggest that the association between TyG index and adverse outcomes might be stable across different populations.
After adjusting for multiple covariates, our study demonstrated that the all-cause mortality risk in the Q4 was significantly higher compared to the Q2. In contrast, no statistically significant associations were observed for the Q1 and Q3. These findings suggest a strong association between the TyG index in the highest quartile and all-cause mortality in patients with OA. The absence of significant association in Q3 implies a potential threshold effect, where mortality risk becomes markedly elevated only when the TyG index reaches a certain level, as seen in the Q4 group. Furthermore, a gradient effect suggests that even lower levels of the TyG index may contribute to a progressive increase in mortality risk, likely reflecting the worsening of metabolic health. A recent study reported that the average TyG index among individuals aged 60 years and older in the United States was 8.75 ± 0.01, which aligns with the levels observed in Q2 and Q3 of our study. Based on this finding, maintaining the TyG index around 8.75 may provide the greatest benefit for patients31. Although the results for Q1 did not achieve statistical significance, the nonlinear trend of the TyG index derived from the RCS analysis highlights the importance of targeted interventions for individuals in Q1 and Q4. Specifically, maintaining the TyG index within the optimal range of Q2 and Q3 appears to be more beneficial than pursuing the lowest possible levels. This underscores the potential of individualized management strategies to improve outcomes. Therefore, healthcare providers should consider closer monitoring of patients with TyG index in the Q1 and Q4.
Competing risks are a common issue in survival analysis, particularly when studying irreversible events such as death. Traditional Kaplan-Meier methods and Cox regression models assume that censored individuals will eventually experience the event of interest if followed long enough, ignoring the risk of competing events occurring first. The Fine and Gray model addresses this by CIFs, which consider the impact of competing events on the probability of the event of interest, thus improving risk estimation accuracy. Our study, which examined the relationship between TyG index and cardiovascular mortality, accounted for the competing risk of death from other causes, showing that TyG index levels were positively correlated with both cardiovascular and other cause mortality, with a notable dose-response trend. This suggests that elevated TyG index not only increases cardiovascular mortality risk but may also advance other diseases leading to death. Given the significant contribution of cardiovascular and other chronic diseases to overall mortality, enhanced monitoring and management of TyG index as a simple indicator could have substantial public health implications.
Subgroup analysis revealed that elderly patients and those with chronic conditions exhibited a lower risk of all-cause mortality compared to younger patients and those without chronic diseases. This finding contrasts with existing literature, where advanced age and chronic conditions are typically associated with higher mortality risk. Furthermore, in this study, younger age, male sex, coronary heart disease, hypertension, hyperlipidemia, and COPD were identified as protective factors, which deviates from conventional clinical understanding. Several potential explanations for these unexpected findings are considered below. Firstly, this study may have been subject to survivor bias. Elderly and chronically ill patients in the cohort may represent a group of “survivors” who, despite having high-risk factors such as advanced age and chronic disease, have lived longer due to effective medical management and lifestyle interventions. These individuals likely possess relatively stable health and are better able to withstand mortality risks. Consequently, this survivor effect may lead to lower observed mortality rates among these higher-risk populations. Secondly, patients with chronic conditions such as coronary heart disease, hypertension, and hyperlipidemia often receive regular pharmacological treatment and closer medical monitoring. Such interventions may significantly reduce their mortality risk. For instance, the use of statins, antihypertensive drugs, and other metabolic therapies can lower the risk of complications from cardiovascular disease, thereby improving patient survival. In contrast, younger individuals without diagnosed chronic conditions may pay less attention to regular health management, potentially overlooking early signs of health issues or lacking timely intervention, which may lead to an underestimation of their actual mortality risk. Additionally, patients with chronic diseases are more likely to undergo frequent health check-ups and medical follow-ups, enabling the early detection and management of underlying health problems. This proactive approach may reduce their overall mortality risk through earlier intervention. By comparison, younger or undiagnosed patients might not engage in regular health screenings, increasing the likelihood that latent health risks go undetected, ultimately contributing to higher all-cause mortality in these groups. Finally, despite adjusting for several covariates, the possibility of residual confounding cannot be entirely excluded. Uncontrolled factors may still have influenced the results, leading to these unexpected associations. Furthermore, patients with chronic conditions, such as coronary heart disease, hypertension, hyperlipidemia, and COPD, may have already benefitted from metabolic management strategies that lowered their TyG index, thereby reducing their associated mortality risk. These patients’ metabolic states may be better controlled, resulting in lower TyG index values and consequently lower all-cause mortality. Conversely, in younger or non-chronic disease patients, elevated TyG index levels may have gone undetected or unmanaged, leading to the progression of metabolic disorders and a corresponding increase in mortality risk. These factors may help explain the unique findings observed in this study. However, further research is necessary to fully elucidate this phenomenon and to explore its broader implications.
In summary, this study reveals a nonlinear correlation between TyG index and all-cause mortality in U.S. adults with arthritis, with a significant threshold effect. Additionally, TyG index is independently associated with increased risks of cardiovascular and other cause mortality. These findings highlight the potential value of TyG index as a convenient and cost-effective tool for mortality risk assessment and stratification in arthritis patients. Future research should further explore the underlying mechanisms linking TyG index with mortality and conduct prospective studies and randomized controlled trials to establish TyG index’s role in clinical and public health practice. Emphasizing TyG index monitoring in chronic disease management strategies for arthritis patients with comorbid diabetes and cardiovascular conditions could facilitate early identification of high-risk individuals and enable targeted lifestyle and pharmacological interventions to minimize mortality risk and improve population outcomes.
Limitations
Despite the advantages of this study, several limitations should be noted. First, being a retrospective cohort study based on the NHANES database, it can only identify correlations between the TyG index and mortality, rather than establish causation. While the study controlled for numerous confounding factors, residual confounding cannot be completely ruled out. Second, both TyG index and covariates were measured only at baseline, which does not capture the dynamic changes in these factors during follow-up and may lead to an underestimation of the actual association strength. Third, the study lacks an exploration of the underlying mechanisms linking TyG index with mortality, thereby limiting the interpretability of the results. Additionally, the NHANES dataset lacks information on some critical confounders, such as family history and medication use, which could impact the accuracy of the findings. Finally, the study population is primarily composed of U.S. adults, and the generalizability of the results to other populations remains uncertain.
Abbreviations
- TyG index
Triglyceride-glucose index
- NHANES
National health and nutrition examination survey
- CRP
C-reactive protein
- IL-6
Interleukin-6
- CDC
The centers for disease control and prevention
- TG
Triglyceride
- FPG
Fasting plasma glucose
- HR
Hazard ratios
- CI
Confidence intervals
- BMI
Body mass index
- CAD
Coronary artery disease
- ALT
Alanine aminotransferase
- AST
Aspartate aminotransferase
- Cr
Creatinine
- UA
Uric acid
- UN
Blood urea nitrogen
- RCS
Restricted cubic spline
- CIF
The cumulative incidence function
- SHR
Subdistribution hazard ratios
- AGEs
Advanced glycation end-products
- MACE
Major adverse cardiovascular events
Author contributions
JX H: Conceived and designed the study, conducted the data analysis, and wrote the manuscript. DG C: Contributed to the study design, performed statistical analysis, and revised the manuscript for important intellectual content. DC W: Assisted in data collection, interpreted the results, and provided critical revisions to the manuscript. FL R: Provided expertise in Orthopedic, contributed to the discussion of results, and reviewed the final manuscript. RD T: Managed the project, coordinated between authors, and contributed to the writing and editing of the manuscript.
Data availability
The data generated in this study are available upon request from the corresponding author.
Declarations
Competing interests
The authors declare no competing interests.
Footnotes
Publisher’s note
Springer Nature remains neutral with regard to jurisdictional claims in published maps and institutional affiliations.
References
- 1.Ladang, A. et al. Biochemical Markers of Musculoskeletal Health and Aging to be assessed in clinical trials of drugs aiming at the treatment of Sarcopenia: Consensus Paper from an Expert Group Meeting Organized by the European Society for Clinical and Economic Aspects of Osteoporosis, Osteoarthritis and Musculoskeletal diseases (ESCEO) and the Centre Académique De Recherche et d’Expérimentation en Santé (CARES SPRL), under the auspices of the World Health Organization Collaborating Center for the Epidemiology of Musculoskeletal Conditions and Aging. Calcif Tissue Int.112 (2), 197–217 (2023). [DOI] [PMC free article] [PubMed] [Google Scholar]
- 2.Frieden, T. R. A. & Safer, Healthier, U. S. The Centers for Disease Control and Prevention, 2009–2016. Am. J. Prev. Med.52 (3), 263–275 (2017). [DOI] [PubMed] [Google Scholar]
- 3.Matcham, F., Rayner, L., Steer, S. & Hotopf, M. The prevalence of depression in rheumatoid arthritis: a systematic review and meta-analysis. Rheumatol. (Oxford). 52 (12), 2136–2148 (2013). [DOI] [PMC free article] [PubMed] [Google Scholar]
- 4.Sokka, T., Abelson, B. & Pincus, T. Mortality in rheumatoid arthritis: 2008 update. Clin. Exp. Rheumatol.26 (5 Suppl 51), S35–61 (2008). [PubMed] [Google Scholar]
- 5.Meune, C., Touzé, E., Trinquart, L. & Allanore, Y. Trends in cardiovascular mortality in patients with rheumatoid arthritis over 50 years: a systematic review and meta-analysis of cohort studies. Rheumatol. (Oxford). 48 (10), 1309–1313 (2009). [DOI] [PubMed] [Google Scholar]
- 6.Sattar, N. & McInnes, I. B. Vascular comorbidity in rheumatoid arthritis: potential mechanisms and solutions. Curr. Opin. Rheumatol.17 (3), 286–292 (2005). [DOI] [PubMed] [Google Scholar]
- 7.Kaptoge, S. et al. C-reactive protein concentration and risk of coronary heart disease, stroke, and mortality: an individual participant meta-analysis. Lancet375 (9709), 132–140 (2010). [DOI] [PMC free article] [PubMed] [Google Scholar]
- 8.Sarwar, N. et al. Interleukin-6 receptor pathways in coronary heart disease: a collaborative meta-analysis of 82 studies. Lancet379 (9822), 1205–1213 (2012). [DOI] [PMC free article] [PubMed] [Google Scholar]
- 9.van den Hoek, J. et al. Mortality in patients with rheumatoid arthritis: a 15-year prospective cohort study. Rheumatol. Int.37 (4), 487–493 (2017). [DOI] [PMC free article] [PubMed] [Google Scholar]
- 10.Veronese, N. et al. Osteoarthritis and mortality: a prospective cohort study and systematic review with meta-analysis. Semin Arthritis Rheum.46 (2), 160–167 (2016). [DOI] [PubMed] [Google Scholar]
- 11.Aviña-Zubieta, J. A. et al. Risk of cardiovascular mortality in patients with rheumatoid arthritis: a meta-analysis of observational studies. Arthritis Rheum.59 (12), 1690–1697 (2008). [DOI] [PubMed] [Google Scholar]
- 12.Ogdie, A. et al. Risk of major cardiovascular events in patients with psoriatic arthritis, psoriasis and rheumatoid arthritis: a population-based cohort study. Ann. Rheum. Dis.74 (2), 326–332 (2015). [DOI] [PMC free article] [PubMed] [Google Scholar]
- 13.Radojčić, M. R. et al. Specific body mass index trajectories were related to musculoskeletal pain and mortality: 19-year follow-up cohort. J. Clin. Epidemiol.141, 54–63 (2022). [DOI] [PMC free article] [PubMed] [Google Scholar]
- 14.Jakiela, J. T. et al. The Association of Stair climbing behaviors with hazard of all-cause mortality in adults with or at risk of knee osteoarthritis. J. Rheumatol.51 (4), 408–414 (2024). [DOI] [PMC free article] [PubMed] [Google Scholar]
- 15.Tahapary, D. L. et al. Challenges in the diagnosis of insulin resistance: focusing on the role of HOMA-IR and Tryglyceride/glucose index. Diabetes Metab. Syndr.16 (8), 102581 (2022). [DOI] [PubMed] [Google Scholar]
- 16.Son, D. H., Lee, H. S., Lee, Y. J., Lee, J. H. & Han, J. H. Comparison of triglyceride-glucose index and HOMA-IR for predicting prevalence and incidence of metabolic syndrome. Nutr. Metab. Cardiovasc. Dis.32 (3), 596–604 (2022). [DOI] [PubMed] [Google Scholar]
- 17.Huang, J. et al. Association between higher triglyceride glucose index and increased risk of osteoarthritis: data from NHANES 2015–2020. BMC Public. Health. 24 (1), 758 (2024). [DOI] [PMC free article] [PubMed] [Google Scholar]
- 18.Saadon, S. R. & Allwsh, T. A. Lipocalin-2 as a marker of inflammation, bone density, and triglyceride-glucose index for new-onset arthritis patients in Mosul, Iraq. Qatar Med. J.2024 (3), 23 (2024). [DOI] [PMC free article] [PubMed] [Google Scholar]
- 19.Austin, P. C., Latouche, A. & Fine, J. P. A review of the use of time-varying covariates in the Fine-Gray subdistribution hazard competing risk regression model. Stat. Med.39 (2), 103–113 (2020). [DOI] [PMC free article] [PubMed] [Google Scholar]
- 20.Rudnicka, E. et al. The World Health Organization (WHO) approach to healthy ageing. Maturitas139, 6–11 (2020). [DOI] [PMC free article] [PubMed] [Google Scholar]
- 21.Dang, K. et al. The association between triglyceride-glucose index and its combination with obesity indicators and cardiovascular disease: NHANES 2003–2018. Cardiovasc. Diabetol.23 (1), 8 (2024). [DOI] [PMC free article] [PubMed] [Google Scholar]
- 22.Huo, R. R., Liao, Q., Zhai, L., You, X. M. & Zuo, Y. L. Interacting and joint effects of triglyceride-glucose index (TyG) and body mass index on stroke risk and the mediating role of TyG in middle-aged and older Chinese adults: a nationwide prospective cohort study. Cardiovasc. Diabetol.23 (1), 30 (2024). [DOI] [PMC free article] [PubMed] [Google Scholar]
- 23.Chen, Y. et al. Triglyceride-glucose index and prognosis in individuals afflicted with heart failure and chronic kidney disease. ESC Heart Fail. 11(5):3120–3132 (2024). [DOI] [PMC free article] [PubMed]
- 24.Chen, Q. et al. Association between triglyceride-glucose related indices and mortality among individuals with non-alcoholic fatty liver disease or metabolic dysfunction-associated steatotic liver disease. Cardiovasc. Diabetol.23 (1), 232 (2024). [DOI] [PMC free article] [PubMed] [Google Scholar]
- 25.Ramdas Nayak, V. K., Satheesh, P., Shenoy, M. T. & Kalra, S. Triglyceride glucose (TyG) index: a surrogate biomarker of insulin resistance. J. Pak Med. Assoc.72 (5), 986–988 (2022). [DOI] [PubMed] [Google Scholar]
- 26.Nordestgaard, B. G. & Varbo, A. Triglycerides and cardiovascular disease. Lancet384 (9943), 626–635 (2014). [DOI] [PubMed] [Google Scholar]
- 27.Laakso, M. Hyperglycemia and cardiovascular disease in type 2 diabetes. Diabetes48 (5), 937–942 (1999). [DOI] [PubMed] [Google Scholar]
- 28.Wang, Z. et al. Predictive value of the TyG index and rheumatoid factor for cardiovascular disease risk in a rheumatoid arthritis population: data from a survey of 418 patients. Lipids Health Dis.21 (1), 122 (2022). [DOI] [PMC free article] [PubMed] [Google Scholar]
- 29.Wang, W. et al. U-shaped association between triglyceride glucose-body mass index with all-cause and cardiovascular mortality in US adults with osteoarthritis: evidence from NHANES 1999–2020. Sci. Rep.14 (1), 19959 (2024). [DOI] [PMC free article] [PubMed] [Google Scholar]
- 30.Zhang, J. et al. Prediction of major adverse Cardiovascular events by triglyceride glucose index in predominantly male patients with rheumatoid arthritis. Rev. Cardiovasc. Med.25 (1), 28 (2024). [DOI] [PMC free article] [PubMed] [Google Scholar]
- 31.Liang, D., Liu, C. & Wang, Y. The association between triglyceride-glucose index and the likelihood of cardiovascular disease in the U.S. population of older adults aged ≥ 60 years: a population-based study. Cardiovasc. Diabetol.23 (1), 151 (2024). [DOI] [PMC free article] [PubMed] [Google Scholar]
Associated Data
This section collects any data citations, data availability statements, or supplementary materials included in this article.
Data Availability Statement
The data generated in this study are available upon request from the corresponding author.