

Abstract
Purpose
In brain tumors, disruption of the blood–brain barrier (BBB) indicates malignancy. Clinical assessment is qualitative; quantitative evaluation is feasible using the K 2 leakage parameter from dynamic susceptibility contrast MRI. However, contrast agent–based techniques are limited in patients with renal dysfunction and insensitive to subtle impairments. Assessing water transport times across the BBB (T ex) by multi‐echo arterial spin labeling promises to detect BBB impairments noninvasively and potentially more sensitively.
We hypothesized that reduced T ex indicates impaired BBB. Furthermore, we assumed higher sensitivity for T ex than dynamic susceptibility contrast–based K 2, because arterial spin labeling uses water as a freely diffusible tracer.
Methods
We acquired 3T MRI data from 28 patients with intraparenchymal brain tumors (World Health Organization Grade 3 & 4 gliomas [n = 17] or metastases [n = 11]) and 17 age‐matched healthy controls. The protocol included multi‐echo and single‐echo Hadamard‐encoded arterial spin labeling, dynamic susceptibility contrast, and conventional clinical imaging. T ex was calculated using a T2‐dependent multi‐compartment model.
Areas of contrast‐enhancing tissue, edema, and normal‐appearing tissue were automatically segmented, and parameter values were compared across volumes of interest and between patients and healthy controls.
Results
T ex was significantly reduced (−20.3%) in contrast‐enhancing tissue compared with normal‐appearing gray matter and correlated well with |K 2| (r = −0.347). Compared with healthy controls, T ex was significantly lower in tumor patients' normal‐appearing gray matter (T ex,tumor = 0.141 ± 0.032 s vs. T ex,HC = 0.172 ± 0.036 s) and normal‐appearing white matter (T ex,tumor = 0.116 ± 0.015 vs. T ex,HC = 0.127 ± 0.017 s), whereas |K 2| did not differ significantly. Receiver operating characteristic analysis showed a larger area under the curve for T ex (0.784) than K 2 (0.604).
Conclusion
T ex is sensitive to pathophysiologically impaired BBB. It agrees with contrast agent–based K 2 in contrast‐enhancing tissue and indicates sensitivity to subtle leakage.
Keywords: arterial spin labeling (ASL), blood–brain barrier (BBB), brain tumor, dynamic susceptibility contrast (DSC), leakage, magnetic resonance imaging (MRI)
1. INTRODUCTION
The blood–brain barrier (BBB) is a selective semipermeable boundary that hinders potentially harmful substances from leaking into brain tissue. Its permeability is regulated primarily by a network of endothelial cells supported and regulated by pericytes and astrocyte end‐feet. 1 , 2 This intricate network ensures the selective permeability of the BBB. Impaired BBB has been reported for several pathologies, and severe damage is a well‐known hallmark of high‐grade brain tumors. 3 , 4 , 5
Routine clinical imaging relies on native T1‐weighted (T1w) and T2‐weighted (T2w) MRI as well as contrast agent (CA)–enhanced T1w MRI for qualitative assessment of brain tumors. Semi‐quantitative BBB assessment, however, is provided by dynamic contrast–enhanced (DCE) MRI and dynamic susceptibility contrast (DSC) MRI. Although DCE MRI is widely applied in various organs for assessing tumor malignancy and BBB leakage through the volume transfer constant k trans, it suffers from long scan times compared with DSC MRI. 6 In clinical MRI, DSC is used primarily for cerebral blood volume measurements, 7 but it also provides information on contrast leakage through the K 2 parameter, which was originally introduced for describing leakage effects in correcting DSC‐based cerebral blood volume. 8 , 9 , 10 K 2 describes two effects: K 2 > 0 indicates a dominant T1 shortening, and K 2 < 0 relates to T2* effects from susceptibility differences between intravascular and extravascular space. 7 , 9 , 11 Accordingly, higher absolute K 2 values are associated with increased CA leakage. 9 , 12 It has been shown that K 2 is sensitive to BBB leakage in brain tumors and correlates with DCE‐based k trans and tumor grade. 12 , 13 , 14 , 15 However, both CA‐based methods suffer from low sensitivity to subtle BBB impairments due to the comparably large size of gadolinium (Gd) compounds, which cannot pass the intact BBB. 16 , 17 In addition, Gd‐based CA is contraindicated in subjects with renal malfunction 18 , 19 , 20 and may deposit in the brain. 21 , 22 , 23
A noninvasive alternative to Gd‐based CA is using water as a freely diffusible tracer for the detection of BBB impairments. 2 , 24 , 25 , 26 , 27 It is expected to be sensitive to even subtle impairments due to the comparably small molecular size of water. 2 , 28 By using multi‐echo (multi‐TE) Hadamard‐encoded arterial spin labeling (ASL) 29 data, Mahroo et al. 25 recently proposed an extended T2‐based two‐compartment model, which allows the calculation of water exchange times, T ex. As lower T ex reflects faster water exchange, reduced T ex may indicate impaired BBB, with even greater sensitivity also to subtle impairments compared with DSC‐based assessment.
The present work aims to evaluate the applicability of this novel T ex mapping technique for detecting pathophysiologically impaired BBB. As a model pathology for impaired BBB, we prospectively acquired multi‐TE Hadamard‐encoded ASL data in a cohort of patients with high‐grade glioma and metastases. We hypothesize that T ex is reduced in areas with impaired BBB and that reduced T ex correlates with increased K 2 in areas with prominent leakage. This should hold true both for signed and absolute values of K 2. In addition, we hypothesize that T ex may yield sensitivity to subtle leakage due to the smaller size of water compared with Gd‐based tracers.
2. METHODS
2.1. BBB mapping
2.1.1. ASL‐based BBB mapping
ASL‐based BBB mapping is an extension of standard pseudo‐continuous ASL and relies on water as a freely diffusible endogenous tracer. By using a multi– TE readout, it measures the transverse relaxation rates of labeled spins, which are known to differ between the intravascular or extravascular compartments, thus allowing their separation based on T2 decay. 30
A two‐compartment model can be used to describe water exchange between intravascular and extravascular spaces. 27 Mahroo et al. 25 recently published an extended version of this two‐compartment model, which not only accounts for arterial transit time (i.e., the time it takes for the labeled spins to reach the imaged voxel) but also the intravoxel transit time. Intravoxel transit time is the time it takes the spins from arteries and arterioles to reach the capillary exchange site within a given voxel. Therefore, the total measured signal consists of three components 25 : The first component accounts for intravoxel transit time and assumes primarily T1 decay, whereas the second and third components account for differing T1 and T2 decay, depending on whether the spins are in the intravascular or extravascular spaces by introducing an exponential decay function rblex(t):
| (1) |
where T ex denotes the time it takes for the labeled water to cross the BBB after reaching the exchange site. In this work, T ex is investigated as a proxy measure for BBB integrity, where lower T ex is assumed to indicate BBB impairments. A detailed description of the model can be found in Refs. 25 and 27.
2.1.2. CA‐based leakage mapping
CA‐based leakage mapping relies on the application of an intravascular tracer, most commonly Gd compounds. Using DSC MRI, a leakage‐related parameter can be obtained when performing leakage correction for cerebral blood volume mapping. In general, different models exist for estimating this parameter. Detailed considerations about different methods can be found in Kluge et al. 9 We decided on the model proposed by Boxerman et al., 8 as it has shown high sensitivity to pathophysiologically impaired BBB and does not require manual selection of an arterial input function. 9 , 31 The technique assumes that BBB leakage contaminates the measured relaxation rate R2* by two different effects: T1 shortening due to direct contact of CA with extravascular water and T2* due to compartmentalization of CA in the extravascular extracellular space, thus resulting in overestimation of CA‐induced R2* changes. 7 , 11 Consequently, the measured ΔR2* in all voxels can be described as a sum of an intravascular and a leakage component, which depend on the average signal in nonenhancing voxels () as follows:
| (2) |
where K 1 accounts for susceptibility differences between non‐contaminated voxels, and K 2 reflects leakage effects. Therefore, K 2 > 0 indicates T1 shortening, whereas K 2 < 0 accounts for T2* exaggeration. 9 Both effects are captured in the absolute value of |K 2|. In contrast to T ex, increased leakage is captured by larger |K 2|.
2.2. Study population
MRI was prospectively acquired in 45 subjects, including 28 consecutive patients with intraparenchymal brain tumors (age = 64.5 ± 12.3 years, 12 female) and 17 age‐matched healthy controls (HC, age = 61.0 ± 14.9 years, 13 female). Data were acquired from clinical routine scans following surgery. Inclusion criteria were intraparenchymal glioma with World Health Organization Grade 3 and 4 (n = 17) or brain metastases (n = 11) and were histopathologically confirmed. Clinical and pathological information was collected from the local clinical information system. Four patients had to be excluded due to incomplete data acquisition or additional incidental findings. Detailed information about the included patients can be found in Table S1. The local institutional review board approved this prospective monocentric study as part of our local brain tumor biobank (#340/16S).
2.3. MRI data acquisition
Data were acquired on a 3T Elition X MRI scanner (Philips, Best, The Netherlands) using a 32‐channel head coil. A multicontrast imaging protocol was applied, including standard diagnostic imaging and ASL‐based BBB mapping. The clinical protocol also contained DSC MRI, which allowed the evaluation of CA leakage. Figure 1 gives a schematic overview of the MRI protocol and image analysis:
Standard diagnostic MRI consisted of a T1‐weighted (T1w) magnetization‐prepared rapid gradient‐echo sequence before (native) and after Gd‐CA application (voxel size = 1 × 1 × 1 mm3, TE = 4 ms, repetition time [TR] = 9 ms, inversion time = 761 ms, α = 8°, compressed sensitivity encoding [SENSE] acceleration factor = 2.9, 2:25 min, each) and a native T2w fluid‐attenuated inversion‐recovery (FLAIR) sequence (1 × 1 × 1 mm3, TE = 333 ms, TR = 4800 ms, inversion time = 1650 ms, compressed SENSE factor = 10, 3:55 min).
ASL‐BBB mapping used two Hadamard‐encoded ASL sequences 32 with differing labeling modules for probing relaxation rates. Both sequences had a similar segmented 3D gradient and spin‐echo read‐out module with a voxel size of 3.75 × 3.75 × 3.75 mm3 and 29 slices. Background suppression was used. Image acquisition was accelerated using a SENSE factor of 2.9 in anterior–posterior direction and SENSE = 1 in feet–head direction as well as an echo planar imaging factor of 23. First, a Hadamard 4 sequence was acquired, encoding three delays with bolus durations (BDs) of BD1 – BD3 = 700 ms and a post labeling delay of 900 ms. Each bolus was a readout with a multi‐TE train of n = 8 echoes with TE = 15 + n × 61 ms and a TR of 5000 ms. Acquiring one average resulted in a total scan duration of 6:20 min. Second, a Hadamard 8 sequence was acquired, encoding seven delays with BD1 = 1800 ms, BD2 = 600 ms, BD3 = 400 ms, BD4 – BD7 = 300 ms, and post labeling delay = 300 ms. A single TE of 16 ms was used for readout, and three averages were acquired with TR = 4683 ms, resulting in a total scan duration of 5:37 min. Additionally, a magnetization equilibrium M0 image was obtained for calibration using the same imaging parameters as the H8 except without background suppression or labeling. Multi‐TE Hadamard ASL functionalities were implemented as previously described. 33 , 34
CA‐based leakage mapping used clinical DSC MRI with a gradient‐echo echo planar imaging readout, voxel size of 2.33 × 2.33 × 4 mm3, and 25 slices (TE = 40 m, TR = 1602 ms, flip angle = 75°, SENSE factor = 2.9, echo planar imaging factor = 21, 70 dynamics, scan time = 1:56 min). For HCs, DSC was just acquired in a subsample of 8 subjects.
For six randomly selected subjects, we also acquired additional multi‐echo 3D gradient and spin‐echo data for T2 mapping, facilitating T ex calculation with voxelwise T2 instead of literature values (see Supporting Information S2).
FIGURE 1.
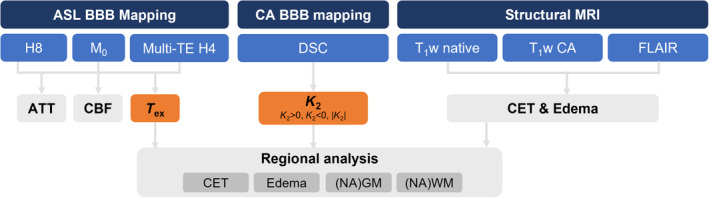
Overview of MRI protocol and image analysis. Arterial spin labeling (ASL)–based blood–brain barrier (BBB) mapping used two Hadamard‐encoded sequences. It was compared against contrast agent (CA)–based BBB mapping, which used dynamic susceptibility contrast (DSC) MRI. From concatenated single (Hadamard 8 [H8]) and multi‐echo (multi‐TE) Hadamard 4 data, arterial transit time (ATT), cerebral blood flow (CBF), and water exchange time (T ex) were fitted. ASL‐based T ex and DSC‐based K 2 were compared as proxies of BBB integrity. From structural MRI, contrast‐enhancing tissue (CET), edema, normal‐appearing gray matter (NAGM), and normal‐appearing white matter (NAWM) were derived. Note that the scheme does not reflect the acquisition order. DSC and CA‐enhanced T1‐weighted (T1w) MRI were always acquired at the end of the MRI protocol. FLAIR, fluid‐attenuated inversion recovery.
2.4. Image processing
Processing of all imaging data was performed with custom‐built MATLAB programs (Version 2021b; MathWorks, Natick, MA, USA) and Statistical Parametric Mapping 12 (SPM12; Wellcome Trust Center for Neuroimaging, London, UK). Additional software was used for some parameters, as described subsequently.
Anatomical MRI: Maps of normal‐appearing gray matter (NAGM), white matter (NAWM), and cerebral spinal fluid were segmented using SPM12 based on a magnetization‐prepared rapid gradient echo and thresholded at p > 0.8 for all subjects.
Based on native and CA‐enhanced T1w + CA, T2w fluid‐attenuated inversion‐recovery (FLAIR) images, automated tumor segmentation into contrast‐enhancing tissue (CET) and peritumoral edema was performed using an ensemble of segmentation algorithms as implemented in the publicly available BraTS toolkit. 35 The BraTS toolkit also performed the necessary image preprocessing (registration into the SRI24 36 atlas space using NiftyReg 37 and skullstripping with HD‐BET 38 ). For tumor patients, segmentation of NAGM and NAWM was performed using ANTs Atropos, excluding tumorous areas. 39 For CET, volumes of interest (VOIs) larger than 2 cm3 (as measured from CET segmentation) were evaluated (n = 8).
The described extended two‐compartment model 25 was implemented in FSL BASIL, 40 , 41 , 42 and concatenated data sets of multi‐TE Hadamard 4 and single‐TE Hadamard 8 data were used for modeling T ex according to Eq. (1) as well as cerebral blood flow (CBF) and arterial transit time. CBF and arterial transit time values can be found in Table S5. All parameter maps were coregistered to the T1w data.
For K 2 mapping, a similar processing was used as described in Kluge et al. 9 Masks of nonenhancing tissue were calculated by excluding CET and edema, which were subsequently used for determining the R2* change in nonleaky tissue (). K 2 was calculated by least‐squares fitting of Eq. (2), and K 2 maps were also coregistered onto T1w images. Importantly, leakage correction was performed not only for CET and edema but also for normal‐appearing tissue.
2.5. Statistical analysis
Statistical analyses were conducted both for different VOIs within the patient group and between patients and HCs. For patients, T ex within tumorous tissue (CET and edema) was compared against NAGM and NAWM to investigate whether impaired BBB results in reduced T ex, as hypothesized. Paired t‐tests were used to test for significant differences, and VOI mean values were visualized in each subject using paired scatterplots. Additionally, Pearson's correlation between T ex and CBF was evaluated within CET to test whether T ex carries additional information compared with conventionally evaluated CBF. Note that this was only possible for subjects showing sufficiently large CET VOIs (n = 8). Potential leakage in apparently healthy tissue was investigated by two different analyses: first by correlating T ex in tumorous tissue (CET and edema) and NAGM and NAWM, and second by comparing T ex in NAGM and NAWM between patients and age‐matched HCs. The statistical significance of potential differences was tested using unpaired t‐tests and visualized using whisker box plots. A similar analysis was performed for K 2, in which we considered |K 2| for combined T1 and T2* effects. This analysis was also conducted to evaluate whether T ex and |K 2| show different patterns across VOIs (e.g., T ex indicates leakage in a certain VOI, whereas |K 2| does not differ). Additionally, the correlation of T ex with |K 2| was investigated in CET, NAGM, and NAGM to test whether T ex is equivalent to CA‐based leakage. Note that anticorrelation is expected for |K 2|, as larger values indicate more leakage. Finally, we used receiver operating characteristic (ROC) analysis to additionally test the sensitivity of NAGM T ex versus NAGM |K 2| in distinguishing between patients and HCs. A higher area under the curve (AUC) in ROC plots indicates better parameter performance, with ideal curves forming rectangles, although, in practice, larger AUC values between 0.5 and 1 are considered indicative of superior performance.
Results are reported as mean values with standard deviations. Significance levels were set to p < 0.05 for all statistical tests.
3. RESULTS
In the patient group, ASL‐based T ex maps showed reduced T ex values in tumorous tissue, in concordance with increased K 2 in those areas. Images from a representative glioma patient (Figure 2, A1‐E1) showed rim‐like CA uptake in T1w (Figure 2, A1) and extensive fluid‐attenuated inversion‐recovery (FLAIR) edema (Figure 2, B1). This visually agrees well with a hypo‐intense region on the T ex map (Figure 2, D1), indicating lowered T ex in good agreement with increased |K 2| (Figure 2, E1), dominated by K 2 > 0. Similar effects are seen in a metastasis patient (Figure 2, A2‐E2); however, K 2 maps were dominated by K 2 < 0 in CET (Figure 2, E2). Additionally, masks of CET, edema, NAGM, NAWM, and cerebral spinal fluid are shown for both subjects (Figure 2, C1, C2) and are used for statistical analyses.
FIGURE 2.
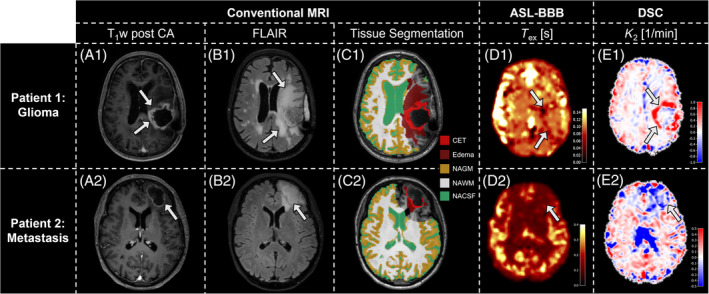
Exemplary data of 2 patients. T1‐weighted (T1w) post–contrast agent (CA; A), fluid‐attenuated inversion recovery (FLAIR; B), tissue masks (C), T ex (D), and K 2 (E) maps are shown. The glioma patient's rim‐like CA uptake (arrows, A1) and pronounced edema (arrows, B1 ) are segmented into masks of contrast‐enhancing tissue (CET, bright red) and edema (dark red; C1). Additionally, volumes of interest of normal‐appearing gray matter (NAGM), normal‐appearing white matter (NAWM), and normal‐appearing cerebral spinal fluid (NACSF) are shown. T ex is visibly reduced in the tumorous region (arrows, D1), resembling areas of increased K 2 (arrows, E1), dominated by K 2 > 0. The metastasis patient similarly shows a rim‐like CA uptake (arrow, A2) with edema (arrow, B2 ). Here, hypointense T ex regions (arrow, D2) agree with areas where K 2 < 0 (arrow, E2). ASL, arterial spin labeling; BBB, blood–brain barrier; DSC, dynamic susceptibility contrast.
Quantitative VOI analysis on group level revealed that in patients with CA enhancement, T ex was significantly reduced by 20.3% in CET (0.126 ± 0.022 s) when compared with NAGM (0.158 ± 0.040 s; Figure 3A) but similar compared with NAWM (0.123 ± 0.018 s, p = 0.793; Figure 3B). Similarly, we found 16.3% lower T ex in edema of all patients (0.118 ± 0.017 s) compared with NAGM (0.141 ± 0.032 s; Figure 3C), whereas NAWM had similar T ex (0.116 ± 0.015 s, p = 0.437; Figure 3D). No direct dependence of T ex on CBF was indicated by correlation analysis in CET (r = 0.039; Figure 4). In individual patients, T ex in tumorous tissue (CET and edema) showed strong and significant correlation with T ex in NAGM (r = 0.845; Figure 5A) and NAWM (r = 0.645; Figure 5B).
FIGURE 3.
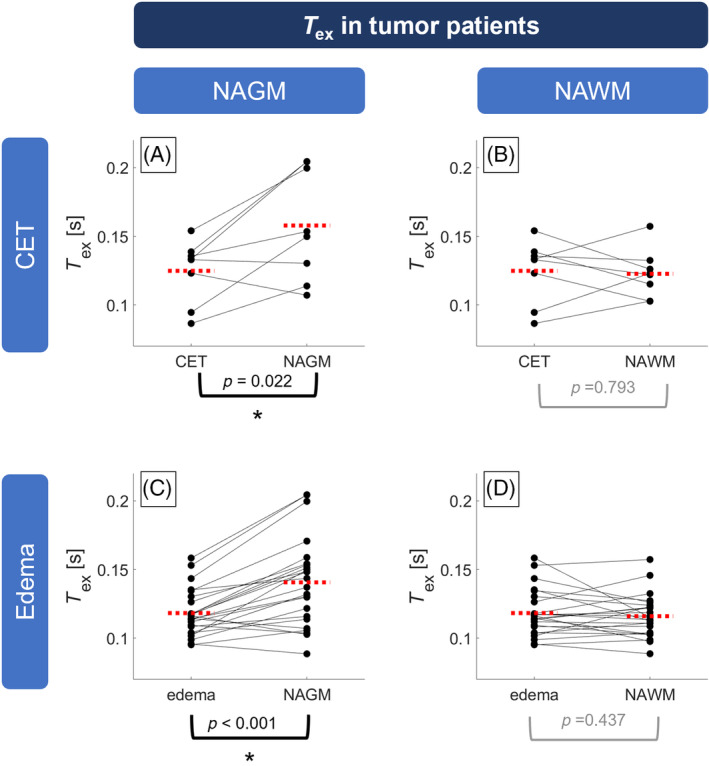
Paired scatterplots of T ex in brain tumor patients. T ex in contrast‐enhancing tissue (CET; A,B) was significantly reduced compared with normal‐appearing gray matter (NAGM; A) but similar to normal‐appearing white matter (NAWM; B). Similarly, T ex was reduced in edema (C,D) compared with NAGM (C) but similar to NAWM (D). Dots indicate volumes of interest (VOI) averages in single subjects and are connected between VOIs of the same patient with solid lines. Red dashed lines indicate group averages. Asterisks indicate statistically significant differences (p < 0.05). Note that CET was evaluated in 8 patients showing contrast agent leakage in VOIs larger than 2 cm3.
FIGURE 4.
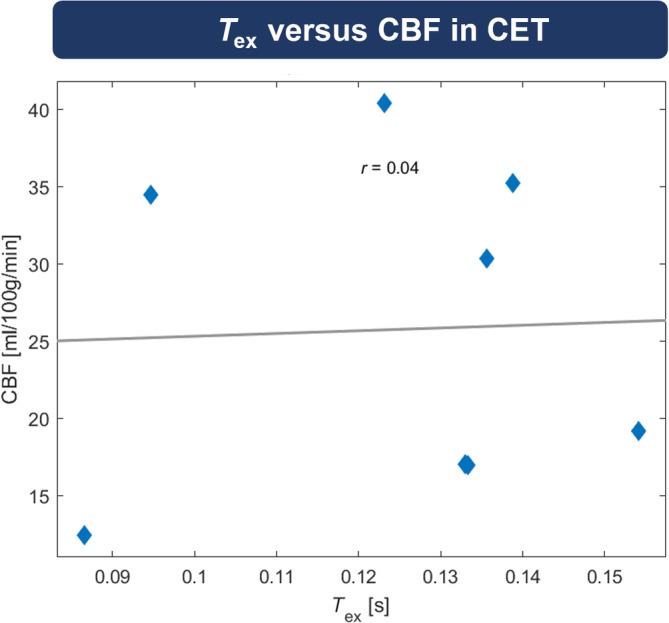
Correlation between T ex and cerebral blood flow (CBF) in contrast‐enhancing tissue (CET). Pearson correlation analysis did not indicate any relation between T ex and CBF in CET. Note that only 8 subjects showed CET volumes of interest larger than 2 mm3 and were therefore included in this analysis.
FIGURE 5.
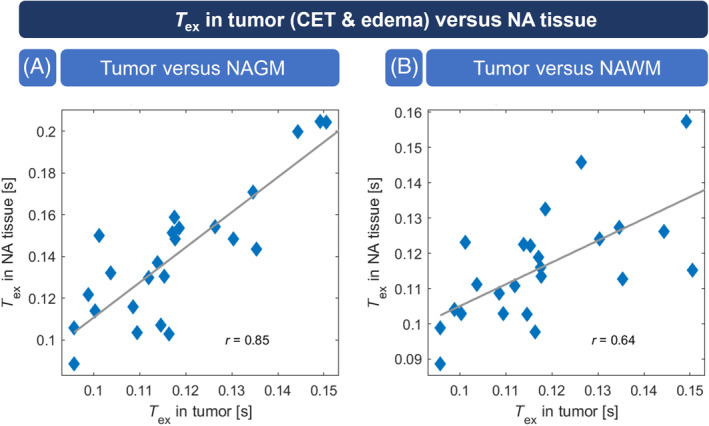
Correlation between T ex in tumor versus normal‐appearing gray matter (NAGM) and normal‐appearing white matter (NAWM). T ex in tumorous tissue (contrast‐enhancing tissue [CET] and edema) was significantly correlated with T ex in NAGM (A; p < 0.001) as well as NAWM (B; p < 0.001). NA, normal appearing.
When compared with HCs (gray matter [GM]: T ex,HC = 0.172 ± 0.036 s, white matter [WM]: T ex,HC = 0.127 ± 0.017 s), T ex was significantly lower for tumor patients not only in tumor tissue but also in NAGM and NAWM (GM: T ex,tumor = 0.141 ± 0.032 s, WM: T ex,tumor = 0.116 ± 0.015 s, Figure 6A).
FIGURE 6.
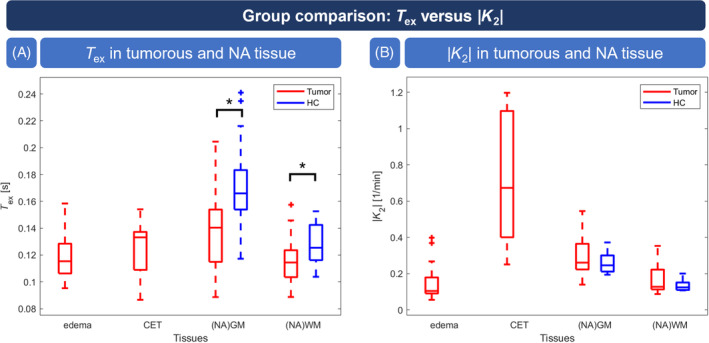
Group comparison of T ex and |K 2|. T ex in tumor tissue as well as normal‐appearing gray matter (NAGM) and normal‐appearing white matter (NAWM) in patients (red) was significantly reduced compared with healthy controls (HCs; blue) (A). |K 2| was significantly elevated in contrast‐enhancing tissue (CET) but not in edema or NAGM and NAWM compared with healthy subjects (B). Whisker plot boxes indicate 25th and 75th percentiles; median values are shown with a horizontal line; and outliers are visualized by crosses. Asterisks indicate statistically significant differences between patients and HCs (p < 0.05). Note that for HCs, |K 2| consists of data of 8 subjects.
CA‐based |K 2| values of tumor patients (Figure 6B) showed significantly increased |K 2| in CET (0.724 ± 0.370 1/min) compared with NAGM (0.302 ± 0.110 1/min) and NAWM (0.166 ± 0.072 1/min), whereas values in edema (0.148 ± 0.092 1/min) were similar to NAWM. In particular, we did not find significant differences in NAGM (p = 0.238) or NAWM (p = 0.175) compared with HC.
In CET, T ex and |K 2| were well correlated (r = −0.347; Figure 7A), whereas no correlation existed in NAGM (r = −0.061; Figure 7B) and NAWM (r = 0.069; Figure 7C). We found similar results for K 2 > 0 and K 2 < 0 (see Figure S4). In detail, T ex in CET was anticorrelated with K 2 > 0 (Figure S4D; r = −0.323) and correlated with K 2 < 0 (Figure S4G; r = 0.736). ROC analysis for discrimination of HC and patients (Figure 8) yielded a larger AUC for T ex (AUC = 0.784) compared with K 2 (AUC = 0.604).
FIGURE 7.
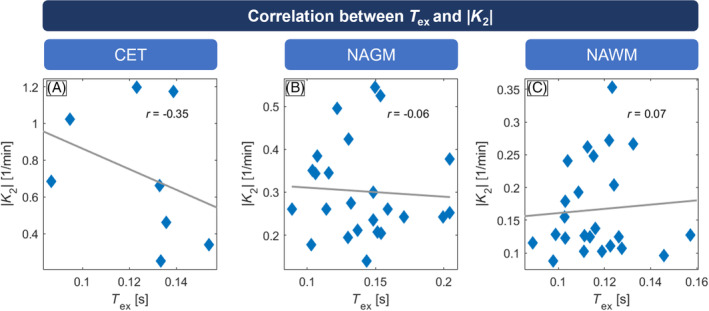
Pearson correlations between |K 2| and T ex in tumor patients. In contrast‐enhancing tissue (CET; A), larger |K 2| values correlated well with decreased T ex; no correlation was found in normal‐appearing gray matter (NAGM; B) or normal‐appearing white matter (NAWM; C). Note that CET evaluation could only be performed in 8 patients, which showed sufficiently large contrast agent leakage volumes of interest (> 2 cm3).
FIGURE 8.
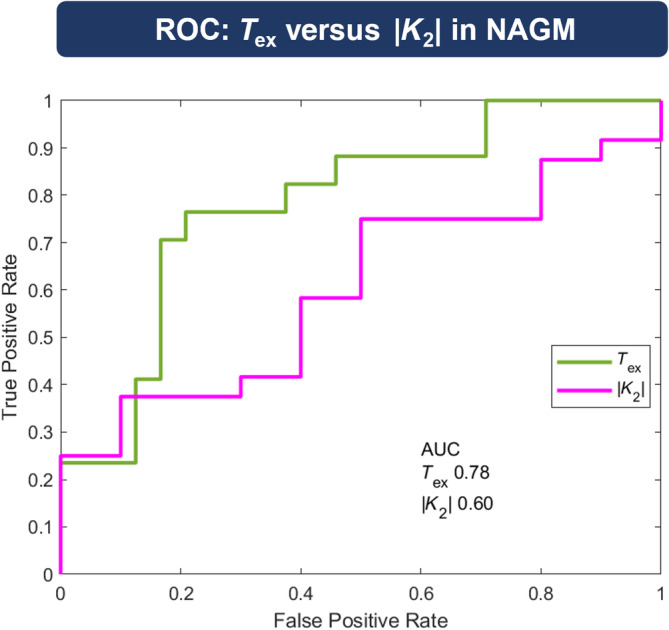
Receiver operating characteristic (ROC) analysis in normal‐appearing gray matter (NAGM). Performance of both leakage parameters to discriminate between healthy controls (HCs) and patients were tested by ROC analysis. True positive rates were drawn against false positive rates. T ex (green) yielded a larger area under the curve (AUC, 0.78) compared with |K 2| (purple, 0.60).
4. DISCUSSION
In this study, we investigate the potential of reduced T ex as a noninvasive indicator for BBB integrity in high‐grade brain tumor patients and compared these with measurements in healthy, age‐matched HCs. Additionally, we compared T ex against a conventional CA‐based leakage measure, specifically K 2 derived from DSC imaging. Our results revealed a reduction in T ex within brain tumors, mirroring the patterns observed in CA‐based K 2 measures. Additionally, T ex demonstrates promising sensitivity in VOI and ROC analyses, potentially surpassing that of conventional methods in detecting subtle T ex alterations in NAGM and NAWM.
4.1. T ex in CET
It is well known that high‐grade tumors and brain metastases induce BBB breakdown, leading to substantial CA leakage. This manifests as increased intensities in CA‐enhanced T1w images, serving as an established MRI correlate of tumor malignancy. 43 Therefore, we hypothesized that T ex would demonstrate faster exchange (lower T ex values) in regions with tumor‐induced increased vascular permeability if T ex was sensitive to impaired BBB function. Indeed, T ex was found to be reduced in CET, aligning with our hypothesis and supported by findings from a case report on water exchange time mapping in a Grade II oligodendroglioma 44 as well as DCE‐MRI studies, 4 , 45 , 46 , 47 demonstrating increased leakage in CET. Also, the insignificant correlation between CBF and T ex in CET is a potential indicator that T ex may offer complementary information to conventional perfusion imaging. Nevertheless, a certain relationship between T ex and CBF may be expected, especially as CBF is also known to be alternated in brain tumors. 48 , 49 , 50
As hypothesized, we also observed a good agreement between decreased T ex and increased |K 2| from DSC in CET. Importantly, |K 2| was significantly increased in CET, reflecting increased vascular permeability due to BBB breakdown in accordance with Refs. 9, 12, and 13. T ex also correlated well with |K 2| in CET regions (i.e., in areas with impaired BBB). Notably, when exploring this correlation separately for K 2 > 0 (T1‐related leakage effects) and K 2 < 0 (T2*‐related leakage effects), we observed a stronger correlation of T ex with K 2 < 0, which is assumed to be related to the compartmentalization of CA in the extravascular‐ extracellular space. 8 , 9 This might be due to a higher sensitivity of the Boxerman DSC‐leakage model to the K 2 < 0 effect. 9
4.2. T ex in nonenhancing tissue
Additionally, regarding leakage in CET, we observed reduced T ex in edema, which may partly represent physiologically lower BBB integrity. 3 Also, in edema, a high amount of free water is present, 51 which could be misinterpreted by the model as water crossing the BBB, yielding unrealistically short T ex. Regarding |K 2|, however, no leakage was detected in edema, and comparably low leakage in NAWM and NAGM, which agrees with previous studies. 9 The weak correlation of T ex and K 2 in NAGM and NAWM may indicate two findings: First, it reflects lower sensitivity of K 2 to subtle leakage in nonenhancing regions, as CA does not commonly leak in these regions. Second, it is important that T ex and K 2 reflect different leakage mechanisms: Although K 2 can only detect leakage if the BBB breaks down (i.e., in the pathologic brain), water exchange through the BBB is a constant process, which may just be enhanced in pathologic conditions. Physiologically, reduced T ex in nonenhancing tissue may reflect two different mechanisms: either tight junction disruption or AQP4 channel alterations. Evidence from the literature suggests that disruptions in tight junctions are more common in peritumoral regions, which would be indicated by reduced T ex. 52
4.3. Sensitivity of T ex for subtle BBB impairments
Our results indicate that ASL‐based T ex may be especially sensitive to subtle BBB impairments. This can be inferred from several findings of our study. First, reduced T ex in edema may correctly point to impaired BBB, as it has been suggested that edema formation follows the structural disintegration of the endothelial BBB. 52 Following that argumentation, K 2 may lack sensitivity, as Gd compounds cannot directly leak through the BBB due to comparably minor disruptions of the BBB. Second, T ex in tumor correlated significantly with T ex in normal‐appearing tissue, indicating that subjects with more severely impaired BBB may also already exhibit malfunction in BBB's barrier functionality in normal‐appearing tissue. Although this correlation alone should be interpreted cautiously, as values are derived from the same parameter maps, we also observed significantly reduced T ex in patients' NAGM and NAWM compared with HCs, in contrast to |K 2|, where differences were not significant. As both groups were age‐matched, age‐related T ex decrease 53 is unlikely to explain the effect. Instead, the reduced T ex could be attributed to a subtle invasion of tumorous cells in normal‐appearing tissue, which has been demonstrated in histology studies. 54 Additionally, most of the patients in our study cohort underwent radiation therapy, which may additionally reduce BBB integrity. Nevertheless, those subtle alternations might be yet undetectable by conventional MRI or K 2, especially as sensitivity—even of DCE ‐ to subtle leakage is debated. 17 Taken together, our results indicate that ASL‐BBB may exhibit superior sensitivity, as initially hypothesized. This was not only shown by group comparison but also further validated by ROC analysis, where T ex outperformed |K 2| in separating patients from control subjects based on normal‐appearing tissue permeability measurements.
This enhanced sensitivity of ASL‐BBB can be attributed to the different tracer kinetics of freely diffusible tracers, such as water, compared with intravascular Gd‐based CAs. This is primarily due to the relatively small size of water molecules compared with larger Gd compounds, 2 , 25 , 26 , 28 but it might also be because the tracer routes can be different. For water, more routes are available compared with Gd, such as trans‐endothelial transport through aquaporin proteins. 2 Although we observed good sensitivity to BBB integrity in tumorous tissue, caution must be exercised in directly linking reduced T ex in normal‐appearing tissue to tumor pathology, given that our investigation involved a collective of postoperative relapsed tumors and metastases, where treatment such as radiation therapy may also have contributed to BBB damage. Nevertheless, these effects should underlie both DSC and ASL measurements. Therefore, despite the potential sources of reduced T ex being debatable, its superior sensitivity renders ASL‐based T ex a promising marker for tumor progression monitoring and therapy planning, where the intactness of the BBB is often a key question. 55 , 56
4.4. Limitations
The findings of this study are subject to a few limitations. First, the study included a heterogeneous cohort consisting of relapsed brain tumors and metastases, which complicates drawing detailed conclusions regarding the correlation between T ex and pathogenesis. Also, only 8 subjects showed CET; therefore, we decided to evaluate edema for all subjects and CET separately. However, the primary focus of our study was to demonstrate the sensitivity of T ex for pathophysiologically impaired BBB, a point adequately supported by the results described previously. Second, regarding CA‐based leakage measures, k trans from DCE‐MRI could be more directly interpreted, as it represents a volume transfer constant. However, DCE is not established in clinical brain MRI protocols due to its relatively long scan times. Moreover, existing literature suggests that K 2 provides a similar informative value as k trans , thus serving as a reliable measure of BBB leakage. 13 , 14 , 15 Nevertheless, the choice of the DSC‐leakage model also does affect the resulting K 2 values; therefore, their absolute values should be interpreted with care. In particular, the model by Boxerman et al. 8 has shown to be potentially biased by mean transit time and may overestimate T2* effects; however, it is more reliable for clinical DSC data. 9 , 31 Additionally, ASL MRI is known to exhibit low signal and consequently lower sensitivity in lower perfused tissue, especially because we used a multi‐TE readout. This may explain the inability to clearly differentiate NAWM from tumorous tissue using T ex. To address this issue, we acquired a full echo train with every Hadamard encoding block. Finally, the extended two‐compartment model we used for T ex mapping bears several limitations. Because it relies on different T2 relaxation times between spins in intravascular space and tissue, T ex may be confounded when T2 is substantially increased in tumorous tissue. Therefore, in a subsample of 6 patients, we acquired additional multi‐echo 3D gradient and spin‐echo data (see Table S2). As expected, T2 in tumor was increased, although still about 30% lower than the used literature value of blood T2 of 165 ms. 30 , 57 Also, larger tissue T2 resulted in similar or marginally lower T ex; thus, the contrast between tumor and normal‐appearing tissue is even increased, which is in agreement with recent work 25 , 58 , 59 (see Table S2). In addition, T ex may be compromised by changes in capillary volume. 2 To at least reduce this dependency, all model parameters including T ex and CBF are fit in the same step, therefore partly accounting for blood flow and volume changes. Also, despite these limitations, ASL could still detect group differences between patients and HCs in NAGM and NAWM, indicating sufficient signal and sensitivity at least on the group level, also in NAWM.
5. CONCLUSIONS
ASL‐based T ex demonstrates sensitivity to pathophysiological changes in BBB integrity and shows good agreement with DSC‐based K 2, particularly in CET regions. Furthermore, the observed decrease in T ex in NA tissue indicates superior sensitivity to subtle BBB impairments, potentially offering avenues for advanced tumor therapy management. Consequently, noninvasive T ex measurement could also contribute to the understanding of BBB dysfunction in various other pathologies characterized by subtle BBB leakage, such as Alzheimer's and Parkinson's disease.
CONFLICT OF INTEREST
Stephan Kaczmarz is an employee of Philips GmbH Market DACH. Matthias J.P. van Osch and Lena Václavů receive research support from Philips.
Supporting information
Data S1. Supporting information.
ACKNOWLEDGMENTS
We want to acknowledge support from Lena Schmitzer for assisting with numerous questions regarding tumor pathophysiology. We also want to acknowledge the following grant support: This work was supported by Ev. Studienwerk Villigst (personal grant to G.H.), Deutsche Forschungsgemeinschaft (395030489 grant to C.P. and 547163214 grant to S.K.). The DEBBIE project (DEveloping a non‐invasive Biomarker for early BBB breakdown in Alzheimer's disease, funding for MG and AM) has received funding from the European Union's Horizon 2020 research and innovation programme under grant agreement No. 825664. It is supported through the following funding organizations under the aegis of the EU Joint Program for Neurodegenerative Disease Research (JPND2020‐568‐106)–FWO in Belgium, Canadian Institutes of Health Research (CIHR) in Canada, BMBF (01ED2107) in Germany, the Research Council of Norway, the Netherlands Organisation for health Research and Development and Alzheimer Nederland, The Scientific and Technological Research Council of Turkey (TUBITAK; #121N030) in Turkey. M.J.Pv.O. and L.V. received funding from MODEM, a Dutch national consortium part of the Dementia Research Program of ZonMw (grant no. 10510032120006) supported by the National Dementia Strategy 2021–2030 of the Dutch Ministry of Health, Welfare and Sport and from Alzheimer Nederland (#WE.30‐2022‐04) supporting MODEM research. M.J.Pv.O. and L.V. also received research support from Philips. L.V. is supported by the Dutch Research Council (NWO) Talent Programme Veni (Project No. 20212). Open Access funding enabled and organized by Projekt DEAL.
Hoffmann G, Preibisch C, Günther M, et al. Noninvasive blood–brain barrier integrity mapping in patients with high‐grade glioma and metastasis by multi–echo time–encoded arterial spin labeling. Magn Reson Med. 2025;93(5):2086‐2098. doi: 10.1002/mrm.30415
Benedikt Wiestler and Stephan Kaczmarz contributed equally to this work.
Correction added after online 20th January 2025. Due to a publisher's error, the Funding Information and Acknowledgments have been corrected.
REFERENCES
- 1. Abbott NJ, Ronnback L, Hansson E. Astrocyte‐endothelial interactions at the blood‐brain barrier. Nat Rev Neurosci. 2006;7:41‐53. [DOI] [PubMed] [Google Scholar]
- 2. Dickie BR, Parker GJM, Parkes LM. Measuring water exchange across the blood‐brain barrier using MRI. Prog Nucl Magn Reson Spectrosc. 2020;116:19‐39. [DOI] [PubMed] [Google Scholar]
- 3. Jain RK, Di Tomaso E, Duda DG, Loeffler JS, Sorensen AG, Batchelor TT. Angiogenesis in brain tumours. Nat Rev Neurosci. 2007;8:610‐622. [DOI] [PubMed] [Google Scholar]
- 4. Heye AK, Culling RD, Hernandez MDV, Thrippleton MJ, Wardlaw JM. Assessment of blood–brain barrier disruption using dynamic contrast‐enhanced MRI. A systematic review. Neuroimage Clin. 2014;6:262‐274. [DOI] [PMC free article] [PubMed] [Google Scholar]
- 5. Wolburg H, Noell S, Fallier‐Becker P, Mack AF, Wolburg‐Buchholz K. The disturbed blood–brain barrier in human glioblastoma. Mol Aspects Med. 2012;33:579‐589. [DOI] [PubMed] [Google Scholar]
- 6. Li X, Huang W, Holmes JH. Dynamic contrast‐enhanced (DCE) MRI. Magn Reson Imaging Clin N Am. 2024;32:47‐61. [DOI] [PubMed] [Google Scholar]
- 7. Boxerman JL, Quarles CC, Hu LS, et al., Jumpstarting Brain Tumor Drug Development Coalition Imaging Standardization Steering Committee . Consensus recommendations for a dynamic susceptibility contrast MRI protocol for use in high‐grade gliomas. Neuro Oncol. 2020;22:1262‐1275. [DOI] [PMC free article] [PubMed] [Google Scholar]
- 8. Boxerman JL, Schmainda KM, Weisskoff RM. Relative cerebral blood volume maps corrected for contrast agent extravasation significantly correlate with glioma tumor grade, whereas uncorrected maps do not. AJNR Am J Neuroradiol. 2006;27:859‐867. [PMC free article] [PubMed] [Google Scholar]
- 9. Kluge A, Lukas M, Toth V, Pyka T, Zimmer C, Preibisch C. Analysis of three leakage‐correction methods for DSC‐based measurement of relative cerebral blood volume with respect to heterogeneity in human gliomas. Magn Reson Imaging. 2016;34:410‐421. [DOI] [PubMed] [Google Scholar]
- 10. Bjornerud A, Sorensen AG, Mouridsen K, Emblem KE. T1‐ and T2*‐dominant extravasation correction in DSC‐MRI: part I–theoretical considerations and implications for assessment of tumor hemodynamic properties. J Cereb Blood Flow Metab. 2011;31:2041‐2053. [DOI] [PMC free article] [PubMed] [Google Scholar]
- 11. Quarles CC, Gochberg DF, Gore JC, Yankeelov TE. A theoretical framework to model DSC‐MRI data acquired in the presence of contrast agent extravasation. Phys Med Biol. 2009;54:5749‐5766. [DOI] [PMC free article] [PubMed] [Google Scholar]
- 12. Lee JY, Bjornerud A, Park JE, Lee BE, Kim JH, Kim HS. Permeability measurement using dynamic susceptibility contrast magnetic resonance imaging enhances differential diagnosis of primary central nervous system lymphoma from glioblastoma. Eur Radiol. 2019;29:5539‐5548. [DOI] [PubMed] [Google Scholar]
- 13. Bonekamp D, Deike K, Wiestler B, et al. Association of overall survival in patients with newly diagnosed glioblastoma with contrast‐enhanced perfusion MRI: comparison of intraindividually matched T1‐and T2*‐based bolus techniques. J Magn Reson Imaging. 2015;42:87‐96. [DOI] [PubMed] [Google Scholar]
- 14. Taoka T, Kawai H, Nakane T, et al. Application of histogram analysis for the evaluation of vascular permeability in glioma by the K2 parameter obtained with the dynamic susceptibility contrast method: comparisons with Ktrans obtained with the dynamic contrast enhance method and cerebral blood volume. Magn Reson Imaging. 2016;34:896‐901. [DOI] [PubMed] [Google Scholar]
- 15. Quarles CC, Gore JC, Xu L, Yankeelov TE. Comparison of dual‐echo DSC‐MRI‐ and DCE‐MRI‐derived contrast agent kinetic parameters. Magn Reson Imaging. 2012;30:944‐953. [DOI] [PMC free article] [PubMed] [Google Scholar]
- 16. Elschot EP, Backes WH, de Jong JJA, et al. Assessment of the clinical feasibility of detecting subtle blood‐brain barrier leakage in cerebral small vessel disease using dynamic susceptibility contrast MRI. Magn Reson Imaging. 2023;102:55‐61. [DOI] [PubMed] [Google Scholar]
- 17. Armitage PA, Farrall AJ, Carpenter TK, Doubal FN, Wardlaw JM. Use of dynamic contrast‐enhanced MRI to measure subtle blood–brain barrier abnormalities. Magn Reson Imaging. 2011;29:305‐314. [DOI] [PMC free article] [PubMed] [Google Scholar]
- 18. Marckmann P, Skov L, Rossen K, et al. Nephrogenic systemic fibrosis: suspected causative role of gadodiamide used for contrast‐enhanced magnetic resonance imaging. J Am Soc Nephrol. 2006;17:2359‐2362. [DOI] [PubMed] [Google Scholar]
- 19. Broome DR, Girguis MS, Baron PW, Cottrell AC, Kjellin I, Kirk GA. Gadodiamide‐associated nephrogenic systemic fibrosis: why radiologists should be concerned. Am J Roentgenol. 2007;188:586‐592. [DOI] [PubMed] [Google Scholar]
- 20. Sadowski EA, Bennett LK, Chan MR, et al. Nephrogenic systemic fibrosis: risk factors and incidence estimation. Radiology. 2007;243:148‐157. [DOI] [PubMed] [Google Scholar]
- 21. Gulani V, Calamante F, Shellock FG, Kanal E, Reeder SB. Gadolinium deposition in the brain: summary of evidence and recommendations. Lancet Neurol. 2017;16:564‐570. [DOI] [PubMed] [Google Scholar]
- 22. Harvey HB, Gowda V, Cheng G. Gadolinium deposition disease: a new risk management threat. J Am Coll Radiol. 2020;17:546‐550. [DOI] [PubMed] [Google Scholar]
- 23. Semelka RC, Ramalho J, Vakharia A, et al. Gadolinium deposition disease: initial description of a disease that has been around for a while. Magn Reson Imaging. 2016;34:1383‐1390. [DOI] [PubMed] [Google Scholar]
- 24. Lin ZX, Li Y, Su P, et al. Non‐contrast MR imaging of blood‐brain barrier permeability to water. Magn Reson Med. 2018;80:1507‐1520. [DOI] [PMC free article] [PubMed] [Google Scholar]
- 25. Mahroo A, Buck MA, Huber J, et al. Robust multi‐TE ASL‐based blood‐brain barrier integrity measurements. Front Neurosci. 2021;15:719676. [DOI] [PMC free article] [PubMed] [Google Scholar]
- 26. Petitclerc L, Schmid S, Hirschler L, van Osch MJP. Combining T2 measurements and crusher gradients into a single ASL sequence for comparison of the measurement of water transport across the blood–brain barrier. Magn Reson Med. 2021;85:2649‐2660. [DOI] [PMC free article] [PubMed] [Google Scholar]
- 27. Gregori J, Schuff N, Kern R, Gunther M. T2‐based arterial spin labeling measurements of blood to tissue water transfer in human brain. J Magn Reson Imaging. 2013;37:332‐342. [DOI] [PMC free article] [PubMed] [Google Scholar]
- 28. Shao X, Jann K, Ma SJ, et al. Comparison between blood‐brain barrier water exchange rate and permeability to gadolinium‐based contrast agent in an elderly cohort. Front Neurosci. 2020;14:571480. [DOI] [PMC free article] [PubMed] [Google Scholar]
- 29. Günther M. Highly efficient accelerated acquisition of perfusion inflow series by cycled arterial spin labeling. In: Proceedings of the 15th Annual Meeting of ISMRM, Berlin, Germany, 2007.
- 30. Liu P, Uh J, Lu H. Determination of spin compartment in arterial spin labeling MRI. Magn Reson Med. 2011;65:120‐127. [DOI] [PMC free article] [PubMed] [Google Scholar]
- 31. Provenzale JM, Wang GR, Brenner T, Petrella JR, Sorensen AG. Comparison of permeability in high‐grade and low‐grade brain tumors using dynamic susceptibility contrast MR imaging. AJR Am J Roentgenol. 2002;178:711‐716. [DOI] [PubMed] [Google Scholar]
- 32. von Samson‐Himmelstjerna F, Madai VI, Sobesky J, Guenther M. Walsh‐ordered hadamard time‐encoded pseudocontinuous ASL (WH pCASL). Magn Reson Med. 2016;76:1814‐1824. [DOI] [PubMed] [Google Scholar]
- 33. Teeuwisse WM, Schmid S, Ghariq E, Veer IM, Van Osch MJ. Time‐encoded pseudocontinuous arterial spin labeling: basic properties and timing strategies for human applications. Magn Reson Med. 2014;72:1712‐1722. [DOI] [PubMed] [Google Scholar]
- 34. Petitclerc L, Hirschler L, Wells JA, et al. Ultra‐long‐TE arterial spin labeling reveals rapid and brain‐wide blood‐to‐CSF water transport in humans. Neuroimage. 2021;245:118755. [DOI] [PMC free article] [PubMed] [Google Scholar]
- 35. Kofler F, Berger C, Waldmannstetter D, et al. BraTS toolkit: translating BraTS brain tumor segmentation algorithms into clinical and scientific practice. Front Neurosci. 2020;14:125. [DOI] [PMC free article] [PubMed] [Google Scholar]
- 36. Rohlfing T, Zahr NM, Sullivan EV, Pfefferbaum A. The SRI24 multichannel atlas of normal adult human brain structure. Hum Brain Mapp. 2010;31:798‐819. [DOI] [PMC free article] [PubMed] [Google Scholar]
- 37. Modat M, Cash DM, Daga P, Winston GP, Duncan JS, Ourselin S. Global image registration using a symmetric block‐matching approach. J Med Imaging. 2014;1:024003. [DOI] [PMC free article] [PubMed] [Google Scholar]
- 38. Isensee F, Schell M, Pflueger I, et al. Automated brain extraction of multisequence MRI using artificial neural networks. Hum Brain Mapp. 2019;40:4952‐4964. [DOI] [PMC free article] [PubMed] [Google Scholar]
- 39. Avants BB, Tustison NJ, Wu J, Cook PA, Gee JC. An open source multivariate framework for n‐tissue segmentation with evaluation on public data. Neuroinformatics. 2011;9:381‐400. [DOI] [PMC free article] [PubMed] [Google Scholar]
- 40. Woolrich MW, Jbabdi S, Patenaude B, et al. Bayesian analysis of neuroimaging data in FSL. Neuroimage. 2009;45:S173‐S186. [DOI] [PubMed] [Google Scholar]
- 41. Chappell MA, Groves AR, Whitcher B, Woolrich MW. Variational Bayesian inference for a nonlinear forward model. IEEE Trans Signal Process. 2008;57:223‐236. [Google Scholar]
- 42. Groves AR, Chappell MA, Woolrich MW. Combined spatial and non‐spatial prior for inference on MRI time‐series. Neuroimage. 2009;45:795‐809. [DOI] [PubMed] [Google Scholar]
- 43. Asari S, Makabe T, Katayama S, Itoh T, Tsuchida S, Ohmoto T. Assessment of the pathological grade of astrocytic gliomas using an MRI score. Neuroradiology. 1994;36:308‐310. [DOI] [PubMed] [Google Scholar]
- 44. Wang J, Fernandez‐Seara MA, Wang S, St. Lawrence KS. When perfusion meets diffusion: in vivo measurement of water permeability in human brain. J Cereb Blood Flow Metab. 2007;27:839‐849. [DOI] [PubMed] [Google Scholar]
- 45. Ludemann L, Warmuth C, Plotkin M, et al. Brain tumor perfusion: comparison of dynamic contrast enhanced magnetic resonance imaging using T1, T2, and T2* contrast, pulsed arterial spin labeling, and H2 15O positron emission tomography. Eur J Radiol. 2009;70:465‐474. [DOI] [PubMed] [Google Scholar]
- 46. Keil VC, Gielen GH, Pintea B, et al. DCE‐MRI in glioma, infiltration zone and healthy brain to assess angiogenesis: a biopsy study. Clin Neuroradiol. 2021;31:1049‐1058. [DOI] [PMC free article] [PubMed] [Google Scholar]
- 47. Gao X, Yue Q, Liu Y, et al. Image‐guided chemotherapy with specifically tuned blood brain barrier permeability in glioma margins. Theranostics. 2018;8:3126‐3137. [DOI] [PMC free article] [PubMed] [Google Scholar]
- 48. Hales PW, Phipps KP, Kaur R, Clark CA. A two‐stage model for in vivo assessment of brain tumor perfusion and abnormal vascular structure using arterial spin labeling. PLoS One. 2013;8:e75717. [DOI] [PMC free article] [PubMed] [Google Scholar]
- 49. van Grinsven EE, Guichelaar J, Philippens ME, Siero JC, Bhogal AA. Hemodynamic imaging parameters in brain metastases patients—agreement between multi‐delay ASL and hypercapnic BOLD. J Cereb Blood Flow Metab. 2023;43:2072‐2084. [DOI] [PMC free article] [PubMed] [Google Scholar]
- 50. White CM, Pope WB, Zaw T, et al. Regional and voxel‐wise comparisons of blood flow measurements between dynamic susceptibility contrast magnetic resonance imaging (DSC‐MRI) and arterial spin labeling (ASL) in brain tumors. J Neuroimaging. 2014;24:23‐30. [DOI] [PubMed] [Google Scholar]
- 51. Kaal ECA, Vecht CJ. The management of brain edema in brain tumors. Curr Opin Oncol. 2004;16:593‐600. [DOI] [PubMed] [Google Scholar]
- 52. Solar P, Hendrych M, Barak M, Valekova H, Hermanova M, Jancalek R. Blood‐brain barrier alterations and edema formation in different brain mass lesions. Front Cell Neurosci. 2022;16:922181. [DOI] [PMC free article] [PubMed] [Google Scholar]
- 53. Mahroo A, Konstandin S, Gunther M. Blood‐brain barrier permeability to water measured using multiple echo time arterial spin labeling MRI in the aging human brain. J Magn Reson Imaging. 2024;59:1269‐1282. [DOI] [PubMed] [Google Scholar]
- 54. Sahm F, Capper D, Jeibmann A, et al. Addressing diffuse glioma as a systemic brain disease with single‐cell analysis. Arch Neurol. 2012;69:523‐526. [DOI] [PubMed] [Google Scholar]
- 55. Dubois LG, Campanati L, Righy C, et al. Gliomas and the vascular fragility of the blood brain barrier. Front Cell Neurosci. 2014;8:418. [DOI] [PMC free article] [PubMed] [Google Scholar]
- 56. Agarwal S, Sane R, Oberoi R, Ohlfest JR, Elmquist WF. Delivery of molecularly targeted therapy to malignant glioma, a disease of the whole brain. Expert Rev Mol Med. 2011;13:e17. [DOI] [PMC free article] [PubMed] [Google Scholar]
- 57. Lee T, Stainsby J, Hong J, Han E, Brittain J, Wright G. Blood relaxation properties at 3T—effects of blood oxygen saturation. In: Proceedings of the 11th Annual Meeting of ISMRM, Toronto, Canada, 2003.
- 58. Cetin AI, Turhan G, Padrela B, et al. Quantification of BBB Permeability in glioma using ASL with tissue specific T2 values. In: Proceedings of the Annual Meeting of ISMRM, Singapore, 2024.
- 59. Cetin AI, Turhan G, Padrela B, et al. Tissue‐specific T2 BBB‐ASL in meningiomas. In: Proceedings of the 40th Annual Meeting of ESMRMB, Barcelona, Spain, 2024.
Associated Data
This section collects any data citations, data availability statements, or supplementary materials included in this article.
Supplementary Materials
Data S1. Supporting information.